Hmong vs Immigrants from Guyana Disability Age 35 to 64

COMPARE

Hmong
Race
Ancestry
AfghanAfricanAlaska NativeAlaskan AthabascanAlbanianAleutAlsatianAmericanApacheArabArapahoArgentineanArmenianAssyrian/Chaldean/SyriacAustralianAustrianBahamianBangladeshiBarbadianBasqueBelgianBelizeanBermudanBhutaneseBlackfeetBolivianBrazilianBritishBritish West IndianBulgarianBurmeseCajunCambodianCanadianCape VerdeanCarpatho RusynCelticCentral AmericanCentral American IndianCherokeeCheyenneChickasawChileanChineseChippewaChoctawColombianColvilleComancheCosta RicanCreeCreekCroatianCrowCubanCypriotCzechCzechoslovakianDanishDelawareDominicanDutchDutch West IndianEastern EuropeanEcuadorianEgyptianEnglishEstonianEthiopianEuropeanFijianFilipinoFinnishFrenchFrench American IndianFrench CanadianGermanGerman RussianGhanaianGreekGuamanian/ChamorroGuatemalanGuyaneseHaitianHmongHonduranHopiHoumaHungarianIcelanderIndian (Asian)IndonesianInupiatIranianIraqiIrishIroquoisIsraeliItalianJamaicanJapaneseJordanianKenyanKiowaKoreanLaotianLatvianLebaneseLiberianLithuanianLumbeeLuxembourgerMacedonianMalaysianMalteseMarshalleseMenomineeMexicanMexican American IndianMongolianMoroccanNative HawaiianNavajoNepaleseNew ZealanderNicaraguanNigerianNorthern EuropeanNorwegianOkinawanOsageOttawaPaiutePakistaniPalestinianPanamanianParaguayanPennsylvania GermanPeruvianPimaPolishPortuguesePotawatomiPuebloPuerto RicanPuget Sound SalishRomanianRussianSalvadoranSamoanScandinavianScotch-IrishScottishSeminoleSenegaleseSerbianShoshoneSierra LeoneanSiouxSlavicSlovakSloveneSomaliSouth AfricanSouth AmericanSouth American IndianSoviet UnionSpaniardSpanishSpanish AmericanSpanish American IndianSri LankanSubsaharan AfricanSudaneseSwedishSwissSyrianTaiwaneseThaiTlingit-HaidaTohono O'OdhamTonganTrinidadian and TobagonianTsimshianTurkishU.S. Virgin IslanderUgandanUkrainianUruguayanUteVenezuelanVietnameseWelshWest IndianYakamaYaquiYugoslavianYumanYup'ikZimbabwean
Immigration
NonimmigrantsImmigrantsAfghanistanAfricaAlbaniaArgentinaArmeniaAsiaAustraliaAustriaBahamasBangladeshBarbadosBelarusBelgiumBelizeBoliviaBosnia and HerzegovinaBrazilBulgariaBurma/MyanmarCabo VerdeCambodiaCameroonCanadaCaribbeanCentral AmericaChileChinaColombiaCongoCosta RicaCroatiaCubaCzechoslovakiaDenmarkDominicaDominican RepublicEastern AfricaEastern AsiaEastern EuropeEcuadorEgyptEl SalvadorEnglandEritreaEthiopiaEuropeFijiFranceGermanyGhanaGreeceGrenadaGuatemalaHaitiHondurasHong KongHungaryIndiaIndonesiaIranIraqIrelandIsraelItalyJamaicaJapanJordanKazakhstanKenyaKoreaKuwaitLaosLatin AmericaLatviaLebanonLiberiaLithuaniaMalaysiaMexicoMicronesiaMiddle AfricaMoldovaMoroccoNepalNetherlandsNicaraguaNigeriaNorth AmericaNorth MacedoniaNorthern AfricaNorthern EuropeNorwayOceaniaPakistanPanamaPeruPhilippinesPolandPortugalRomaniaRussiaSaudi ArabiaScotlandSenegalSerbiaSierra LeoneSingaporeSomaliaSouth AfricaSouth AmericaSouth Central AsiaSouth Eastern AsiaSouthern EuropeSpainSri LankaSt. Vincent and the GrenadinesSudanSwedenSwitzerlandSyriaTaiwanThailandTrinidad and TobagoTurkeyUgandaUkraineUruguayUzbekistanVenezuelaVietnamWest IndiesWestern AfricaWestern AsiaWestern EuropeYemenZaireZimbabweAzores
Immigrants from Guyana
Race
Ancestry
AfghanAfricanAlaska NativeAlaskan AthabascanAlbanianAleutAlsatianAmericanApacheArabArapahoArgentineanArmenianAssyrian/Chaldean/SyriacAustralianAustrianBahamianBangladeshiBarbadianBasqueBelgianBelizeanBermudanBhutaneseBlackfeetBolivianBrazilianBritishBritish West IndianBulgarianBurmeseCajunCambodianCanadianCape VerdeanCarpatho RusynCelticCentral AmericanCentral American IndianCherokeeCheyenneChickasawChileanChineseChippewaChoctawColombianColvilleComancheCosta RicanCreeCreekCroatianCrowCubanCypriotCzechCzechoslovakianDanishDelawareDominicanDutchDutch West IndianEastern EuropeanEcuadorianEgyptianEnglishEstonianEthiopianEuropeanFijianFilipinoFinnishFrenchFrench American IndianFrench CanadianGermanGerman RussianGhanaianGreekGuamanian/ChamorroGuatemalanGuyaneseHaitianHonduranHopiHoumaHungarianIcelanderIndian (Asian)IndonesianInupiatIranianIraqiIrishIroquoisIsraeliItalianJamaicanJapaneseJordanianKenyanKiowaKoreanLaotianLatvianLebaneseLiberianLithuanianLumbeeLuxembourgerMacedonianMalaysianMalteseMarshalleseMenomineeMexicanMexican American IndianMongolianMoroccanNative HawaiianNavajoNepaleseNew ZealanderNicaraguanNigerianNorthern EuropeanNorwegianOkinawanOsageOttawaPaiutePakistaniPalestinianPanamanianParaguayanPennsylvania GermanPeruvianPimaPolishPortuguesePotawatomiPuebloPuerto RicanPuget Sound SalishRomanianRussianSalvadoranSamoanScandinavianScotch-IrishScottishSeminoleSenegaleseSerbianShoshoneSierra LeoneanSiouxSlavicSlovakSloveneSomaliSouth AfricanSouth AmericanSouth American IndianSoviet UnionSpaniardSpanishSpanish AmericanSpanish American IndianSri LankanSubsaharan AfricanSudaneseSwedishSwissSyrianTaiwaneseThaiTlingit-HaidaTohono O'OdhamTonganTrinidadian and TobagonianTsimshianTurkishU.S. Virgin IslanderUgandanUkrainianUruguayanUteVenezuelanVietnameseWelshWest IndianYakamaYaquiYugoslavianYumanYup'ikZimbabwean
Immigration
NonimmigrantsImmigrantsAfghanistanAfricaAlbaniaArgentinaArmeniaAsiaAustraliaAustriaBahamasBangladeshBarbadosBelarusBelgiumBelizeBoliviaBosnia and HerzegovinaBrazilBulgariaBurma/MyanmarCabo VerdeCambodiaCameroonCanadaCaribbeanCentral AmericaChileChinaColombiaCongoCosta RicaCroatiaCubaCzechoslovakiaDenmarkDominicaDominican RepublicEastern AfricaEastern AsiaEastern EuropeEcuadorEgyptEl SalvadorEnglandEritreaEthiopiaEuropeFijiFranceGermanyGhanaGreeceGrenadaGuatemalaGuyanaHaitiHondurasHong KongHungaryIndiaIndonesiaIranIraqIrelandIsraelItalyJamaicaJapanJordanKazakhstanKenyaKoreaKuwaitLaosLatin AmericaLatviaLebanonLiberiaLithuaniaMalaysiaMexicoMicronesiaMiddle AfricaMoldovaMoroccoNepalNetherlandsNicaraguaNigeriaNorth AmericaNorth MacedoniaNorthern AfricaNorthern EuropeNorwayOceaniaPakistanPanamaPeruPhilippinesPolandPortugalRomaniaRussiaSaudi ArabiaScotlandSenegalSerbiaSierra LeoneSingaporeSomaliaSouth AfricaSouth AmericaSouth Central AsiaSouth Eastern AsiaSouthern EuropeSpainSri LankaSt. Vincent and the GrenadinesSudanSwedenSwitzerlandSyriaTaiwanThailandTrinidad and TobagoTurkeyUgandaUkraineUruguayUzbekistanVenezuelaVietnamWest IndiesWestern AfricaWestern AsiaWestern EuropeYemenZaireZimbabweAzores
Disability Age 35 to 64
Income
Poverty
Unemployment
Labor Participation
Family Structure
Vehicle Availability
Education Level
Disability

Disability Age 35 to 64 Comparison

Hmong

Immigrants from Guyana

Tragic
Good
13.1%
DISABILITY AGE 35 TO 64
0.0/ 100
METRIC RATING
286th/ 347
METRIC RANK
11.1%
DISABILITY AGE 35 TO 64
70.1/ 100
METRIC RATING
161st/ 347
METRIC RANK

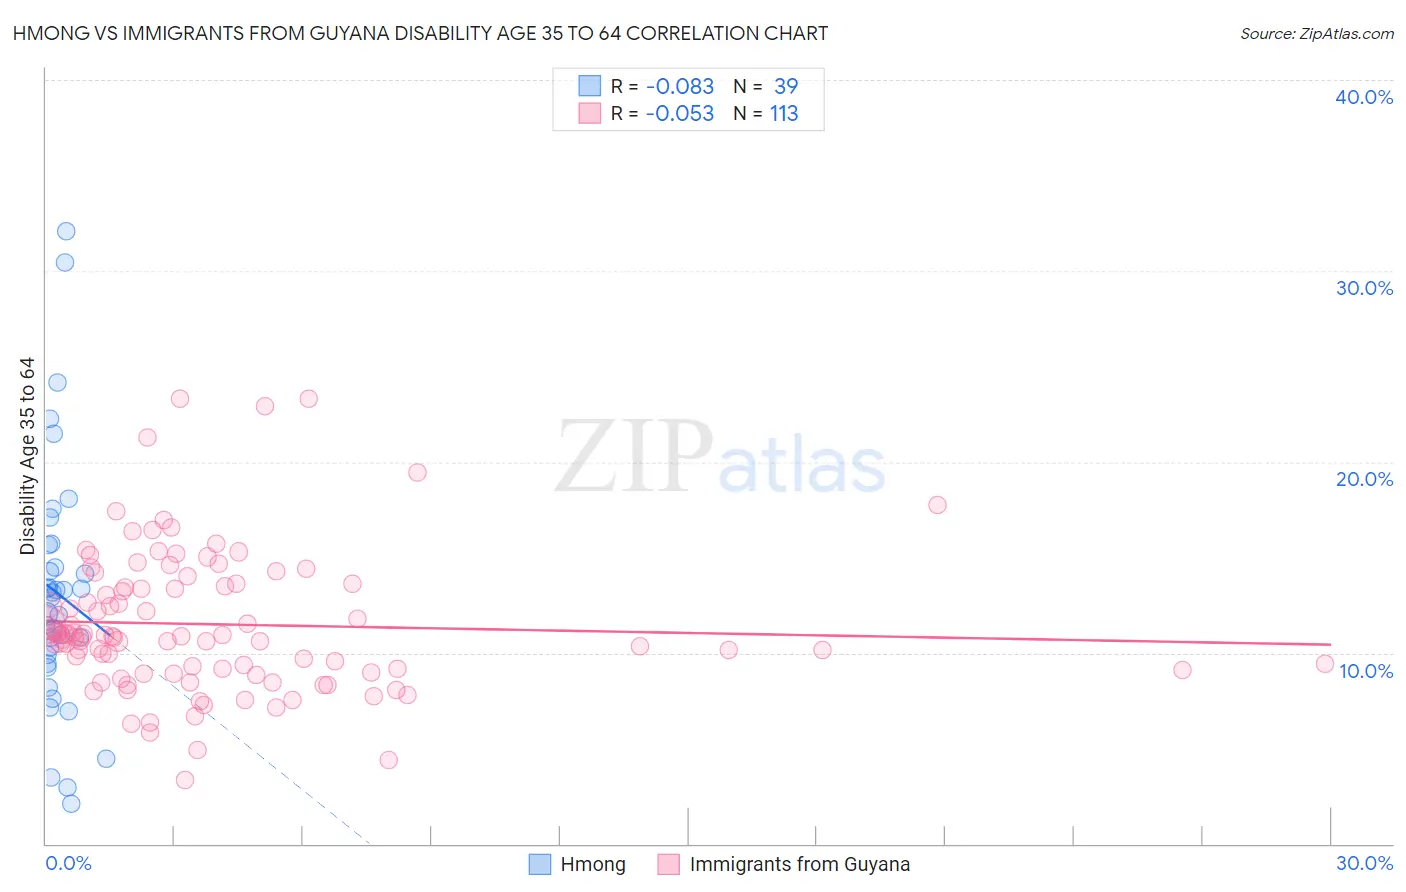
Hmong vs Immigrants from Guyana Disability Age 35 to 64 Correlation Chart

The statistical analysis conducted on geographies consisting of 24,678,157 people shows a slight negative correlation between the proportion of Hmong and percentage of population with a disability between the ages 34 and 64 in the United States with a correlation coefficient (R) of -0.083 and weighted average of 13.1%. Similarly, the statistical analysis conducted on geographies consisting of 183,673,552 people shows a slight negative correlation between the proportion of Immigrants from Guyana and percentage of population with a disability between the ages 34 and 64 in the United States with a correlation coefficient (R) of -0.053 and weighted average of 11.1%, a difference of 18.6%.
Hmong vs Immigrants from Guyana Disability Age 35 to 64

Disability Age 35 to 64 Correlation Summary

MeasurementHmongImmigrants from Guyana
Minimum2.1%3.3%
Maximum32.0%23.3%
Range29.9%20.0%
Mean13.1%11.5%
Median12.9%10.9%
Interquartile 25% (IQ1)9.4%9.0%
Interquartile 75% (IQ3)15.6%13.5%
Interquartile Range (IQR)6.2%4.5%
Standard Deviation (Sample)6.5%3.7%
Standard Deviation (Population)6.4%3.7%

Similar Demographics by Disability Age 35 to 64

Demographics Similar to Hmong by Disability Age 35 to 64

In terms of disability age 35 to 64, the demographic groups most similar to Hmong are Tlingit-Haida (13.2%, a difference of 0.27%), Immigrants from Somalia (13.1%, a difference of 0.31%), Fijian (13.2%, a difference of 0.62%), Indonesian (13.2%, a difference of 0.69%), and Nonimmigrants (13.0%, a difference of 0.75%).
DemographicsRating | RankDisability Age 35 to 64
Immigrants | Micronesia
0.1
/100
|
#279
Tragic
12.9%
Liberians
0.1
/100
|
#280
Tragic
12.9%
Scotch-Irish
0.1
/100
|
#281
Tragic
13.0%
Immigrants | Laos
0.1
/100
|
#282
Tragic
13.0%
Central American Indians
0.0
/100
|
#283
Tragic
13.0%
Immigrants | Nonimmigrants
0.0
/100
|
#284
Tragic
13.0%
Immigrants | Somalia
0.0
/100
|
#285
Tragic
13.1%
Hmong
0.0
/100
|
#286
Tragic
13.1%
Tlingit-Haida
0.0
/100
|
#287
Tragic
13.2%
Fijians
0.0
/100
|
#288
Tragic
13.2%
Indonesians
0.0
/100
|
#289
Tragic
13.2%
Immigrants | Liberia
0.0
/100
|
#290
Tragic
13.2%
Immigrants | Congo
0.0
/100
|
#291
Tragic
13.3%
Puget Sound Salish
0.0
/100
|
#292
Tragic
13.3%
Ute
0.0
/100
|
#293
Tragic
13.4%

Demographics Similar to Immigrants from Guyana by Disability Age 35 to 64

In terms of disability age 35 to 64, the demographic groups most similar to Immigrants from Guyana are Immigrants from Grenada (11.1%, a difference of 0.17%), Croatian (11.0%, a difference of 0.30%), Immigrants from St. Vincent and the Grenadines (11.1%, a difference of 0.33%), Serbian (11.0%, a difference of 0.36%), and Pakistani (11.1%, a difference of 0.41%).
DemographicsRating | RankDisability Age 35 to 64
Immigrants | Canada
76.7
/100
|
#154
Good
11.0%
Moroccans
76.4
/100
|
#155
Good
11.0%
Immigrants | Sierra Leone
76.2
/100
|
#156
Good
11.0%
Guyanese
75.1
/100
|
#157
Good
11.0%
Immigrants | North America
74.9
/100
|
#158
Good
11.0%
Serbians
73.6
/100
|
#159
Good
11.0%
Croatians
73.1
/100
|
#160
Good
11.0%
Immigrants | Guyana
70.1
/100
|
#161
Good
11.1%
Immigrants | Grenada
68.4
/100
|
#162
Good
11.1%
Immigrants | St. Vincent and the Grenadines
66.6
/100
|
#163
Good
11.1%
Pakistanis
65.8
/100
|
#164
Good
11.1%
Immigrants | Western Europe
65.2
/100
|
#165
Good
11.1%
Immigrants | Haiti
63.8
/100
|
#166
Good
11.1%
Austrians
63.2
/100
|
#167
Good
11.1%
Central Americans
59.1
/100
|
#168
Average
11.2%