Hmong vs Czech Disability Age 65 to 74
COMPARE
Hmong
Czech
Disability Age 65 to 74
Disability Age 65 to 74 Comparison
Hmong
Czechs
25.7%
DISABILITY AGE 65 TO 74
0.1/ 100
METRIC RATING
269th/ 347
METRIC RANK
22.4%
DISABILITY AGE 65 TO 74
93.5/ 100
METRIC RATING
121st/ 347
METRIC RANK
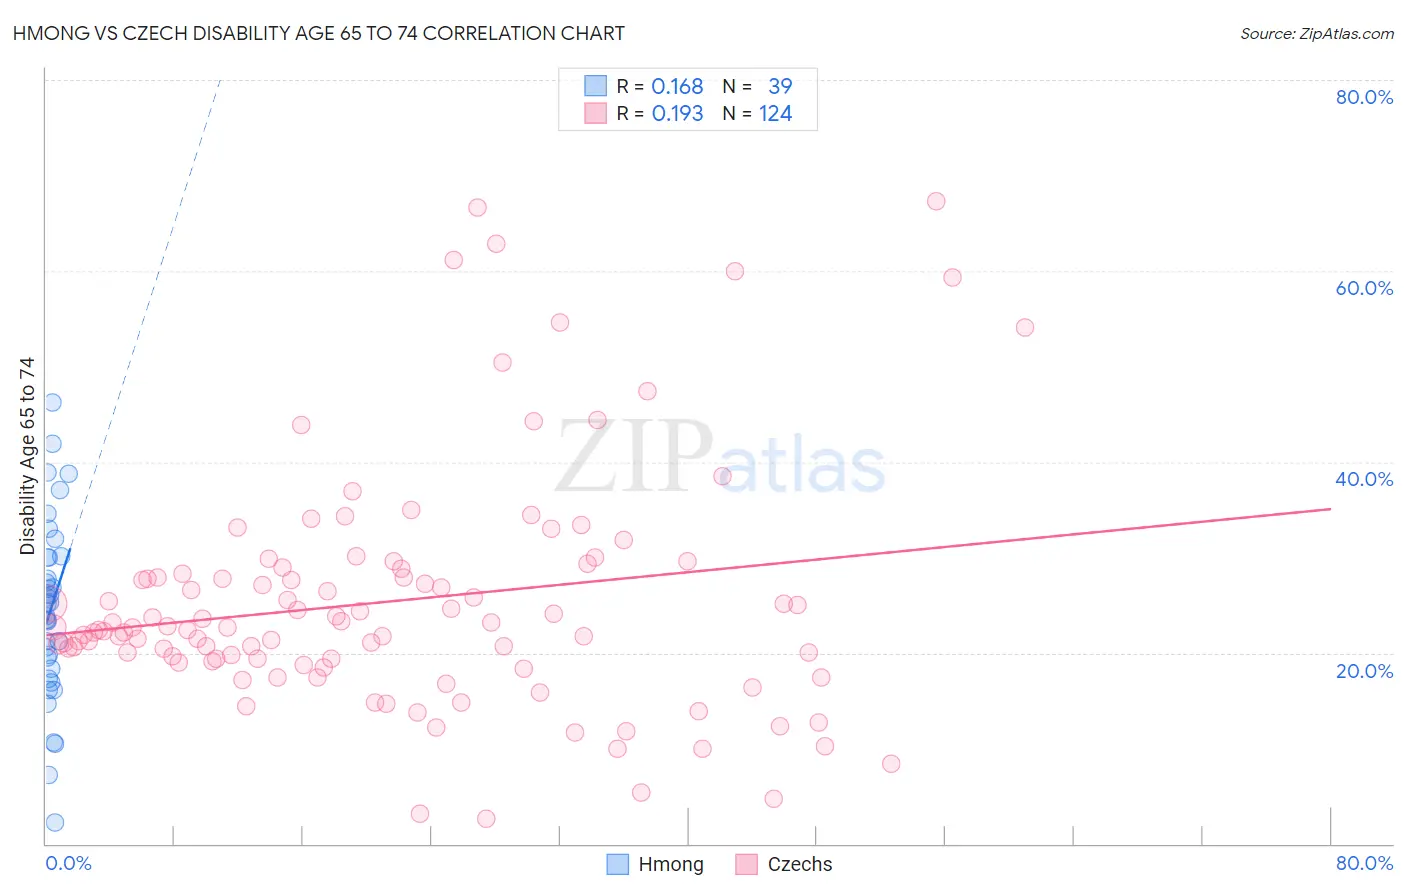
Hmong vs Czech Disability Age 65 to 74 Correlation Chart
The statistical analysis conducted on geographies consisting of 24,678,157 people shows a poor positive correlation between the proportion of Hmong and percentage of population with a disability between the ages 65 and 75 in the United States with a correlation coefficient (R) of 0.168 and weighted average of 25.7%. Similarly, the statistical analysis conducted on geographies consisting of 483,519,300 people shows a poor positive correlation between the proportion of Czechs and percentage of population with a disability between the ages 65 and 75 in the United States with a correlation coefficient (R) of 0.193 and weighted average of 22.4%, a difference of 14.4%.
Disability Age 65 to 74 Correlation Summary
| Measurement | Hmong | Czech |
| Minimum | 2.3% | 2.7% |
| Maximum | 46.3% | 67.3% |
| Range | 44.0% | 64.7% |
| Mean | 24.5% | 25.4% |
| Median | 25.1% | 22.6% |
| Interquartile 25% (IQ1) | 18.3% | 19.3% |
| Interquartile 75% (IQ3) | 30.0% | 28.6% |
| Interquartile Range (IQR) | 11.6% | 9.3% |
| Standard Deviation (Sample) | 9.4% | 12.5% |
| Standard Deviation (Population) | 9.3% | 12.4% |
Similar Demographics by Disability Age 65 to 74
Demographics Similar to Hmong by Disability Age 65 to 74
In terms of disability age 65 to 74, the demographic groups most similar to Hmong are Immigrants from Guatemala (25.7%, a difference of 0.080%), Immigrants from Liberia (25.7%, a difference of 0.11%), Immigrants from Dominica (25.7%, a difference of 0.11%), Liberian (25.6%, a difference of 0.12%), and Ottawa (25.6%, a difference of 0.22%).
| Demographics | Rating | Rank | Disability Age 65 to 74 |
| Samoans | 0.2 /100 | #262 | Tragic 25.4% |
| Iroquois | 0.2 /100 | #263 | Tragic 25.4% |
| Hawaiians | 0.2 /100 | #264 | Tragic 25.5% |
| Guatemalans | 0.2 /100 | #265 | Tragic 25.5% |
| Immigrants | Latin America | 0.1 /100 | #266 | Tragic 25.6% |
| Ottawa | 0.1 /100 | #267 | Tragic 25.6% |
| Liberians | 0.1 /100 | #268 | Tragic 25.6% |
| Hmong | 0.1 /100 | #269 | Tragic 25.7% |
| Immigrants | Guatemala | 0.1 /100 | #270 | Tragic 25.7% |
| Immigrants | Liberia | 0.1 /100 | #271 | Tragic 25.7% |
| Immigrants | Dominica | 0.1 /100 | #272 | Tragic 25.7% |
| Japanese | 0.1 /100 | #273 | Tragic 25.7% |
| Americans | 0.1 /100 | #274 | Tragic 25.8% |
| Hondurans | 0.1 /100 | #275 | Tragic 25.8% |
| French American Indians | 0.1 /100 | #276 | Tragic 25.8% |
Demographics Similar to Czechs by Disability Age 65 to 74
In terms of disability age 65 to 74, the demographic groups most similar to Czechs are Immigrants from Jordan (22.4%, a difference of 0.0%), Hungarian (22.4%, a difference of 0.050%), Immigrants from Kazakhstan (22.4%, a difference of 0.10%), Norwegian (22.5%, a difference of 0.24%), and Immigrants from Western Europe (22.5%, a difference of 0.28%).
| Demographics | Rating | Rank | Disability Age 65 to 74 |
| Ukrainians | 95.1 /100 | #114 | Exceptional 22.3% |
| Laotians | 94.9 /100 | #115 | Exceptional 22.3% |
| Brazilians | 94.8 /100 | #116 | Exceptional 22.4% |
| Swedes | 94.7 /100 | #117 | Exceptional 22.4% |
| Austrians | 94.7 /100 | #118 | Exceptional 22.4% |
| Immigrants | Northern Africa | 94.7 /100 | #119 | Exceptional 22.4% |
| Immigrants | Kazakhstan | 93.9 /100 | #120 | Exceptional 22.4% |
| Czechs | 93.5 /100 | #121 | Exceptional 22.4% |
| Immigrants | Jordan | 93.5 /100 | #122 | Exceptional 22.4% |
| Hungarians | 93.3 /100 | #123 | Exceptional 22.4% |
| Norwegians | 92.5 /100 | #124 | Exceptional 22.5% |
| Immigrants | Western Europe | 92.3 /100 | #125 | Exceptional 22.5% |
| Lebanese | 92.2 /100 | #126 | Exceptional 22.5% |
| Slovaks | 91.6 /100 | #127 | Exceptional 22.5% |
| Immigrants | Costa Rica | 90.4 /100 | #128 | Exceptional 22.6% |