Hispanic or Latino vs Immigrants from Portugal Vision Disability
COMPARE
Hispanic or Latino
Immigrants from Portugal
Vision Disability
Vision Disability Comparison
Hispanics or Latinos
Immigrants from Portugal
2.6%
VISION DISABILITY
0.0/ 100
METRIC RATING
305th/ 347
METRIC RANK
2.3%
VISION DISABILITY
1.4/ 100
METRIC RATING
237th/ 347
METRIC RANK
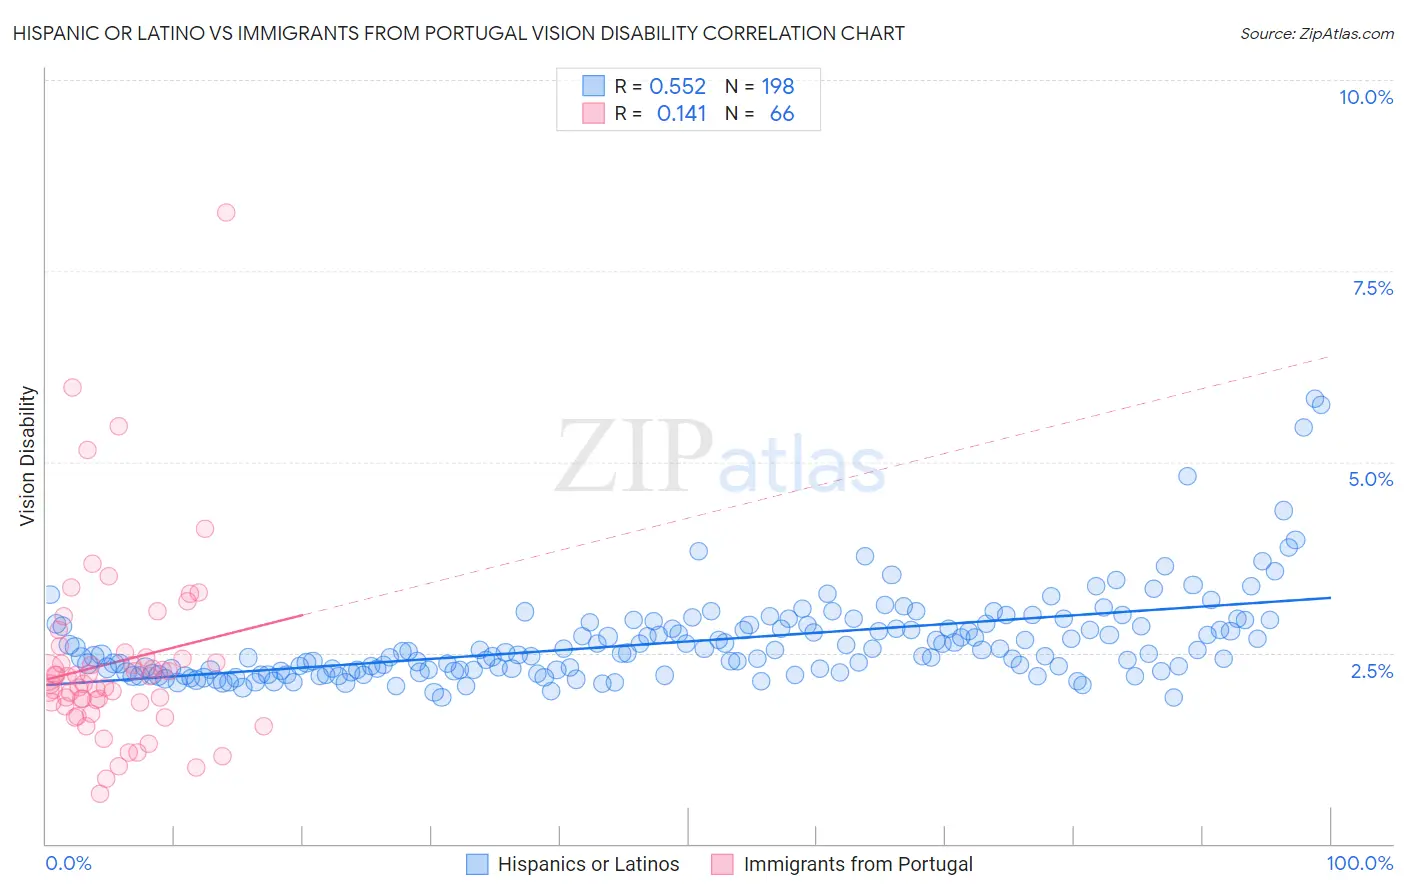
Hispanic or Latino vs Immigrants from Portugal Vision Disability Correlation Chart
The statistical analysis conducted on geographies consisting of 574,500,029 people shows a substantial positive correlation between the proportion of Hispanics or Latinos and percentage of population with vision disability in the United States with a correlation coefficient (R) of 0.552 and weighted average of 2.6%. Similarly, the statistical analysis conducted on geographies consisting of 174,661,842 people shows a poor positive correlation between the proportion of Immigrants from Portugal and percentage of population with vision disability in the United States with a correlation coefficient (R) of 0.141 and weighted average of 2.3%, a difference of 12.1%.
Vision Disability Correlation Summary
| Measurement | Hispanic or Latino | Immigrants from Portugal |
| Minimum | 1.9% | 0.66% |
| Maximum | 5.8% | 8.3% |
| Range | 3.9% | 7.6% |
| Mean | 2.6% | 2.4% |
| Median | 2.5% | 2.1% |
| Interquartile 25% (IQ1) | 2.3% | 1.8% |
| Interquartile 75% (IQ3) | 2.9% | 2.4% |
| Interquartile Range (IQR) | 0.59% | 0.59% |
| Standard Deviation (Sample) | 0.59% | 1.2% |
| Standard Deviation (Population) | 0.59% | 1.2% |
Similar Demographics by Vision Disability
Demographics Similar to Hispanics or Latinos by Vision Disability
In terms of vision disability, the demographic groups most similar to Hispanics or Latinos are Aleut (2.6%, a difference of 0.30%), Immigrants from Cabo Verde (2.6%, a difference of 0.43%), Iroquois (2.6%, a difference of 0.61%), Immigrants from Dominican Republic (2.6%, a difference of 0.64%), and Arapaho (2.6%, a difference of 0.65%).
| Demographics | Rating | Rank | Vision Disability |
| Mexicans | 0.0 /100 | #298 | Tragic 2.5% |
| Cree | 0.0 /100 | #299 | Tragic 2.5% |
| Africans | 0.0 /100 | #300 | Tragic 2.5% |
| Menominee | 0.0 /100 | #301 | Tragic 2.5% |
| Spanish American Indians | 0.0 /100 | #302 | Tragic 2.6% |
| Immigrants | Cabo Verde | 0.0 /100 | #303 | Tragic 2.6% |
| Aleuts | 0.0 /100 | #304 | Tragic 2.6% |
| Hispanics or Latinos | 0.0 /100 | #305 | Tragic 2.6% |
| Iroquois | 0.0 /100 | #306 | Tragic 2.6% |
| Immigrants | Dominican Republic | 0.0 /100 | #307 | Tragic 2.6% |
| Arapaho | 0.0 /100 | #308 | Tragic 2.6% |
| Immigrants | Yemen | 0.0 /100 | #309 | Tragic 2.6% |
| Blackfeet | 0.0 /100 | #310 | Tragic 2.6% |
| Dominicans | 0.0 /100 | #311 | Tragic 2.6% |
| Americans | 0.0 /100 | #312 | Tragic 2.6% |
Demographics Similar to Immigrants from Portugal by Vision Disability
In terms of vision disability, the demographic groups most similar to Immigrants from Portugal are Immigrants from Congo (2.3%, a difference of 0.050%), Marshallese (2.3%, a difference of 0.14%), Scottish (2.3%, a difference of 0.21%), Immigrants from Cambodia (2.3%, a difference of 0.27%), and English (2.3%, a difference of 0.29%).
| Demographics | Rating | Rank | Vision Disability |
| Nicaraguans | 2.2 /100 | #230 | Tragic 2.3% |
| Immigrants | Ecuador | 2.0 /100 | #231 | Tragic 2.3% |
| German Russians | 1.8 /100 | #232 | Tragic 2.3% |
| Central Americans | 1.8 /100 | #233 | Tragic 2.3% |
| Scottish | 1.6 /100 | #234 | Tragic 2.3% |
| Marshallese | 1.5 /100 | #235 | Tragic 2.3% |
| Immigrants | Congo | 1.4 /100 | #236 | Tragic 2.3% |
| Immigrants | Portugal | 1.4 /100 | #237 | Tragic 2.3% |
| Immigrants | Cambodia | 1.1 /100 | #238 | Tragic 2.3% |
| English | 1.1 /100 | #239 | Tragic 2.3% |
| Panamanians | 0.9 /100 | #240 | Tragic 2.3% |
| Malaysians | 0.9 /100 | #241 | Tragic 2.3% |
| Immigrants | Panama | 0.8 /100 | #242 | Tragic 2.3% |
| Immigrants | Nicaragua | 0.6 /100 | #243 | Tragic 2.3% |
| Immigrants | West Indies | 0.6 /100 | #244 | Tragic 2.3% |