Hawaiian vs Burmese Ambulatory Disability
COMPARE
Hawaiian
Burmese
Ambulatory Disability
Ambulatory Disability Comparison
Hawaiians
Burmese
6.5%
AMBULATORY DISABILITY
0.9/ 100
METRIC RATING
251st/ 347
METRIC RANK
5.3%
AMBULATORY DISABILITY
100.0/ 100
METRIC RATING
13th/ 347
METRIC RANK
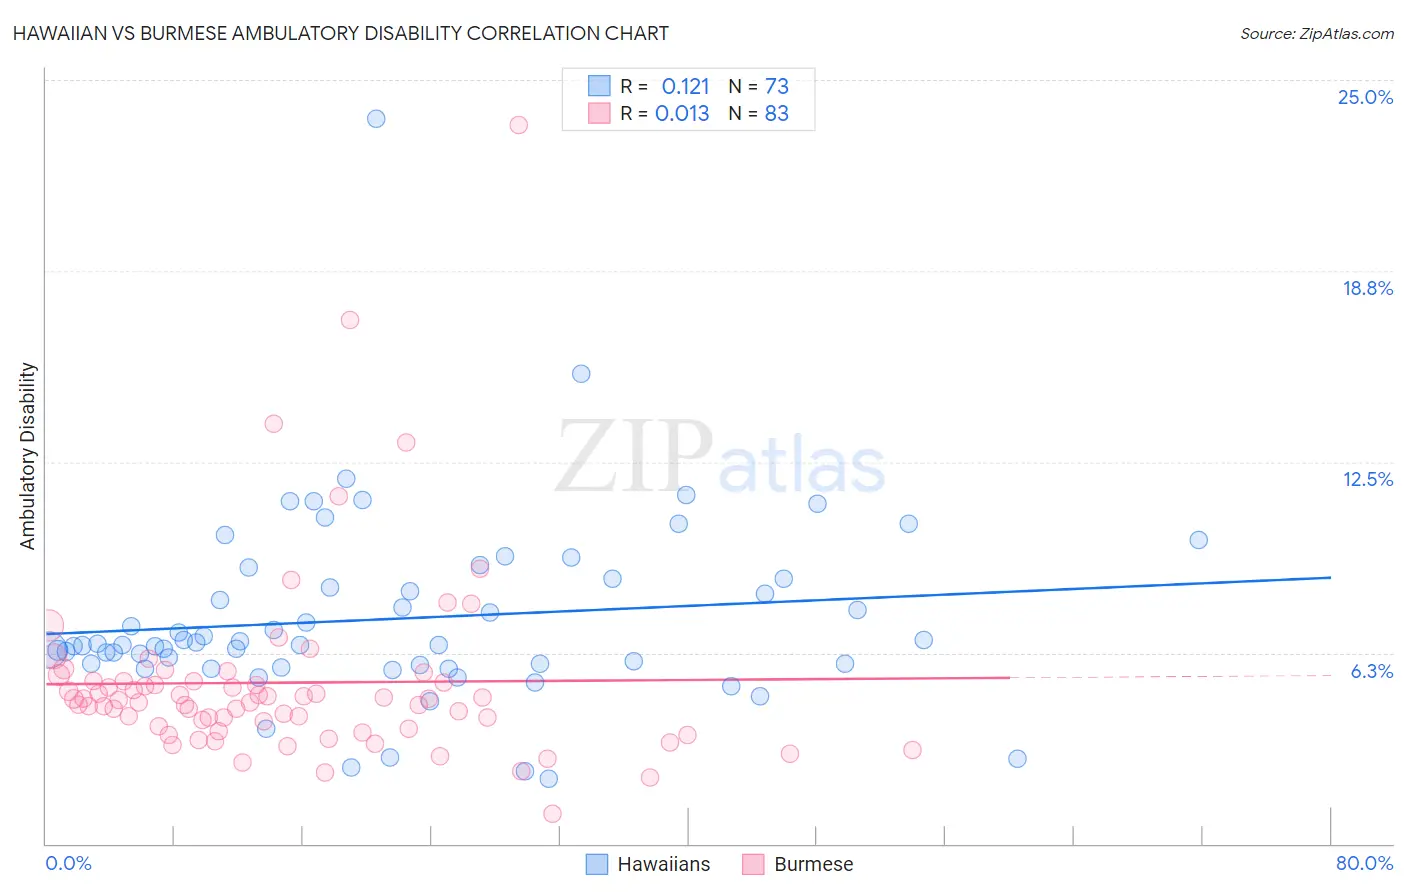
Hawaiian vs Burmese Ambulatory Disability Correlation Chart
The statistical analysis conducted on geographies consisting of 327,430,219 people shows a poor positive correlation between the proportion of Hawaiians and percentage of population with ambulatory disability in the United States with a correlation coefficient (R) of 0.121 and weighted average of 6.5%. Similarly, the statistical analysis conducted on geographies consisting of 465,101,003 people shows no correlation between the proportion of Burmese and percentage of population with ambulatory disability in the United States with a correlation coefficient (R) of 0.013 and weighted average of 5.3%, a difference of 23.0%.
Ambulatory Disability Correlation Summary
| Measurement | Hawaiian | Burmese |
| Minimum | 2.1% | 1.0% |
| Maximum | 23.7% | 23.5% |
| Range | 21.6% | 22.5% |
| Mean | 7.4% | 5.3% |
| Median | 6.5% | 4.7% |
| Interquartile 25% (IQ1) | 5.9% | 3.8% |
| Interquartile 75% (IQ3) | 8.7% | 5.3% |
| Interquartile Range (IQR) | 2.8% | 1.5% |
| Standard Deviation (Sample) | 3.1% | 3.2% |
| Standard Deviation (Population) | 3.1% | 3.2% |
Similar Demographics by Ambulatory Disability
Demographics Similar to Hawaiians by Ambulatory Disability
In terms of ambulatory disability, the demographic groups most similar to Hawaiians are Chinese (6.5%, a difference of 0.18%), Immigrants from Bahamas (6.5%, a difference of 0.20%), Scottish (6.5%, a difference of 0.25%), Native Hawaiian (6.5%, a difference of 0.26%), and Belizean (6.5%, a difference of 0.41%).
| Demographics | Rating | Rank | Ambulatory Disability |
| Immigrants | Panama | 1.5 /100 | #244 | Tragic 6.5% |
| Tlingit-Haida | 1.5 /100 | #245 | Tragic 6.5% |
| Armenians | 1.5 /100 | #246 | Tragic 6.5% |
| Immigrants | Cuba | 1.4 /100 | #247 | Tragic 6.5% |
| Immigrants | Portugal | 1.4 /100 | #248 | Tragic 6.5% |
| Native Hawaiians | 1.1 /100 | #249 | Tragic 6.5% |
| Chinese | 1.0 /100 | #250 | Tragic 6.5% |
| Hawaiians | 0.9 /100 | #251 | Tragic 6.5% |
| Immigrants | Bahamas | 0.8 /100 | #252 | Tragic 6.5% |
| Scottish | 0.7 /100 | #253 | Tragic 6.5% |
| Belizeans | 0.7 /100 | #254 | Tragic 6.5% |
| Welsh | 0.6 /100 | #255 | Tragic 6.5% |
| Immigrants | Uzbekistan | 0.6 /100 | #256 | Tragic 6.5% |
| Bermudans | 0.5 /100 | #257 | Tragic 6.5% |
| Spanish American Indians | 0.5 /100 | #258 | Tragic 6.5% |
Demographics Similar to Burmese by Ambulatory Disability
In terms of ambulatory disability, the demographic groups most similar to Burmese are Immigrants from Eastern Asia (5.3%, a difference of 0.15%), Immigrants from China (5.3%, a difference of 0.48%), Okinawan (5.3%, a difference of 0.50%), Immigrants from Korea (5.2%, a difference of 0.81%), and Immigrants from Hong Kong (5.3%, a difference of 1.0%).
| Demographics | Rating | Rank | Ambulatory Disability |
| Immigrants | Bolivia | 100.0 /100 | #6 | Exceptional 5.0% |
| Bolivians | 100.0 /100 | #7 | Exceptional 5.1% |
| Immigrants | South Central Asia | 100.0 /100 | #8 | Exceptional 5.1% |
| Iranians | 100.0 /100 | #9 | Exceptional 5.1% |
| Yup'ik | 100.0 /100 | #10 | Exceptional 5.2% |
| Immigrants | Korea | 100.0 /100 | #11 | Exceptional 5.2% |
| Okinawans | 100.0 /100 | #12 | Exceptional 5.3% |
| Burmese | 100.0 /100 | #13 | Exceptional 5.3% |
| Immigrants | Eastern Asia | 100.0 /100 | #14 | Exceptional 5.3% |
| Immigrants | China | 100.0 /100 | #15 | Exceptional 5.3% |
| Immigrants | Hong Kong | 100.0 /100 | #16 | Exceptional 5.3% |
| Immigrants | Ethiopia | 100.0 /100 | #17 | Exceptional 5.4% |
| Immigrants | Sri Lanka | 100.0 /100 | #18 | Exceptional 5.4% |
| Indians (Asian) | 100.0 /100 | #19 | Exceptional 5.4% |
| Ethiopians | 100.0 /100 | #20 | Exceptional 5.4% |