Guyanese vs Lithuanian Disability Age Over 75
COMPARE
Guyanese
Lithuanian
Disability Age Over 75
Disability Age Over 75 Comparison
Guyanese
Lithuanians
46.9%
DISABILITY AGE OVER 75
84.3/ 100
METRIC RATING
146th/ 347
METRIC RANK
45.1%
DISABILITY AGE OVER 75
100.0/ 100
METRIC RATING
11th/ 347
METRIC RANK
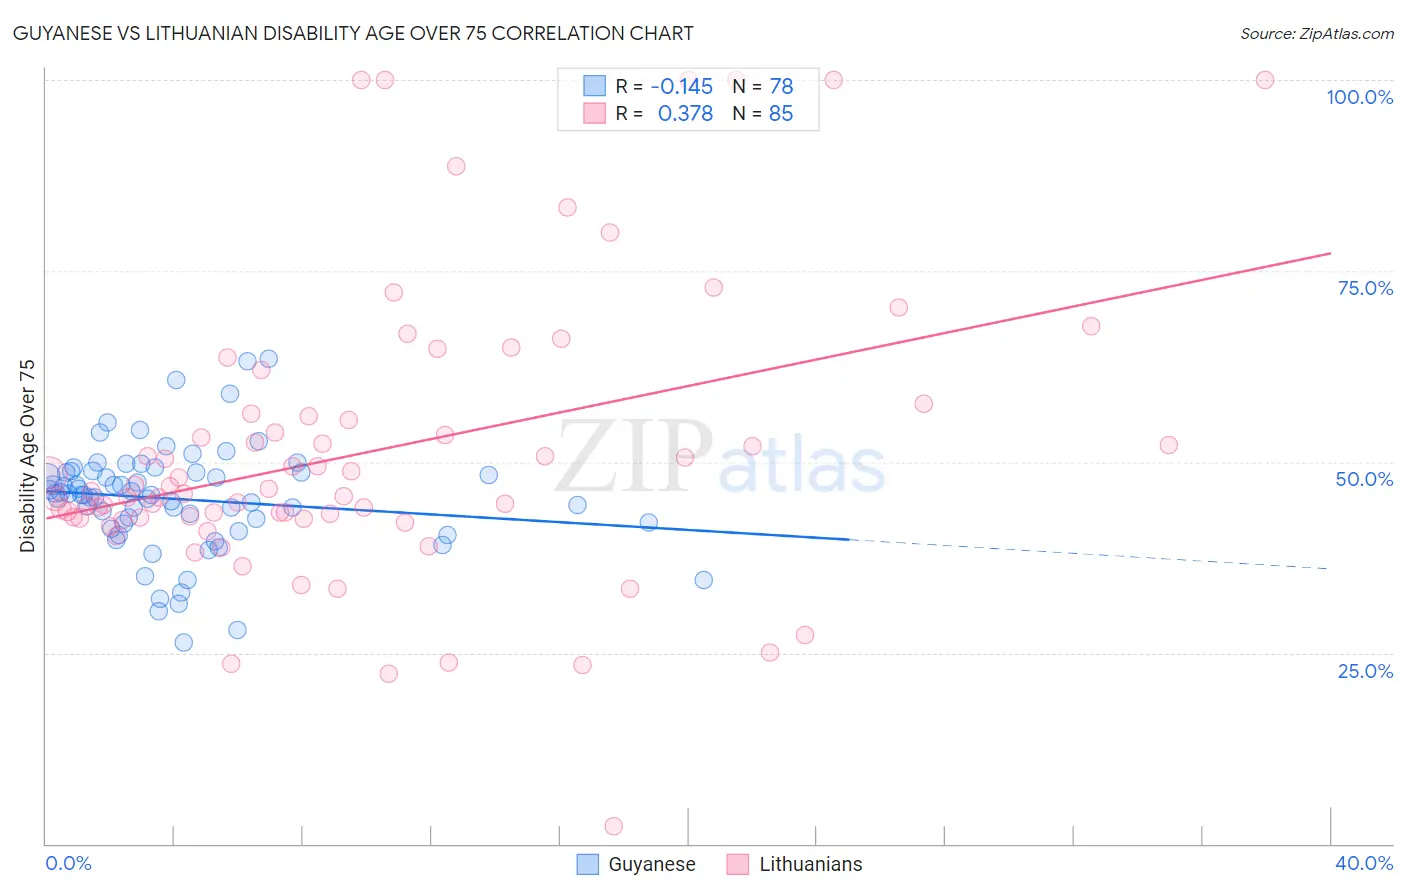
Guyanese vs Lithuanian Disability Age Over 75 Correlation Chart
The statistical analysis conducted on geographies consisting of 176,616,410 people shows a poor negative correlation between the proportion of Guyanese and percentage of population with a disability over the age of 75 in the United States with a correlation coefficient (R) of -0.145 and weighted average of 46.9%. Similarly, the statistical analysis conducted on geographies consisting of 421,319,644 people shows a mild positive correlation between the proportion of Lithuanians and percentage of population with a disability over the age of 75 in the United States with a correlation coefficient (R) of 0.378 and weighted average of 45.1%, a difference of 4.0%.
Disability Age Over 75 Correlation Summary
| Measurement | Guyanese | Lithuanian |
| Minimum | 26.4% | 2.2% |
| Maximum | 63.4% | 100.0% |
| Range | 37.1% | 97.8% |
| Mean | 45.1% | 51.4% |
| Median | 45.7% | 46.1% |
| Interquartile 25% (IQ1) | 41.8% | 42.7% |
| Interquartile 75% (IQ3) | 48.6% | 56.1% |
| Interquartile Range (IQR) | 6.8% | 13.4% |
| Standard Deviation (Sample) | 7.1% | 19.1% |
| Standard Deviation (Population) | 7.0% | 19.0% |
Similar Demographics by Disability Age Over 75
Demographics Similar to Guyanese by Disability Age Over 75
In terms of disability age over 75, the demographic groups most similar to Guyanese are Costa Rican (46.9%, a difference of 0.010%), Immigrants from Peru (46.9%, a difference of 0.010%), Venezuelan (46.9%, a difference of 0.030%), Bermudan (46.9%, a difference of 0.060%), and Peruvian (46.8%, a difference of 0.10%).
| Demographics | Rating | Rank | Disability Age Over 75 |
| Yugoslavians | 88.5 /100 | #139 | Excellent 46.8% |
| Immigrants | Costa Rica | 87.4 /100 | #140 | Excellent 46.8% |
| Lebanese | 87.0 /100 | #141 | Excellent 46.8% |
| Peruvians | 86.5 /100 | #142 | Excellent 46.8% |
| Bermudans | 85.6 /100 | #143 | Excellent 46.9% |
| Venezuelans | 85.0 /100 | #144 | Excellent 46.9% |
| Costa Ricans | 84.5 /100 | #145 | Excellent 46.9% |
| Guyanese | 84.3 /100 | #146 | Excellent 46.9% |
| Immigrants | Peru | 84.1 /100 | #147 | Excellent 46.9% |
| Asians | 81.6 /100 | #148 | Excellent 46.9% |
| Welsh | 81.3 /100 | #149 | Excellent 47.0% |
| Immigrants | Russia | 79.3 /100 | #150 | Good 47.0% |
| French Canadians | 79.0 /100 | #151 | Good 47.0% |
| Immigrants | Asia | 76.5 /100 | #152 | Good 47.0% |
| Immigrants | Zaire | 74.8 /100 | #153 | Good 47.1% |
Demographics Similar to Lithuanians by Disability Age Over 75
In terms of disability age over 75, the demographic groups most similar to Lithuanians are Bulgarian (45.1%, a difference of 0.050%), Immigrants from Czechoslovakia (45.1%, a difference of 0.10%), Latvian (45.1%, a difference of 0.10%), Immigrants from Scotland (45.1%, a difference of 0.12%), and Immigrants from Sweden (45.1%, a difference of 0.16%).
| Demographics | Rating | Rank | Disability Age Over 75 |
| Carpatho Rusyns | 100.0 /100 | #4 | Exceptional 44.8% |
| Luxembourgers | 100.0 /100 | #5 | Exceptional 44.8% |
| Immigrants | Lithuania | 100.0 /100 | #6 | Exceptional 44.9% |
| Okinawans | 100.0 /100 | #7 | Exceptional 44.9% |
| Immigrants | Austria | 100.0 /100 | #8 | Exceptional 44.9% |
| Paraguayans | 100.0 /100 | #9 | Exceptional 45.0% |
| Bulgarians | 100.0 /100 | #10 | Exceptional 45.1% |
| Lithuanians | 100.0 /100 | #11 | Exceptional 45.1% |
| Immigrants | Czechoslovakia | 100.0 /100 | #12 | Exceptional 45.1% |
| Latvians | 100.0 /100 | #13 | Exceptional 45.1% |
| Immigrants | Scotland | 100.0 /100 | #14 | Exceptional 45.1% |
| Immigrants | Sweden | 100.0 /100 | #15 | Exceptional 45.1% |
| Immigrants | Northern Europe | 100.0 /100 | #16 | Exceptional 45.2% |
| Immigrants | India | 100.0 /100 | #17 | Exceptional 45.2% |
| Bolivians | 100.0 /100 | #18 | Exceptional 45.2% |