Filipino vs Immigrants from North America Disability Age 35 to 64
COMPARE
Filipino
Immigrants from North America
Disability Age 35 to 64
Disability Age 35 to 64 Comparison
Filipinos
Immigrants from North America
8.0%
DISABILITY AGE 35 TO 64
100.0/ 100
METRIC RATING
2nd/ 347
METRIC RANK
11.0%
DISABILITY AGE 35 TO 64
74.9/ 100
METRIC RATING
158th/ 347
METRIC RANK
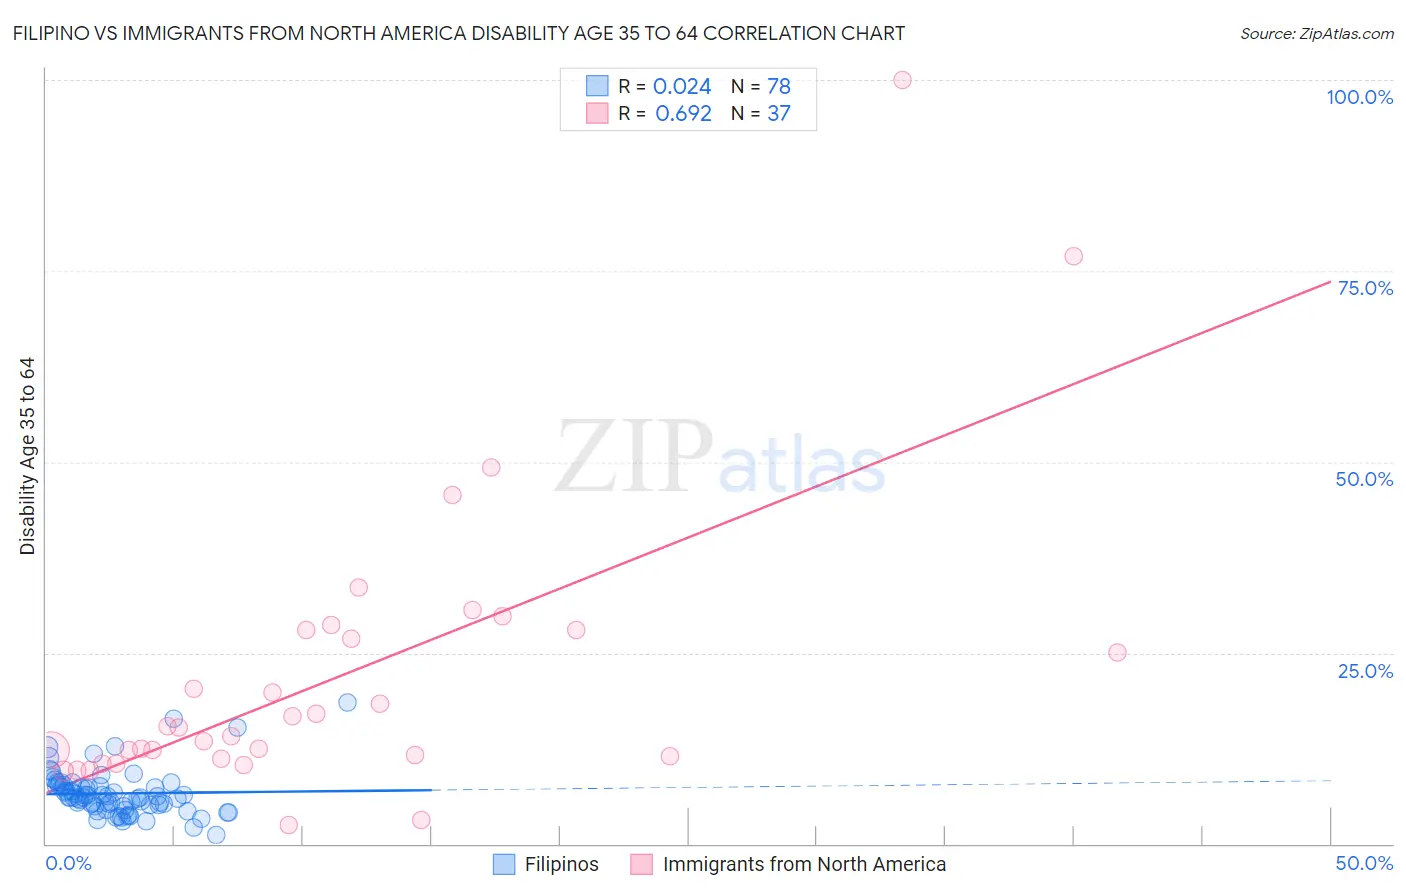
Filipino vs Immigrants from North America Disability Age 35 to 64 Correlation Chart
The statistical analysis conducted on geographies consisting of 254,159,243 people shows no correlation between the proportion of Filipinos and percentage of population with a disability between the ages 34 and 64 in the United States with a correlation coefficient (R) of 0.024 and weighted average of 8.0%. Similarly, the statistical analysis conducted on geographies consisting of 462,067,544 people shows a significant positive correlation between the proportion of Immigrants from North America and percentage of population with a disability between the ages 34 and 64 in the United States with a correlation coefficient (R) of 0.692 and weighted average of 11.0%, a difference of 36.9%.
Disability Age 35 to 64 Correlation Summary
| Measurement | Filipino | Immigrants from North America |
| Minimum | 1.2% | 2.4% |
| Maximum | 18.4% | 100.0% |
| Range | 17.2% | 97.6% |
| Mean | 6.6% | 22.0% |
| Median | 6.1% | 15.2% |
| Interquartile 25% (IQ1) | 5.0% | 11.3% |
| Interquartile 75% (IQ3) | 7.6% | 28.0% |
| Interquartile Range (IQR) | 2.6% | 16.7% |
| Standard Deviation (Sample) | 3.0% | 19.4% |
| Standard Deviation (Population) | 3.0% | 19.1% |
Similar Demographics by Disability Age 35 to 64
Demographics Similar to Filipinos by Disability Age 35 to 64
In terms of disability age 35 to 64, the demographic groups most similar to Filipinos are Immigrants from Hong Kong (8.2%, a difference of 1.8%), Immigrants from Taiwan (7.8%, a difference of 2.5%), Immigrants from India (8.3%, a difference of 2.9%), Immigrants from Iran (8.5%, a difference of 5.5%), and Thai (8.6%, a difference of 6.5%).
| Demographics | Rating | Rank | Disability Age 35 to 64 |
| Immigrants | Taiwan | 100.0 /100 | #1 | Exceptional 7.8% |
| Filipinos | 100.0 /100 | #2 | Exceptional 8.0% |
| Immigrants | Hong Kong | 100.0 /100 | #3 | Exceptional 8.2% |
| Immigrants | India | 100.0 /100 | #4 | Exceptional 8.3% |
| Immigrants | Iran | 100.0 /100 | #5 | Exceptional 8.5% |
| Thais | 100.0 /100 | #6 | Exceptional 8.6% |
| Immigrants | Israel | 100.0 /100 | #7 | Exceptional 8.6% |
| Iranians | 100.0 /100 | #8 | Exceptional 8.7% |
| Immigrants | China | 100.0 /100 | #9 | Exceptional 8.7% |
| Immigrants | Bolivia | 100.0 /100 | #10 | Exceptional 8.7% |
| Immigrants | Eastern Asia | 100.0 /100 | #11 | Exceptional 8.8% |
| Indians (Asian) | 100.0 /100 | #12 | Exceptional 8.9% |
| Immigrants | South Central Asia | 100.0 /100 | #13 | Exceptional 8.9% |
| Immigrants | Singapore | 100.0 /100 | #14 | Exceptional 8.9% |
| Bolivians | 100.0 /100 | #15 | Exceptional 8.9% |
Demographics Similar to Immigrants from North America by Disability Age 35 to 64
In terms of disability age 35 to 64, the demographic groups most similar to Immigrants from North America are Guyanese (11.0%, a difference of 0.010%), Immigrants from Sierra Leone (11.0%, a difference of 0.14%), Serbian (11.0%, a difference of 0.14%), Moroccan (11.0%, a difference of 0.16%), and Immigrants from Canada (11.0%, a difference of 0.20%).
| Demographics | Rating | Rank | Disability Age 35 to 64 |
| New Zealanders | 79.3 /100 | #151 | Good 11.0% |
| Ukrainians | 78.0 /100 | #152 | Good 11.0% |
| Immigrants | England | 77.4 /100 | #153 | Good 11.0% |
| Immigrants | Canada | 76.7 /100 | #154 | Good 11.0% |
| Moroccans | 76.4 /100 | #155 | Good 11.0% |
| Immigrants | Sierra Leone | 76.2 /100 | #156 | Good 11.0% |
| Guyanese | 75.1 /100 | #157 | Good 11.0% |
| Immigrants | North America | 74.9 /100 | #158 | Good 11.0% |
| Serbians | 73.6 /100 | #159 | Good 11.0% |
| Croatians | 73.1 /100 | #160 | Good 11.0% |
| Immigrants | Guyana | 70.1 /100 | #161 | Good 11.1% |
| Immigrants | Grenada | 68.4 /100 | #162 | Good 11.1% |
| Immigrants | St. Vincent and the Grenadines | 66.6 /100 | #163 | Good 11.1% |
| Pakistanis | 65.8 /100 | #164 | Good 11.1% |
| Immigrants | Western Europe | 65.2 /100 | #165 | Good 11.1% |