Ecuadorian vs Immigrants from Nigeria Cognitive Disability

COMPARE

Ecuadorian
Race
Ancestry
AfghanAfricanAlaska NativeAlaskan AthabascanAlbanianAleutAlsatianAmericanApacheArabArapahoArgentineanArmenianAssyrian/Chaldean/SyriacAustralianAustrianBahamianBangladeshiBarbadianBasqueBelgianBelizeanBermudanBhutaneseBlackfeetBolivianBrazilianBritishBritish West IndianBulgarianBurmeseCajunCambodianCanadianCape VerdeanCarpatho RusynCelticCentral AmericanCentral American IndianCherokeeCheyenneChickasawChileanChineseChippewaChoctawColombianColvilleComancheCosta RicanCreeCreekCroatianCrowCubanCypriotCzechCzechoslovakianDanishDelawareDominicanDutchDutch West IndianEastern EuropeanEcuadorianEgyptianEnglishEstonianEthiopianEuropeanFijianFilipinoFinnishFrenchFrench American IndianFrench CanadianGermanGerman RussianGhanaianGreekGuamanian/ChamorroGuatemalanGuyaneseHaitianHmongHonduranHopiHoumaHungarianIcelanderIndian (Asian)IndonesianInupiatIranianIraqiIrishIroquoisIsraeliItalianJamaicanJapaneseJordanianKenyanKiowaKoreanLaotianLatvianLebaneseLiberianLithuanianLumbeeLuxembourgerMacedonianMalaysianMalteseMarshalleseMenomineeMexicanMexican American IndianMongolianMoroccanNative HawaiianNavajoNepaleseNew ZealanderNicaraguanNigerianNorthern EuropeanNorwegianOkinawanOsageOttawaPaiutePakistaniPalestinianPanamanianParaguayanPennsylvania GermanPeruvianPimaPolishPortuguesePotawatomiPuebloPuerto RicanPuget Sound SalishRomanianRussianSalvadoranSamoanScandinavianScotch-IrishScottishSeminoleSenegaleseSerbianShoshoneSierra LeoneanSiouxSlavicSlovakSloveneSomaliSouth AfricanSouth AmericanSouth American IndianSoviet UnionSpaniardSpanishSpanish AmericanSpanish American IndianSri LankanSubsaharan AfricanSudaneseSwedishSwissSyrianTaiwaneseThaiTlingit-HaidaTohono O'OdhamTonganTrinidadian and TobagonianTsimshianTurkishU.S. Virgin IslanderUgandanUkrainianUruguayanUteVenezuelanVietnameseWelshWest IndianYakamaYaquiYugoslavianYumanYup'ikZimbabwean
Immigration
NonimmigrantsImmigrantsAfghanistanAfricaAlbaniaArgentinaArmeniaAsiaAustraliaAustriaBahamasBangladeshBarbadosBelarusBelgiumBelizeBoliviaBosnia and HerzegovinaBrazilBulgariaBurma/MyanmarCabo VerdeCambodiaCameroonCanadaCaribbeanCentral AmericaChileChinaColombiaCongoCosta RicaCroatiaCubaCzechoslovakiaDenmarkDominicaDominican RepublicEastern AfricaEastern AsiaEastern EuropeEcuadorEgyptEl SalvadorEnglandEritreaEthiopiaEuropeFijiFranceGermanyGhanaGreeceGrenadaGuatemalaGuyanaHaitiHondurasHong KongHungaryIndiaIndonesiaIranIraqIrelandIsraelItalyJamaicaJapanJordanKazakhstanKenyaKoreaKuwaitLaosLatin AmericaLatviaLebanonLiberiaLithuaniaMalaysiaMexicoMicronesiaMiddle AfricaMoldovaMoroccoNepalNetherlandsNicaraguaNorth AmericaNorth MacedoniaNorthern AfricaNorthern EuropeNorwayOceaniaPakistanPanamaPeruPhilippinesPolandPortugalRomaniaRussiaSaudi ArabiaScotlandSenegalSerbiaSierra LeoneSingaporeSomaliaSouth AfricaSouth AmericaSouth Central AsiaSouth Eastern AsiaSouthern EuropeSpainSri LankaSt. Vincent and the GrenadinesSudanSwedenSwitzerlandSyriaTaiwanThailandTrinidad and TobagoTurkeyUgandaUkraineUruguayUzbekistanVenezuelaVietnamWest IndiesWestern AfricaWestern AsiaWestern EuropeYemenZaireZimbabweAzores
Immigrants from Nigeria
Race
Ancestry
AfghanAfricanAlaska NativeAlaskan AthabascanAlbanianAleutAlsatianAmericanApacheArabArapahoArgentineanArmenianAssyrian/Chaldean/SyriacAustralianAustrianBahamianBangladeshiBarbadianBasqueBelgianBelizeanBermudanBhutaneseBlackfeetBolivianBrazilianBritishBritish West IndianBulgarianBurmeseCajunCambodianCanadianCape VerdeanCarpatho RusynCelticCentral AmericanCentral American IndianCherokeeCheyenneChickasawChileanChineseChippewaChoctawColombianColvilleComancheCosta RicanCreeCreekCroatianCrowCubanCypriotCzechCzechoslovakianDanishDelawareDominicanDutchDutch West IndianEastern EuropeanEgyptianEnglishEstonianEthiopianEuropeanFijianFilipinoFinnishFrenchFrench American IndianFrench CanadianGermanGerman RussianGhanaianGreekGuamanian/ChamorroGuatemalanGuyaneseHaitianHmongHonduranHopiHoumaHungarianIcelanderIndian (Asian)IndonesianInupiatIranianIraqiIrishIroquoisIsraeliItalianJamaicanJapaneseJordanianKenyanKiowaKoreanLaotianLatvianLebaneseLiberianLithuanianLumbeeLuxembourgerMacedonianMalaysianMalteseMarshalleseMenomineeMexicanMexican American IndianMongolianMoroccanNative HawaiianNavajoNepaleseNew ZealanderNicaraguanNigerianNorthern EuropeanNorwegianOkinawanOsageOttawaPaiutePakistaniPalestinianPanamanianParaguayanPennsylvania GermanPeruvianPimaPolishPortuguesePotawatomiPuebloPuerto RicanPuget Sound SalishRomanianRussianSalvadoranSamoanScandinavianScotch-IrishScottishSeminoleSenegaleseSerbianShoshoneSierra LeoneanSiouxSlavicSlovakSloveneSomaliSouth AfricanSouth AmericanSouth American IndianSoviet UnionSpaniardSpanishSpanish AmericanSpanish American IndianSri LankanSubsaharan AfricanSudaneseSwedishSwissSyrianTaiwaneseThaiTlingit-HaidaTohono O'OdhamTonganTrinidadian and TobagonianTsimshianTurkishU.S. Virgin IslanderUgandanUkrainianUruguayanUteVenezuelanVietnameseWelshWest IndianYakamaYaquiYugoslavianYumanYup'ikZimbabwean
Immigration
NonimmigrantsImmigrantsAfghanistanAfricaAlbaniaArgentinaArmeniaAsiaAustraliaAustriaBahamasBangladeshBarbadosBelarusBelgiumBelizeBoliviaBosnia and HerzegovinaBrazilBulgariaBurma/MyanmarCabo VerdeCambodiaCameroonCanadaCaribbeanCentral AmericaChileChinaColombiaCongoCosta RicaCroatiaCubaCzechoslovakiaDenmarkDominicaDominican RepublicEastern AfricaEastern AsiaEastern EuropeEcuadorEgyptEl SalvadorEnglandEritreaEthiopiaEuropeFijiFranceGermanyGhanaGreeceGrenadaGuatemalaGuyanaHaitiHondurasHong KongHungaryIndiaIndonesiaIranIraqIrelandIsraelItalyJamaicaJapanJordanKazakhstanKenyaKoreaKuwaitLaosLatin AmericaLatviaLebanonLiberiaLithuaniaMalaysiaMexicoMicronesiaMiddle AfricaMoldovaMoroccoNepalNetherlandsNicaraguaNigeriaNorth AmericaNorth MacedoniaNorthern AfricaNorthern EuropeNorwayOceaniaPakistanPanamaPeruPhilippinesPolandPortugalRomaniaRussiaSaudi ArabiaScotlandSenegalSerbiaSierra LeoneSingaporeSomaliaSouth AfricaSouth AmericaSouth Central AsiaSouth Eastern AsiaSouthern EuropeSpainSri LankaSt. Vincent and the GrenadinesSudanSwedenSwitzerlandSyriaTaiwanThailandTrinidad and TobagoTurkeyUgandaUkraineUruguayUzbekistanVenezuelaVietnamWest IndiesWestern AfricaWestern AsiaWestern EuropeYemenZaireZimbabweAzores
Cognitive Disability
Income
Poverty
Unemployment
Labor Participation
Family Structure
Vehicle Availability
Education Level
Disability

Cognitive Disability Comparison

Ecuadorians

Immigrants from Nigeria

Average
Tragic
17.2%
COGNITIVE DISABILITY
59.6/ 100
METRIC RATING
170th/ 347
METRIC RANK
18.0%
COGNITIVE DISABILITY
0.2/ 100
METRIC RATING
274th/ 347
METRIC RANK

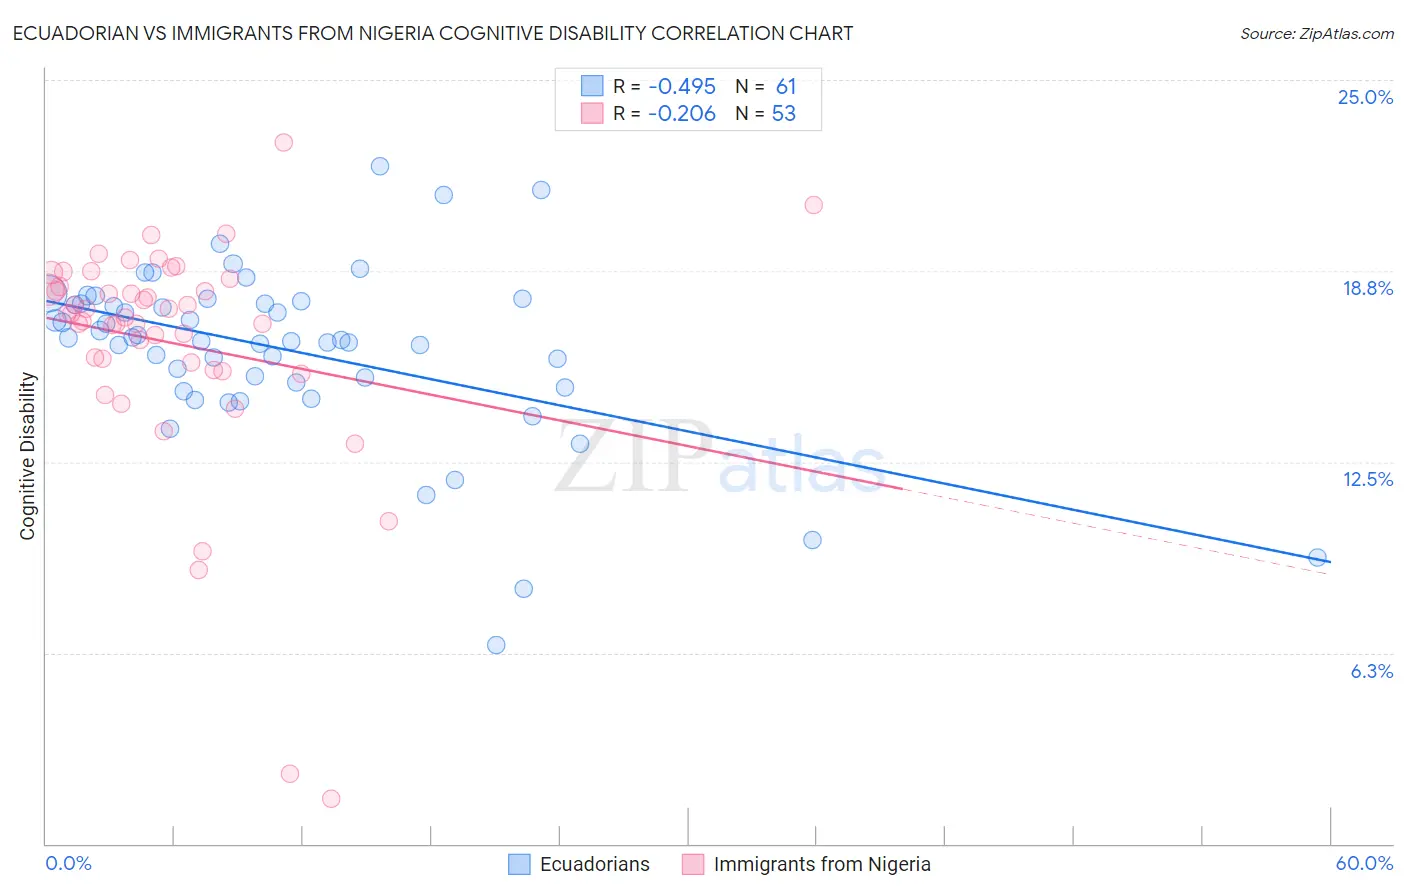
Ecuadorian vs Immigrants from Nigeria Cognitive Disability Correlation Chart

The statistical analysis conducted on geographies consisting of 317,812,387 people shows a moderate negative correlation between the proportion of Ecuadorians and percentage of population with cognitive disability in the United States with a correlation coefficient (R) of -0.495 and weighted average of 17.2%. Similarly, the statistical analysis conducted on geographies consisting of 283,477,063 people shows a weak negative correlation between the proportion of Immigrants from Nigeria and percentage of population with cognitive disability in the United States with a correlation coefficient (R) of -0.206 and weighted average of 18.0%, a difference of 4.7%.
Ecuadorian vs Immigrants from Nigeria Cognitive Disability

Cognitive Disability Correlation Summary

MeasurementEcuadorianImmigrants from Nigeria
Minimum6.5%1.5%
Maximum22.2%23.0%
Range15.7%21.5%
Mean16.2%16.4%
Median16.5%17.3%
Interquartile 25% (IQ1)15.0%15.6%
Interquartile 75% (IQ3)17.7%18.4%
Interquartile Range (IQR)2.7%2.7%
Standard Deviation (Sample)2.9%3.8%
Standard Deviation (Population)2.8%3.8%

Similar Demographics by Cognitive Disability

Demographics Similar to Ecuadorians by Cognitive Disability

In terms of cognitive disability, the demographic groups most similar to Ecuadorians are Tlingit-Haida (17.2%, a difference of 0.0%), Immigrants from Portugal (17.2%, a difference of 0.070%), Immigrants (17.2%, a difference of 0.090%), Immigrants from Turkey (17.2%, a difference of 0.090%), and Immigrants from Syria (17.2%, a difference of 0.12%).
DemographicsRating | RankCognitive Disability
Immigrants | Switzerland
71.5
/100
|
#163
Good
17.2%
Armenians
70.1
/100
|
#164
Good
17.2%
Immigrants | Albania
64.9
/100
|
#165
Good
17.2%
Immigrants | Ecuador
64.4
/100
|
#166
Good
17.2%
Immigrants | Syria
63.5
/100
|
#167
Good
17.2%
Immigrants | Immigrants
62.5
/100
|
#168
Good
17.2%
Immigrants | Portugal
61.8
/100
|
#169
Good
17.2%
Ecuadorians
59.6
/100
|
#170
Average
17.2%
Tlingit-Haida
59.4
/100
|
#171
Average
17.2%
Immigrants | Turkey
56.7
/100
|
#172
Average
17.2%
Immigrants | Northern Africa
50.2
/100
|
#173
Average
17.3%
Laotians
50.0
/100
|
#174
Average
17.3%
Tsimshian
49.8
/100
|
#175
Average
17.3%
Shoshone
49.2
/100
|
#176
Average
17.3%
Ute
49.1
/100
|
#177
Average
17.3%

Demographics Similar to Immigrants from Nigeria by Cognitive Disability

In terms of cognitive disability, the demographic groups most similar to Immigrants from Nigeria are Immigrants from Nepal (18.0%, a difference of 0.010%), Immigrants from Laos (18.1%, a difference of 0.10%), Immigrants from Honduras (18.0%, a difference of 0.13%), Potawatomi (18.0%, a difference of 0.14%), and Yuman (18.1%, a difference of 0.15%).
DemographicsRating | RankCognitive Disability
Nepalese
0.3
/100
|
#267
Tragic
18.0%
Cherokee
0.3
/100
|
#268
Tragic
18.0%
Hondurans
0.3
/100
|
#269
Tragic
18.0%
Immigrants | Bahamas
0.3
/100
|
#270
Tragic
18.0%
Potawatomi
0.2
/100
|
#271
Tragic
18.0%
Immigrants | Honduras
0.2
/100
|
#272
Tragic
18.0%
Immigrants | Nepal
0.2
/100
|
#273
Tragic
18.0%
Immigrants | Nigeria
0.2
/100
|
#274
Tragic
18.0%
Immigrants | Laos
0.2
/100
|
#275
Tragic
18.1%
Yuman
0.2
/100
|
#276
Tragic
18.1%
Immigrants | Kuwait
0.2
/100
|
#277
Tragic
18.1%
Immigrants | Micronesia
0.2
/100
|
#278
Tragic
18.1%
Chippewa
0.1
/100
|
#279
Tragic
18.1%
West Indians
0.1
/100
|
#280
Tragic
18.1%
Yakama
0.1
/100
|
#281
Tragic
18.1%