Dominican vs Iraqi Vision Disability
COMPARE
Dominican
Iraqi
Vision Disability
Vision Disability Comparison
Dominicans
Iraqis
2.6%
VISION DISABILITY
0.0/ 100
METRIC RATING
311th/ 347
METRIC RANK
2.1%
VISION DISABILITY
67.7/ 100
METRIC RATING
161st/ 347
METRIC RANK
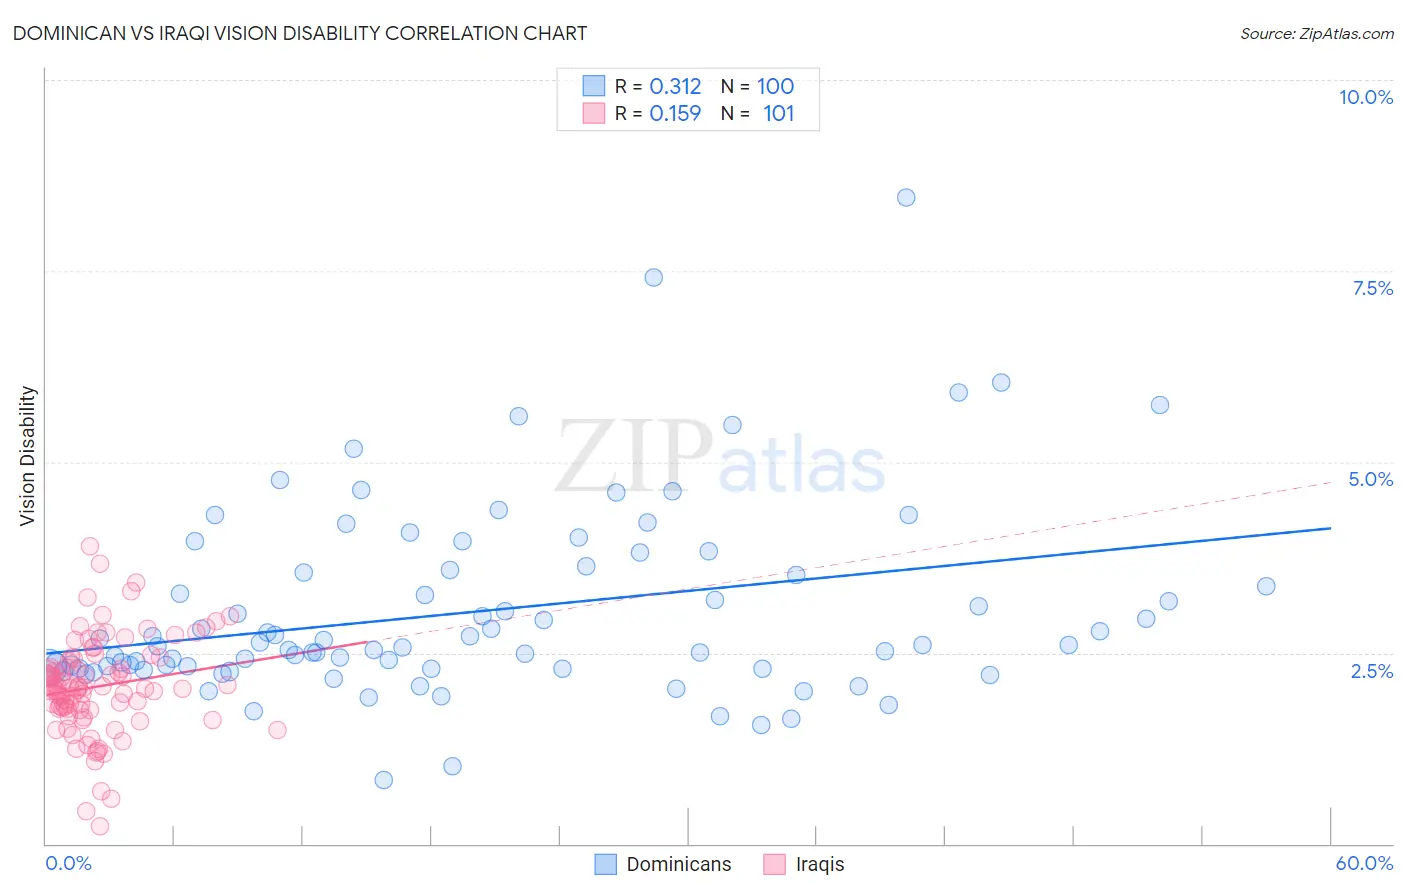
Dominican vs Iraqi Vision Disability Correlation Chart
The statistical analysis conducted on geographies consisting of 354,764,822 people shows a mild positive correlation between the proportion of Dominicans and percentage of population with vision disability in the United States with a correlation coefficient (R) of 0.312 and weighted average of 2.6%. Similarly, the statistical analysis conducted on geographies consisting of 170,621,066 people shows a poor positive correlation between the proportion of Iraqis and percentage of population with vision disability in the United States with a correlation coefficient (R) of 0.159 and weighted average of 2.1%, a difference of 22.7%.
Vision Disability Correlation Summary
| Measurement | Dominican | Iraqi |
| Minimum | 0.84% | 0.23% |
| Maximum | 8.5% | 3.9% |
| Range | 7.6% | 3.7% |
| Mean | 3.0% | 2.1% |
| Median | 2.6% | 2.0% |
| Interquartile 25% (IQ1) | 2.3% | 1.8% |
| Interquartile 75% (IQ3) | 3.6% | 2.4% |
| Interquartile Range (IQR) | 1.3% | 0.64% |
| Standard Deviation (Sample) | 1.3% | 0.63% |
| Standard Deviation (Population) | 1.3% | 0.63% |
Similar Demographics by Vision Disability
Demographics Similar to Dominicans by Vision Disability
In terms of vision disability, the demographic groups most similar to Dominicans are Blackfeet (2.6%, a difference of 0.040%), Immigrants from Yemen (2.6%, a difference of 0.37%), Arapaho (2.6%, a difference of 0.65%), Immigrants from Dominican Republic (2.6%, a difference of 0.67%), and Iroquois (2.6%, a difference of 0.70%).
| Demographics | Rating | Rank | Vision Disability |
| Aleuts | 0.0 /100 | #304 | Tragic 2.6% |
| Hispanics or Latinos | 0.0 /100 | #305 | Tragic 2.6% |
| Iroquois | 0.0 /100 | #306 | Tragic 2.6% |
| Immigrants | Dominican Republic | 0.0 /100 | #307 | Tragic 2.6% |
| Arapaho | 0.0 /100 | #308 | Tragic 2.6% |
| Immigrants | Yemen | 0.0 /100 | #309 | Tragic 2.6% |
| Blackfeet | 0.0 /100 | #310 | Tragic 2.6% |
| Dominicans | 0.0 /100 | #311 | Tragic 2.6% |
| Americans | 0.0 /100 | #312 | Tragic 2.6% |
| Potawatomi | 0.0 /100 | #313 | Tragic 2.6% |
| Inupiat | 0.0 /100 | #314 | Tragic 2.7% |
| Osage | 0.0 /100 | #315 | Tragic 2.7% |
| Shoshone | 0.0 /100 | #316 | Tragic 2.7% |
| Yup'ik | 0.0 /100 | #317 | Tragic 2.7% |
| Alaska Natives | 0.0 /100 | #318 | Tragic 2.7% |
Demographics Similar to Iraqis by Vision Disability
In terms of vision disability, the demographic groups most similar to Iraqis are Hungarian (2.1%, a difference of 0.030%), Austrian (2.1%, a difference of 0.090%), Icelander (2.1%, a difference of 0.12%), South African (2.1%, a difference of 0.15%), and Immigrants from Uzbekistan (2.1%, a difference of 0.16%).
| Demographics | Rating | Rank | Vision Disability |
| Slovenes | 73.6 /100 | #154 | Good 2.1% |
| Immigrants | Colombia | 72.1 /100 | #155 | Good 2.1% |
| Pakistanis | 71.6 /100 | #156 | Good 2.1% |
| Serbians | 70.2 /100 | #157 | Good 2.1% |
| Immigrants | Uzbekistan | 69.9 /100 | #158 | Good 2.1% |
| South Africans | 69.8 /100 | #159 | Good 2.1% |
| Austrians | 69.0 /100 | #160 | Good 2.1% |
| Iraqis | 67.7 /100 | #161 | Good 2.1% |
| Hungarians | 67.4 /100 | #162 | Good 2.1% |
| Icelanders | 66.1 /100 | #163 | Good 2.1% |
| Immigrants | Bangladesh | 65.5 /100 | #164 | Good 2.1% |
| Immigrants | Iraq | 64.8 /100 | #165 | Good 2.1% |
| Immigrants | England | 62.8 /100 | #166 | Good 2.1% |
| Immigrants | Africa | 62.6 /100 | #167 | Good 2.1% |
| Brazilians | 62.2 /100 | #168 | Good 2.1% |