Dominican vs Immigrants from Nigeria Ambulatory Disability
COMPARE
Dominican
Immigrants from Nigeria
Ambulatory Disability
Ambulatory Disability Comparison
Dominicans
Immigrants from Nigeria
7.2%
AMBULATORY DISABILITY
0.0/ 100
METRIC RATING
319th/ 347
METRIC RANK
5.9%
AMBULATORY DISABILITY
90.9/ 100
METRIC RATING
127th/ 347
METRIC RANK
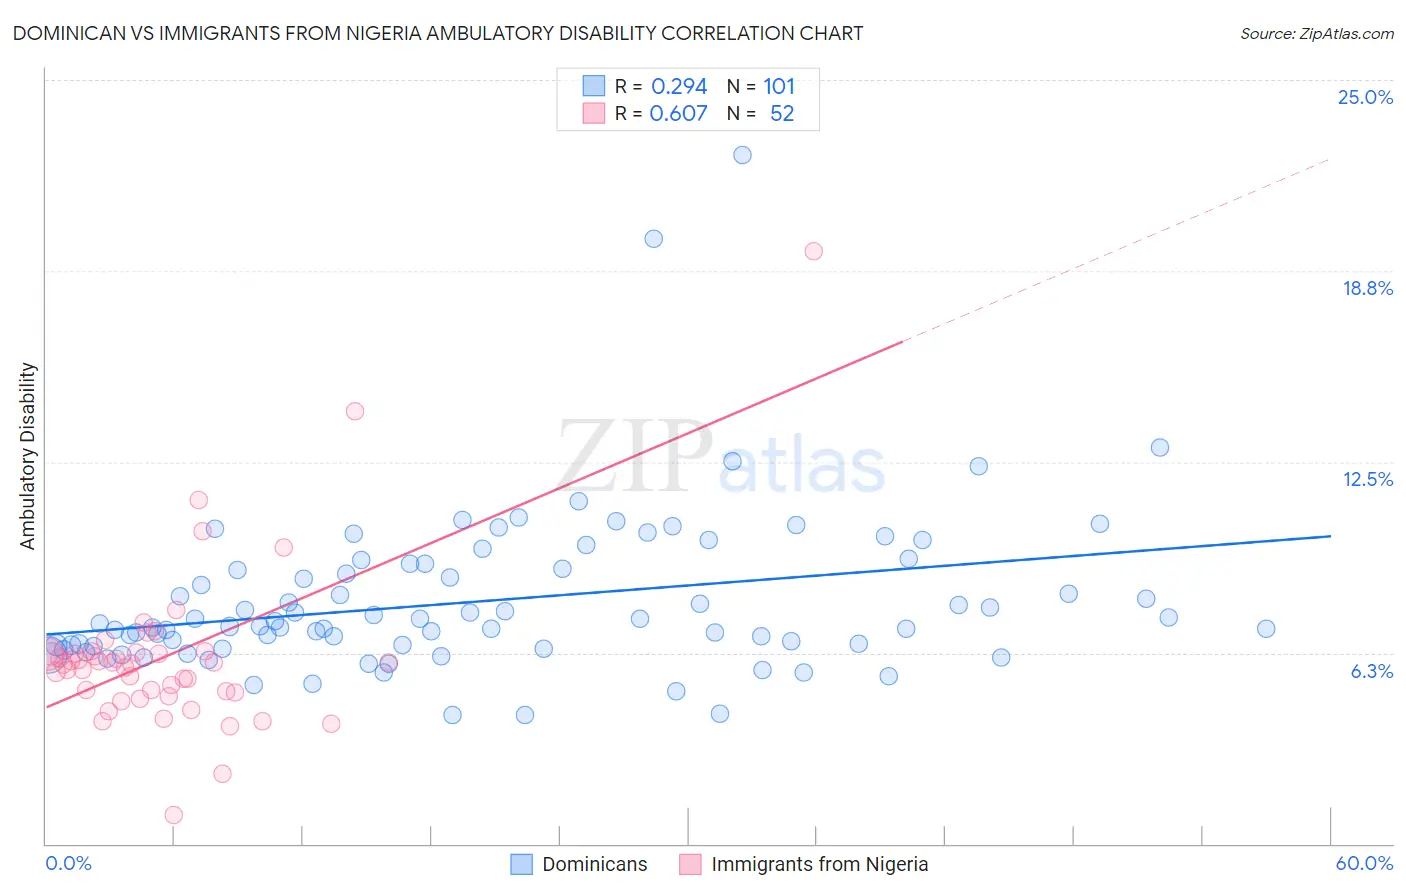
Dominican vs Immigrants from Nigeria Ambulatory Disability Correlation Chart
The statistical analysis conducted on geographies consisting of 354,945,896 people shows a weak positive correlation between the proportion of Dominicans and percentage of population with ambulatory disability in the United States with a correlation coefficient (R) of 0.294 and weighted average of 7.2%. Similarly, the statistical analysis conducted on geographies consisting of 283,430,784 people shows a significant positive correlation between the proportion of Immigrants from Nigeria and percentage of population with ambulatory disability in the United States with a correlation coefficient (R) of 0.607 and weighted average of 5.9%, a difference of 21.1%.
Ambulatory Disability Correlation Summary
| Measurement | Dominican | Immigrants from Nigeria |
| Minimum | 4.2% | 0.93% |
| Maximum | 22.5% | 19.4% |
| Range | 18.3% | 18.5% |
| Mean | 7.9% | 6.2% |
| Median | 7.1% | 5.9% |
| Interquartile 25% (IQ1) | 6.5% | 5.0% |
| Interquartile 75% (IQ3) | 9.1% | 6.2% |
| Interquartile Range (IQR) | 2.6% | 1.3% |
| Standard Deviation (Sample) | 2.6% | 2.8% |
| Standard Deviation (Population) | 2.6% | 2.7% |
Similar Demographics by Ambulatory Disability
Demographics Similar to Dominicans by Ambulatory Disability
In terms of ambulatory disability, the demographic groups most similar to Dominicans are Ottawa (7.2%, a difference of 0.33%), Central American Indian (7.2%, a difference of 0.42%), Immigrants from Dominican Republic (7.1%, a difference of 0.50%), Shoshone (7.1%, a difference of 0.74%), and Blackfeet (7.1%, a difference of 0.76%).
| Demographics | Rating | Rank | Ambulatory Disability |
| Delaware | 0.0 /100 | #312 | Tragic 7.1% |
| Immigrants | Yemen | 0.0 /100 | #313 | Tragic 7.1% |
| Blackfeet | 0.0 /100 | #314 | Tragic 7.1% |
| Shoshone | 0.0 /100 | #315 | Tragic 7.1% |
| Immigrants | Dominican Republic | 0.0 /100 | #316 | Tragic 7.1% |
| Central American Indians | 0.0 /100 | #317 | Tragic 7.2% |
| Ottawa | 0.0 /100 | #318 | Tragic 7.2% |
| Dominicans | 0.0 /100 | #319 | Tragic 7.2% |
| Potawatomi | 0.0 /100 | #320 | Tragic 7.3% |
| Apache | 0.0 /100 | #321 | Tragic 7.4% |
| Osage | 0.0 /100 | #322 | Tragic 7.4% |
| Americans | 0.0 /100 | #323 | Tragic 7.4% |
| Navajo | 0.0 /100 | #324 | Tragic 7.5% |
| Comanche | 0.0 /100 | #325 | Tragic 7.5% |
| Blacks/African Americans | 0.0 /100 | #326 | Tragic 7.5% |
Demographics Similar to Immigrants from Nigeria by Ambulatory Disability
In terms of ambulatory disability, the demographic groups most similar to Immigrants from Nigeria are Immigrants from Western Asia (5.9%, a difference of 0.040%), Immigrants from Norway (5.9%, a difference of 0.070%), Arab (5.9%, a difference of 0.10%), Korean (5.9%, a difference of 0.11%), and Immigrants from Kazakhstan (5.9%, a difference of 0.18%).
| Demographics | Rating | Rank | Ambulatory Disability |
| Estonians | 92.9 /100 | #120 | Exceptional 5.9% |
| Costa Ricans | 92.6 /100 | #121 | Exceptional 5.9% |
| Icelanders | 92.6 /100 | #122 | Exceptional 5.9% |
| Immigrants | Russia | 92.4 /100 | #123 | Exceptional 5.9% |
| Immigrants | Middle Africa | 92.2 /100 | #124 | Exceptional 5.9% |
| Koreans | 91.6 /100 | #125 | Exceptional 5.9% |
| Arabs | 91.5 /100 | #126 | Exceptional 5.9% |
| Immigrants | Nigeria | 90.9 /100 | #127 | Exceptional 5.9% |
| Immigrants | Western Asia | 90.7 /100 | #128 | Exceptional 5.9% |
| Immigrants | Norway | 90.5 /100 | #129 | Exceptional 5.9% |
| Immigrants | Kazakhstan | 89.7 /100 | #130 | Excellent 5.9% |
| Immigrants | Costa Rica | 89.5 /100 | #131 | Excellent 5.9% |
| Immigrants | Europe | 87.8 /100 | #132 | Excellent 6.0% |
| Immigrants | Immigrants | 86.9 /100 | #133 | Excellent 6.0% |
| Ute | 86.6 /100 | #134 | Excellent 6.0% |