Delaware vs Immigrants from Bolivia Disability Age 35 to 64

COMPARE

Delaware
Race
Ancestry
AfghanAfricanAlaska NativeAlaskan AthabascanAlbanianAleutAlsatianAmericanApacheArabArapahoArgentineanArmenianAssyrian/Chaldean/SyriacAustralianAustrianBahamianBangladeshiBarbadianBasqueBelgianBelizeanBermudanBhutaneseBlackfeetBolivianBrazilianBritishBritish West IndianBulgarianBurmeseCajunCambodianCanadianCape VerdeanCarpatho RusynCelticCentral AmericanCentral American IndianCherokeeCheyenneChickasawChileanChineseChippewaChoctawColombianColvilleComancheCosta RicanCreeCreekCroatianCrowCubanCypriotCzechCzechoslovakianDanishDelawareDominicanDutchDutch West IndianEastern EuropeanEcuadorianEgyptianEnglishEstonianEthiopianEuropeanFijianFilipinoFinnishFrenchFrench American IndianFrench CanadianGermanGerman RussianGhanaianGreekGuamanian/ChamorroGuatemalanGuyaneseHaitianHmongHonduranHopiHoumaHungarianIcelanderIndian (Asian)IndonesianInupiatIranianIraqiIrishIroquoisIsraeliItalianJamaicanJapaneseJordanianKenyanKiowaKoreanLaotianLatvianLebaneseLiberianLithuanianLumbeeLuxembourgerMacedonianMalaysianMalteseMarshalleseMenomineeMexicanMexican American IndianMongolianMoroccanNative HawaiianNavajoNepaleseNew ZealanderNicaraguanNigerianNorthern EuropeanNorwegianOkinawanOsageOttawaPaiutePakistaniPalestinianPanamanianParaguayanPennsylvania GermanPeruvianPimaPolishPortuguesePotawatomiPuebloPuerto RicanPuget Sound SalishRomanianRussianSalvadoranSamoanScandinavianScotch-IrishScottishSeminoleSenegaleseSerbianShoshoneSierra LeoneanSiouxSlavicSlovakSloveneSomaliSouth AfricanSouth AmericanSouth American IndianSoviet UnionSpaniardSpanishSpanish AmericanSpanish American IndianSri LankanSubsaharan AfricanSudaneseSwedishSwissSyrianTaiwaneseThaiTlingit-HaidaTohono O'OdhamTonganTrinidadian and TobagonianTsimshianTurkishU.S. Virgin IslanderUgandanUkrainianUruguayanUteVenezuelanVietnameseWelshWest IndianYakamaYaquiYugoslavianYumanYup'ikZimbabwean
Immigration
NonimmigrantsImmigrantsAfghanistanAfricaAlbaniaArgentinaArmeniaAsiaAustraliaAustriaBahamasBangladeshBarbadosBelarusBelgiumBelizeBosnia and HerzegovinaBrazilBulgariaBurma/MyanmarCabo VerdeCambodiaCameroonCanadaCaribbeanCentral AmericaChileChinaColombiaCongoCosta RicaCroatiaCubaCzechoslovakiaDenmarkDominicaDominican RepublicEastern AfricaEastern AsiaEastern EuropeEcuadorEgyptEl SalvadorEnglandEritreaEthiopiaEuropeFijiFranceGermanyGhanaGreeceGrenadaGuatemalaGuyanaHaitiHondurasHong KongHungaryIndiaIndonesiaIranIraqIrelandIsraelItalyJamaicaJapanJordanKazakhstanKenyaKoreaKuwaitLaosLatin AmericaLatviaLebanonLiberiaLithuaniaMalaysiaMexicoMicronesiaMiddle AfricaMoldovaMoroccoNepalNetherlandsNicaraguaNigeriaNorth AmericaNorth MacedoniaNorthern AfricaNorthern EuropeNorwayOceaniaPakistanPanamaPeruPhilippinesPolandPortugalRomaniaRussiaSaudi ArabiaScotlandSenegalSerbiaSierra LeoneSingaporeSomaliaSouth AfricaSouth AmericaSouth Central AsiaSouth Eastern AsiaSouthern EuropeSpainSri LankaSt. Vincent and the GrenadinesSudanSwedenSwitzerlandSyriaTaiwanThailandTrinidad and TobagoTurkeyUgandaUkraineUruguayUzbekistanVenezuelaVietnamWest IndiesWestern AfricaWestern AsiaWestern EuropeYemenZaireZimbabweAzores
Immigrants from Bolivia
Race
Ancestry
AfghanAfricanAlaska NativeAlaskan AthabascanAlbanianAleutAlsatianAmericanApacheArabArapahoArgentineanArmenianAssyrian/Chaldean/SyriacAustralianAustrianBahamianBangladeshiBarbadianBasqueBelgianBelizeanBermudanBhutaneseBlackfeetBolivianBrazilianBritishBritish West IndianBulgarianBurmeseCajunCambodianCanadianCape VerdeanCarpatho RusynCelticCentral AmericanCentral American IndianCherokeeCheyenneChickasawChileanChineseChippewaChoctawColombianColvilleComancheCosta RicanCreeCreekCroatianCrowCubanCypriotCzechCzechoslovakianDanishDominicanDutchDutch West IndianEastern EuropeanEcuadorianEgyptianEnglishEstonianEthiopianEuropeanFijianFilipinoFinnishFrenchFrench American IndianFrench CanadianGermanGerman RussianGhanaianGreekGuamanian/ChamorroGuatemalanGuyaneseHaitianHmongHonduranHopiHoumaHungarianIcelanderIndian (Asian)IndonesianInupiatIranianIraqiIrishIroquoisIsraeliItalianJamaicanJapaneseJordanianKenyanKiowaKoreanLaotianLatvianLebaneseLiberianLithuanianLumbeeLuxembourgerMacedonianMalaysianMalteseMarshalleseMenomineeMexicanMexican American IndianMongolianMoroccanNative HawaiianNavajoNepaleseNew ZealanderNicaraguanNigerianNorthern EuropeanNorwegianOkinawanOsageOttawaPaiutePakistaniPalestinianPanamanianParaguayanPennsylvania GermanPeruvianPimaPolishPortuguesePotawatomiPuebloPuerto RicanPuget Sound SalishRomanianRussianSalvadoranSamoanScandinavianScotch-IrishScottishSeminoleSenegaleseSerbianShoshoneSierra LeoneanSiouxSlavicSlovakSloveneSomaliSouth AfricanSouth AmericanSouth American IndianSoviet UnionSpaniardSpanishSpanish AmericanSpanish American IndianSri LankanSubsaharan AfricanSudaneseSwedishSwissSyrianTaiwaneseThaiTlingit-HaidaTohono O'OdhamTonganTrinidadian and TobagonianTsimshianTurkishU.S. Virgin IslanderUgandanUkrainianUruguayanUteVenezuelanVietnameseWelshWest IndianYakamaYaquiYugoslavianYumanYup'ikZimbabwean
Immigration
NonimmigrantsImmigrantsAfghanistanAfricaAlbaniaArgentinaArmeniaAsiaAustraliaAustriaBahamasBangladeshBarbadosBelarusBelgiumBelizeBoliviaBosnia and HerzegovinaBrazilBulgariaBurma/MyanmarCabo VerdeCambodiaCameroonCanadaCaribbeanCentral AmericaChileChinaColombiaCongoCosta RicaCroatiaCubaCzechoslovakiaDenmarkDominicaDominican RepublicEastern AfricaEastern AsiaEastern EuropeEcuadorEgyptEl SalvadorEnglandEritreaEthiopiaEuropeFijiFranceGermanyGhanaGreeceGrenadaGuatemalaGuyanaHaitiHondurasHong KongHungaryIndiaIndonesiaIranIraqIrelandIsraelItalyJamaicaJapanJordanKazakhstanKenyaKoreaKuwaitLaosLatin AmericaLatviaLebanonLiberiaLithuaniaMalaysiaMexicoMicronesiaMiddle AfricaMoldovaMoroccoNepalNetherlandsNicaraguaNigeriaNorth AmericaNorth MacedoniaNorthern AfricaNorthern EuropeNorwayOceaniaPakistanPanamaPeruPhilippinesPolandPortugalRomaniaRussiaSaudi ArabiaScotlandSenegalSerbiaSierra LeoneSingaporeSomaliaSouth AfricaSouth AmericaSouth Central AsiaSouth Eastern AsiaSouthern EuropeSpainSri LankaSt. Vincent and the GrenadinesSudanSwedenSwitzerlandSyriaTaiwanThailandTrinidad and TobagoTurkeyUgandaUkraineUruguayUzbekistanVenezuelaVietnamWest IndiesWestern AfricaWestern AsiaWestern EuropeYemenZaireZimbabweAzores
Disability Age 35 to 64
Income
Poverty
Unemployment
Labor Participation
Family Structure
Vehicle Availability
Education Level
Disability

Disability Age 35 to 64 Comparison

Delaware

Immigrants from Bolivia

Tragic
Exceptional
13.7%
DISABILITY AGE 35 TO 64
0.0/ 100
METRIC RATING
300th/ 347
METRIC RANK
8.7%
DISABILITY AGE 35 TO 64
100.0/ 100
METRIC RATING
10th/ 347
METRIC RANK

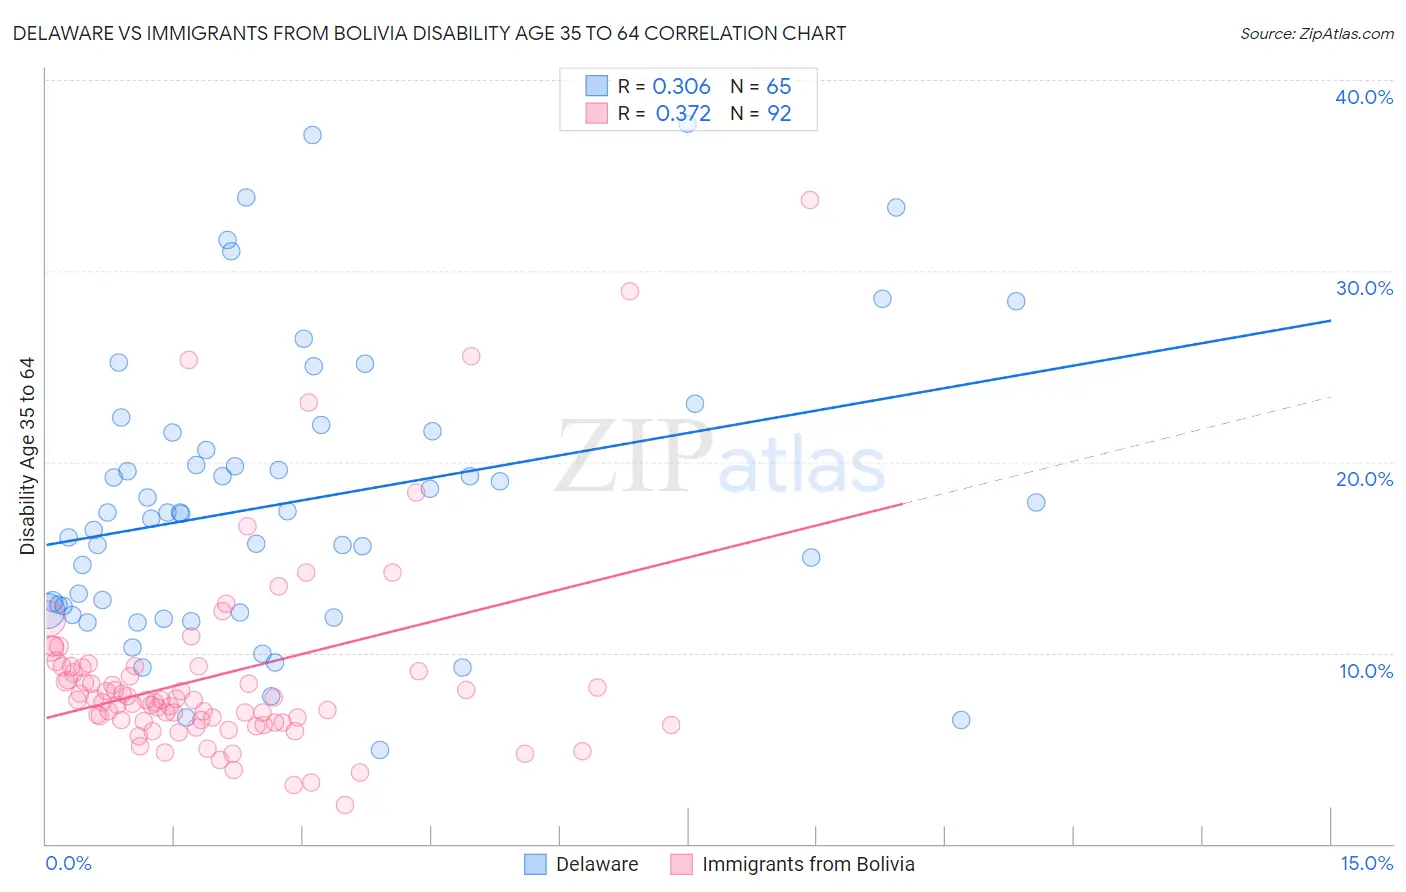
Delaware vs Immigrants from Bolivia Disability Age 35 to 64 Correlation Chart

The statistical analysis conducted on geographies consisting of 96,224,166 people shows a mild positive correlation between the proportion of Delaware and percentage of population with a disability between the ages 34 and 64 in the United States with a correlation coefficient (R) of 0.306 and weighted average of 13.7%. Similarly, the statistical analysis conducted on geographies consisting of 158,698,949 people shows a mild positive correlation between the proportion of Immigrants from Bolivia and percentage of population with a disability between the ages 34 and 64 in the United States with a correlation coefficient (R) of 0.372 and weighted average of 8.7%, a difference of 56.7%.
Delaware vs Immigrants from Bolivia Disability Age 35 to 64

Disability Age 35 to 64 Correlation Summary

MeasurementDelawareImmigrants from Bolivia
Minimum4.9%2.0%
Maximum37.7%33.7%
Range32.8%31.7%
Mean17.9%8.8%
Median17.3%7.5%
Interquartile 25% (IQ1)12.2%6.4%
Interquartile 75% (IQ3)21.6%9.2%
Interquartile Range (IQR)9.4%2.9%
Standard Deviation (Sample)7.4%5.3%
Standard Deviation (Population)7.4%5.2%

Similar Demographics by Disability Age 35 to 64

Demographics Similar to Delaware by Disability Age 35 to 64

In terms of disability age 35 to 64, the demographic groups most similar to Delaware are Spanish American (13.7%, a difference of 0.080%), Cheyenne (13.6%, a difference of 0.28%), French American Indian (13.7%, a difference of 0.30%), Bangladeshi (13.6%, a difference of 0.31%), and African (13.6%, a difference of 0.66%).
DemographicsRating | RankDisability Age 35 to 64
Ute
0.0
/100
|
#293
Tragic
13.4%
Yaqui
0.0
/100
|
#294
Tragic
13.5%
Yakama
0.0
/100
|
#295
Tragic
13.6%
Africans
0.0
/100
|
#296
Tragic
13.6%
Bangladeshis
0.0
/100
|
#297
Tragic
13.6%
Cheyenne
0.0
/100
|
#298
Tragic
13.6%
Spanish Americans
0.0
/100
|
#299
Tragic
13.7%
Delaware
0.0
/100
|
#300
Tragic
13.7%
French American Indians
0.0
/100
|
#301
Tragic
13.7%
Aleuts
0.0
/100
|
#302
Tragic
13.8%
Sioux
0.0
/100
|
#303
Tragic
13.9%
Hopi
0.0
/100
|
#304
Tragic
13.9%
Americans
0.0
/100
|
#305
Tragic
13.9%
Immigrants | Yemen
0.0
/100
|
#306
Tragic
14.0%
Blackfeet
0.0
/100
|
#307
Tragic
14.1%

Demographics Similar to Immigrants from Bolivia by Disability Age 35 to 64

In terms of disability age 35 to 64, the demographic groups most similar to Immigrants from Bolivia are Immigrants from China (8.7%, a difference of 0.27%), Iranian (8.7%, a difference of 0.70%), Immigrants from Eastern Asia (8.8%, a difference of 0.70%), Immigrants from Israel (8.6%, a difference of 1.3%), and Indian (Asian) (8.9%, a difference of 1.5%).
DemographicsRating | RankDisability Age 35 to 64
Immigrants | Hong Kong
100.0
/100
|
#3
Exceptional
8.2%
Immigrants | India
100.0
/100
|
#4
Exceptional
8.3%
Immigrants | Iran
100.0
/100
|
#5
Exceptional
8.5%
Thais
100.0
/100
|
#6
Exceptional
8.6%
Immigrants | Israel
100.0
/100
|
#7
Exceptional
8.6%
Iranians
100.0
/100
|
#8
Exceptional
8.7%
Immigrants | China
100.0
/100
|
#9
Exceptional
8.7%
Immigrants | Bolivia
100.0
/100
|
#10
Exceptional
8.7%
Immigrants | Eastern Asia
100.0
/100
|
#11
Exceptional
8.8%
Indians (Asian)
100.0
/100
|
#12
Exceptional
8.9%
Immigrants | South Central Asia
100.0
/100
|
#13
Exceptional
8.9%
Immigrants | Singapore
100.0
/100
|
#14
Exceptional
8.9%
Bolivians
100.0
/100
|
#15
Exceptional
8.9%
Immigrants | Korea
100.0
/100
|
#16
Exceptional
9.0%
Burmese
100.0
/100
|
#17
Exceptional
9.2%