Danish vs Dutch West Indian Cognitive Disability
COMPARE
Danish
Dutch West Indian
Cognitive Disability
Cognitive Disability Comparison
Danes
Dutch West Indians
16.7%
COGNITIVE DISABILITY
98.8/ 100
METRIC RATING
91st/ 347
METRIC RANK
18.1%
COGNITIVE DISABILITY
0.1/ 100
METRIC RATING
287th/ 347
METRIC RANK
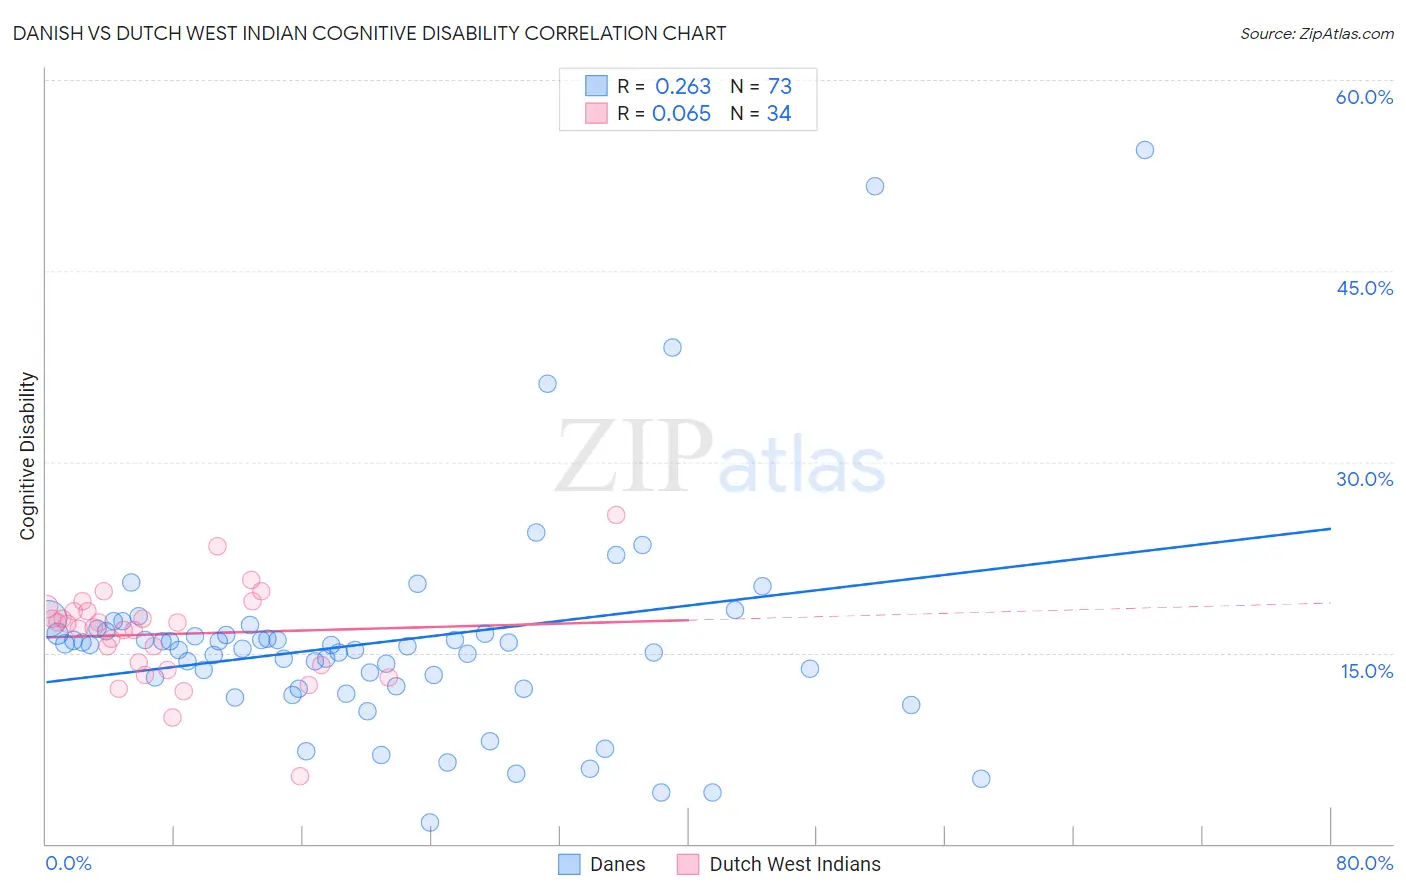
Danish vs Dutch West Indian Cognitive Disability Correlation Chart
The statistical analysis conducted on geographies consisting of 474,128,115 people shows a weak positive correlation between the proportion of Danes and percentage of population with cognitive disability in the United States with a correlation coefficient (R) of 0.263 and weighted average of 16.7%. Similarly, the statistical analysis conducted on geographies consisting of 85,769,565 people shows a slight positive correlation between the proportion of Dutch West Indians and percentage of population with cognitive disability in the United States with a correlation coefficient (R) of 0.065 and weighted average of 18.1%, a difference of 8.4%.
Cognitive Disability Correlation Summary
| Measurement | Danish | Dutch West Indian |
| Minimum | 1.7% | 5.3% |
| Maximum | 54.5% | 25.8% |
| Range | 52.9% | 20.5% |
| Mean | 15.8% | 16.5% |
| Median | 15.5% | 17.1% |
| Interquartile 25% (IQ1) | 12.3% | 14.0% |
| Interquartile 75% (IQ3) | 16.6% | 18.3% |
| Interquartile Range (IQR) | 4.3% | 4.2% |
| Standard Deviation (Sample) | 8.6% | 3.8% |
| Standard Deviation (Population) | 8.6% | 3.7% |
Similar Demographics by Cognitive Disability
Demographics Similar to Danes by Cognitive Disability
In terms of cognitive disability, the demographic groups most similar to Danes are Immigrants from Egypt (16.7%, a difference of 0.010%), South American (16.7%, a difference of 0.010%), Immigrants from South America (16.7%, a difference of 0.010%), Immigrants from Southern Europe (16.7%, a difference of 0.020%), and Asian (16.7%, a difference of 0.060%).
| Demographics | Rating | Rank | Cognitive Disability |
| Belgians | 99.1 /100 | #84 | Exceptional 16.7% |
| Immigrants | Moldova | 99.1 /100 | #85 | Exceptional 16.7% |
| Immigrants | South Africa | 99.0 /100 | #86 | Exceptional 16.7% |
| Native Hawaiians | 99.0 /100 | #87 | Exceptional 16.7% |
| Immigrants | Philippines | 99.0 /100 | #88 | Exceptional 16.7% |
| Immigrants | Egypt | 98.8 /100 | #89 | Exceptional 16.7% |
| South Americans | 98.8 /100 | #90 | Exceptional 16.7% |
| Danes | 98.8 /100 | #91 | Exceptional 16.7% |
| Immigrants | South America | 98.8 /100 | #92 | Exceptional 16.7% |
| Immigrants | Southern Europe | 98.7 /100 | #93 | Exceptional 16.7% |
| Asians | 98.7 /100 | #94 | Exceptional 16.7% |
| English | 98.6 /100 | #95 | Exceptional 16.8% |
| Finns | 98.5 /100 | #96 | Exceptional 16.8% |
| Dutch | 98.5 /100 | #97 | Exceptional 16.8% |
| Immigrants | Lebanon | 98.4 /100 | #98 | Exceptional 16.8% |
Demographics Similar to Dutch West Indians by Cognitive Disability
In terms of cognitive disability, the demographic groups most similar to Dutch West Indians are Immigrants from West Indies (18.1%, a difference of 0.010%), Native/Alaskan (18.1%, a difference of 0.020%), Kenyan (18.1%, a difference of 0.040%), Immigrants from Africa (18.1%, a difference of 0.050%), and Bermudan (18.1%, a difference of 0.080%).
| Demographics | Rating | Rank | Cognitive Disability |
| West Indians | 0.1 /100 | #280 | Tragic 18.1% |
| Yakama | 0.1 /100 | #281 | Tragic 18.1% |
| Immigrants | Cambodia | 0.1 /100 | #282 | Tragic 18.1% |
| Nigerians | 0.1 /100 | #283 | Tragic 18.1% |
| Immigrants | Uganda | 0.1 /100 | #284 | Tragic 18.1% |
| Bermudans | 0.1 /100 | #285 | Tragic 18.1% |
| Kenyans | 0.1 /100 | #286 | Tragic 18.1% |
| Dutch West Indians | 0.1 /100 | #287 | Tragic 18.1% |
| Immigrants | West Indies | 0.1 /100 | #288 | Tragic 18.1% |
| Natives/Alaskans | 0.1 /100 | #289 | Tragic 18.1% |
| Immigrants | Africa | 0.1 /100 | #290 | Tragic 18.1% |
| Ottawa | 0.1 /100 | #291 | Tragic 18.2% |
| Iroquois | 0.1 /100 | #292 | Tragic 18.2% |
| Central American Indians | 0.1 /100 | #293 | Tragic 18.2% |
| British West Indians | 0.1 /100 | #294 | Tragic 18.2% |