Czech vs Uruguayan Disability Age Over 75
COMPARE
Czech
Uruguayan
Disability Age Over 75
Disability Age Over 75 Comparison
Czechs
Uruguayans
45.7%
DISABILITY AGE OVER 75
99.8/ 100
METRIC RATING
43rd/ 347
METRIC RANK
46.2%
DISABILITY AGE OVER 75
98.4/ 100
METRIC RATING
88th/ 347
METRIC RANK
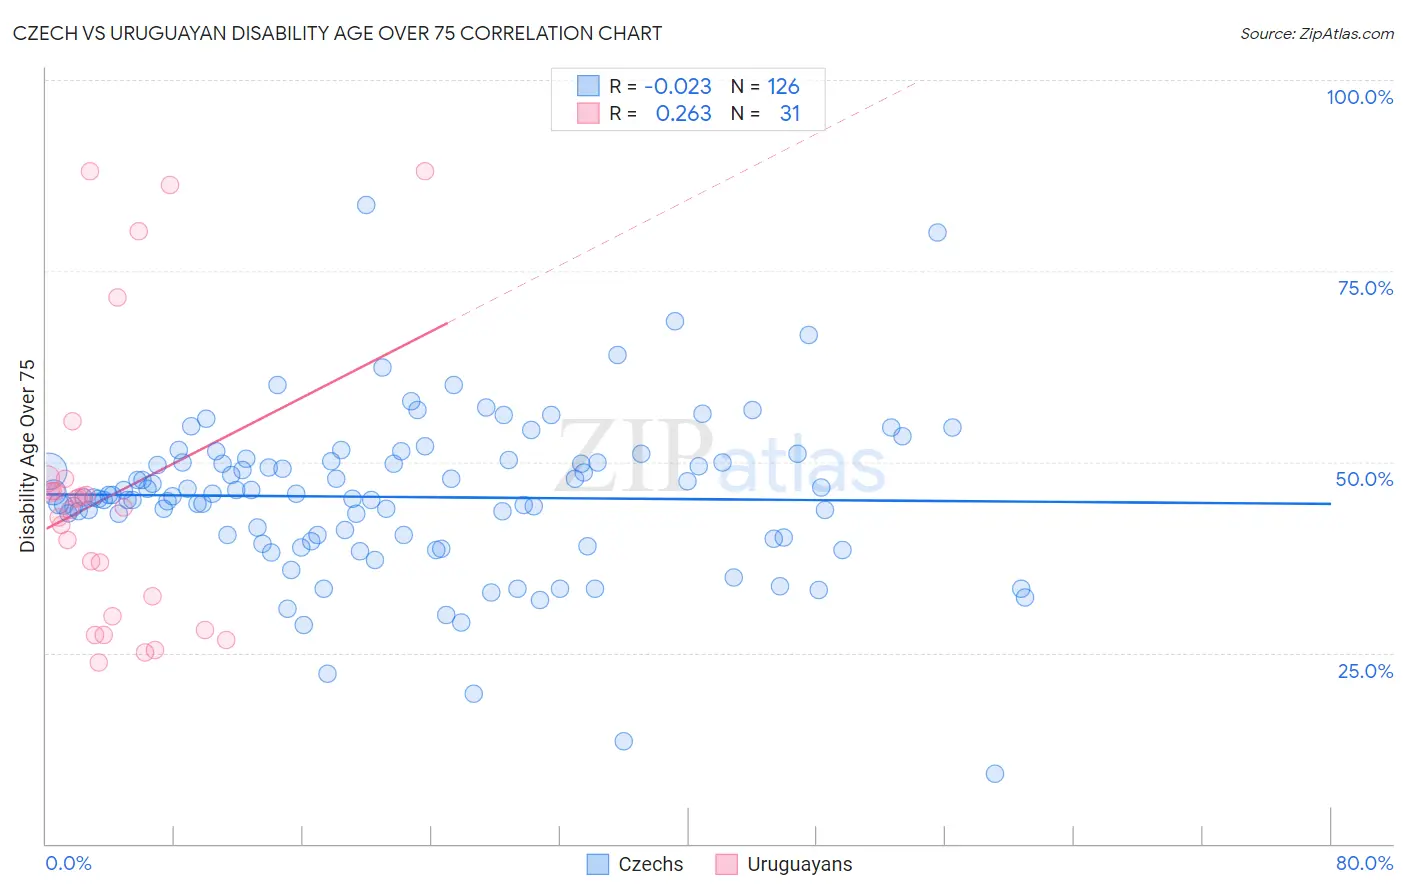
Czech vs Uruguayan Disability Age Over 75 Correlation Chart
The statistical analysis conducted on geographies consisting of 483,617,393 people shows no correlation between the proportion of Czechs and percentage of population with a disability over the age of 75 in the United States with a correlation coefficient (R) of -0.023 and weighted average of 45.7%. Similarly, the statistical analysis conducted on geographies consisting of 144,749,021 people shows a weak positive correlation between the proportion of Uruguayans and percentage of population with a disability over the age of 75 in the United States with a correlation coefficient (R) of 0.263 and weighted average of 46.2%, a difference of 1.3%.
Disability Age Over 75 Correlation Summary
| Measurement | Czech | Uruguayan |
| Minimum | 9.1% | 23.7% |
| Maximum | 83.6% | 88.0% |
| Range | 74.6% | 64.4% |
| Mean | 45.4% | 45.7% |
| Median | 45.6% | 44.0% |
| Interquartile 25% (IQ1) | 40.1% | 29.8% |
| Interquartile 75% (IQ3) | 50.0% | 47.7% |
| Interquartile Range (IQR) | 9.9% | 17.9% |
| Standard Deviation (Sample) | 10.4% | 18.7% |
| Standard Deviation (Population) | 10.4% | 18.4% |
Similar Demographics by Disability Age Over 75
Demographics Similar to Czechs by Disability Age Over 75
In terms of disability age over 75, the demographic groups most similar to Czechs are Greek (45.6%, a difference of 0.0%), Australian (45.7%, a difference of 0.040%), Turkish (45.7%, a difference of 0.040%), Immigrants from Singapore (45.6%, a difference of 0.050%), and Swedish (45.7%, a difference of 0.070%).
| Demographics | Rating | Rank | Disability Age Over 75 |
| Immigrants | Taiwan | 99.9 /100 | #36 | Exceptional 45.5% |
| South Africans | 99.9 /100 | #37 | Exceptional 45.5% |
| Italians | 99.9 /100 | #38 | Exceptional 45.6% |
| Estonians | 99.9 /100 | #39 | Exceptional 45.6% |
| Slovenes | 99.9 /100 | #40 | Exceptional 45.6% |
| Immigrants | Singapore | 99.8 /100 | #41 | Exceptional 45.6% |
| Greeks | 99.8 /100 | #42 | Exceptional 45.6% |
| Czechs | 99.8 /100 | #43 | Exceptional 45.7% |
| Australians | 99.8 /100 | #44 | Exceptional 45.7% |
| Turks | 99.8 /100 | #45 | Exceptional 45.7% |
| Swedes | 99.8 /100 | #46 | Exceptional 45.7% |
| Immigrants | Canada | 99.8 /100 | #47 | Exceptional 45.7% |
| Croatians | 99.8 /100 | #48 | Exceptional 45.7% |
| Immigrants | North America | 99.8 /100 | #49 | Exceptional 45.7% |
| Belgians | 99.7 /100 | #50 | Exceptional 45.8% |
Demographics Similar to Uruguayans by Disability Age Over 75
In terms of disability age over 75, the demographic groups most similar to Uruguayans are Immigrants from Saudi Arabia (46.3%, a difference of 0.010%), Northern European (46.3%, a difference of 0.020%), Immigrants from Egypt (46.3%, a difference of 0.030%), Danish (46.2%, a difference of 0.080%), and German (46.3%, a difference of 0.080%).
| Demographics | Rating | Rank | Disability Age Over 75 |
| New Zealanders | 98.8 /100 | #81 | Exceptional 46.2% |
| Immigrants | Latvia | 98.7 /100 | #82 | Exceptional 46.2% |
| Argentineans | 98.7 /100 | #83 | Exceptional 46.2% |
| Immigrants | Jordan | 98.7 /100 | #84 | Exceptional 46.2% |
| Immigrants | Southern Europe | 98.6 /100 | #85 | Exceptional 46.2% |
| Romanians | 98.6 /100 | #86 | Exceptional 46.2% |
| Danes | 98.6 /100 | #87 | Exceptional 46.2% |
| Uruguayans | 98.4 /100 | #88 | Exceptional 46.2% |
| Immigrants | Saudi Arabia | 98.4 /100 | #89 | Exceptional 46.3% |
| Northern Europeans | 98.3 /100 | #90 | Exceptional 46.3% |
| Immigrants | Egypt | 98.3 /100 | #91 | Exceptional 46.3% |
| Germans | 98.2 /100 | #92 | Exceptional 46.3% |
| Ugandans | 98.2 /100 | #93 | Exceptional 46.3% |
| Albanians | 98.1 /100 | #94 | Exceptional 46.3% |
| Immigrants | Brazil | 98.0 /100 | #95 | Exceptional 46.3% |