Cuban vs Eastern European Disability Age Over 75

COMPARE

Cuban
Race
Ancestry
AfghanAfricanAlaska NativeAlaskan AthabascanAlbanianAleutAlsatianAmericanApacheArabArapahoArgentineanArmenianAssyrian/Chaldean/SyriacAustralianAustrianBahamianBangladeshiBarbadianBasqueBelgianBelizeanBermudanBhutaneseBlackfeetBolivianBrazilianBritishBritish West IndianBulgarianBurmeseCajunCambodianCanadianCape VerdeanCarpatho RusynCelticCentral AmericanCentral American IndianCherokeeCheyenneChickasawChileanChineseChippewaChoctawColombianColvilleComancheCosta RicanCreeCreekCroatianCrowCubanCypriotCzechCzechoslovakianDanishDelawareDominicanDutchDutch West IndianEcuadorianEgyptianEnglishEstonianEthiopianEuropeanFijianFilipinoFinnishFrenchFrench American IndianFrench CanadianGermanGerman RussianGhanaianGreekGuamanian/ChamorroGuatemalanGuyaneseHaitianHmongHonduranHopiHoumaHungarianIcelanderIndian (Asian)IndonesianInupiatIranianIraqiIrishIroquoisIsraeliItalianJamaicanJapaneseJordanianKenyanKiowaKoreanLaotianLatvianLebaneseLiberianLithuanianLumbeeLuxembourgerMacedonianMalaysianMalteseMarshalleseMenomineeMexicanMexican American IndianMongolianMoroccanNative HawaiianNavajoNepaleseNew ZealanderNicaraguanNigerianNorthern EuropeanNorwegianOkinawanOsageOttawaPaiutePakistaniPalestinianPanamanianParaguayanPennsylvania GermanPeruvianPimaPolishPortuguesePotawatomiPuebloPuerto RicanPuget Sound SalishRomanianRussianSalvadoranSamoanScandinavianScotch-IrishScottishSeminoleSenegaleseSerbianShoshoneSierra LeoneanSiouxSlavicSlovakSloveneSomaliSouth AfricanSouth AmericanSouth American IndianSoviet UnionSpaniardSpanishSpanish AmericanSpanish American IndianSri LankanSubsaharan AfricanSudaneseSwedishSwissSyrianTaiwaneseThaiTlingit-HaidaTohono O'OdhamTonganTrinidadian and TobagonianTsimshianTurkishU.S. Virgin IslanderUgandanUkrainianUruguayanUteVenezuelanVietnameseWelshWest IndianYakamaYaquiYugoslavianYumanYup'ikZimbabwean
Immigration
NonimmigrantsImmigrantsAfghanistanAfricaAlbaniaArgentinaArmeniaAsiaAustraliaAustriaBahamasBangladeshBarbadosBelarusBelgiumBelizeBoliviaBosnia and HerzegovinaBrazilBulgariaBurma/MyanmarCabo VerdeCambodiaCameroonCanadaCaribbeanCentral AmericaChileChinaColombiaCongoCosta RicaCroatiaCubaCzechoslovakiaDenmarkDominicaDominican RepublicEastern AfricaEastern AsiaEastern EuropeEcuadorEgyptEl SalvadorEnglandEritreaEthiopiaEuropeFijiFranceGermanyGhanaGreeceGrenadaGuatemalaGuyanaHaitiHondurasHong KongHungaryIndiaIndonesiaIranIraqIrelandIsraelItalyJamaicaJapanJordanKazakhstanKenyaKoreaKuwaitLaosLatin AmericaLatviaLebanonLiberiaLithuaniaMalaysiaMexicoMicronesiaMiddle AfricaMoldovaMoroccoNepalNetherlandsNicaraguaNigeriaNorth AmericaNorth MacedoniaNorthern AfricaNorthern EuropeNorwayOceaniaPakistanPanamaPeruPhilippinesPolandPortugalRomaniaRussiaSaudi ArabiaScotlandSenegalSerbiaSierra LeoneSingaporeSomaliaSouth AfricaSouth AmericaSouth Central AsiaSouth Eastern AsiaSouthern EuropeSpainSri LankaSt. Vincent and the GrenadinesSudanSwedenSwitzerlandSyriaTaiwanThailandTrinidad and TobagoTurkeyUgandaUkraineUruguayUzbekistanVenezuelaVietnamWest IndiesWestern AfricaWestern AsiaWestern EuropeYemenZaireZimbabweAzores
Eastern European
Race
Ancestry
AfghanAfricanAlaska NativeAlaskan AthabascanAlbanianAleutAlsatianAmericanApacheArabArapahoArgentineanArmenianAssyrian/Chaldean/SyriacAustralianAustrianBahamianBangladeshiBarbadianBasqueBelgianBelizeanBermudanBhutaneseBlackfeetBolivianBrazilianBritishBritish West IndianBulgarianBurmeseCajunCambodianCanadianCape VerdeanCarpatho RusynCelticCentral AmericanCentral American IndianCherokeeCheyenneChickasawChileanChineseChippewaChoctawColombianColvilleComancheCosta RicanCreeCreekCroatianCrowCypriotCzechCzechoslovakianDanishDelawareDominicanDutchDutch West IndianEastern EuropeanEcuadorianEgyptianEnglishEstonianEthiopianEuropeanFijianFilipinoFinnishFrenchFrench American IndianFrench CanadianGermanGerman RussianGhanaianGreekGuamanian/ChamorroGuatemalanGuyaneseHaitianHmongHonduranHopiHoumaHungarianIcelanderIndian (Asian)IndonesianInupiatIranianIraqiIrishIroquoisIsraeliItalianJamaicanJapaneseJordanianKenyanKiowaKoreanLaotianLatvianLebaneseLiberianLithuanianLumbeeLuxembourgerMacedonianMalaysianMalteseMarshalleseMenomineeMexicanMexican American IndianMongolianMoroccanNative HawaiianNavajoNepaleseNew ZealanderNicaraguanNigerianNorthern EuropeanNorwegianOkinawanOsageOttawaPaiutePakistaniPalestinianPanamanianParaguayanPennsylvania GermanPeruvianPimaPolishPortuguesePotawatomiPuebloPuerto RicanPuget Sound SalishRomanianRussianSalvadoranSamoanScandinavianScotch-IrishScottishSeminoleSenegaleseSerbianShoshoneSierra LeoneanSiouxSlavicSlovakSloveneSomaliSouth AfricanSouth AmericanSouth American IndianSoviet UnionSpaniardSpanishSpanish AmericanSpanish American IndianSri LankanSubsaharan AfricanSudaneseSwedishSwissSyrianTaiwaneseThaiTlingit-HaidaTohono O'OdhamTonganTrinidadian and TobagonianTsimshianTurkishU.S. Virgin IslanderUgandanUkrainianUruguayanUteVenezuelanVietnameseWelshWest IndianYakamaYaquiYugoslavianYumanYup'ikZimbabwean
Immigration
NonimmigrantsImmigrantsAfghanistanAfricaAlbaniaArgentinaArmeniaAsiaAustraliaAustriaBahamasBangladeshBarbadosBelarusBelgiumBelizeBoliviaBosnia and HerzegovinaBrazilBulgariaBurma/MyanmarCabo VerdeCambodiaCameroonCanadaCaribbeanCentral AmericaChileChinaColombiaCongoCosta RicaCroatiaCubaCzechoslovakiaDenmarkDominicaDominican RepublicEastern AfricaEastern AsiaEastern EuropeEcuadorEgyptEl SalvadorEnglandEritreaEthiopiaEuropeFijiFranceGermanyGhanaGreeceGrenadaGuatemalaGuyanaHaitiHondurasHong KongHungaryIndiaIndonesiaIranIraqIrelandIsraelItalyJamaicaJapanJordanKazakhstanKenyaKoreaKuwaitLaosLatin AmericaLatviaLebanonLiberiaLithuaniaMalaysiaMexicoMicronesiaMiddle AfricaMoldovaMoroccoNepalNetherlandsNicaraguaNigeriaNorth AmericaNorth MacedoniaNorthern AfricaNorthern EuropeNorwayOceaniaPakistanPanamaPeruPhilippinesPolandPortugalRomaniaRussiaSaudi ArabiaScotlandSenegalSerbiaSierra LeoneSingaporeSomaliaSouth AfricaSouth AmericaSouth Central AsiaSouth Eastern AsiaSouthern EuropeSpainSri LankaSt. Vincent and the GrenadinesSudanSwedenSwitzerlandSyriaTaiwanThailandTrinidad and TobagoTurkeyUgandaUkraineUruguayUzbekistanVenezuelaVietnamWest IndiesWestern AfricaWestern AsiaWestern EuropeYemenZaireZimbabweAzores
Disability Age Over 75
Income
Poverty
Unemployment
Labor Participation
Family Structure
Vehicle Availability
Education Level
Disability

Disability Age Over 75 Comparison

Cubans

Eastern Europeans

Average
Exceptional
47.4%
DISABILITY AGE OVER 75
42.1/ 100
METRIC RATING
178th/ 347
METRIC RANK
44.8%
DISABILITY AGE OVER 75
100.0/ 100
METRIC RATING
3rd/ 347
METRIC RANK

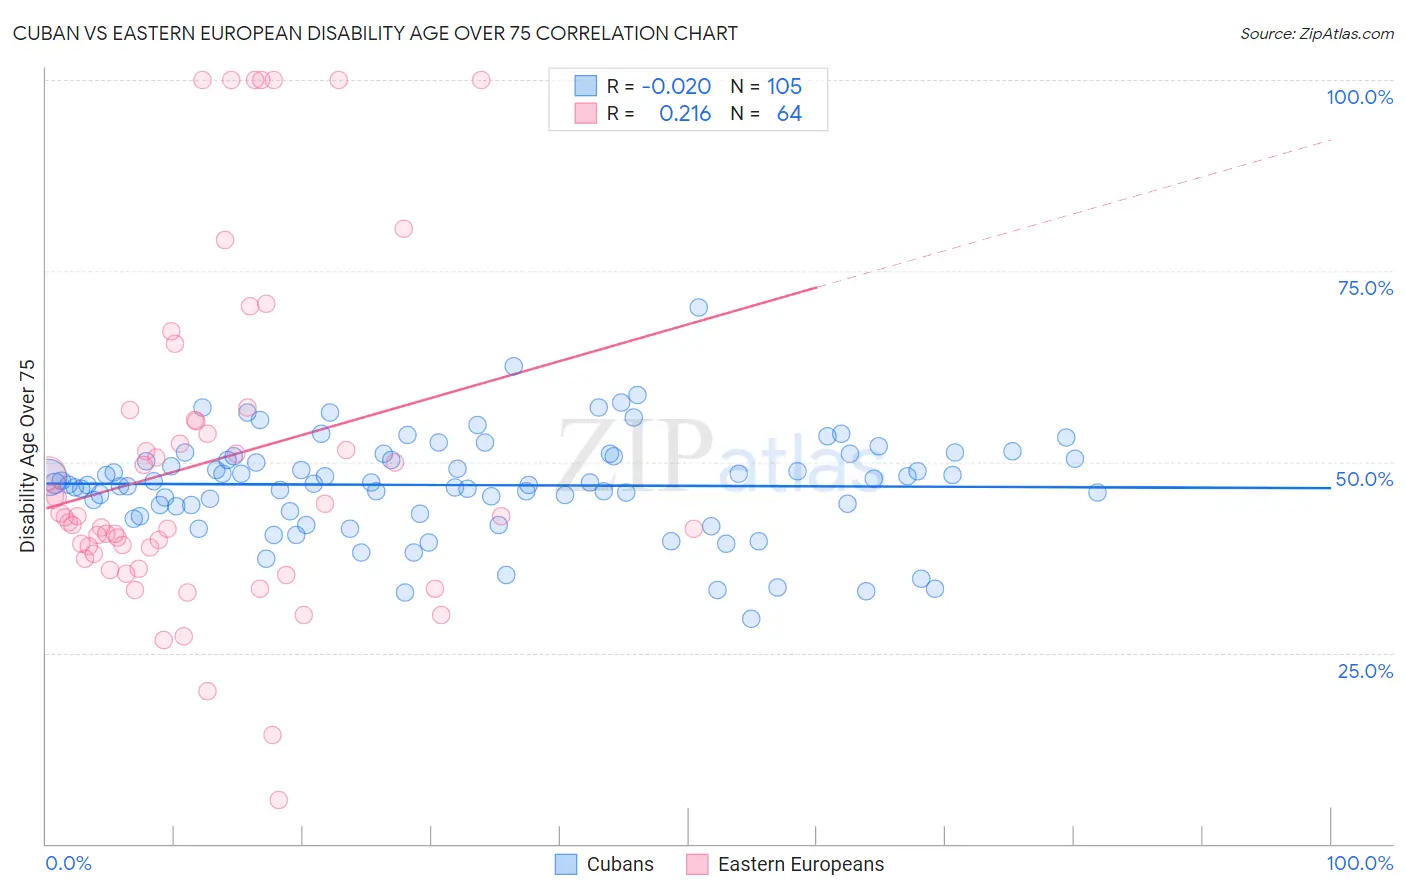
Cuban vs Eastern European Disability Age Over 75 Correlation Chart

The statistical analysis conducted on geographies consisting of 448,287,267 people shows no correlation between the proportion of Cubans and percentage of population with a disability over the age of 75 in the United States with a correlation coefficient (R) of -0.020 and weighted average of 47.4%. Similarly, the statistical analysis conducted on geographies consisting of 460,398,021 people shows a weak positive correlation between the proportion of Eastern Europeans and percentage of population with a disability over the age of 75 in the United States with a correlation coefficient (R) of 0.216 and weighted average of 44.8%, a difference of 5.9%.
Cuban vs Eastern European Disability Age Over 75

Disability Age Over 75 Correlation Summary

MeasurementCubanEastern European
Minimum29.4%5.7%
Maximum70.3%100.0%
Range40.8%94.3%
Mean47.0%49.9%
Median47.2%42.8%
Interquartile 25% (IQ1)43.9%37.7%
Interquartile 75% (IQ3)50.7%55.5%
Interquartile Range (IQR)6.9%17.8%
Standard Deviation (Sample)6.6%22.1%
Standard Deviation (Population)6.6%21.9%

Similar Demographics by Disability Age Over 75

Demographics Similar to Cubans by Disability Age Over 75

In terms of disability age over 75, the demographic groups most similar to Cubans are Sierra Leonean (47.4%, a difference of 0.010%), Immigrants from Ecuador (47.4%, a difference of 0.010%), Immigrants from Kazakhstan (47.4%, a difference of 0.040%), Immigrants from Moldova (47.4%, a difference of 0.050%), and Haitian (47.4%, a difference of 0.060%).
DemographicsRating | RankDisability Age Over 75
Immigrants | Africa
53.6
/100
|
#171
Average
47.3%
Scotch-Irish
52.5
/100
|
#172
Average
47.3%
Alsatians
51.9
/100
|
#173
Average
47.3%
Whites/Caucasians
50.0
/100
|
#174
Average
47.3%
Immigrants | Haiti
49.7
/100
|
#175
Average
47.3%
Ecuadorians
46.7
/100
|
#176
Average
47.4%
Haitians
44.6
/100
|
#177
Average
47.4%
Cubans
42.1
/100
|
#178
Average
47.4%
Sierra Leoneans
41.7
/100
|
#179
Average
47.4%
Immigrants | Ecuador
41.7
/100
|
#180
Average
47.4%
Immigrants | Kazakhstan
40.4
/100
|
#181
Average
47.4%
Immigrants | Moldova
39.9
/100
|
#182
Fair
47.4%
Delaware
39.1
/100
|
#183
Fair
47.5%
Immigrants | Nigeria
34.0
/100
|
#184
Fair
47.5%
Ghanaians
33.0
/100
|
#185
Fair
47.5%

Demographics Similar to Eastern Europeans by Disability Age Over 75

In terms of disability age over 75, the demographic groups most similar to Eastern Europeans are Carpatho Rusyn (44.8%, a difference of 0.030%), Luxembourger (44.8%, a difference of 0.090%), Immigrants from Lithuania (44.9%, a difference of 0.18%), Okinawan (44.9%, a difference of 0.22%), and Immigrants from Ireland (44.7%, a difference of 0.29%).
DemographicsRating | RankDisability Age Over 75
Cypriots
100.0
/100
|
#1
Exceptional
43.5%
Immigrants | Ireland
100.0
/100
|
#2
Exceptional
44.7%
Eastern Europeans
100.0
/100
|
#3
Exceptional
44.8%
Carpatho Rusyns
100.0
/100
|
#4
Exceptional
44.8%
Luxembourgers
100.0
/100
|
#5
Exceptional
44.8%
Immigrants | Lithuania
100.0
/100
|
#6
Exceptional
44.9%
Okinawans
100.0
/100
|
#7
Exceptional
44.9%
Immigrants | Austria
100.0
/100
|
#8
Exceptional
44.9%
Paraguayans
100.0
/100
|
#9
Exceptional
45.0%
Bulgarians
100.0
/100
|
#10
Exceptional
45.1%
Lithuanians
100.0
/100
|
#11
Exceptional
45.1%
Immigrants | Czechoslovakia
100.0
/100
|
#12
Exceptional
45.1%
Latvians
100.0
/100
|
#13
Exceptional
45.1%
Immigrants | Scotland
100.0
/100
|
#14
Exceptional
45.1%
Immigrants | Sweden
100.0
/100
|
#15
Exceptional
45.1%