Costa Rican vs Sri Lankan Disability Age Over 75
COMPARE
Costa Rican
Sri Lankan
Disability Age Over 75
Disability Age Over 75 Comparison
Costa Ricans
Sri Lankans
46.9%
DISABILITY AGE OVER 75
84.5/ 100
METRIC RATING
145th/ 347
METRIC RANK
48.5%
DISABILITY AGE OVER 75
1.4/ 100
METRIC RATING
248th/ 347
METRIC RANK
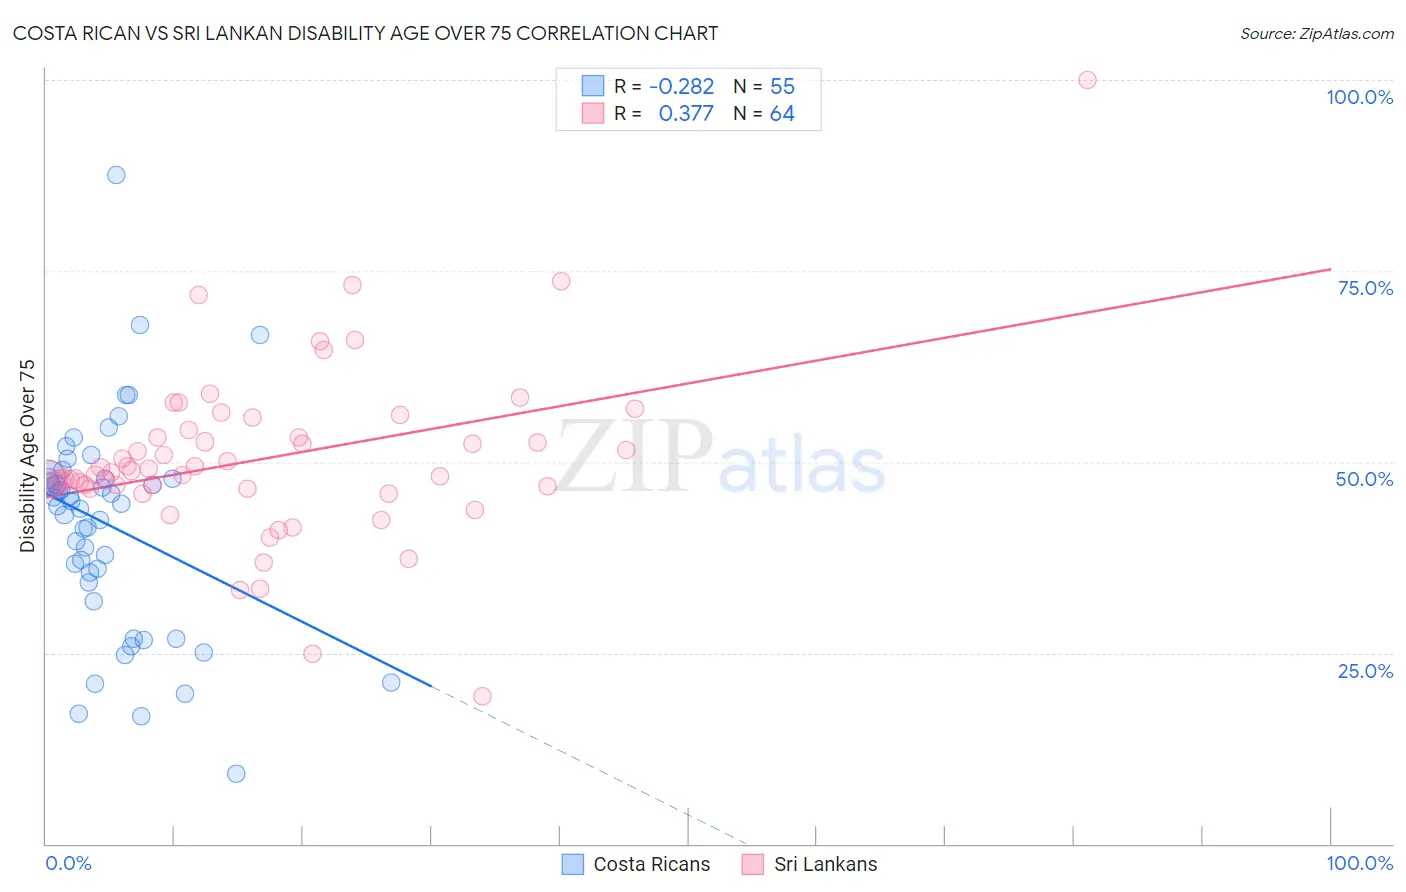
Costa Rican vs Sri Lankan Disability Age Over 75 Correlation Chart
The statistical analysis conducted on geographies consisting of 253,327,132 people shows a weak negative correlation between the proportion of Costa Ricans and percentage of population with a disability over the age of 75 in the United States with a correlation coefficient (R) of -0.282 and weighted average of 46.9%. Similarly, the statistical analysis conducted on geographies consisting of 439,378,477 people shows a mild positive correlation between the proportion of Sri Lankans and percentage of population with a disability over the age of 75 in the United States with a correlation coefficient (R) of 0.377 and weighted average of 48.5%, a difference of 3.4%.
Disability Age Over 75 Correlation Summary
| Measurement | Costa Rican | Sri Lankan |
| Minimum | 9.1% | 19.3% |
| Maximum | 87.5% | 100.0% |
| Range | 78.4% | 80.7% |
| Mean | 41.7% | 50.4% |
| Median | 44.5% | 48.8% |
| Interquartile 25% (IQ1) | 34.2% | 46.6% |
| Interquartile 75% (IQ3) | 47.9% | 53.7% |
| Interquartile Range (IQR) | 13.6% | 7.0% |
| Standard Deviation (Sample) | 14.0% | 11.5% |
| Standard Deviation (Population) | 13.9% | 11.4% |
Similar Demographics by Disability Age Over 75
Demographics Similar to Costa Ricans by Disability Age Over 75
In terms of disability age over 75, the demographic groups most similar to Costa Ricans are Guyanese (46.9%, a difference of 0.010%), Venezuelan (46.9%, a difference of 0.020%), Immigrants from Peru (46.9%, a difference of 0.020%), Bermudan (46.9%, a difference of 0.050%), and Peruvian (46.8%, a difference of 0.090%).
| Demographics | Rating | Rank | Disability Age Over 75 |
| Immigrants | Bosnia and Herzegovina | 88.5 /100 | #138 | Excellent 46.8% |
| Yugoslavians | 88.5 /100 | #139 | Excellent 46.8% |
| Immigrants | Costa Rica | 87.4 /100 | #140 | Excellent 46.8% |
| Lebanese | 87.0 /100 | #141 | Excellent 46.8% |
| Peruvians | 86.5 /100 | #142 | Excellent 46.8% |
| Bermudans | 85.6 /100 | #143 | Excellent 46.9% |
| Venezuelans | 85.0 /100 | #144 | Excellent 46.9% |
| Costa Ricans | 84.5 /100 | #145 | Excellent 46.9% |
| Guyanese | 84.3 /100 | #146 | Excellent 46.9% |
| Immigrants | Peru | 84.1 /100 | #147 | Excellent 46.9% |
| Asians | 81.6 /100 | #148 | Excellent 46.9% |
| Welsh | 81.3 /100 | #149 | Excellent 47.0% |
| Immigrants | Russia | 79.3 /100 | #150 | Good 47.0% |
| French Canadians | 79.0 /100 | #151 | Good 47.0% |
| Immigrants | Asia | 76.5 /100 | #152 | Good 47.0% |
Demographics Similar to Sri Lankans by Disability Age Over 75
In terms of disability age over 75, the demographic groups most similar to Sri Lankans are Iroquois (48.4%, a difference of 0.060%), Chippewa (48.4%, a difference of 0.080%), American (48.4%, a difference of 0.11%), Afghan (48.4%, a difference of 0.14%), and Iraqi (48.6%, a difference of 0.21%).
| Demographics | Rating | Rank | Disability Age Over 75 |
| Native Hawaiians | 2.2 /100 | #241 | Tragic 48.3% |
| French American Indians | 2.2 /100 | #242 | Tragic 48.3% |
| Immigrants | Caribbean | 2.1 /100 | #243 | Tragic 48.4% |
| Afghans | 1.8 /100 | #244 | Tragic 48.4% |
| Americans | 1.7 /100 | #245 | Tragic 48.4% |
| Chippewa | 1.6 /100 | #246 | Tragic 48.4% |
| Iroquois | 1.6 /100 | #247 | Tragic 48.4% |
| Sri Lankans | 1.4 /100 | #248 | Tragic 48.5% |
| Iraqis | 1.0 /100 | #249 | Tragic 48.6% |
| West Indians | 0.8 /100 | #250 | Tragic 48.6% |
| Koreans | 0.8 /100 | #251 | Tragic 48.6% |
| Immigrants | South Eastern Asia | 0.7 /100 | #252 | Tragic 48.7% |
| British West Indians | 0.6 /100 | #253 | Tragic 48.7% |
| Immigrants | Vietnam | 0.6 /100 | #254 | Tragic 48.7% |
| Chinese | 0.5 /100 | #255 | Tragic 48.7% |