Comanche vs Maltese Disability Age 65 to 74
COMPARE
Comanche
Maltese
Disability Age 65 to 74
Disability Age 65 to 74 Comparison
Comanche
Maltese
28.3%
DISABILITY AGE 65 TO 74
0.0/ 100
METRIC RATING
321st/ 347
METRIC RANK
21.6%
DISABILITY AGE 65 TO 74
99.4/ 100
METRIC RATING
66th/ 347
METRIC RANK
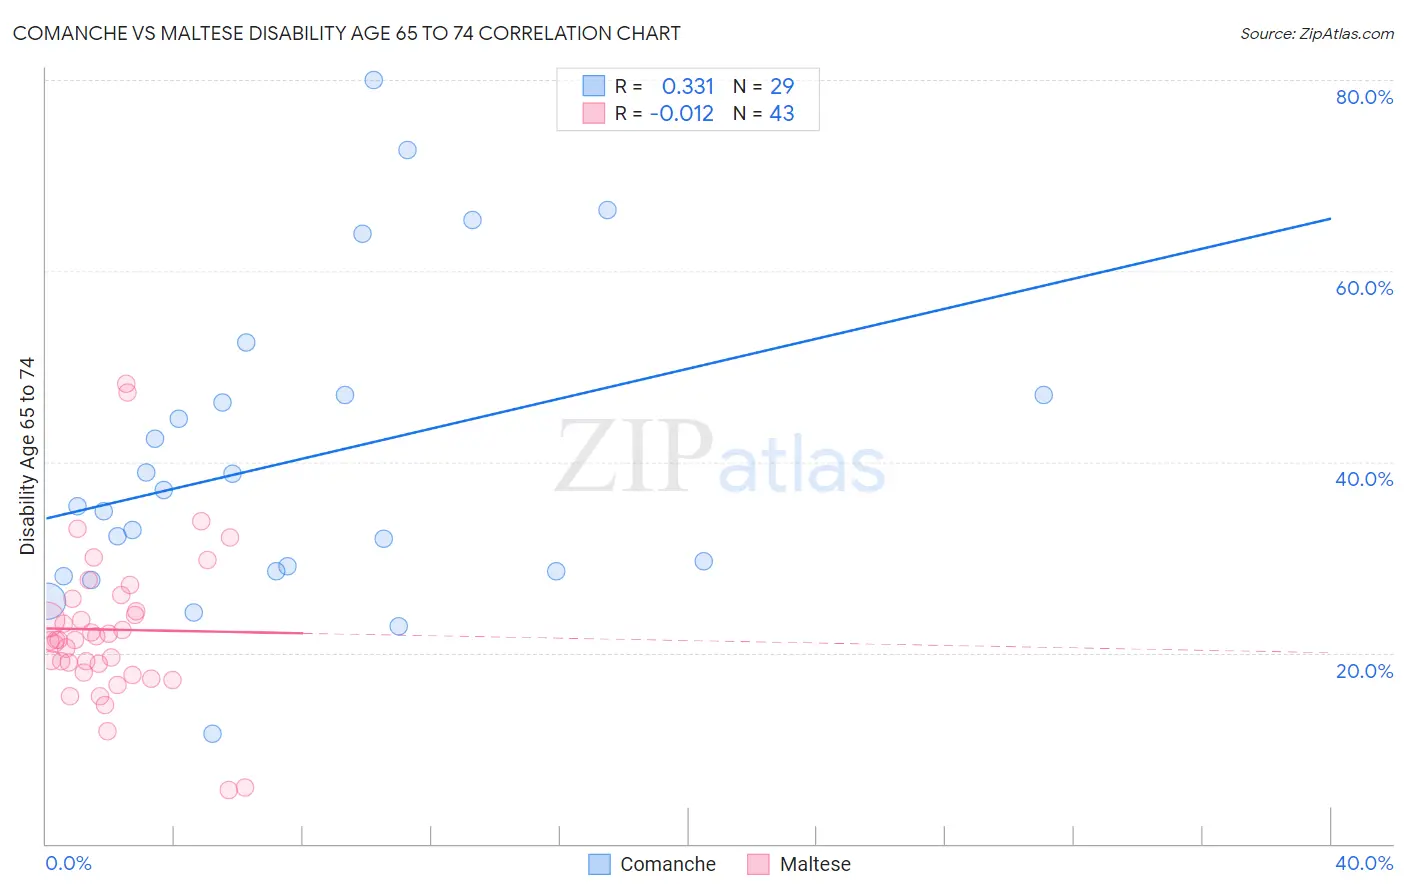
Comanche vs Maltese Disability Age 65 to 74 Correlation Chart
The statistical analysis conducted on geographies consisting of 109,698,765 people shows a mild positive correlation between the proportion of Comanche and percentage of population with a disability between the ages 65 and 75 in the United States with a correlation coefficient (R) of 0.331 and weighted average of 28.3%. Similarly, the statistical analysis conducted on geographies consisting of 126,377,352 people shows no correlation between the proportion of Maltese and percentage of population with a disability between the ages 65 and 75 in the United States with a correlation coefficient (R) of -0.012 and weighted average of 21.6%, a difference of 31.1%.
Disability Age 65 to 74 Correlation Summary
| Measurement | Comanche | Maltese |
| Minimum | 11.6% | 5.7% |
| Maximum | 80.0% | 48.2% |
| Range | 68.4% | 42.5% |
| Mean | 40.2% | 22.4% |
| Median | 35.3% | 21.4% |
| Interquartile 25% (IQ1) | 28.6% | 18.0% |
| Interquartile 75% (IQ3) | 47.1% | 25.7% |
| Interquartile Range (IQR) | 18.5% | 7.8% |
| Standard Deviation (Sample) | 16.3% | 8.2% |
| Standard Deviation (Population) | 16.1% | 8.1% |
Similar Demographics by Disability Age 65 to 74
Demographics Similar to Comanche by Disability Age 65 to 74
In terms of disability age 65 to 74, the demographic groups most similar to Comanche are Aleut (28.4%, a difference of 0.33%), Cherokee (28.2%, a difference of 0.51%), Arapaho (28.1%, a difference of 0.89%), Nepalese (28.0%, a difference of 1.1%), and Immigrants from Armenia (28.0%, a difference of 1.3%).
| Demographics | Rating | Rank | Disability Age 65 to 74 |
| Chippewa | 0.0 /100 | #314 | Tragic 27.8% |
| Cajuns | 0.0 /100 | #315 | Tragic 27.9% |
| Crow | 0.0 /100 | #316 | Tragic 27.9% |
| Immigrants | Armenia | 0.0 /100 | #317 | Tragic 28.0% |
| Nepalese | 0.0 /100 | #318 | Tragic 28.0% |
| Arapaho | 0.0 /100 | #319 | Tragic 28.1% |
| Cherokee | 0.0 /100 | #320 | Tragic 28.2% |
| Comanche | 0.0 /100 | #321 | Tragic 28.3% |
| Aleuts | 0.0 /100 | #322 | Tragic 28.4% |
| Puerto Ricans | 0.0 /100 | #323 | Tragic 29.1% |
| Seminole | 0.0 /100 | #324 | Tragic 29.4% |
| Dutch West Indians | 0.0 /100 | #325 | Tragic 29.6% |
| Yakama | 0.0 /100 | #326 | Tragic 29.6% |
| Apache | 0.0 /100 | #327 | Tragic 29.7% |
| Hopi | 0.0 /100 | #328 | Tragic 30.0% |
Demographics Similar to Maltese by Disability Age 65 to 74
In terms of disability age 65 to 74, the demographic groups most similar to Maltese are Immigrants from Russia (21.6%, a difference of 0.010%), Immigrants from Latvia (21.6%, a difference of 0.030%), Immigrants from Europe (21.6%, a difference of 0.11%), Carpatho Rusyn (21.6%, a difference of 0.20%), and Immigrants from South Africa (21.7%, a difference of 0.20%).
| Demographics | Rating | Rank | Disability Age 65 to 74 |
| Zimbabweans | 99.5 /100 | #59 | Exceptional 21.5% |
| Immigrants | North Macedonia | 99.5 /100 | #60 | Exceptional 21.6% |
| Egyptians | 99.5 /100 | #61 | Exceptional 21.6% |
| Carpatho Rusyns | 99.5 /100 | #62 | Exceptional 21.6% |
| Immigrants | Europe | 99.4 /100 | #63 | Exceptional 21.6% |
| Immigrants | Latvia | 99.4 /100 | #64 | Exceptional 21.6% |
| Immigrants | Russia | 99.4 /100 | #65 | Exceptional 21.6% |
| Maltese | 99.4 /100 | #66 | Exceptional 21.6% |
| Immigrants | South Africa | 99.3 /100 | #67 | Exceptional 21.7% |
| Immigrants | Scotland | 99.3 /100 | #68 | Exceptional 21.7% |
| Immigrants | Egypt | 99.2 /100 | #69 | Exceptional 21.7% |
| Chinese | 99.2 /100 | #70 | Exceptional 21.7% |
| Immigrants | Belarus | 99.2 /100 | #71 | Exceptional 21.7% |
| Immigrants | Hungary | 99.2 /100 | #72 | Exceptional 21.7% |
| Immigrants | Venezuela | 99.0 /100 | #73 | Exceptional 21.8% |