Chilean vs Immigrants from Lebanon Hearing Disability

COMPARE

Chilean
Race
Ancestry
AfghanAfricanAlaska NativeAlaskan AthabascanAlbanianAleutAlsatianAmericanApacheArabArapahoArgentineanArmenianAssyrian/Chaldean/SyriacAustralianAustrianBahamianBangladeshiBarbadianBasqueBelgianBelizeanBermudanBhutaneseBlackfeetBolivianBrazilianBritishBritish West IndianBulgarianBurmeseCajunCambodianCanadianCape VerdeanCarpatho RusynCelticCentral AmericanCentral American IndianCherokeeCheyenneChickasawChileanChineseChippewaChoctawColombianColvilleComancheCosta RicanCreeCreekCroatianCrowCubanCypriotCzechCzechoslovakianDanishDelawareDominicanDutchDutch West IndianEastern EuropeanEcuadorianEgyptianEnglishEstonianEthiopianEuropeanFijianFilipinoFinnishFrenchFrench American IndianFrench CanadianGermanGerman RussianGhanaianGreekGuamanian/ChamorroGuatemalanGuyaneseHaitianHmongHonduranHopiHoumaHungarianIcelanderIndian (Asian)IndonesianInupiatIranianIraqiIrishIroquoisIsraeliItalianJamaicanJapaneseJordanianKenyanKiowaKoreanLaotianLatvianLebaneseLiberianLithuanianLumbeeLuxembourgerMacedonianMalaysianMalteseMarshalleseMenomineeMexicanMexican American IndianMongolianMoroccanNative HawaiianNavajoNepaleseNew ZealanderNicaraguanNigerianNorthern EuropeanNorwegianOkinawanOsageOttawaPaiutePakistaniPalestinianPanamanianParaguayanPennsylvania GermanPeruvianPimaPolishPortuguesePotawatomiPuebloPuerto RicanPuget Sound SalishRomanianRussianSalvadoranSamoanScandinavianScotch-IrishScottishSeminoleSenegaleseSerbianShoshoneSierra LeoneanSiouxSlavicSlovakSloveneSomaliSouth AfricanSouth AmericanSouth American IndianSoviet UnionSpaniardSpanishSpanish AmericanSpanish American IndianSri LankanSubsaharan AfricanSudaneseSwedishSwissSyrianTaiwaneseThaiTlingit-HaidaTohono O'OdhamTonganTrinidadian and TobagonianTsimshianTurkishU.S. Virgin IslanderUgandanUkrainianUruguayanUteVenezuelanVietnameseWelshWest IndianYakamaYaquiYugoslavianYumanYup'ikZimbabwean
Immigration
NonimmigrantsImmigrantsAfghanistanAfricaAlbaniaArgentinaArmeniaAsiaAustraliaAustriaBahamasBangladeshBarbadosBelarusBelgiumBelizeBoliviaBosnia and HerzegovinaBrazilBulgariaBurma/MyanmarCabo VerdeCambodiaCameroonCanadaCaribbeanCentral AmericaChileChinaColombiaCongoCosta RicaCroatiaCubaCzechoslovakiaDenmarkDominicaDominican RepublicEastern AfricaEastern AsiaEastern EuropeEcuadorEgyptEl SalvadorEnglandEritreaEthiopiaEuropeFijiFranceGermanyGhanaGreeceGrenadaGuatemalaGuyanaHaitiHondurasHong KongHungaryIndiaIndonesiaIranIraqIrelandIsraelItalyJamaicaJapanJordanKazakhstanKenyaKoreaKuwaitLaosLatin AmericaLatviaLiberiaLithuaniaMalaysiaMexicoMicronesiaMiddle AfricaMoldovaMoroccoNepalNetherlandsNicaraguaNigeriaNorth AmericaNorth MacedoniaNorthern AfricaNorthern EuropeNorwayOceaniaPakistanPanamaPeruPhilippinesPolandPortugalRomaniaRussiaSaudi ArabiaScotlandSenegalSerbiaSierra LeoneSingaporeSomaliaSouth AfricaSouth AmericaSouth Central AsiaSouth Eastern AsiaSouthern EuropeSpainSri LankaSt. Vincent and the GrenadinesSudanSwedenSwitzerlandSyriaTaiwanThailandTrinidad and TobagoTurkeyUgandaUkraineUruguayUzbekistanVenezuelaVietnamWest IndiesWestern AfricaWestern AsiaWestern EuropeYemenZaireZimbabweAzores
Immigrants from Lebanon
Race
Ancestry
AfghanAfricanAlaska NativeAlaskan AthabascanAlbanianAleutAlsatianAmericanApacheArabArapahoArgentineanArmenianAssyrian/Chaldean/SyriacAustralianAustrianBahamianBangladeshiBarbadianBasqueBelgianBelizeanBermudanBhutaneseBlackfeetBolivianBrazilianBritishBritish West IndianBulgarianBurmeseCajunCambodianCanadianCape VerdeanCarpatho RusynCelticCentral AmericanCentral American IndianCherokeeCheyenneChickasawChineseChippewaChoctawColombianColvilleComancheCosta RicanCreeCreekCroatianCrowCubanCypriotCzechCzechoslovakianDanishDelawareDominicanDutchDutch West IndianEastern EuropeanEcuadorianEgyptianEnglishEstonianEthiopianEuropeanFijianFilipinoFinnishFrenchFrench American IndianFrench CanadianGermanGerman RussianGhanaianGreekGuamanian/ChamorroGuatemalanGuyaneseHaitianHmongHonduranHopiHoumaHungarianIcelanderIndian (Asian)IndonesianInupiatIranianIraqiIrishIroquoisIsraeliItalianJamaicanJapaneseJordanianKenyanKiowaKoreanLaotianLatvianLebaneseLiberianLithuanianLumbeeLuxembourgerMacedonianMalaysianMalteseMarshalleseMenomineeMexicanMexican American IndianMongolianMoroccanNative HawaiianNavajoNepaleseNew ZealanderNicaraguanNigerianNorthern EuropeanNorwegianOkinawanOsageOttawaPaiutePakistaniPalestinianPanamanianParaguayanPennsylvania GermanPeruvianPimaPolishPortuguesePotawatomiPuebloPuerto RicanPuget Sound SalishRomanianRussianSalvadoranSamoanScandinavianScotch-IrishScottishSeminoleSenegaleseSerbianShoshoneSierra LeoneanSiouxSlavicSlovakSloveneSomaliSouth AfricanSouth AmericanSouth American IndianSoviet UnionSpaniardSpanishSpanish AmericanSpanish American IndianSri LankanSubsaharan AfricanSudaneseSwedishSwissSyrianTaiwaneseThaiTlingit-HaidaTohono O'OdhamTonganTrinidadian and TobagonianTsimshianTurkishU.S. Virgin IslanderUgandanUkrainianUruguayanUteVenezuelanVietnameseWelshWest IndianYakamaYaquiYugoslavianYumanYup'ikZimbabwean
Immigration
NonimmigrantsImmigrantsAfghanistanAfricaAlbaniaArgentinaArmeniaAsiaAustraliaAustriaBahamasBangladeshBarbadosBelarusBelgiumBelizeBoliviaBosnia and HerzegovinaBrazilBulgariaBurma/MyanmarCabo VerdeCambodiaCameroonCanadaCaribbeanCentral AmericaChileChinaColombiaCongoCosta RicaCroatiaCubaCzechoslovakiaDenmarkDominicaDominican RepublicEastern AfricaEastern AsiaEastern EuropeEcuadorEgyptEl SalvadorEnglandEritreaEthiopiaEuropeFijiFranceGermanyGhanaGreeceGrenadaGuatemalaGuyanaHaitiHondurasHong KongHungaryIndiaIndonesiaIranIraqIrelandIsraelItalyJamaicaJapanJordanKazakhstanKenyaKoreaKuwaitLaosLatin AmericaLatviaLebanonLiberiaLithuaniaMalaysiaMexicoMicronesiaMiddle AfricaMoldovaMoroccoNepalNetherlandsNicaraguaNigeriaNorth AmericaNorth MacedoniaNorthern AfricaNorthern EuropeNorwayOceaniaPakistanPanamaPeruPhilippinesPolandPortugalRomaniaRussiaSaudi ArabiaScotlandSenegalSerbiaSierra LeoneSingaporeSomaliaSouth AfricaSouth AmericaSouth Central AsiaSouth Eastern AsiaSouthern EuropeSpainSri LankaSt. Vincent and the GrenadinesSudanSwedenSwitzerlandSyriaTaiwanThailandTrinidad and TobagoTurkeyUgandaUkraineUruguayUzbekistanVenezuelaVietnamWest IndiesWestern AfricaWestern AsiaWestern EuropeYemenZaireZimbabweAzores
Hearing Disability
Income
Poverty
Unemployment
Labor Participation
Family Structure
Vehicle Availability
Education Level
Disability

Hearing Disability Comparison

Chileans

Immigrants from Lebanon

Excellent
Good
2.9%
HEARING DISABILITY
85.8/ 100
METRIC RATING
132nd/ 347
METRIC RANK
2.9%
HEARING DISABILITY
71.5/ 100
METRIC RATING
154th/ 347
METRIC RANK

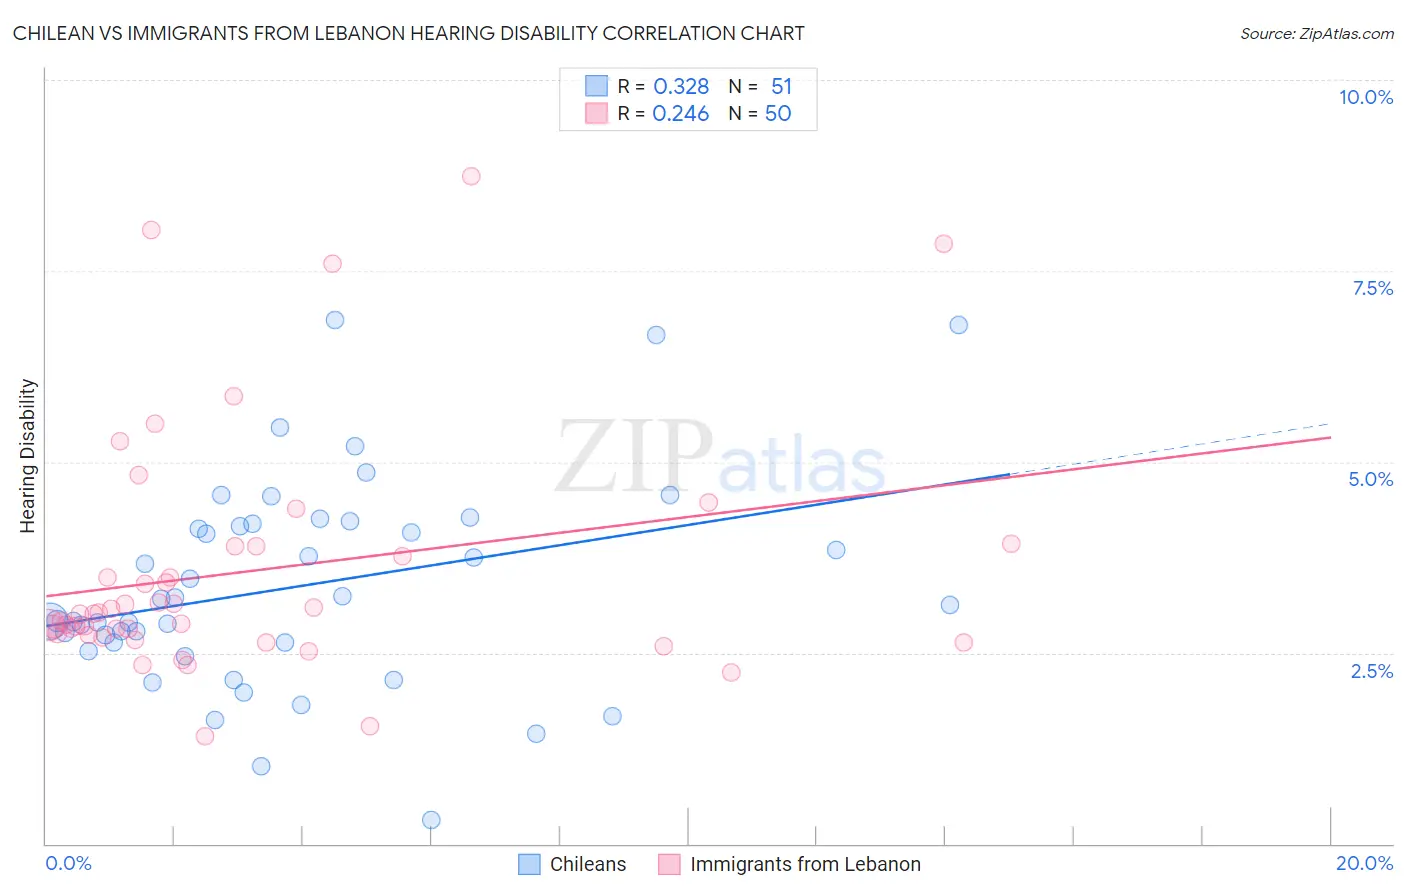
Chilean vs Immigrants from Lebanon Hearing Disability Correlation Chart

The statistical analysis conducted on geographies consisting of 256,625,228 people shows a mild positive correlation between the proportion of Chileans and percentage of population with hearing disability in the United States with a correlation coefficient (R) of 0.328 and weighted average of 2.9%. Similarly, the statistical analysis conducted on geographies consisting of 217,145,766 people shows a weak positive correlation between the proportion of Immigrants from Lebanon and percentage of population with hearing disability in the United States with a correlation coefficient (R) of 0.246 and weighted average of 2.9%, a difference of 2.2%.
Chilean vs Immigrants from Lebanon Hearing Disability

Hearing Disability Correlation Summary

MeasurementChileanImmigrants from Lebanon
Minimum0.32%1.4%
Maximum6.9%8.7%
Range6.5%7.3%
Mean3.4%3.6%
Median3.1%3.0%
Interquartile 25% (IQ1)2.6%2.7%
Interquartile 75% (IQ3)4.2%3.9%
Interquartile Range (IQR)1.6%1.2%
Standard Deviation (Sample)1.4%1.6%
Standard Deviation (Population)1.4%1.6%

Similar Demographics by Hearing Disability

Demographics Similar to Chileans by Hearing Disability

In terms of hearing disability, the demographic groups most similar to Chileans are Immigrants from Syria (2.9%, a difference of 0.0%), Immigrants from Kenya (2.9%, a difference of 0.050%), Ugandan (2.9%, a difference of 0.070%), Immigrants from Vietnam (2.9%, a difference of 0.14%), and Immigrants from Uganda (2.9%, a difference of 0.16%).
DemographicsRating | RankHearing Disability
Immigrants | Albania
88.5
/100
|
#125
Excellent
2.9%
Immigrants | Sudan
87.8
/100
|
#126
Excellent
2.9%
South American Indians
86.9
/100
|
#127
Excellent
2.9%
Immigrants | Western Asia
86.9
/100
|
#128
Excellent
2.9%
Immigrants | Uganda
86.6
/100
|
#129
Excellent
2.9%
Immigrants | Vietnam
86.5
/100
|
#130
Excellent
2.9%
Immigrants | Kenya
86.1
/100
|
#131
Excellent
2.9%
Chileans
85.8
/100
|
#132
Excellent
2.9%
Immigrants | Syria
85.8
/100
|
#133
Excellent
2.9%
Ugandans
85.5
/100
|
#134
Excellent
2.9%
Soviet Union
84.8
/100
|
#135
Excellent
2.9%
Immigrants | Brazil
84.6
/100
|
#136
Excellent
2.9%
Sri Lankans
84.1
/100
|
#137
Excellent
2.9%
Immigrants | Costa Rica
84.0
/100
|
#138
Excellent
2.9%
Bermudans
83.8
/100
|
#139
Excellent
2.9%

Demographics Similar to Immigrants from Lebanon by Hearing Disability

In terms of hearing disability, the demographic groups most similar to Immigrants from Lebanon are Costa Rican (2.9%, a difference of 0.010%), Sudanese (2.9%, a difference of 0.070%), Immigrants from Poland (2.9%, a difference of 0.15%), Immigrants from Lithuania (2.9%, a difference of 0.18%), and Immigrants from France (2.9%, a difference of 0.19%).
DemographicsRating | RankHearing Disability
Tongans
78.6
/100
|
#147
Good
2.9%
Immigrants | Russia
77.7
/100
|
#148
Good
2.9%
Immigrants | Panama
76.9
/100
|
#149
Good
2.9%
Palestinians
73.6
/100
|
#150
Good
2.9%
Immigrants | France
73.1
/100
|
#151
Good
2.9%
Immigrants | Lithuania
73.0
/100
|
#152
Good
2.9%
Sudanese
72.1
/100
|
#153
Good
2.9%
Immigrants | Lebanon
71.5
/100
|
#154
Good
2.9%
Costa Ricans
71.4
/100
|
#155
Good
2.9%
Immigrants | Poland
70.2
/100
|
#156
Good
2.9%
Immigrants | Kazakhstan
69.6
/100
|
#157
Good
2.9%
Immigrants | Burma/Myanmar
69.5
/100
|
#158
Good
2.9%
Immigrants | Australia
67.4
/100
|
#159
Good
2.9%
Immigrants | Fiji
67.1
/100
|
#160
Good
2.9%
Albanians
66.6
/100
|
#161
Good
2.9%