Canadian vs Basque Disability Age 65 to 74
COMPARE
Canadian
Basque
Disability Age 65 to 74
Disability Age 65 to 74 Comparison
Canadians
Basques
22.9%
DISABILITY AGE 65 TO 74
77.7/ 100
METRIC RATING
150th/ 347
METRIC RANK
23.5%
DISABILITY AGE 65 TO 74
38.4/ 100
METRIC RATING
186th/ 347
METRIC RANK
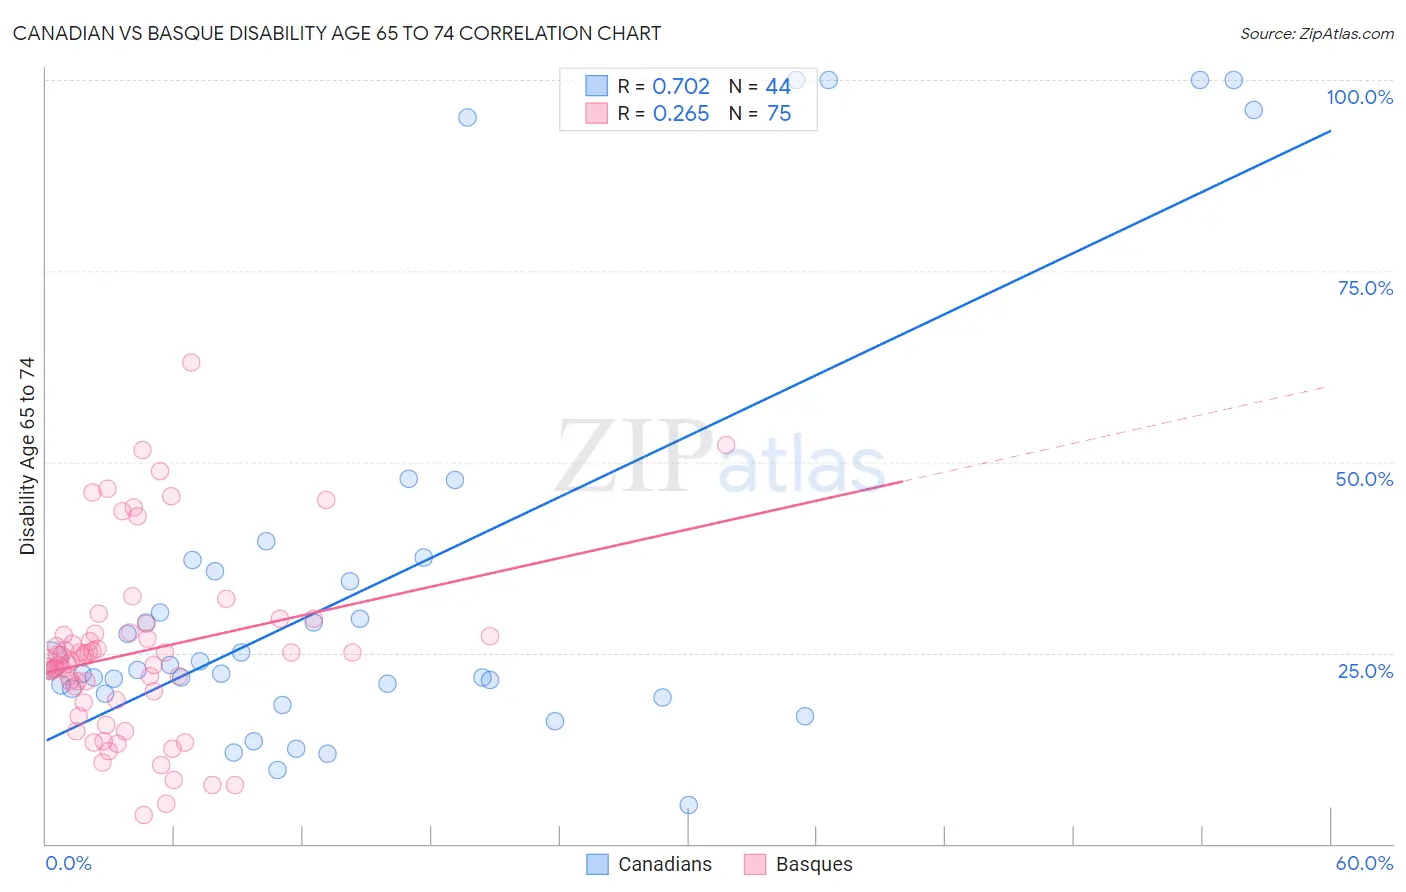
Canadian vs Basque Disability Age 65 to 74 Correlation Chart
The statistical analysis conducted on geographies consisting of 436,683,818 people shows a strong positive correlation between the proportion of Canadians and percentage of population with a disability between the ages 65 and 75 in the United States with a correlation coefficient (R) of 0.702 and weighted average of 22.9%. Similarly, the statistical analysis conducted on geographies consisting of 165,654,682 people shows a weak positive correlation between the proportion of Basques and percentage of population with a disability between the ages 65 and 75 in the United States with a correlation coefficient (R) of 0.265 and weighted average of 23.5%, a difference of 2.5%.
Disability Age 65 to 74 Correlation Summary
| Measurement | Canadian | Basque |
| Minimum | 5.0% | 3.8% |
| Maximum | 100.0% | 63.0% |
| Range | 95.0% | 59.1% |
| Mean | 34.2% | 25.1% |
| Median | 23.0% | 24.0% |
| Interquartile 25% (IQ1) | 20.0% | 18.7% |
| Interquartile 75% (IQ3) | 36.4% | 27.6% |
| Interquartile Range (IQR) | 16.5% | 8.8% |
| Standard Deviation (Sample) | 27.4% | 11.6% |
| Standard Deviation (Population) | 27.1% | 11.6% |
Similar Demographics by Disability Age 65 to 74
Demographics Similar to Canadians by Disability Age 65 to 74
In terms of disability age 65 to 74, the demographic groups most similar to Canadians are Immigrants from Morocco (22.9%, a difference of 0.0%), Finnish (22.9%, a difference of 0.090%), Swiss (22.9%, a difference of 0.18%), New Zealander (22.9%, a difference of 0.20%), and Slavic (23.0%, a difference of 0.20%).
| Demographics | Rating | Rank | Disability Age 65 to 74 |
| Arabs | 84.8 /100 | #143 | Excellent 22.8% |
| Danes | 84.4 /100 | #144 | Excellent 22.8% |
| Immigrants | Uganda | 84.0 /100 | #145 | Excellent 22.8% |
| Alsatians | 83.7 /100 | #146 | Excellent 22.8% |
| Immigrants | Uzbekistan | 83.1 /100 | #147 | Excellent 22.8% |
| New Zealanders | 79.9 /100 | #148 | Good 22.9% |
| Swiss | 79.7 /100 | #149 | Good 22.9% |
| Canadians | 77.7 /100 | #150 | Good 22.9% |
| Immigrants | Morocco | 77.6 /100 | #151 | Good 22.9% |
| Finns | 76.5 /100 | #152 | Good 22.9% |
| Slavs | 75.2 /100 | #153 | Good 23.0% |
| Sri Lankans | 74.0 /100 | #154 | Good 23.0% |
| British | 73.9 /100 | #155 | Good 23.0% |
| Immigrants | Western Asia | 73.8 /100 | #156 | Good 23.0% |
| Czechoslovakians | 72.4 /100 | #157 | Good 23.0% |
Demographics Similar to Basques by Disability Age 65 to 74
In terms of disability age 65 to 74, the demographic groups most similar to Basques are Portuguese (23.5%, a difference of 0.040%), Haitian (23.4%, a difference of 0.24%), Immigrants from Germany (23.4%, a difference of 0.25%), Immigrants from Eastern Africa (23.4%, a difference of 0.27%), and Immigrants from Cuba (23.6%, a difference of 0.27%).
| Demographics | Rating | Rank | Disability Age 65 to 74 |
| Immigrants | Sierra Leone | 45.8 /100 | #179 | Average 23.4% |
| Scandinavians | 45.6 /100 | #180 | Average 23.4% |
| Assyrians/Chaldeans/Syriacs | 45.3 /100 | #181 | Average 23.4% |
| Irish | 44.4 /100 | #182 | Average 23.4% |
| Immigrants | Eastern Africa | 42.8 /100 | #183 | Average 23.4% |
| Immigrants | Germany | 42.5 /100 | #184 | Average 23.4% |
| Haitians | 42.4 /100 | #185 | Average 23.4% |
| Basques | 38.4 /100 | #186 | Fair 23.5% |
| Portuguese | 37.8 /100 | #187 | Fair 23.5% |
| Immigrants | Cuba | 34.0 /100 | #188 | Fair 23.6% |
| Scottish | 33.1 /100 | #189 | Fair 23.6% |
| Immigrants | Guyana | 31.2 /100 | #190 | Fair 23.6% |
| Immigrants | Bangladesh | 30.2 /100 | #191 | Fair 23.6% |
| Ecuadorians | 29.7 /100 | #192 | Fair 23.6% |
| English | 28.5 /100 | #193 | Fair 23.6% |