Cambodian vs Immigrants from Lithuania Hearing Disability
COMPARE
Cambodian
Immigrants from Lithuania
Hearing Disability
Hearing Disability Comparison
Cambodians
Immigrants from Lithuania
2.8%
HEARING DISABILITY
91.1/ 100
METRIC RATING
114th/ 347
METRIC RANK
2.9%
HEARING DISABILITY
73.0/ 100
METRIC RATING
152nd/ 347
METRIC RANK
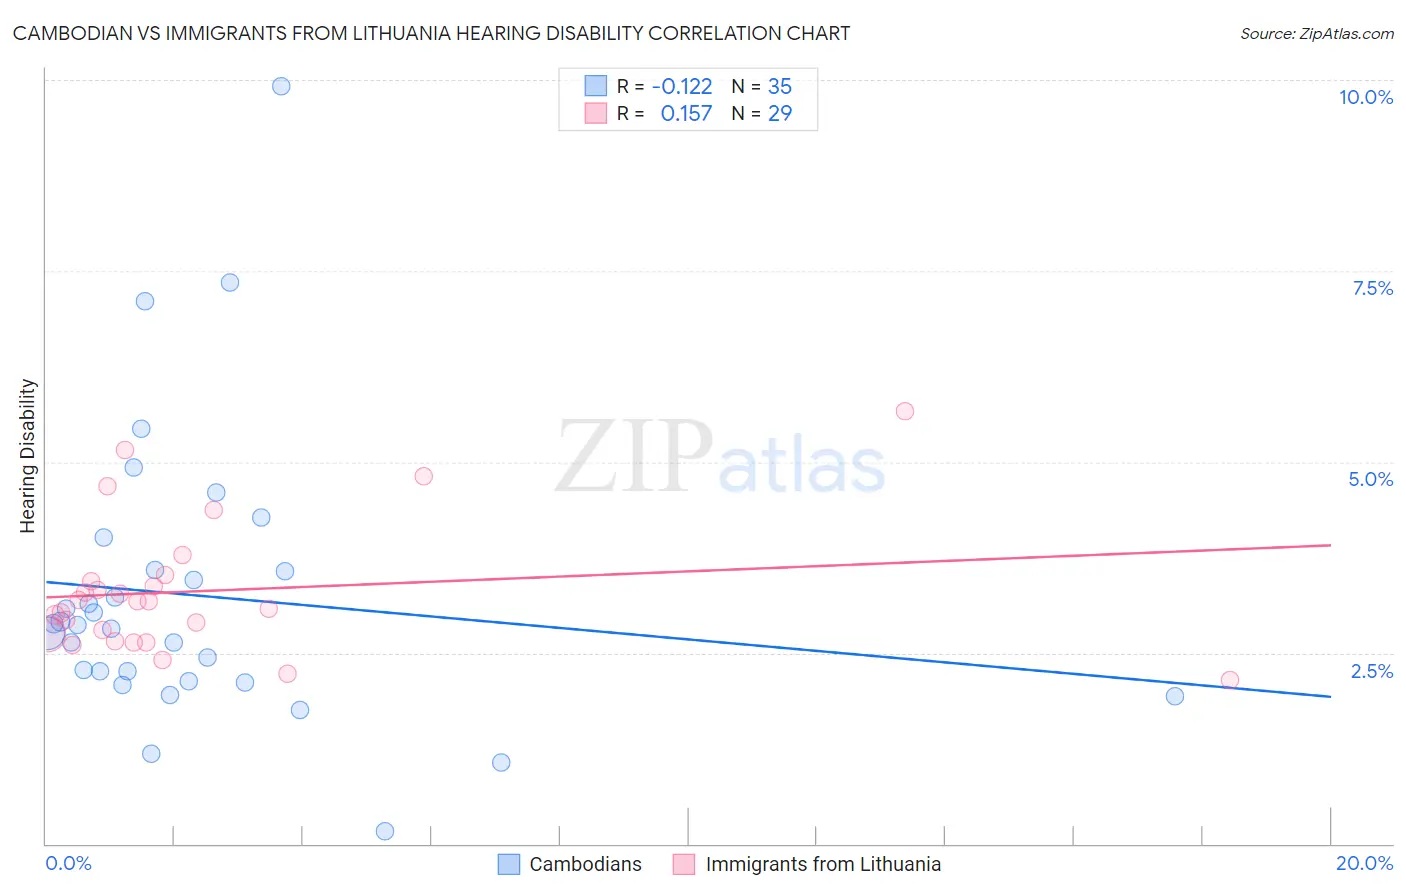
Cambodian vs Immigrants from Lithuania Hearing Disability Correlation Chart
The statistical analysis conducted on geographies consisting of 102,495,279 people shows a poor negative correlation between the proportion of Cambodians and percentage of population with hearing disability in the United States with a correlation coefficient (R) of -0.122 and weighted average of 2.8%. Similarly, the statistical analysis conducted on geographies consisting of 117,714,489 people shows a poor positive correlation between the proportion of Immigrants from Lithuania and percentage of population with hearing disability in the United States with a correlation coefficient (R) of 0.157 and weighted average of 2.9%, a difference of 3.3%.
Hearing Disability Correlation Summary
| Measurement | Cambodian | Immigrants from Lithuania |
| Minimum | 0.17% | 2.1% |
| Maximum | 9.9% | 5.7% |
| Range | 9.7% | 3.5% |
| Mean | 3.3% | 3.3% |
| Median | 2.9% | 3.2% |
| Interquartile 25% (IQ1) | 2.1% | 2.7% |
| Interquartile 75% (IQ3) | 3.6% | 3.5% |
| Interquartile Range (IQR) | 1.4% | 0.78% |
| Standard Deviation (Sample) | 1.9% | 0.86% |
| Standard Deviation (Population) | 1.9% | 0.85% |
Similar Demographics by Hearing Disability
Demographics Similar to Cambodians by Hearing Disability
In terms of hearing disability, the demographic groups most similar to Cambodians are Immigrants from Belarus (2.8%, a difference of 0.17%), Immigrants from Latin America (2.8%, a difference of 0.17%), Immigrants (2.8%, a difference of 0.24%), Immigrants from Liberia (2.8%, a difference of 0.32%), and Zimbabwean (2.8%, a difference of 0.34%).
| Demographics | Rating | Rank | Hearing Disability |
| Immigrants | Chile | 93.4 /100 | #107 | Exceptional 2.8% |
| Guatemalans | 93.2 /100 | #108 | Exceptional 2.8% |
| Turks | 93.0 /100 | #109 | Exceptional 2.8% |
| Cypriots | 92.9 /100 | #110 | Exceptional 2.8% |
| Immigrants | Yemen | 92.7 /100 | #111 | Exceptional 2.8% |
| U.S. Virgin Islanders | 92.5 /100 | #112 | Exceptional 2.8% |
| Immigrants | Belarus | 91.6 /100 | #113 | Exceptional 2.8% |
| Cambodians | 91.1 /100 | #114 | Exceptional 2.8% |
| Immigrants | Latin America | 90.5 /100 | #115 | Exceptional 2.8% |
| Immigrants | Immigrants | 90.3 /100 | #116 | Exceptional 2.8% |
| Immigrants | Liberia | 90.0 /100 | #117 | Excellent 2.8% |
| Zimbabweans | 89.9 /100 | #118 | Excellent 2.8% |
| Kenyans | 89.8 /100 | #119 | Excellent 2.8% |
| Jordanians | 89.5 /100 | #120 | Excellent 2.8% |
| Cubans | 89.4 /100 | #121 | Excellent 2.8% |
Demographics Similar to Immigrants from Lithuania by Hearing Disability
In terms of hearing disability, the demographic groups most similar to Immigrants from Lithuania are Immigrants from France (2.9%, a difference of 0.010%), Palestinian (2.9%, a difference of 0.070%), Sudanese (2.9%, a difference of 0.11%), Immigrants from Lebanon (2.9%, a difference of 0.18%), and Costa Rican (2.9%, a difference of 0.19%).
| Demographics | Rating | Rank | Hearing Disability |
| Immigrants | Congo | 78.9 /100 | #145 | Good 2.9% |
| Brazilians | 78.7 /100 | #146 | Good 2.9% |
| Tongans | 78.6 /100 | #147 | Good 2.9% |
| Immigrants | Russia | 77.7 /100 | #148 | Good 2.9% |
| Immigrants | Panama | 76.9 /100 | #149 | Good 2.9% |
| Palestinians | 73.6 /100 | #150 | Good 2.9% |
| Immigrants | France | 73.1 /100 | #151 | Good 2.9% |
| Immigrants | Lithuania | 73.0 /100 | #152 | Good 2.9% |
| Sudanese | 72.1 /100 | #153 | Good 2.9% |
| Immigrants | Lebanon | 71.5 /100 | #154 | Good 2.9% |
| Costa Ricans | 71.4 /100 | #155 | Good 2.9% |
| Immigrants | Poland | 70.2 /100 | #156 | Good 2.9% |
| Immigrants | Kazakhstan | 69.6 /100 | #157 | Good 2.9% |
| Immigrants | Burma/Myanmar | 69.5 /100 | #158 | Good 2.9% |
| Immigrants | Australia | 67.4 /100 | #159 | Good 2.9% |