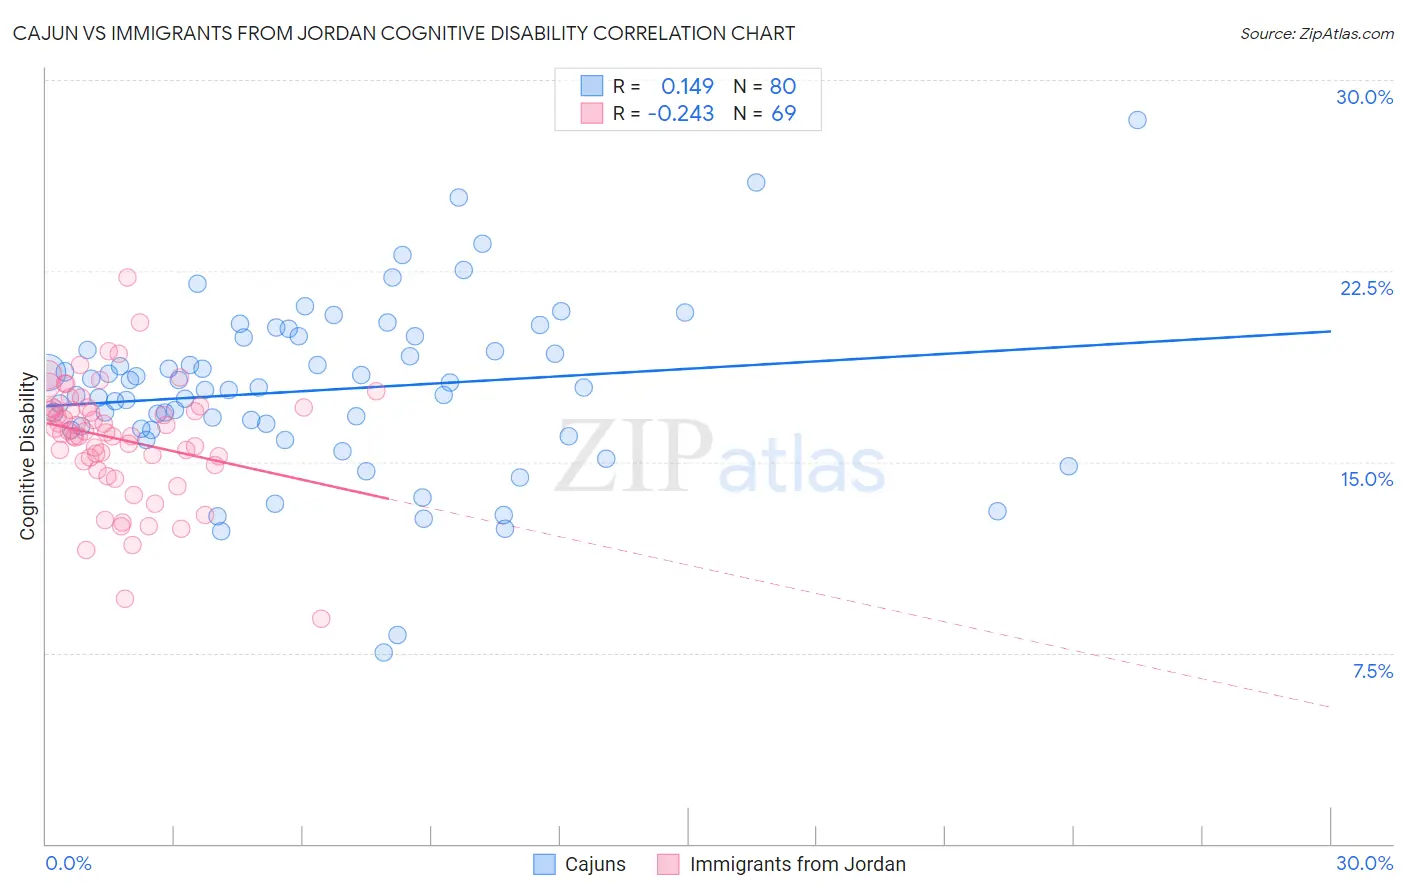
Cajun vs Immigrants from Jordan Cognitive Disability
COMPARE
Cajun
Immigrants from Jordan
Cognitive Disability
Cognitive Disability Comparison
Cajuns
Immigrants from Jordan
17.8%
COGNITIVE DISABILITY
1.4/ 100
METRIC RATING
239th/ 347
METRIC RANK
17.0%
COGNITIVE DISABILITY
91.9/ 100
METRIC RATING
133rd/ 347
METRIC RANK
Cajun vs Immigrants from Jordan Cognitive Disability Correlation Chart
The statistical analysis conducted on geographies consisting of 149,701,580 people shows a poor positive correlation between the proportion of Cajuns and percentage of population with cognitive disability in the United States with a correlation coefficient (R) of 0.149 and weighted average of 17.8%. Similarly, the statistical analysis conducted on geographies consisting of 181,275,613 people shows a weak negative correlation between the proportion of Immigrants from Jordan and percentage of population with cognitive disability in the United States with a correlation coefficient (R) of -0.243 and weighted average of 17.0%, a difference of 4.8%.
Cognitive Disability Correlation Summary
| Measurement | Cajun | Immigrants from Jordan |
| Minimum | 7.5% | 8.8% |
| Maximum | 28.5% | 22.2% |
| Range | 20.9% | 13.4% |
| Mean | 17.8% | 15.9% |
| Median | 17.9% | 16.2% |
| Interquartile 25% (IQ1) | 16.3% | 15.0% |
| Interquartile 75% (IQ3) | 19.6% | 17.1% |
| Interquartile Range (IQR) | 3.4% | 2.2% |
| Standard Deviation (Sample) | 3.4% | 2.3% |
| Standard Deviation (Population) | 3.4% | 2.3% |
Similar Demographics by Cognitive Disability
Demographics Similar to Cajuns by Cognitive Disability
In terms of cognitive disability, the demographic groups most similar to Cajuns are Iraqi (17.8%, a difference of 0.040%), Cheyenne (17.8%, a difference of 0.13%), Immigrants from Mexico (17.8%, a difference of 0.16%), Immigrants from Iraq (17.8%, a difference of 0.17%), and Mexican (17.8%, a difference of 0.18%).
| Demographics | Rating | Rank | Cognitive Disability |
| Tongans | 2.1 /100 | #232 | Tragic 17.8% |
| Panamanians | 2.1 /100 | #233 | Tragic 17.8% |
| Osage | 2.0 /100 | #234 | Tragic 17.8% |
| Spanish American Indians | 2.0 /100 | #235 | Tragic 17.8% |
| Immigrants | Iraq | 1.8 /100 | #236 | Tragic 17.8% |
| Immigrants | Mexico | 1.8 /100 | #237 | Tragic 17.8% |
| Cheyenne | 1.7 /100 | #238 | Tragic 17.8% |
| Cajuns | 1.4 /100 | #239 | Tragic 17.8% |
| Iraqis | 1.4 /100 | #240 | Tragic 17.8% |
| Mexicans | 1.1 /100 | #241 | Tragic 17.8% |
| Paiute | 1.1 /100 | #242 | Tragic 17.8% |
| Immigrants | Bangladesh | 1.0 /100 | #243 | Tragic 17.8% |
| Jamaicans | 0.9 /100 | #244 | Tragic 17.9% |
| Trinidadians and Tobagonians | 0.8 /100 | #245 | Tragic 17.9% |
| Immigrants | Thailand | 0.8 /100 | #246 | Tragic 17.9% |
Demographics Similar to Immigrants from Jordan by Cognitive Disability
In terms of cognitive disability, the demographic groups most similar to Immigrants from Jordan are Immigrants from Chile (17.0%, a difference of 0.020%), Immigrants from Germany (17.0%, a difference of 0.030%), White/Caucasian (17.0%, a difference of 0.030%), Immigrants from Vietnam (17.0%, a difference of 0.050%), and Lebanese (17.0%, a difference of 0.060%).
| Demographics | Rating | Rank | Cognitive Disability |
| Europeans | 93.4 /100 | #126 | Exceptional 17.0% |
| Immigrants | Costa Rica | 93.1 /100 | #127 | Exceptional 17.0% |
| Nicaraguans | 93.0 /100 | #128 | Exceptional 17.0% |
| Immigrants | Uruguay | 92.9 /100 | #129 | Exceptional 17.0% |
| Immigrants | Vietnam | 92.4 /100 | #130 | Exceptional 17.0% |
| Immigrants | Germany | 92.1 /100 | #131 | Exceptional 17.0% |
| Whites/Caucasians | 92.1 /100 | #132 | Exceptional 17.0% |
| Immigrants | Jordan | 91.9 /100 | #133 | Exceptional 17.0% |
| Immigrants | Chile | 91.7 /100 | #134 | Exceptional 17.0% |
| Lebanese | 91.3 /100 | #135 | Exceptional 17.0% |
| Israelis | 91.0 /100 | #136 | Exceptional 17.0% |
| Immigrants | Norway | 90.9 /100 | #137 | Exceptional 17.0% |
| Welsh | 90.8 /100 | #138 | Exceptional 17.0% |
| French | 90.0 /100 | #139 | Excellent 17.0% |
| Chileans | 89.9 /100 | #140 | Excellent 17.0% |