British West Indian vs Hmong Vision Disability
COMPARE
British West Indian
Hmong
Vision Disability
Vision Disability Comparison
British West Indians
Hmong
2.4%
VISION DISABILITY
0.2/ 100
METRIC RATING
258th/ 347
METRIC RANK
2.3%
VISION DISABILITY
2.5/ 100
METRIC RATING
228th/ 347
METRIC RANK
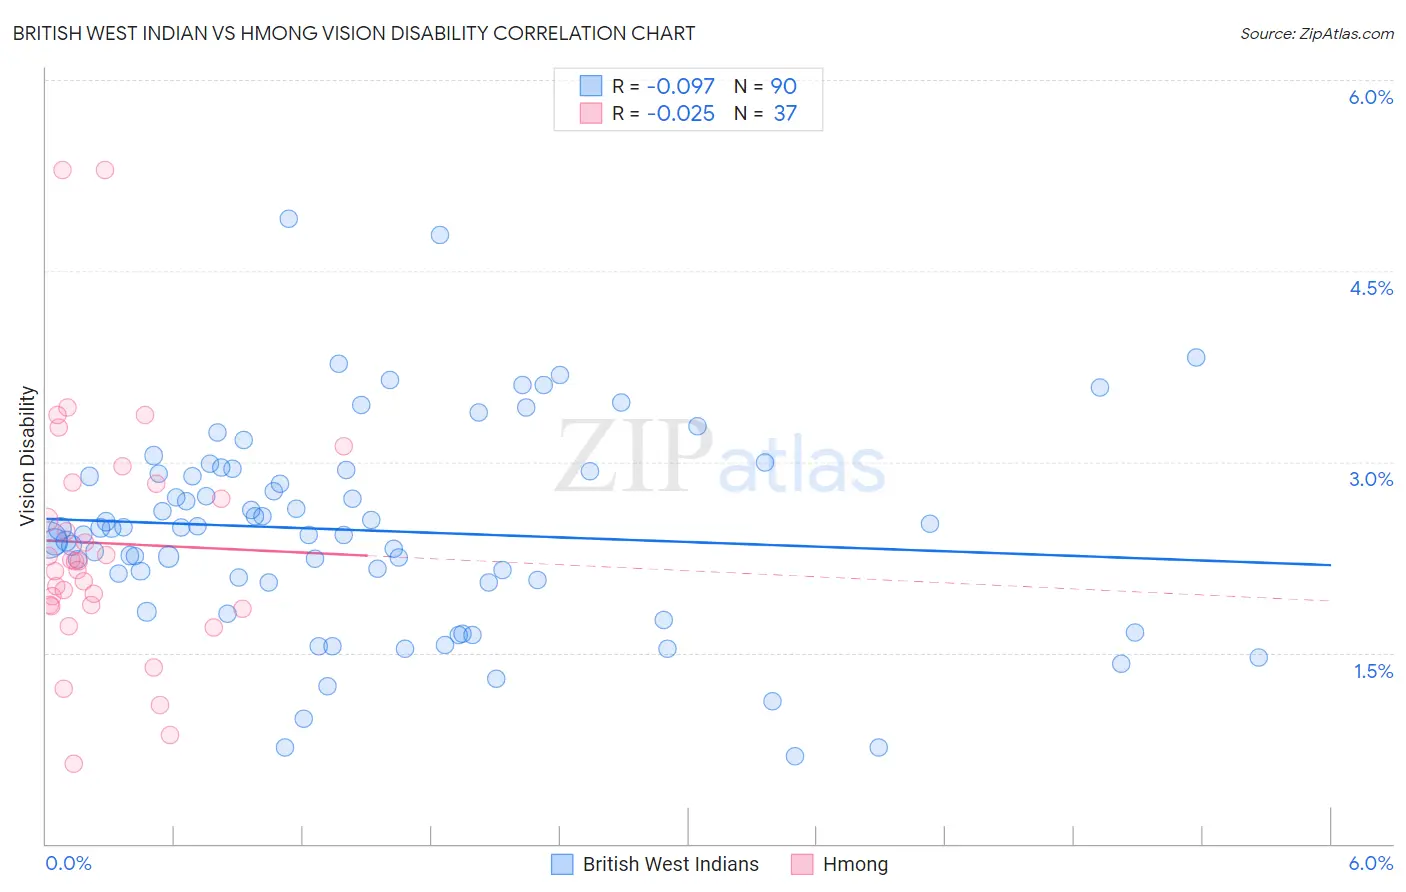
British West Indian vs Hmong Vision Disability Correlation Chart
The statistical analysis conducted on geographies consisting of 152,656,030 people shows a slight negative correlation between the proportion of British West Indians and percentage of population with vision disability in the United States with a correlation coefficient (R) of -0.097 and weighted average of 2.4%. Similarly, the statistical analysis conducted on geographies consisting of 24,669,236 people shows no correlation between the proportion of Hmong and percentage of population with vision disability in the United States with a correlation coefficient (R) of -0.025 and weighted average of 2.3%, a difference of 3.8%.
Vision Disability Correlation Summary
| Measurement | British West Indian | Hmong |
| Minimum | 0.69% | 0.63% |
| Maximum | 4.9% | 5.3% |
| Range | 4.2% | 4.7% |
| Mean | 2.5% | 2.4% |
| Median | 2.5% | 2.2% |
| Interquartile 25% (IQ1) | 2.1% | 1.9% |
| Interquartile 75% (IQ3) | 2.9% | 2.8% |
| Interquartile Range (IQR) | 0.88% | 0.96% |
| Standard Deviation (Sample) | 0.81% | 0.98% |
| Standard Deviation (Population) | 0.80% | 0.97% |
Similar Demographics by Vision Disability
Demographics Similar to British West Indians by Vision Disability
In terms of vision disability, the demographic groups most similar to British West Indians are White/Caucasian (2.4%, a difference of 0.010%), West Indian (2.4%, a difference of 0.030%), Immigrants from Haiti (2.4%, a difference of 0.10%), Belizean (2.4%, a difference of 0.18%), and Fijian (2.4%, a difference of 0.40%).
| Demographics | Rating | Rank | Vision Disability |
| Immigrants | Laos | 0.4 /100 | #251 | Tragic 2.4% |
| Immigrants | Micronesia | 0.3 /100 | #252 | Tragic 2.4% |
| Japanese | 0.3 /100 | #253 | Tragic 2.4% |
| Haitians | 0.3 /100 | #254 | Tragic 2.4% |
| Immigrants | Guatemala | 0.3 /100 | #255 | Tragic 2.4% |
| Immigrants | Haiti | 0.2 /100 | #256 | Tragic 2.4% |
| West Indians | 0.2 /100 | #257 | Tragic 2.4% |
| British West Indians | 0.2 /100 | #258 | Tragic 2.4% |
| Whites/Caucasians | 0.2 /100 | #259 | Tragic 2.4% |
| Belizeans | 0.2 /100 | #260 | Tragic 2.4% |
| Fijians | 0.1 /100 | #261 | Tragic 2.4% |
| Jamaicans | 0.1 /100 | #262 | Tragic 2.4% |
| Immigrants | Belize | 0.1 /100 | #263 | Tragic 2.4% |
| Immigrants | Liberia | 0.1 /100 | #264 | Tragic 2.4% |
| Immigrants | Jamaica | 0.1 /100 | #265 | Tragic 2.4% |
Demographics Similar to Hmong by Vision Disability
In terms of vision disability, the demographic groups most similar to Hmong are Welsh (2.3%, a difference of 0.080%), Nicaraguan (2.3%, a difference of 0.15%), Hawaiian (2.3%, a difference of 0.24%), Immigrants from Germany (2.3%, a difference of 0.29%), and Immigrants from Ecuador (2.3%, a difference of 0.31%).
| Demographics | Rating | Rank | Vision Disability |
| French Canadians | 3.9 /100 | #221 | Tragic 2.3% |
| Immigrants | Senegal | 3.8 /100 | #222 | Tragic 2.3% |
| Basques | 3.5 /100 | #223 | Tragic 2.3% |
| Irish | 3.4 /100 | #224 | Tragic 2.3% |
| Immigrants | Western Africa | 3.4 /100 | #225 | Tragic 2.3% |
| Immigrants | Germany | 3.0 /100 | #226 | Tragic 2.3% |
| Hawaiians | 2.9 /100 | #227 | Tragic 2.3% |
| Hmong | 2.5 /100 | #228 | Tragic 2.3% |
| Welsh | 2.3 /100 | #229 | Tragic 2.3% |
| Nicaraguans | 2.2 /100 | #230 | Tragic 2.3% |
| Immigrants | Ecuador | 2.0 /100 | #231 | Tragic 2.3% |
| German Russians | 1.8 /100 | #232 | Tragic 2.3% |
| Central Americans | 1.8 /100 | #233 | Tragic 2.3% |
| Scottish | 1.6 /100 | #234 | Tragic 2.3% |
| Marshallese | 1.5 /100 | #235 | Tragic 2.3% |