Blackfeet vs Belgian Ambulatory Disability
COMPARE
Blackfeet
Belgian
Ambulatory Disability
Ambulatory Disability Comparison
Blackfeet
Belgians
7.1%
AMBULATORY DISABILITY
0.0/ 100
METRIC RATING
314th/ 347
METRIC RANK
6.2%
AMBULATORY DISABILITY
28.6/ 100
METRIC RATING
195th/ 347
METRIC RANK
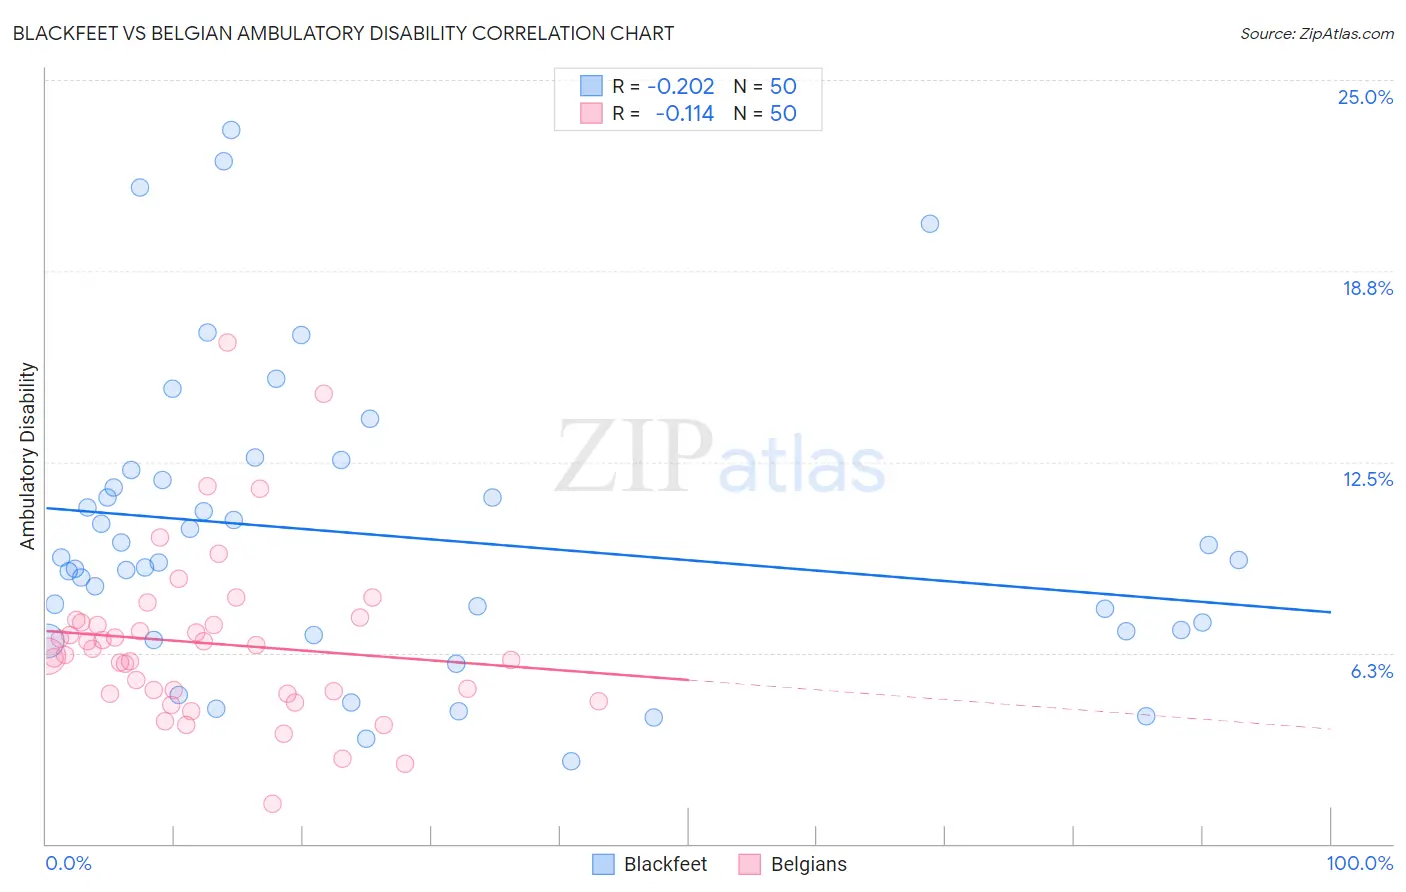
Blackfeet vs Belgian Ambulatory Disability Correlation Chart
The statistical analysis conducted on geographies consisting of 309,475,903 people shows a weak negative correlation between the proportion of Blackfeet and percentage of population with ambulatory disability in the United States with a correlation coefficient (R) of -0.202 and weighted average of 7.1%. Similarly, the statistical analysis conducted on geographies consisting of 355,928,519 people shows a poor negative correlation between the proportion of Belgians and percentage of population with ambulatory disability in the United States with a correlation coefficient (R) of -0.114 and weighted average of 6.2%, a difference of 15.2%.
Ambulatory Disability Correlation Summary
| Measurement | Blackfeet | Belgian |
| Minimum | 2.7% | 1.3% |
| Maximum | 23.4% | 16.4% |
| Range | 20.7% | 15.1% |
| Mean | 10.1% | 6.6% |
| Median | 9.2% | 6.3% |
| Interquartile 25% (IQ1) | 6.9% | 4.9% |
| Interquartile 75% (IQ3) | 11.9% | 7.2% |
| Interquartile Range (IQR) | 5.0% | 2.3% |
| Standard Deviation (Sample) | 4.8% | 2.8% |
| Standard Deviation (Population) | 4.8% | 2.7% |
Similar Demographics by Ambulatory Disability
Demographics Similar to Blackfeet by Ambulatory Disability
In terms of ambulatory disability, the demographic groups most similar to Blackfeet are Immigrants from Yemen (7.1%, a difference of 0.020%), Shoshone (7.1%, a difference of 0.020%), Delaware (7.1%, a difference of 0.15%), Immigrants from Dominican Republic (7.1%, a difference of 0.26%), and Central American Indian (7.2%, a difference of 0.34%).
| Demographics | Rating | Rank | Ambulatory Disability |
| Spanish Americans | 0.0 /100 | #307 | Tragic 7.1% |
| Chippewa | 0.0 /100 | #308 | Tragic 7.1% |
| Immigrants | Azores | 0.0 /100 | #309 | Tragic 7.1% |
| Arapaho | 0.0 /100 | #310 | Tragic 7.1% |
| Cree | 0.0 /100 | #311 | Tragic 7.1% |
| Delaware | 0.0 /100 | #312 | Tragic 7.1% |
| Immigrants | Yemen | 0.0 /100 | #313 | Tragic 7.1% |
| Blackfeet | 0.0 /100 | #314 | Tragic 7.1% |
| Shoshone | 0.0 /100 | #315 | Tragic 7.1% |
| Immigrants | Dominican Republic | 0.0 /100 | #316 | Tragic 7.1% |
| Central American Indians | 0.0 /100 | #317 | Tragic 7.2% |
| Ottawa | 0.0 /100 | #318 | Tragic 7.2% |
| Dominicans | 0.0 /100 | #319 | Tragic 7.2% |
| Potawatomi | 0.0 /100 | #320 | Tragic 7.3% |
| Apache | 0.0 /100 | #321 | Tragic 7.4% |
Demographics Similar to Belgians by Ambulatory Disability
In terms of ambulatory disability, the demographic groups most similar to Belgians are Malaysian (6.2%, a difference of 0.030%), Guatemalan (6.2%, a difference of 0.080%), Alaska Native (6.2%, a difference of 0.080%), Polish (6.2%, a difference of 0.15%), and Immigrants from Western Europe (6.2%, a difference of 0.19%).
| Demographics | Rating | Rank | Ambulatory Disability |
| British | 34.3 /100 | #188 | Fair 6.2% |
| Ukrainians | 34.0 /100 | #189 | Fair 6.2% |
| Immigrants | Western Africa | 33.4 /100 | #190 | Fair 6.2% |
| Immigrants | Guatemala | 31.9 /100 | #191 | Fair 6.2% |
| Immigrants | Western Europe | 31.6 /100 | #192 | Fair 6.2% |
| Guatemalans | 30.0 /100 | #193 | Fair 6.2% |
| Alaska Natives | 29.8 /100 | #194 | Fair 6.2% |
| Belgians | 28.6 /100 | #195 | Fair 6.2% |
| Malaysians | 28.2 /100 | #196 | Fair 6.2% |
| Poles | 26.3 /100 | #197 | Fair 6.2% |
| Immigrants | Bangladesh | 24.6 /100 | #198 | Fair 6.2% |
| Italians | 22.6 /100 | #199 | Fair 6.2% |
| Immigrants | Cambodia | 21.5 /100 | #200 | Fair 6.2% |
| Immigrants | Central America | 20.1 /100 | #201 | Fair 6.2% |
| Albanians | 19.7 /100 | #202 | Poor 6.2% |