Bermudan vs Immigrants from Pakistan Hearing Disability

COMPARE

Bermudan
Race
Ancestry
AfghanAfricanAlaska NativeAlaskan AthabascanAlbanianAleutAlsatianAmericanApacheArabArapahoArgentineanArmenianAssyrian/Chaldean/SyriacAustralianAustrianBahamianBangladeshiBarbadianBasqueBelgianBelizeanBermudanBhutaneseBlackfeetBolivianBrazilianBritishBritish West IndianBulgarianBurmeseCajunCambodianCanadianCape VerdeanCarpatho RusynCelticCentral AmericanCentral American IndianCherokeeCheyenneChickasawChileanChineseChippewaChoctawColombianColvilleComancheCosta RicanCreeCreekCroatianCrowCubanCypriotCzechCzechoslovakianDanishDelawareDominicanDutchDutch West IndianEastern EuropeanEcuadorianEgyptianEnglishEstonianEthiopianEuropeanFijianFilipinoFinnishFrenchFrench American IndianFrench CanadianGermanGerman RussianGhanaianGreekGuamanian/ChamorroGuatemalanGuyaneseHaitianHmongHonduranHopiHoumaHungarianIcelanderIndian (Asian)IndonesianInupiatIranianIraqiIrishIroquoisIsraeliItalianJamaicanJapaneseJordanianKenyanKiowaKoreanLaotianLatvianLebaneseLiberianLithuanianLumbeeLuxembourgerMacedonianMalaysianMalteseMarshalleseMenomineeMexicanMexican American IndianMongolianMoroccanNative HawaiianNavajoNepaleseNew ZealanderNicaraguanNigerianNorthern EuropeanNorwegianOkinawanOsageOttawaPaiutePakistaniPalestinianPanamanianParaguayanPennsylvania GermanPeruvianPimaPolishPortuguesePotawatomiPuebloPuerto RicanPuget Sound SalishRomanianRussianSalvadoranSamoanScandinavianScotch-IrishScottishSeminoleSenegaleseSerbianShoshoneSierra LeoneanSiouxSlavicSlovakSloveneSomaliSouth AfricanSouth AmericanSouth American IndianSoviet UnionSpaniardSpanishSpanish AmericanSpanish American IndianSri LankanSubsaharan AfricanSudaneseSwedishSwissSyrianTaiwaneseThaiTlingit-HaidaTohono O'OdhamTonganTrinidadian and TobagonianTsimshianTurkishU.S. Virgin IslanderUgandanUkrainianUruguayanUteVenezuelanVietnameseWelshWest IndianYakamaYaquiYugoslavianYumanYup'ikZimbabwean
Immigration
NonimmigrantsImmigrantsAfghanistanAfricaAlbaniaArgentinaArmeniaAsiaAustraliaAustriaBahamasBangladeshBarbadosBelarusBelgiumBelizeBoliviaBosnia and HerzegovinaBrazilBulgariaBurma/MyanmarCabo VerdeCambodiaCameroonCanadaCaribbeanCentral AmericaChileChinaColombiaCongoCosta RicaCroatiaCubaCzechoslovakiaDenmarkDominicaDominican RepublicEastern AfricaEastern AsiaEastern EuropeEcuadorEgyptEl SalvadorEnglandEritreaEthiopiaEuropeFijiFranceGermanyGhanaGreeceGrenadaGuatemalaGuyanaHaitiHondurasHong KongHungaryIndiaIndonesiaIranIraqIrelandIsraelItalyJamaicaJapanJordanKazakhstanKenyaKoreaKuwaitLaosLatin AmericaLatviaLebanonLiberiaLithuaniaMalaysiaMexicoMicronesiaMiddle AfricaMoldovaMoroccoNepalNetherlandsNicaraguaNigeriaNorth AmericaNorth MacedoniaNorthern AfricaNorthern EuropeNorwayOceaniaPanamaPeruPhilippinesPolandPortugalRomaniaRussiaSaudi ArabiaScotlandSenegalSerbiaSierra LeoneSingaporeSomaliaSouth AfricaSouth AmericaSouth Central AsiaSouth Eastern AsiaSouthern EuropeSpainSri LankaSt. Vincent and the GrenadinesSudanSwedenSwitzerlandSyriaTaiwanThailandTrinidad and TobagoTurkeyUgandaUkraineUruguayUzbekistanVenezuelaVietnamWest IndiesWestern AfricaWestern AsiaWestern EuropeYemenZaireZimbabweAzores
Immigrants from Pakistan
Race
Ancestry
AfghanAfricanAlaska NativeAlaskan AthabascanAlbanianAleutAlsatianAmericanApacheArabArapahoArgentineanArmenianAssyrian/Chaldean/SyriacAustralianAustrianBahamianBangladeshiBarbadianBasqueBelgianBelizeanBhutaneseBlackfeetBolivianBrazilianBritishBritish West IndianBulgarianBurmeseCajunCambodianCanadianCape VerdeanCarpatho RusynCelticCentral AmericanCentral American IndianCherokeeCheyenneChickasawChileanChineseChippewaChoctawColombianColvilleComancheCosta RicanCreeCreekCroatianCrowCubanCypriotCzechCzechoslovakianDanishDelawareDominicanDutchDutch West IndianEastern EuropeanEcuadorianEgyptianEnglishEstonianEthiopianEuropeanFijianFilipinoFinnishFrenchFrench American IndianFrench CanadianGermanGerman RussianGhanaianGreekGuamanian/ChamorroGuatemalanGuyaneseHaitianHmongHonduranHopiHoumaHungarianIcelanderIndian (Asian)IndonesianInupiatIranianIraqiIrishIroquoisIsraeliItalianJamaicanJapaneseJordanianKenyanKiowaKoreanLaotianLatvianLebaneseLiberianLithuanianLumbeeLuxembourgerMacedonianMalaysianMalteseMarshalleseMenomineeMexicanMexican American IndianMongolianMoroccanNative HawaiianNavajoNepaleseNew ZealanderNicaraguanNigerianNorthern EuropeanNorwegianOkinawanOsageOttawaPaiutePakistaniPalestinianPanamanianParaguayanPennsylvania GermanPeruvianPimaPolishPortuguesePotawatomiPuebloPuerto RicanPuget Sound SalishRomanianRussianSalvadoranSamoanScandinavianScotch-IrishScottishSeminoleSenegaleseSerbianShoshoneSierra LeoneanSiouxSlavicSlovakSloveneSomaliSouth AfricanSouth AmericanSouth American IndianSoviet UnionSpaniardSpanishSpanish AmericanSpanish American IndianSri LankanSubsaharan AfricanSudaneseSwedishSwissSyrianTaiwaneseThaiTlingit-HaidaTohono O'OdhamTonganTrinidadian and TobagonianTsimshianTurkishU.S. Virgin IslanderUgandanUkrainianUruguayanUteVenezuelanVietnameseWelshWest IndianYakamaYaquiYugoslavianYumanYup'ikZimbabwean
Immigration
NonimmigrantsImmigrantsAfghanistanAfricaAlbaniaArgentinaArmeniaAsiaAustraliaAustriaBahamasBangladeshBarbadosBelarusBelgiumBelizeBoliviaBosnia and HerzegovinaBrazilBulgariaBurma/MyanmarCabo VerdeCambodiaCameroonCanadaCaribbeanCentral AmericaChileChinaColombiaCongoCosta RicaCroatiaCubaCzechoslovakiaDenmarkDominicaDominican RepublicEastern AfricaEastern AsiaEastern EuropeEcuadorEgyptEl SalvadorEnglandEritreaEthiopiaEuropeFijiFranceGermanyGhanaGreeceGrenadaGuatemalaGuyanaHaitiHondurasHong KongHungaryIndiaIndonesiaIranIraqIrelandIsraelItalyJamaicaJapanJordanKazakhstanKenyaKoreaKuwaitLaosLatin AmericaLatviaLebanonLiberiaLithuaniaMalaysiaMexicoMicronesiaMiddle AfricaMoldovaMoroccoNepalNetherlandsNicaraguaNigeriaNorth AmericaNorth MacedoniaNorthern AfricaNorthern EuropeNorwayOceaniaPakistanPanamaPeruPhilippinesPolandPortugalRomaniaRussiaSaudi ArabiaScotlandSenegalSerbiaSierra LeoneSingaporeSomaliaSouth AfricaSouth AmericaSouth Central AsiaSouth Eastern AsiaSouthern EuropeSpainSri LankaSt. Vincent and the GrenadinesSudanSwedenSwitzerlandSyriaTaiwanThailandTrinidad and TobagoTurkeyUgandaUkraineUruguayUzbekistanVenezuelaVietnamWest IndiesWestern AfricaWestern AsiaWestern EuropeYemenZaireZimbabweAzores
Hearing Disability
Income
Poverty
Unemployment
Labor Participation
Family Structure
Vehicle Availability
Education Level
Disability

Hearing Disability Comparison

Bermudans

Immigrants from Pakistan

Excellent
Exceptional
2.9%
HEARING DISABILITY
83.8/ 100
METRIC RATING
139th/ 347
METRIC RANK
2.6%
HEARING DISABILITY
99.6/ 100
METRIC RATING
34th/ 347
METRIC RANK

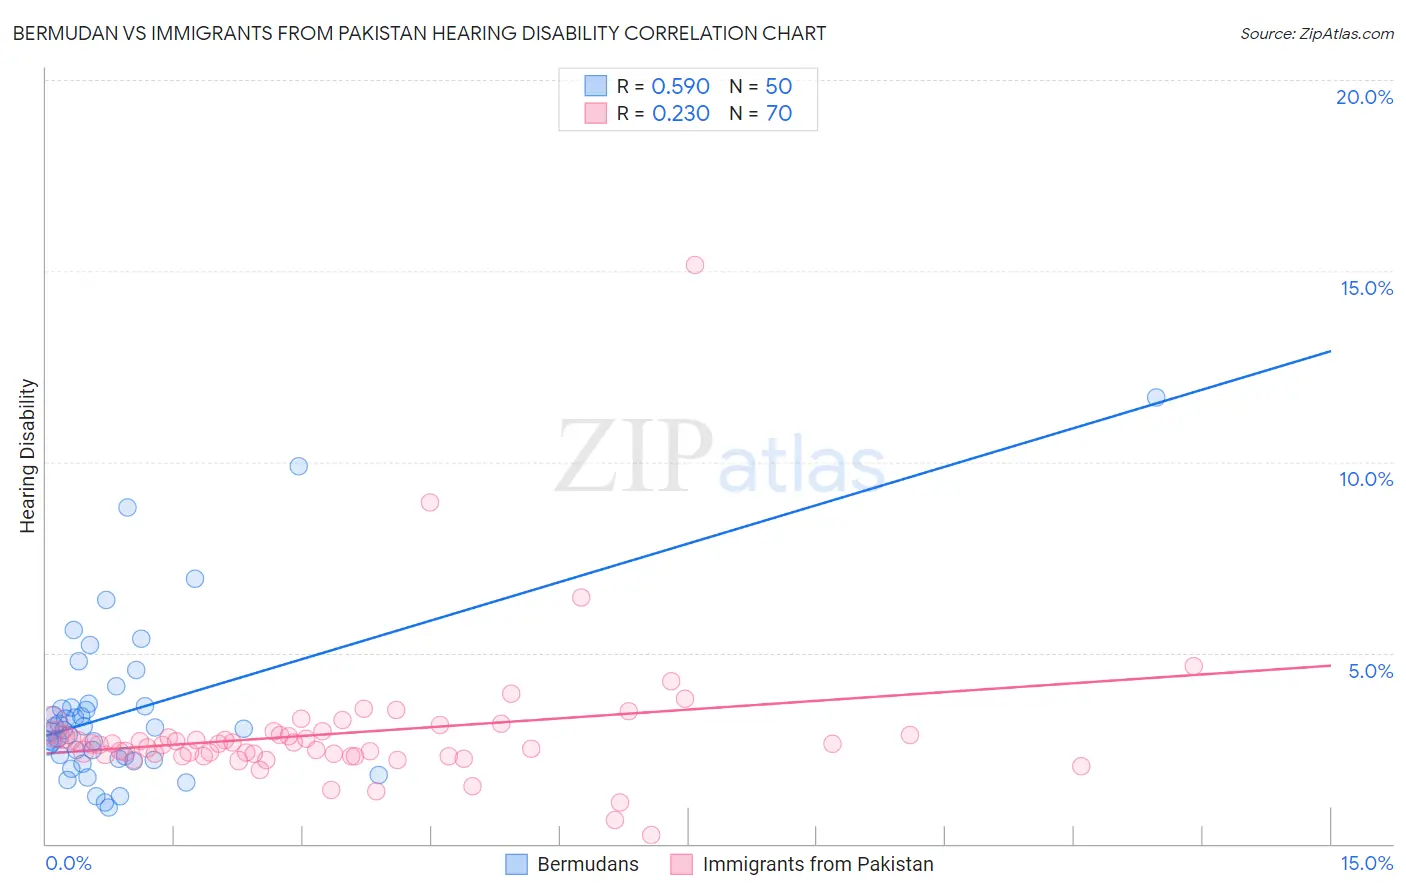
Bermudan vs Immigrants from Pakistan Hearing Disability Correlation Chart

The statistical analysis conducted on geographies consisting of 55,720,149 people shows a substantial positive correlation between the proportion of Bermudans and percentage of population with hearing disability in the United States with a correlation coefficient (R) of 0.590 and weighted average of 2.9%. Similarly, the statistical analysis conducted on geographies consisting of 283,855,672 people shows a weak positive correlation between the proportion of Immigrants from Pakistan and percentage of population with hearing disability in the United States with a correlation coefficient (R) of 0.230 and weighted average of 2.6%, a difference of 10.5%.
Bermudan vs Immigrants from Pakistan Hearing Disability

Hearing Disability Correlation Summary

MeasurementBermudanImmigrants from Pakistan
Minimum0.95%0.24%
Maximum11.7%15.2%
Range10.7%14.9%
Mean3.5%2.9%
Median3.0%2.6%
Interquartile 25% (IQ1)2.2%2.3%
Interquartile 75% (IQ3)3.6%2.9%
Interquartile Range (IQR)1.4%0.56%
Standard Deviation (Sample)2.1%1.9%
Standard Deviation (Population)2.1%1.9%

Similar Demographics by Hearing Disability

Demographics Similar to Bermudans by Hearing Disability

In terms of hearing disability, the demographic groups most similar to Bermudans are Immigrants from Jordan (2.9%, a difference of 0.020%), Sri Lankan (2.9%, a difference of 0.050%), Immigrants from Costa Rica (2.9%, a difference of 0.050%), Subsaharan African (2.9%, a difference of 0.090%), and Immigrants from Brazil (2.9%, a difference of 0.15%).
DemographicsRating | RankHearing Disability
Chileans
85.8
/100
|
#132
Excellent
2.9%
Immigrants | Syria
85.8
/100
|
#133
Excellent
2.9%
Ugandans
85.5
/100
|
#134
Excellent
2.9%
Soviet Union
84.8
/100
|
#135
Excellent
2.9%
Immigrants | Brazil
84.6
/100
|
#136
Excellent
2.9%
Sri Lankans
84.1
/100
|
#137
Excellent
2.9%
Immigrants | Costa Rica
84.0
/100
|
#138
Excellent
2.9%
Bermudans
83.8
/100
|
#139
Excellent
2.9%
Immigrants | Jordan
83.7
/100
|
#140
Excellent
2.9%
Sub-Saharan Africans
83.3
/100
|
#141
Excellent
2.9%
Laotians
81.1
/100
|
#142
Excellent
2.9%
Immigrants | Bahamas
80.9
/100
|
#143
Excellent
2.9%
Immigrants | Bulgaria
79.2
/100
|
#144
Good
2.9%
Immigrants | Congo
78.9
/100
|
#145
Good
2.9%
Brazilians
78.7
/100
|
#146
Good
2.9%

Demographics Similar to Immigrants from Pakistan by Hearing Disability

In terms of hearing disability, the demographic groups most similar to Immigrants from Pakistan are Filipino (2.6%, a difference of 0.040%), Salvadoran (2.6%, a difference of 0.12%), Immigrants from Venezuela (2.6%, a difference of 0.30%), Okinawan (2.6%, a difference of 0.35%), and Immigrants from Western Africa (2.6%, a difference of 0.37%).
DemographicsRating | RankHearing Disability
Immigrants | South Central Asia
99.7
/100
|
#27
Exceptional
2.6%
Immigrants | Haiti
99.7
/100
|
#28
Exceptional
2.6%
Bolivians
99.7
/100
|
#29
Exceptional
2.6%
Immigrants | Caribbean
99.7
/100
|
#30
Exceptional
2.6%
Immigrants | Cameroon
99.7
/100
|
#31
Exceptional
2.6%
Immigrants | Venezuela
99.7
/100
|
#32
Exceptional
2.6%
Filipinos
99.6
/100
|
#33
Exceptional
2.6%
Immigrants | Pakistan
99.6
/100
|
#34
Exceptional
2.6%
Salvadorans
99.6
/100
|
#35
Exceptional
2.6%
Okinawans
99.6
/100
|
#36
Exceptional
2.6%
Immigrants | Western Africa
99.6
/100
|
#37
Exceptional
2.6%
Immigrants | Jamaica
99.5
/100
|
#38
Exceptional
2.6%
Immigrants | China
99.5
/100
|
#39
Exceptional
2.6%
Haitians
99.5
/100
|
#40
Exceptional
2.6%
Immigrants | Taiwan
99.4
/100
|
#41
Exceptional
2.6%