Belizean vs Immigrants from Austria Disability Age 35 to 64

COMPARE

Belizean
Race
Ancestry
AfghanAfricanAlaska NativeAlaskan AthabascanAlbanianAleutAlsatianAmericanApacheArabArapahoArgentineanArmenianAssyrian/Chaldean/SyriacAustralianAustrianBahamianBangladeshiBarbadianBasqueBelgianBelizeanBermudanBhutaneseBlackfeetBolivianBrazilianBritishBritish West IndianBulgarianBurmeseCajunCambodianCanadianCape VerdeanCarpatho RusynCelticCentral AmericanCentral American IndianCherokeeCheyenneChickasawChileanChineseChippewaChoctawColombianColvilleComancheCosta RicanCreeCreekCroatianCrowCubanCypriotCzechCzechoslovakianDanishDelawareDominicanDutchDutch West IndianEastern EuropeanEcuadorianEgyptianEnglishEstonianEthiopianEuropeanFijianFilipinoFinnishFrenchFrench American IndianFrench CanadianGermanGerman RussianGhanaianGreekGuamanian/ChamorroGuatemalanGuyaneseHaitianHmongHonduranHopiHoumaHungarianIcelanderIndian (Asian)IndonesianInupiatIranianIraqiIrishIroquoisIsraeliItalianJamaicanJapaneseJordanianKenyanKiowaKoreanLaotianLatvianLebaneseLiberianLithuanianLumbeeLuxembourgerMacedonianMalaysianMalteseMarshalleseMenomineeMexicanMexican American IndianMongolianMoroccanNative HawaiianNavajoNepaleseNew ZealanderNicaraguanNigerianNorthern EuropeanNorwegianOkinawanOsageOttawaPaiutePakistaniPalestinianPanamanianParaguayanPennsylvania GermanPeruvianPimaPolishPortuguesePotawatomiPuebloPuerto RicanPuget Sound SalishRomanianRussianSalvadoranSamoanScandinavianScotch-IrishScottishSeminoleSenegaleseSerbianShoshoneSierra LeoneanSiouxSlavicSlovakSloveneSomaliSouth AfricanSouth AmericanSouth American IndianSoviet UnionSpaniardSpanishSpanish AmericanSpanish American IndianSri LankanSubsaharan AfricanSudaneseSwedishSwissSyrianTaiwaneseThaiTlingit-HaidaTohono O'OdhamTonganTrinidadian and TobagonianTsimshianTurkishU.S. Virgin IslanderUgandanUkrainianUruguayanUteVenezuelanVietnameseWelshWest IndianYakamaYaquiYugoslavianYumanYup'ikZimbabwean
Immigration
NonimmigrantsImmigrantsAfghanistanAfricaAlbaniaArgentinaArmeniaAsiaAustraliaBahamasBangladeshBarbadosBelarusBelgiumBelizeBoliviaBosnia and HerzegovinaBrazilBulgariaBurma/MyanmarCabo VerdeCambodiaCameroonCanadaCaribbeanCentral AmericaChileChinaColombiaCongoCosta RicaCroatiaCubaCzechoslovakiaDenmarkDominicaDominican RepublicEastern AfricaEastern AsiaEastern EuropeEcuadorEgyptEl SalvadorEnglandEritreaEthiopiaEuropeFijiFranceGermanyGhanaGreeceGrenadaGuatemalaGuyanaHaitiHondurasHong KongHungaryIndiaIndonesiaIranIraqIrelandIsraelItalyJamaicaJapanJordanKazakhstanKenyaKoreaKuwaitLaosLatin AmericaLatviaLebanonLiberiaLithuaniaMalaysiaMexicoMicronesiaMiddle AfricaMoldovaMoroccoNepalNetherlandsNicaraguaNigeriaNorth AmericaNorth MacedoniaNorthern AfricaNorthern EuropeNorwayOceaniaPakistanPanamaPeruPhilippinesPolandPortugalRomaniaRussiaSaudi ArabiaScotlandSenegalSerbiaSierra LeoneSingaporeSomaliaSouth AfricaSouth AmericaSouth Central AsiaSouth Eastern AsiaSouthern EuropeSpainSri LankaSt. Vincent and the GrenadinesSudanSwedenSwitzerlandSyriaTaiwanThailandTrinidad and TobagoTurkeyUgandaUkraineUruguayUzbekistanVenezuelaVietnamWest IndiesWestern AfricaWestern AsiaWestern EuropeYemenZaireZimbabweAzores
Immigrants from Austria
Race
Ancestry
AfghanAfricanAlaska NativeAlaskan AthabascanAlbanianAleutAlsatianAmericanApacheArabArapahoArgentineanArmenianAssyrian/Chaldean/SyriacAustralianAustrianBahamianBangladeshiBarbadianBasqueBelgianBermudanBhutaneseBlackfeetBolivianBrazilianBritishBritish West IndianBulgarianBurmeseCajunCambodianCanadianCape VerdeanCarpatho RusynCelticCentral AmericanCentral American IndianCherokeeCheyenneChickasawChileanChineseChippewaChoctawColombianColvilleComancheCosta RicanCreeCreekCroatianCrowCubanCypriotCzechCzechoslovakianDanishDelawareDominicanDutchDutch West IndianEastern EuropeanEcuadorianEgyptianEnglishEstonianEthiopianEuropeanFijianFilipinoFinnishFrenchFrench American IndianFrench CanadianGermanGerman RussianGhanaianGreekGuamanian/ChamorroGuatemalanGuyaneseHaitianHmongHonduranHopiHoumaHungarianIcelanderIndian (Asian)IndonesianInupiatIranianIraqiIrishIroquoisIsraeliItalianJamaicanJapaneseJordanianKenyanKiowaKoreanLaotianLatvianLebaneseLiberianLithuanianLumbeeLuxembourgerMacedonianMalaysianMalteseMarshalleseMenomineeMexicanMexican American IndianMongolianMoroccanNative HawaiianNavajoNepaleseNew ZealanderNicaraguanNigerianNorthern EuropeanNorwegianOkinawanOsageOttawaPaiutePakistaniPalestinianPanamanianParaguayanPennsylvania GermanPeruvianPimaPolishPortuguesePotawatomiPuebloPuerto RicanPuget Sound SalishRomanianRussianSalvadoranSamoanScandinavianScotch-IrishScottishSeminoleSenegaleseSerbianShoshoneSierra LeoneanSiouxSlavicSlovakSloveneSomaliSouth AfricanSouth AmericanSouth American IndianSoviet UnionSpaniardSpanishSpanish AmericanSpanish American IndianSri LankanSubsaharan AfricanSudaneseSwedishSwissSyrianTaiwaneseThaiTlingit-HaidaTohono O'OdhamTonganTrinidadian and TobagonianTsimshianTurkishU.S. Virgin IslanderUgandanUkrainianUruguayanUteVenezuelanVietnameseWelshWest IndianYakamaYaquiYugoslavianYumanYup'ikZimbabwean
Immigration
NonimmigrantsImmigrantsAfghanistanAfricaAlbaniaArgentinaArmeniaAsiaAustraliaAustriaBahamasBangladeshBarbadosBelarusBelgiumBelizeBoliviaBosnia and HerzegovinaBrazilBulgariaBurma/MyanmarCabo VerdeCambodiaCameroonCanadaCaribbeanCentral AmericaChileChinaColombiaCongoCosta RicaCroatiaCubaCzechoslovakiaDenmarkDominicaDominican RepublicEastern AfricaEastern AsiaEastern EuropeEcuadorEgyptEl SalvadorEnglandEritreaEthiopiaEuropeFijiFranceGermanyGhanaGreeceGrenadaGuatemalaGuyanaHaitiHondurasHong KongHungaryIndiaIndonesiaIranIraqIrelandIsraelItalyJamaicaJapanJordanKazakhstanKenyaKoreaKuwaitLaosLatin AmericaLatviaLebanonLiberiaLithuaniaMalaysiaMexicoMicronesiaMiddle AfricaMoldovaMoroccoNepalNetherlandsNicaraguaNigeriaNorth AmericaNorth MacedoniaNorthern AfricaNorthern EuropeNorwayOceaniaPakistanPanamaPeruPhilippinesPolandPortugalRomaniaRussiaSaudi ArabiaScotlandSenegalSerbiaSierra LeoneSingaporeSomaliaSouth AfricaSouth AmericaSouth Central AsiaSouth Eastern AsiaSouthern EuropeSpainSri LankaSt. Vincent and the GrenadinesSudanSwedenSwitzerlandSyriaTaiwanThailandTrinidad and TobagoTurkeyUgandaUkraineUruguayUzbekistanVenezuelaVietnamWest IndiesWestern AfricaWestern AsiaWestern EuropeYemenZaireZimbabweAzores
Disability Age 35 to 64
Income
Poverty
Unemployment
Labor Participation
Family Structure
Vehicle Availability
Education Level
Disability

Disability Age 35 to 64 Comparison

Belizeans

Immigrants from Austria

Tragic
Exceptional
12.0%
DISABILITY AGE 35 TO 64
4.5/ 100
METRIC RATING
235th/ 347
METRIC RANK
10.4%
DISABILITY AGE 35 TO 64
97.8/ 100
METRIC RATING
104th/ 347
METRIC RANK

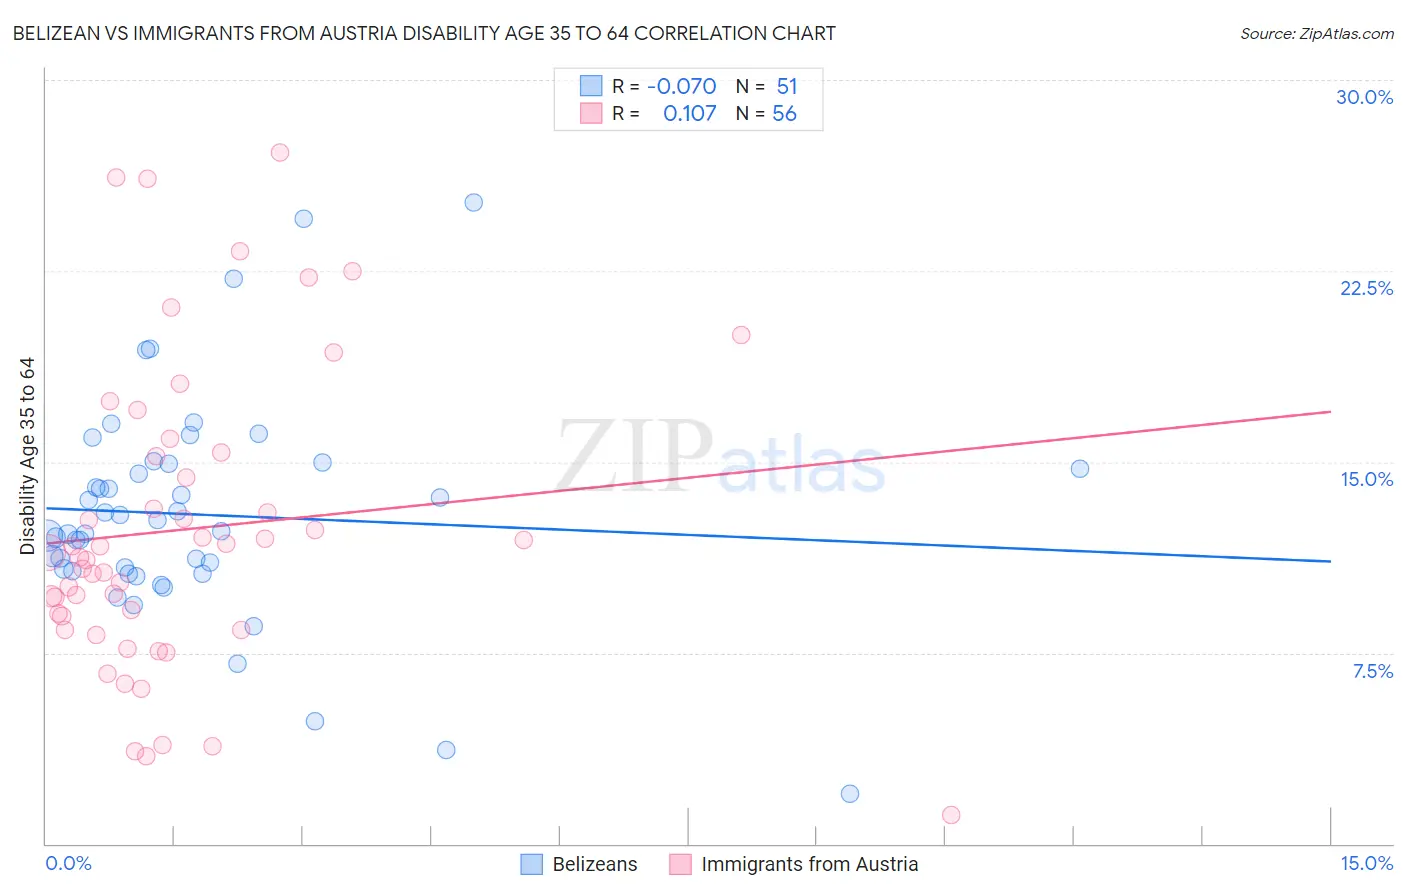
Belizean vs Immigrants from Austria Disability Age 35 to 64 Correlation Chart

The statistical analysis conducted on geographies consisting of 144,151,264 people shows a slight negative correlation between the proportion of Belizeans and percentage of population with a disability between the ages 34 and 64 in the United States with a correlation coefficient (R) of -0.070 and weighted average of 12.0%. Similarly, the statistical analysis conducted on geographies consisting of 167,953,043 people shows a poor positive correlation between the proportion of Immigrants from Austria and percentage of population with a disability between the ages 34 and 64 in the United States with a correlation coefficient (R) of 0.107 and weighted average of 10.4%, a difference of 14.9%.
Belizean vs Immigrants from Austria Disability Age 35 to 64

Disability Age 35 to 64 Correlation Summary

MeasurementBelizeanImmigrants from Austria
Minimum2.0%1.1%
Maximum25.2%27.1%
Range23.2%26.0%
Mean12.9%12.3%
Median12.3%11.4%
Interquartile 25% (IQ1)10.7%8.7%
Interquartile 75% (IQ3)14.9%15.3%
Interquartile Range (IQR)4.2%6.6%
Standard Deviation (Sample)4.3%6.0%
Standard Deviation (Population)4.3%5.9%

Similar Demographics by Disability Age 35 to 64

Demographics Similar to Belizeans by Disability Age 35 to 64

In terms of disability age 35 to 64, the demographic groups most similar to Belizeans are Immigrants from Middle Africa (12.0%, a difference of 0.020%), Portuguese (11.9%, a difference of 0.13%), Bermudan (11.9%, a difference of 0.21%), Immigrants from Cambodia (12.0%, a difference of 0.28%), and Sudanese (11.9%, a difference of 0.31%).
DemographicsRating | RankDisability Age 35 to 64
Immigrants | Germany
6.2
/100
|
#228
Tragic
11.9%
British West Indians
6.1
/100
|
#229
Tragic
11.9%
Panamanians
5.8
/100
|
#230
Tragic
11.9%
Jamaicans
5.7
/100
|
#231
Tragic
11.9%
Sudanese
5.3
/100
|
#232
Tragic
11.9%
Bermudans
5.0
/100
|
#233
Tragic
11.9%
Portuguese
4.9
/100
|
#234
Tragic
11.9%
Belizeans
4.5
/100
|
#235
Tragic
12.0%
Immigrants | Middle Africa
4.5
/100
|
#236
Tragic
12.0%
Immigrants | Cambodia
3.9
/100
|
#237
Tragic
12.0%
West Indians
3.7
/100
|
#238
Tragic
12.0%
Immigrants | Western Africa
3.3
/100
|
#239
Tragic
12.0%
Immigrants | Thailand
3.3
/100
|
#240
Tragic
12.0%
Mexican American Indians
3.2
/100
|
#241
Tragic
12.0%
Samoans
2.8
/100
|
#242
Tragic
12.1%

Demographics Similar to Immigrants from Austria by Disability Age 35 to 64

In terms of disability age 35 to 64, the demographic groups most similar to Immigrants from Austria are Macedonian (10.4%, a difference of 0.020%), Immigrants from Ukraine (10.4%, a difference of 0.14%), Immigrants from Western Asia (10.4%, a difference of 0.17%), Immigrants from Hungary (10.4%, a difference of 0.17%), and Immigrants from Philippines (10.4%, a difference of 0.23%).
DemographicsRating | RankDisability Age 35 to 64
Immigrants | Denmark
98.4
/100
|
#97
Exceptional
10.3%
Immigrants | Uruguay
98.3
/100
|
#98
Exceptional
10.3%
Palestinians
98.2
/100
|
#99
Exceptional
10.4%
Immigrants | Jordan
98.1
/100
|
#100
Exceptional
10.4%
Immigrants | Philippines
98.0
/100
|
#101
Exceptional
10.4%
Immigrants | Western Asia
98.0
/100
|
#102
Exceptional
10.4%
Immigrants | Ukraine
97.9
/100
|
#103
Exceptional
10.4%
Immigrants | Austria
97.8
/100
|
#104
Exceptional
10.4%
Macedonians
97.8
/100
|
#105
Exceptional
10.4%
Immigrants | Hungary
97.6
/100
|
#106
Exceptional
10.4%
Zimbabweans
97.4
/100
|
#107
Exceptional
10.4%
Ethiopians
97.4
/100
|
#108
Exceptional
10.5%
Immigrants | Ethiopia
97.2
/100
|
#109
Exceptional
10.5%
Koreans
97.1
/100
|
#110
Exceptional
10.5%
Brazilians
96.9
/100
|
#111
Exceptional
10.5%