Bahamian vs Cherokee Disability Age 65 to 74
COMPARE
Bahamian
Cherokee
Disability Age 65 to 74
Disability Age 65 to 74 Comparison
Bahamians
Cherokee
24.4%
DISABILITY AGE 65 TO 74
4.5/ 100
METRIC RATING
233rd/ 347
METRIC RANK
28.2%
DISABILITY AGE 65 TO 74
0.0/ 100
METRIC RATING
320th/ 347
METRIC RANK
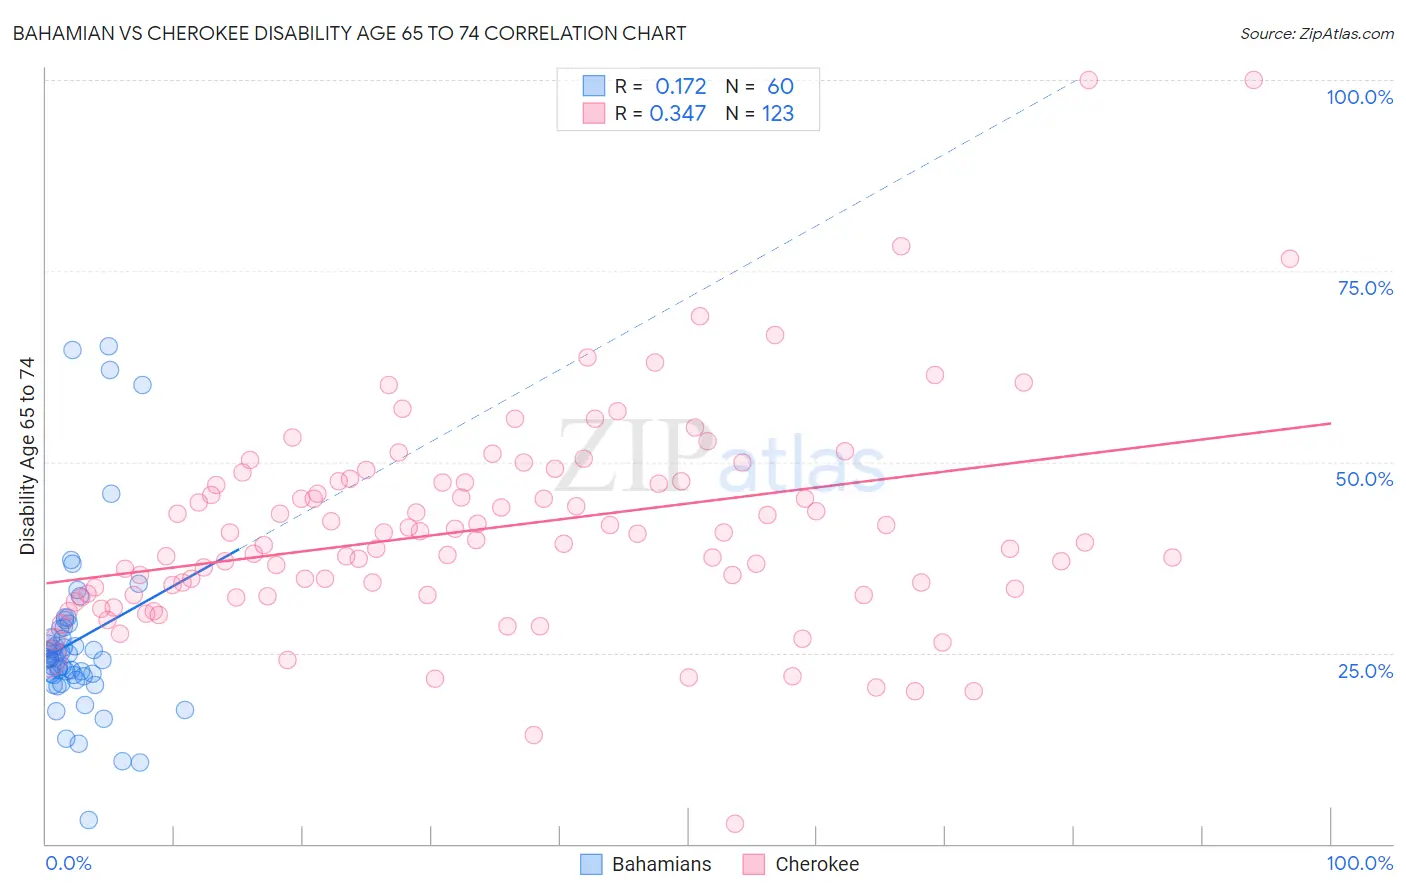
Bahamian vs Cherokee Disability Age 65 to 74 Correlation Chart
The statistical analysis conducted on geographies consisting of 112,540,799 people shows a poor positive correlation between the proportion of Bahamians and percentage of population with a disability between the ages 65 and 75 in the United States with a correlation coefficient (R) of 0.172 and weighted average of 24.4%. Similarly, the statistical analysis conducted on geographies consisting of 492,470,212 people shows a mild positive correlation between the proportion of Cherokee and percentage of population with a disability between the ages 65 and 75 in the United States with a correlation coefficient (R) of 0.347 and weighted average of 28.2%, a difference of 15.7%.
Disability Age 65 to 74 Correlation Summary
| Measurement | Bahamian | Cherokee |
| Minimum | 3.1% | 2.6% |
| Maximum | 65.1% | 100.0% |
| Range | 61.9% | 97.4% |
| Mean | 26.6% | 41.4% |
| Median | 24.3% | 39.7% |
| Interquartile 25% (IQ1) | 22.0% | 32.6% |
| Interquartile 75% (IQ3) | 28.2% | 47.4% |
| Interquartile Range (IQR) | 6.2% | 14.8% |
| Standard Deviation (Sample) | 11.8% | 14.2% |
| Standard Deviation (Population) | 11.7% | 14.1% |
Similar Demographics by Disability Age 65 to 74
Demographics Similar to Bahamians by Disability Age 65 to 74
In terms of disability age 65 to 74, the demographic groups most similar to Bahamians are Panamanian (24.4%, a difference of 0.11%), Immigrants from Zaire (24.3%, a difference of 0.16%), Immigrants from Thailand (24.3%, a difference of 0.21%), Scotch-Irish (24.4%, a difference of 0.26%), and German Russian (24.4%, a difference of 0.30%).
| Demographics | Rating | Rank | Disability Age 65 to 74 |
| Iraqis | 8.1 /100 | #226 | Tragic 24.2% |
| Nigerians | 7.8 /100 | #227 | Tragic 24.2% |
| Whites/Caucasians | 6.6 /100 | #228 | Tragic 24.2% |
| Celtics | 6.4 /100 | #229 | Tragic 24.2% |
| Barbadians | 6.0 /100 | #230 | Tragic 24.3% |
| Immigrants | Thailand | 5.2 /100 | #231 | Tragic 24.3% |
| Immigrants | Zaire | 5.0 /100 | #232 | Tragic 24.3% |
| Bahamians | 4.5 /100 | #233 | Tragic 24.4% |
| Panamanians | 4.2 /100 | #234 | Tragic 24.4% |
| Scotch-Irish | 3.8 /100 | #235 | Tragic 24.4% |
| German Russians | 3.7 /100 | #236 | Tragic 24.4% |
| West Indians | 3.4 /100 | #237 | Tragic 24.5% |
| Immigrants | Ghana | 3.0 /100 | #238 | Tragic 24.5% |
| Immigrants | Caribbean | 2.6 /100 | #239 | Tragic 24.6% |
| Spaniards | 2.4 /100 | #240 | Tragic 24.6% |
Demographics Similar to Cherokee by Disability Age 65 to 74
In terms of disability age 65 to 74, the demographic groups most similar to Cherokee are Arapaho (28.1%, a difference of 0.39%), Comanche (28.3%, a difference of 0.51%), Nepalese (28.0%, a difference of 0.62%), Immigrants from Armenia (28.0%, a difference of 0.84%), and Aleut (28.4%, a difference of 0.84%).
| Demographics | Rating | Rank | Disability Age 65 to 74 |
| Paiute | 0.0 /100 | #313 | Tragic 27.8% |
| Chippewa | 0.0 /100 | #314 | Tragic 27.8% |
| Cajuns | 0.0 /100 | #315 | Tragic 27.9% |
| Crow | 0.0 /100 | #316 | Tragic 27.9% |
| Immigrants | Armenia | 0.0 /100 | #317 | Tragic 28.0% |
| Nepalese | 0.0 /100 | #318 | Tragic 28.0% |
| Arapaho | 0.0 /100 | #319 | Tragic 28.1% |
| Cherokee | 0.0 /100 | #320 | Tragic 28.2% |
| Comanche | 0.0 /100 | #321 | Tragic 28.3% |
| Aleuts | 0.0 /100 | #322 | Tragic 28.4% |
| Puerto Ricans | 0.0 /100 | #323 | Tragic 29.1% |
| Seminole | 0.0 /100 | #324 | Tragic 29.4% |
| Dutch West Indians | 0.0 /100 | #325 | Tragic 29.6% |
| Yakama | 0.0 /100 | #326 | Tragic 29.6% |
| Apache | 0.0 /100 | #327 | Tragic 29.7% |