Assyrian/Chaldean/Syriac vs Palestinian Disability Age 35 to 64
COMPARE
Assyrian/Chaldean/Syriac
Palestinian
Disability Age 35 to 64
Disability Age 35 to 64 Comparison
Assyrians/Chaldeans/Syriacs
Palestinians
10.5%
DISABILITY AGE 35 TO 64
96.8/ 100
METRIC RATING
112th/ 347
METRIC RANK
10.4%
DISABILITY AGE 35 TO 64
98.2/ 100
METRIC RATING
99th/ 347
METRIC RANK
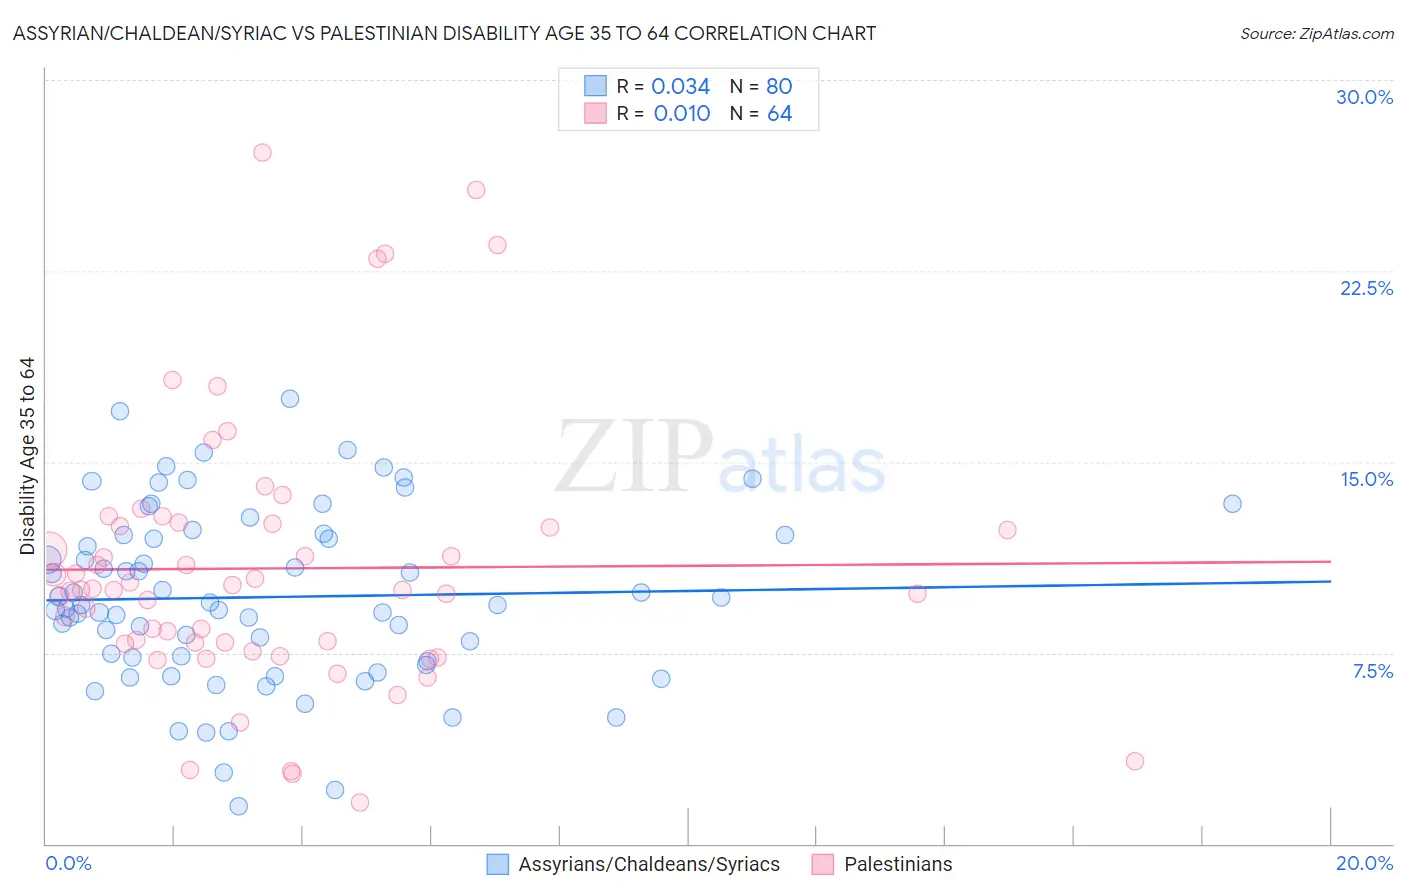
Assyrian/Chaldean/Syriac vs Palestinian Disability Age 35 to 64 Correlation Chart
The statistical analysis conducted on geographies consisting of 110,296,626 people shows no correlation between the proportion of Assyrians/Chaldeans/Syriacs and percentage of population with a disability between the ages 34 and 64 in the United States with a correlation coefficient (R) of 0.034 and weighted average of 10.5%. Similarly, the statistical analysis conducted on geographies consisting of 216,388,113 people shows no correlation between the proportion of Palestinians and percentage of population with a disability between the ages 34 and 64 in the United States with a correlation coefficient (R) of 0.010 and weighted average of 10.4%, a difference of 1.3%.
Disability Age 35 to 64 Correlation Summary
| Measurement | Assyrian/Chaldean/Syriac | Palestinian |
| Minimum | 1.5% | 1.6% |
| Maximum | 17.5% | 27.2% |
| Range | 16.0% | 25.5% |
| Mean | 9.7% | 10.8% |
| Median | 9.4% | 10.0% |
| Interquartile 25% (IQ1) | 7.2% | 7.9% |
| Interquartile 75% (IQ3) | 12.1% | 12.5% |
| Interquartile Range (IQR) | 4.9% | 4.6% |
| Standard Deviation (Sample) | 3.4% | 5.3% |
| Standard Deviation (Population) | 3.4% | 5.2% |
Demographics Similar to Assyrians/Chaldeans/Syriacs and Palestinians by Disability Age 35 to 64
In terms of disability age 35 to 64, the demographic groups most similar to Assyrians/Chaldeans/Syriacs are Brazilian (10.5%, a difference of 0.030%), Tongan (10.5%, a difference of 0.12%), Immigrants from Morocco (10.5%, a difference of 0.17%), Korean (10.5%, a difference of 0.24%), and Immigrants from Ethiopia (10.5%, a difference of 0.30%). Similarly, the demographic groups most similar to Palestinians are Immigrants from Uruguay (10.3%, a difference of 0.13%), Immigrants from Denmark (10.3%, a difference of 0.20%), Immigrants from Jordan (10.4%, a difference of 0.22%), Immigrants from Philippines (10.4%, a difference of 0.27%), and Immigrants from Western Asia (10.4%, a difference of 0.33%).
| Demographics | Rating | Rank | Disability Age 35 to 64 |
| Chinese | 98.7 /100 | #95 | Exceptional 10.3% |
| Immigrants | South Africa | 98.5 /100 | #96 | Exceptional 10.3% |
| Immigrants | Denmark | 98.4 /100 | #97 | Exceptional 10.3% |
| Immigrants | Uruguay | 98.3 /100 | #98 | Exceptional 10.3% |
| Palestinians | 98.2 /100 | #99 | Exceptional 10.4% |
| Immigrants | Jordan | 98.1 /100 | #100 | Exceptional 10.4% |
| Immigrants | Philippines | 98.0 /100 | #101 | Exceptional 10.4% |
| Immigrants | Western Asia | 98.0 /100 | #102 | Exceptional 10.4% |
| Immigrants | Ukraine | 97.9 /100 | #103 | Exceptional 10.4% |
| Immigrants | Austria | 97.8 /100 | #104 | Exceptional 10.4% |
| Macedonians | 97.8 /100 | #105 | Exceptional 10.4% |
| Immigrants | Hungary | 97.6 /100 | #106 | Exceptional 10.4% |
| Zimbabweans | 97.4 /100 | #107 | Exceptional 10.4% |
| Ethiopians | 97.4 /100 | #108 | Exceptional 10.5% |
| Immigrants | Ethiopia | 97.2 /100 | #109 | Exceptional 10.5% |
| Koreans | 97.1 /100 | #110 | Exceptional 10.5% |
| Brazilians | 96.9 /100 | #111 | Exceptional 10.5% |
| Assyrians/Chaldeans/Syriacs | 96.8 /100 | #112 | Exceptional 10.5% |
| Tongans | 96.6 /100 | #113 | Exceptional 10.5% |
| Immigrants | Morocco | 96.6 /100 | #114 | Exceptional 10.5% |
| Immigrants | Netherlands | 96.3 /100 | #115 | Exceptional 10.5% |