Assyrian/Chaldean/Syriac vs Eastern European Hearing Disability
COMPARE
Assyrian/Chaldean/Syriac
Eastern European
Hearing Disability
Hearing Disability Comparison
Assyrians/Chaldeans/Syriacs
Eastern Europeans
3.3%
HEARING DISABILITY
0.9/ 100
METRIC RATING
244th/ 347
METRIC RANK
3.1%
HEARING DISABILITY
15.5/ 100
METRIC RATING
206th/ 347
METRIC RANK
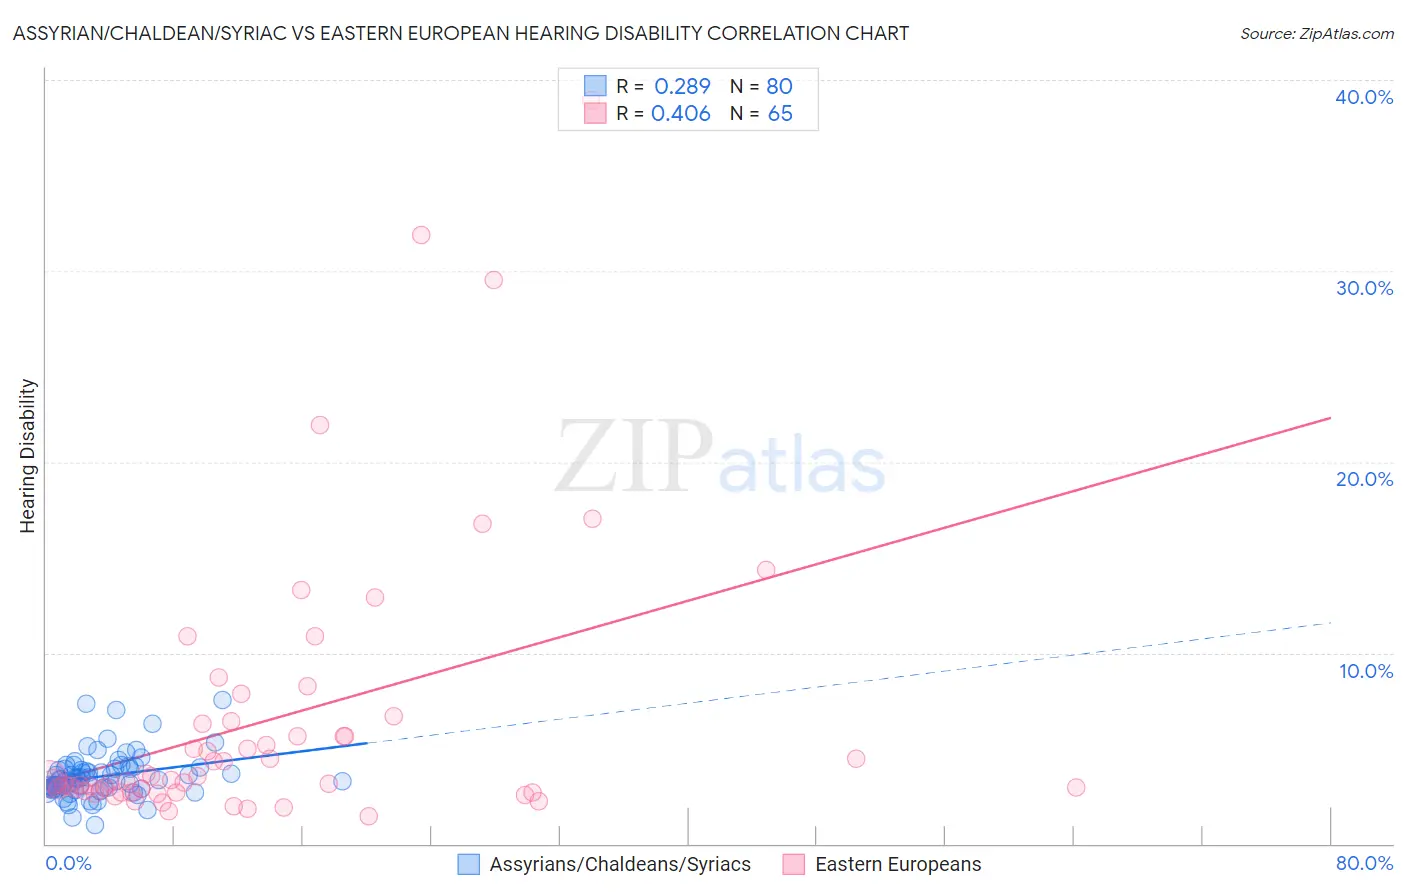
Assyrian/Chaldean/Syriac vs Eastern European Hearing Disability Correlation Chart
The statistical analysis conducted on geographies consisting of 110,312,508 people shows a weak positive correlation between the proportion of Assyrians/Chaldeans/Syriacs and percentage of population with hearing disability in the United States with a correlation coefficient (R) of 0.289 and weighted average of 3.3%. Similarly, the statistical analysis conducted on geographies consisting of 461,059,172 people shows a moderate positive correlation between the proportion of Eastern Europeans and percentage of population with hearing disability in the United States with a correlation coefficient (R) of 0.406 and weighted average of 3.1%, a difference of 6.7%.
Hearing Disability Correlation Summary
| Measurement | Assyrian/Chaldean/Syriac | Eastern European |
| Minimum | 0.96% | 1.4% |
| Maximum | 7.5% | 39.0% |
| Range | 6.6% | 37.5% |
| Mean | 3.5% | 6.5% |
| Median | 3.3% | 3.4% |
| Interquartile 25% (IQ1) | 2.9% | 2.7% |
| Interquartile 75% (IQ3) | 3.9% | 6.4% |
| Interquartile Range (IQR) | 1.0% | 3.6% |
| Standard Deviation (Sample) | 1.2% | 7.3% |
| Standard Deviation (Population) | 1.2% | 7.3% |
Similar Demographics by Hearing Disability
Demographics Similar to Assyrians/Chaldeans/Syriacs by Hearing Disability
In terms of hearing disability, the demographic groups most similar to Assyrians/Chaldeans/Syriacs are Immigrants from Western Europe (3.3%, a difference of 0.070%), Yugoslavian (3.3%, a difference of 0.24%), Immigrants from Scotland (3.3%, a difference of 0.34%), Samoan (3.3%, a difference of 0.35%), and Immigrants from Netherlands (3.3%, a difference of 0.43%).
| Demographics | Rating | Rank | Hearing Disability |
| Immigrants | Austria | 1.8 /100 | #237 | Tragic 3.3% |
| German Russians | 1.8 /100 | #238 | Tragic 3.3% |
| Nepalese | 1.2 /100 | #239 | Tragic 3.3% |
| Immigrants | Netherlands | 1.1 /100 | #240 | Tragic 3.3% |
| Samoans | 1.1 /100 | #241 | Tragic 3.3% |
| Yugoslavians | 1.0 /100 | #242 | Tragic 3.3% |
| Immigrants | Western Europe | 1.0 /100 | #243 | Tragic 3.3% |
| Assyrians/Chaldeans/Syriacs | 0.9 /100 | #244 | Tragic 3.3% |
| Immigrants | Scotland | 0.8 /100 | #245 | Tragic 3.3% |
| Immigrants | England | 0.7 /100 | #246 | Tragic 3.3% |
| Lithuanians | 0.6 /100 | #247 | Tragic 3.4% |
| Austrians | 0.6 /100 | #248 | Tragic 3.4% |
| Italians | 0.4 /100 | #249 | Tragic 3.4% |
| Yuman | 0.4 /100 | #250 | Tragic 3.4% |
| Hungarians | 0.4 /100 | #251 | Tragic 3.4% |
Demographics Similar to Eastern Europeans by Hearing Disability
In terms of hearing disability, the demographic groups most similar to Eastern Europeans are Immigrants from Czechoslovakia (3.1%, a difference of 0.070%), Alsatian (3.1%, a difference of 0.070%), Hispanic or Latino (3.1%, a difference of 0.070%), Immigrants from Denmark (3.1%, a difference of 0.12%), and Immigrants from Thailand (3.1%, a difference of 0.16%).
| Demographics | Rating | Rank | Hearing Disability |
| Syrians | 19.2 /100 | #199 | Poor 3.1% |
| Immigrants | North Macedonia | 19.1 /100 | #200 | Poor 3.1% |
| Iraqis | 19.0 /100 | #201 | Poor 3.1% |
| Immigrants | Thailand | 16.4 /100 | #202 | Poor 3.1% |
| Immigrants | Denmark | 16.2 /100 | #203 | Poor 3.1% |
| Immigrants | Czechoslovakia | 15.9 /100 | #204 | Poor 3.1% |
| Alsatians | 15.9 /100 | #205 | Poor 3.1% |
| Eastern Europeans | 15.5 /100 | #206 | Poor 3.1% |
| Hispanics or Latinos | 15.1 /100 | #207 | Poor 3.1% |
| Immigrants | Latvia | 12.7 /100 | #208 | Poor 3.1% |
| Immigrants | Hungary | 12.5 /100 | #209 | Poor 3.1% |
| Cape Verdeans | 12.2 /100 | #210 | Poor 3.1% |
| Romanians | 12.1 /100 | #211 | Poor 3.1% |
| Pakistanis | 11.1 /100 | #212 | Poor 3.1% |
| Immigrants | Iraq | 10.5 /100 | #213 | Poor 3.1% |