Arab vs Welsh Disability Age 35 to 64

COMPARE

Arab
Race
Ancestry
AfghanAfricanAlaska NativeAlaskan AthabascanAlbanianAleutAlsatianAmericanApacheArabArapahoArgentineanArmenianAssyrian/Chaldean/SyriacAustralianAustrianBahamianBangladeshiBarbadianBasqueBelgianBelizeanBermudanBhutaneseBlackfeetBolivianBrazilianBritishBritish West IndianBulgarianBurmeseCajunCambodianCanadianCape VerdeanCarpatho RusynCelticCentral AmericanCentral American IndianCherokeeCheyenneChickasawChileanChineseChippewaChoctawColombianColvilleComancheCosta RicanCreeCreekCroatianCrowCubanCypriotCzechCzechoslovakianDanishDelawareDominicanDutchDutch West IndianEastern EuropeanEcuadorianEgyptianEnglishEstonianEthiopianEuropeanFijianFilipinoFinnishFrenchFrench American IndianFrench CanadianGermanGerman RussianGhanaianGreekGuamanian/ChamorroGuatemalanGuyaneseHaitianHmongHonduranHopiHoumaHungarianIcelanderIndian (Asian)IndonesianInupiatIranianIraqiIrishIroquoisIsraeliItalianJamaicanJapaneseJordanianKenyanKiowaKoreanLaotianLatvianLebaneseLiberianLithuanianLumbeeLuxembourgerMacedonianMalaysianMalteseMarshalleseMenomineeMexicanMexican American IndianMongolianMoroccanNative HawaiianNavajoNepaleseNew ZealanderNicaraguanNigerianNorthern EuropeanNorwegianOkinawanOsageOttawaPaiutePakistaniPalestinianPanamanianParaguayanPennsylvania GermanPeruvianPimaPolishPortuguesePotawatomiPuebloPuerto RicanPuget Sound SalishRomanianRussianSalvadoranSamoanScandinavianScotch-IrishScottishSeminoleSenegaleseSerbianShoshoneSierra LeoneanSiouxSlavicSlovakSloveneSomaliSouth AfricanSouth AmericanSouth American IndianSoviet UnionSpaniardSpanishSpanish AmericanSpanish American IndianSri LankanSubsaharan AfricanSudaneseSwedishSwissSyrianTaiwaneseThaiTlingit-HaidaTohono O'OdhamTonganTrinidadian and TobagonianTsimshianTurkishU.S. Virgin IslanderUgandanUkrainianUruguayanUteVenezuelanVietnameseWest IndianYakamaYaquiYugoslavianYumanYup'ikZimbabwean
Immigration
NonimmigrantsImmigrantsAfghanistanAfricaAlbaniaArgentinaArmeniaAsiaAustraliaAustriaBahamasBangladeshBarbadosBelarusBelgiumBelizeBoliviaBosnia and HerzegovinaBrazilBulgariaBurma/MyanmarCabo VerdeCambodiaCameroonCanadaCaribbeanCentral AmericaChileChinaColombiaCongoCosta RicaCroatiaCubaCzechoslovakiaDenmarkDominicaDominican RepublicEastern AfricaEastern AsiaEastern EuropeEcuadorEgyptEl SalvadorEnglandEritreaEthiopiaEuropeFijiFranceGermanyGhanaGreeceGrenadaGuatemalaGuyanaHaitiHondurasHong KongHungaryIndiaIndonesiaIranIraqIrelandIsraelItalyJamaicaJapanJordanKazakhstanKenyaKoreaKuwaitLaosLatin AmericaLatviaLebanonLiberiaLithuaniaMalaysiaMexicoMicronesiaMiddle AfricaMoldovaMoroccoNepalNetherlandsNicaraguaNigeriaNorth AmericaNorth MacedoniaNorthern AfricaNorthern EuropeNorwayOceaniaPakistanPanamaPeruPhilippinesPolandPortugalRomaniaRussiaSaudi ArabiaScotlandSenegalSerbiaSierra LeoneSingaporeSomaliaSouth AfricaSouth AmericaSouth Central AsiaSouth Eastern AsiaSouthern EuropeSpainSri LankaSt. Vincent and the GrenadinesSudanSwedenSwitzerlandSyriaTaiwanThailandTrinidad and TobagoTurkeyUgandaUkraineUruguayUzbekistanVenezuelaVietnamWest IndiesWestern AfricaWestern AsiaWestern EuropeYemenZaireZimbabweAzores
Welsh
Race
Ancestry
AfghanAfricanAlaska NativeAlaskan AthabascanAlbanianAleutAlsatianAmericanApacheArapahoArgentineanArmenianAssyrian/Chaldean/SyriacAustralianAustrianBahamianBangladeshiBarbadianBasqueBelgianBelizeanBermudanBhutaneseBlackfeetBolivianBrazilianBritishBritish West IndianBulgarianBurmeseCajunCambodianCanadianCape VerdeanCarpatho RusynCelticCentral AmericanCentral American IndianCherokeeCheyenneChickasawChileanChineseChippewaChoctawColombianColvilleComancheCosta RicanCreeCreekCroatianCrowCubanCypriotCzechCzechoslovakianDanishDelawareDominicanDutchDutch West IndianEastern EuropeanEcuadorianEgyptianEnglishEstonianEthiopianEuropeanFijianFilipinoFinnishFrenchFrench American IndianFrench CanadianGermanGerman RussianGhanaianGreekGuamanian/ChamorroGuatemalanGuyaneseHaitianHmongHonduranHopiHoumaHungarianIcelanderIndian (Asian)IndonesianInupiatIranianIraqiIrishIroquoisIsraeliItalianJamaicanJapaneseJordanianKenyanKiowaKoreanLaotianLatvianLebaneseLiberianLithuanianLumbeeLuxembourgerMacedonianMalaysianMalteseMarshalleseMenomineeMexicanMexican American IndianMongolianMoroccanNative HawaiianNavajoNepaleseNew ZealanderNicaraguanNigerianNorthern EuropeanNorwegianOkinawanOsageOttawaPaiutePakistaniPalestinianPanamanianParaguayanPennsylvania GermanPeruvianPimaPolishPortuguesePotawatomiPuebloPuerto RicanPuget Sound SalishRomanianRussianSalvadoranSamoanScandinavianScotch-IrishScottishSeminoleSenegaleseSerbianShoshoneSierra LeoneanSiouxSlavicSlovakSloveneSomaliSouth AfricanSouth AmericanSouth American IndianSoviet UnionSpaniardSpanishSpanish AmericanSpanish American IndianSri LankanSubsaharan AfricanSudaneseSwedishSwissSyrianTaiwaneseThaiTlingit-HaidaTohono O'OdhamTonganTrinidadian and TobagonianTsimshianTurkishU.S. Virgin IslanderUgandanUkrainianUruguayanUteVenezuelanVietnameseWelshWest IndianYakamaYaquiYugoslavianYumanYup'ikZimbabwean
Immigration
NonimmigrantsImmigrantsAfghanistanAfricaAlbaniaArgentinaArmeniaAsiaAustraliaAustriaBahamasBangladeshBarbadosBelarusBelgiumBelizeBoliviaBosnia and HerzegovinaBrazilBulgariaBurma/MyanmarCabo VerdeCambodiaCameroonCanadaCaribbeanCentral AmericaChileChinaColombiaCongoCosta RicaCroatiaCubaCzechoslovakiaDenmarkDominicaDominican RepublicEastern AfricaEastern AsiaEastern EuropeEcuadorEgyptEl SalvadorEnglandEritreaEthiopiaEuropeFijiFranceGermanyGhanaGreeceGrenadaGuatemalaGuyanaHaitiHondurasHong KongHungaryIndiaIndonesiaIranIraqIrelandIsraelItalyJamaicaJapanJordanKazakhstanKenyaKoreaKuwaitLaosLatin AmericaLatviaLebanonLiberiaLithuaniaMalaysiaMexicoMicronesiaMiddle AfricaMoldovaMoroccoNepalNetherlandsNicaraguaNigeriaNorth AmericaNorth MacedoniaNorthern AfricaNorthern EuropeNorwayOceaniaPakistanPanamaPeruPhilippinesPolandPortugalRomaniaRussiaSaudi ArabiaScotlandSenegalSerbiaSierra LeoneSingaporeSomaliaSouth AfricaSouth AmericaSouth Central AsiaSouth Eastern AsiaSouthern EuropeSpainSri LankaSt. Vincent and the GrenadinesSudanSwedenSwitzerlandSyriaTaiwanThailandTrinidad and TobagoTurkeyUgandaUkraineUruguayUzbekistanVenezuelaVietnamWest IndiesWestern AfricaWestern AsiaWestern EuropeYemenZaireZimbabweAzores
Disability Age 35 to 64
Income
Poverty
Unemployment
Labor Participation
Family Structure
Vehicle Availability
Education Level
Disability

Disability Age 35 to 64 Comparison

Arabs

Welsh

Excellent
Tragic
10.9%
DISABILITY AGE 35 TO 64
82.7/ 100
METRIC RATING
148th/ 347
METRIC RANK
12.4%
DISABILITY AGE 35 TO 64
0.6/ 100
METRIC RATING
258th/ 347
METRIC RANK

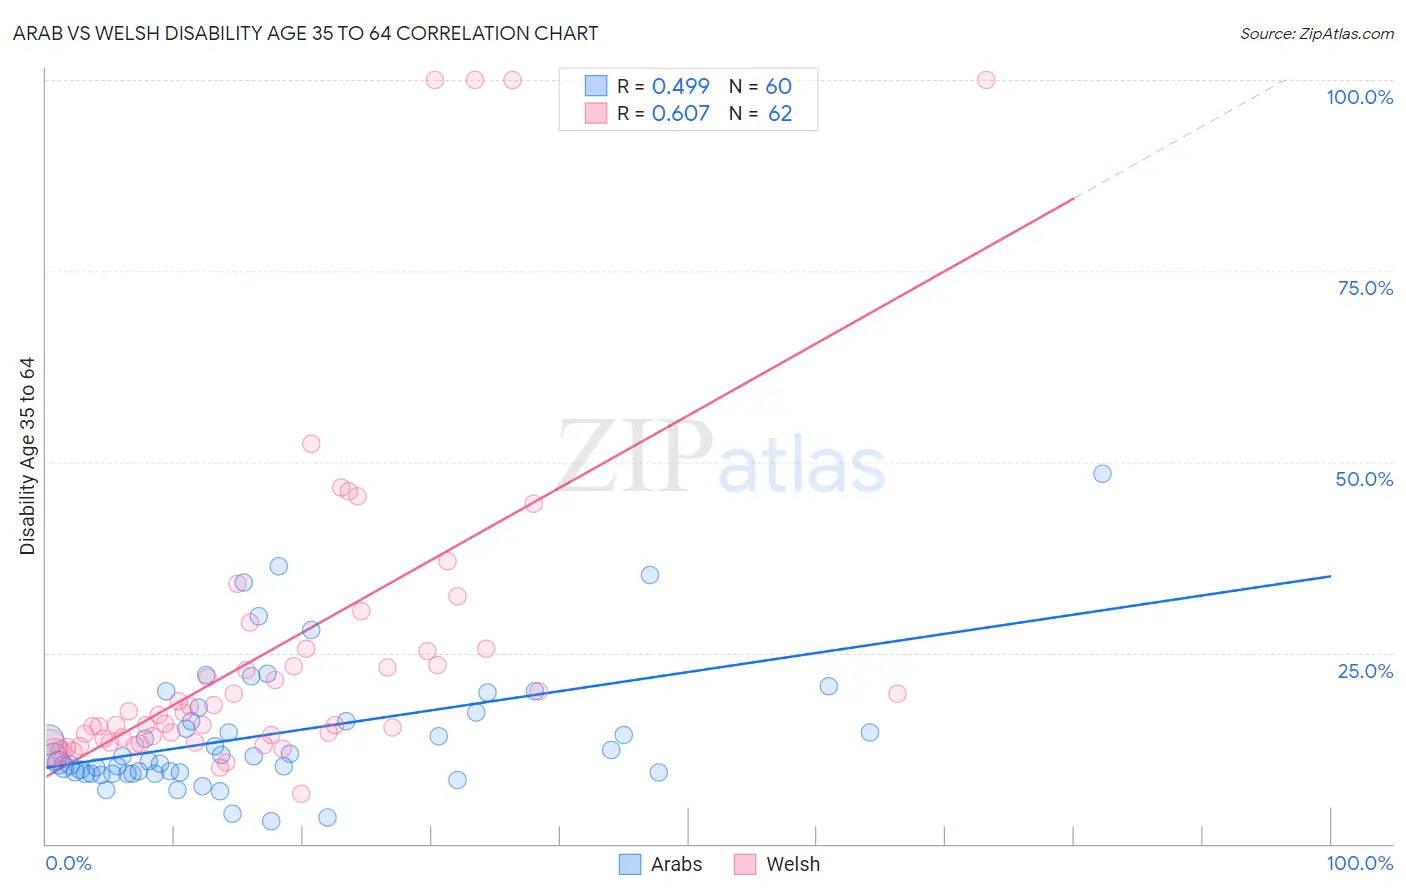
Arab vs Welsh Disability Age 35 to 64 Correlation Chart

The statistical analysis conducted on geographies consisting of 486,294,602 people shows a moderate positive correlation between the proportion of Arabs and percentage of population with a disability between the ages 34 and 64 in the United States with a correlation coefficient (R) of 0.499 and weighted average of 10.9%. Similarly, the statistical analysis conducted on geographies consisting of 527,956,367 people shows a significant positive correlation between the proportion of Welsh and percentage of population with a disability between the ages 34 and 64 in the United States with a correlation coefficient (R) of 0.607 and weighted average of 12.4%, a difference of 13.7%.
Arab vs Welsh Disability Age 35 to 64

Disability Age 35 to 64 Correlation Summary

MeasurementArabWelsh
Minimum2.9%6.5%
Maximum48.5%100.0%
Range45.5%93.5%
Mean14.3%25.5%
Median11.4%17.0%
Interquartile 25% (IQ1)9.3%13.8%
Interquartile 75% (IQ3)16.6%25.5%
Interquartile Range (IQR)7.4%11.7%
Standard Deviation (Sample)8.6%22.1%
Standard Deviation (Population)8.5%21.9%

Similar Demographics by Disability Age 35 to 64

Demographics Similar to Arabs by Disability Age 35 to 64

In terms of disability age 35 to 64, the demographic groups most similar to Arabs are Immigrants from Eritrea (10.9%, a difference of 0.10%), South American Indian (10.9%, a difference of 0.12%), Immigrants from Cameroon (10.9%, a difference of 0.22%), Syrian (11.0%, a difference of 0.40%), and Immigrants from Bangladesh (10.9%, a difference of 0.45%).
DemographicsRating | RankDisability Age 35 to 64
Australians
90.7
/100
|
#141
Exceptional
10.8%
Immigrants | Saudi Arabia
90.6
/100
|
#142
Exceptional
10.8%
Sierra Leoneans
89.7
/100
|
#143
Excellent
10.8%
Lithuanians
88.7
/100
|
#144
Excellent
10.8%
Immigrants | Bangladesh
85.6
/100
|
#145
Excellent
10.9%
South American Indians
83.5
/100
|
#146
Excellent
10.9%
Immigrants | Eritrea
83.4
/100
|
#147
Excellent
10.9%
Arabs
82.7
/100
|
#148
Excellent
10.9%
Immigrants | Cameroon
81.1
/100
|
#149
Excellent
10.9%
Syrians
79.8
/100
|
#150
Good
11.0%
New Zealanders
79.3
/100
|
#151
Good
11.0%
Ukrainians
78.0
/100
|
#152
Good
11.0%
Immigrants | England
77.4
/100
|
#153
Good
11.0%
Immigrants | Canada
76.7
/100
|
#154
Good
11.0%
Moroccans
76.4
/100
|
#155
Good
11.0%

Demographics Similar to Welsh by Disability Age 35 to 64

In terms of disability age 35 to 64, the demographic groups most similar to Welsh are Mexican (12.4%, a difference of 0.080%), English (12.4%, a difference of 0.12%), Scottish (12.4%, a difference of 0.34%), German Russian (12.5%, a difference of 0.37%), and Japanese (12.3%, a difference of 0.51%).
DemographicsRating | RankDisability Age 35 to 64
Germans
1.1
/100
|
#251
Tragic
12.3%
Irish
1.0
/100
|
#252
Tragic
12.3%
Dutch
1.0
/100
|
#253
Tragic
12.3%
Hawaiians
0.9
/100
|
#254
Tragic
12.3%
Japanese
0.8
/100
|
#255
Tragic
12.3%
Scottish
0.8
/100
|
#256
Tragic
12.4%
Mexicans
0.7
/100
|
#257
Tragic
12.4%
Welsh
0.6
/100
|
#258
Tragic
12.4%
English
0.6
/100
|
#259
Tragic
12.4%
German Russians
0.5
/100
|
#260
Tragic
12.5%
Malaysians
0.5
/100
|
#261
Tragic
12.5%
Senegalese
0.5
/100
|
#262
Tragic
12.5%
Immigrants | Zaire
0.4
/100
|
#263
Tragic
12.5%
Immigrants | Portugal
0.4
/100
|
#264
Tragic
12.5%
Marshallese
0.4
/100
|
#265
Tragic
12.5%