Afghan vs Immigrants from South America Hearing Disability
COMPARE
Afghan
Immigrants from South America
Hearing Disability
Hearing Disability Comparison
Afghans
Immigrants from South America
2.7%
HEARING DISABILITY
97.6/ 100
METRIC RATING
72nd/ 347
METRIC RANK
2.7%
HEARING DISABILITY
99.2/ 100
METRIC RATING
49th/ 347
METRIC RANK
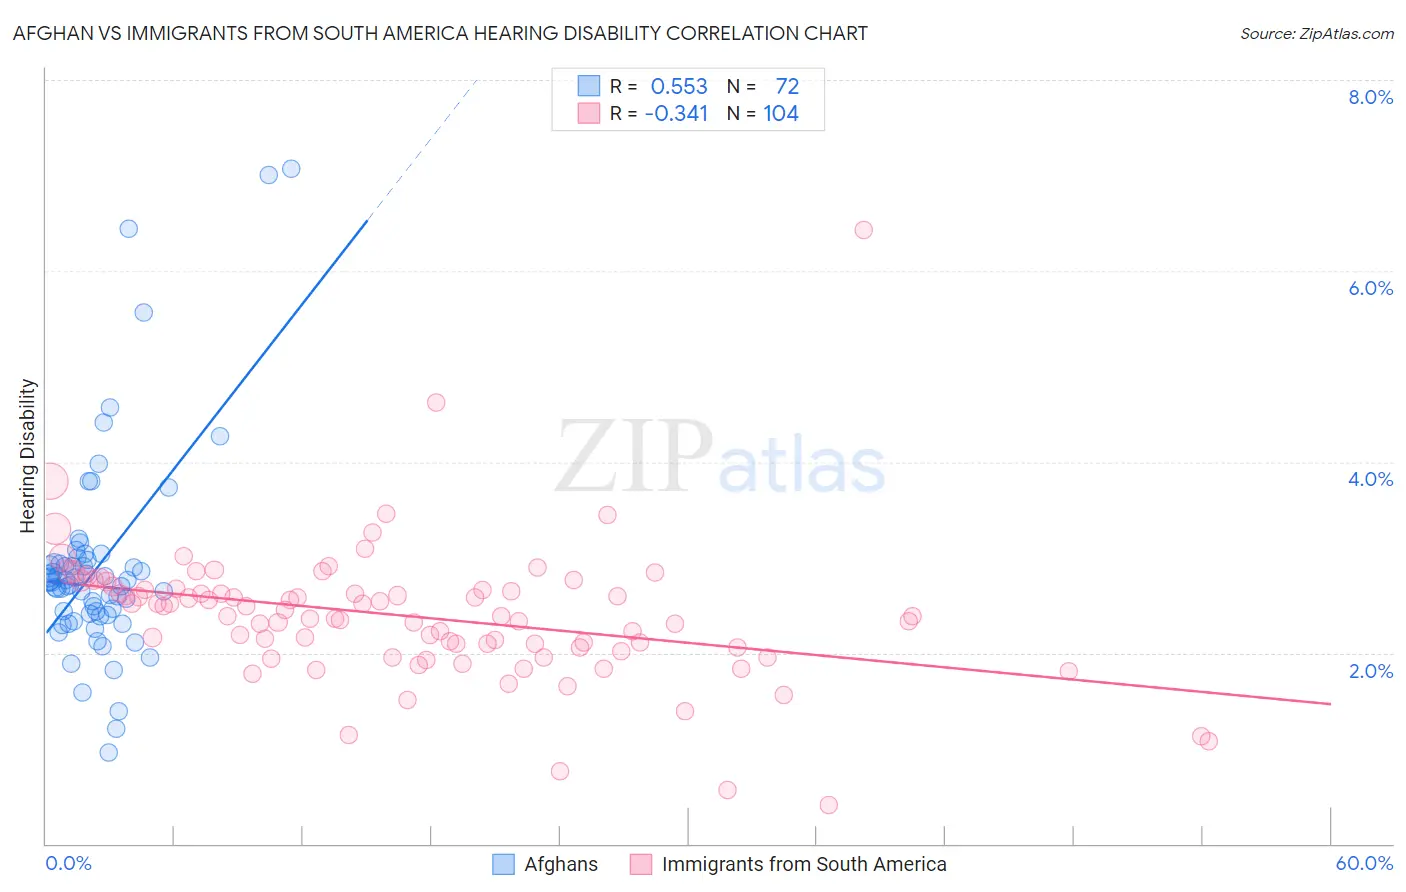
Afghan vs Immigrants from South America Hearing Disability Correlation Chart
The statistical analysis conducted on geographies consisting of 148,839,750 people shows a substantial positive correlation between the proportion of Afghans and percentage of population with hearing disability in the United States with a correlation coefficient (R) of 0.553 and weighted average of 2.7%. Similarly, the statistical analysis conducted on geographies consisting of 486,101,818 people shows a mild negative correlation between the proportion of Immigrants from South America and percentage of population with hearing disability in the United States with a correlation coefficient (R) of -0.341 and weighted average of 2.7%, a difference of 3.1%.
Hearing Disability Correlation Summary
| Measurement | Afghan | Immigrants from South America |
| Minimum | 0.95% | 0.40% |
| Maximum | 7.1% | 6.4% |
| Range | 6.1% | 6.0% |
| Mean | 2.9% | 2.4% |
| Median | 2.7% | 2.4% |
| Interquartile 25% (IQ1) | 2.4% | 2.1% |
| Interquartile 75% (IQ3) | 3.0% | 2.7% |
| Interquartile Range (IQR) | 0.55% | 0.61% |
| Standard Deviation (Sample) | 1.1% | 0.73% |
| Standard Deviation (Population) | 1.1% | 0.73% |
Similar Demographics by Hearing Disability
Demographics Similar to Afghans by Hearing Disability
In terms of hearing disability, the demographic groups most similar to Afghans are Argentinean (2.7%, a difference of 0.080%), Immigrants from Korea (2.7%, a difference of 0.080%), Central American (2.7%, a difference of 0.10%), Immigrants from Saudi Arabia (2.7%, a difference of 0.11%), and Asian (2.7%, a difference of 0.11%).
| Demographics | Rating | Rank | Hearing Disability |
| Immigrants | Nepal | 98.3 /100 | #65 | Exceptional 2.7% |
| Immigrants | Belize | 98.2 /100 | #66 | Exceptional 2.7% |
| Egyptians | 98.1 /100 | #67 | Exceptional 2.7% |
| Immigrants | Africa | 98.0 /100 | #68 | Exceptional 2.7% |
| Nicaraguans | 97.9 /100 | #69 | Exceptional 2.7% |
| Peruvians | 97.7 /100 | #70 | Exceptional 2.7% |
| Central Americans | 97.7 /100 | #71 | Exceptional 2.7% |
| Afghans | 97.6 /100 | #72 | Exceptional 2.7% |
| Argentineans | 97.5 /100 | #73 | Exceptional 2.7% |
| Immigrants | Korea | 97.5 /100 | #74 | Exceptional 2.7% |
| Immigrants | Saudi Arabia | 97.5 /100 | #75 | Exceptional 2.7% |
| Asians | 97.5 /100 | #76 | Exceptional 2.7% |
| Immigrants | Malaysia | 97.5 /100 | #77 | Exceptional 2.7% |
| Mongolians | 97.4 /100 | #78 | Exceptional 2.7% |
| Colombians | 97.4 /100 | #79 | Exceptional 2.7% |
Demographics Similar to Immigrants from South America by Hearing Disability
In terms of hearing disability, the demographic groups most similar to Immigrants from South America are Immigrants from Singapore (2.6%, a difference of 0.12%), Immigrants from Israel (2.6%, a difference of 0.19%), Paraguayan (2.7%, a difference of 0.19%), Immigrants from Hong Kong (2.7%, a difference of 0.26%), and Immigrants from Dominica (2.6%, a difference of 0.34%).
| Demographics | Rating | Rank | Hearing Disability |
| West Indians | 99.4 /100 | #42 | Exceptional 2.6% |
| Senegalese | 99.4 /100 | #43 | Exceptional 2.6% |
| Nigerians | 99.4 /100 | #44 | Exceptional 2.6% |
| Venezuelans | 99.4 /100 | #45 | Exceptional 2.6% |
| Immigrants | Dominica | 99.3 /100 | #46 | Exceptional 2.6% |
| Immigrants | Israel | 99.3 /100 | #47 | Exceptional 2.6% |
| Immigrants | Singapore | 99.3 /100 | #48 | Exceptional 2.6% |
| Immigrants | South America | 99.2 /100 | #49 | Exceptional 2.7% |
| Paraguayans | 99.2 /100 | #50 | Exceptional 2.7% |
| Immigrants | Hong Kong | 99.2 /100 | #51 | Exceptional 2.7% |
| Jamaicans | 99.0 /100 | #52 | Exceptional 2.7% |
| Immigrants | Eastern Asia | 99.0 /100 | #53 | Exceptional 2.7% |
| Ethiopians | 99.0 /100 | #54 | Exceptional 2.7% |
| Immigrants | Ethiopia | 99.0 /100 | #55 | Exceptional 2.7% |
| Immigrants | Nicaragua | 99.0 /100 | #56 | Exceptional 2.7% |