Zip Codes with the Highest Percentage of Population Employed in Office & Administration in Casa Grande, AZ
RELATED REPORTS & OPTIONS
Office & Administration
Casa Grande
Compare Zip Codes
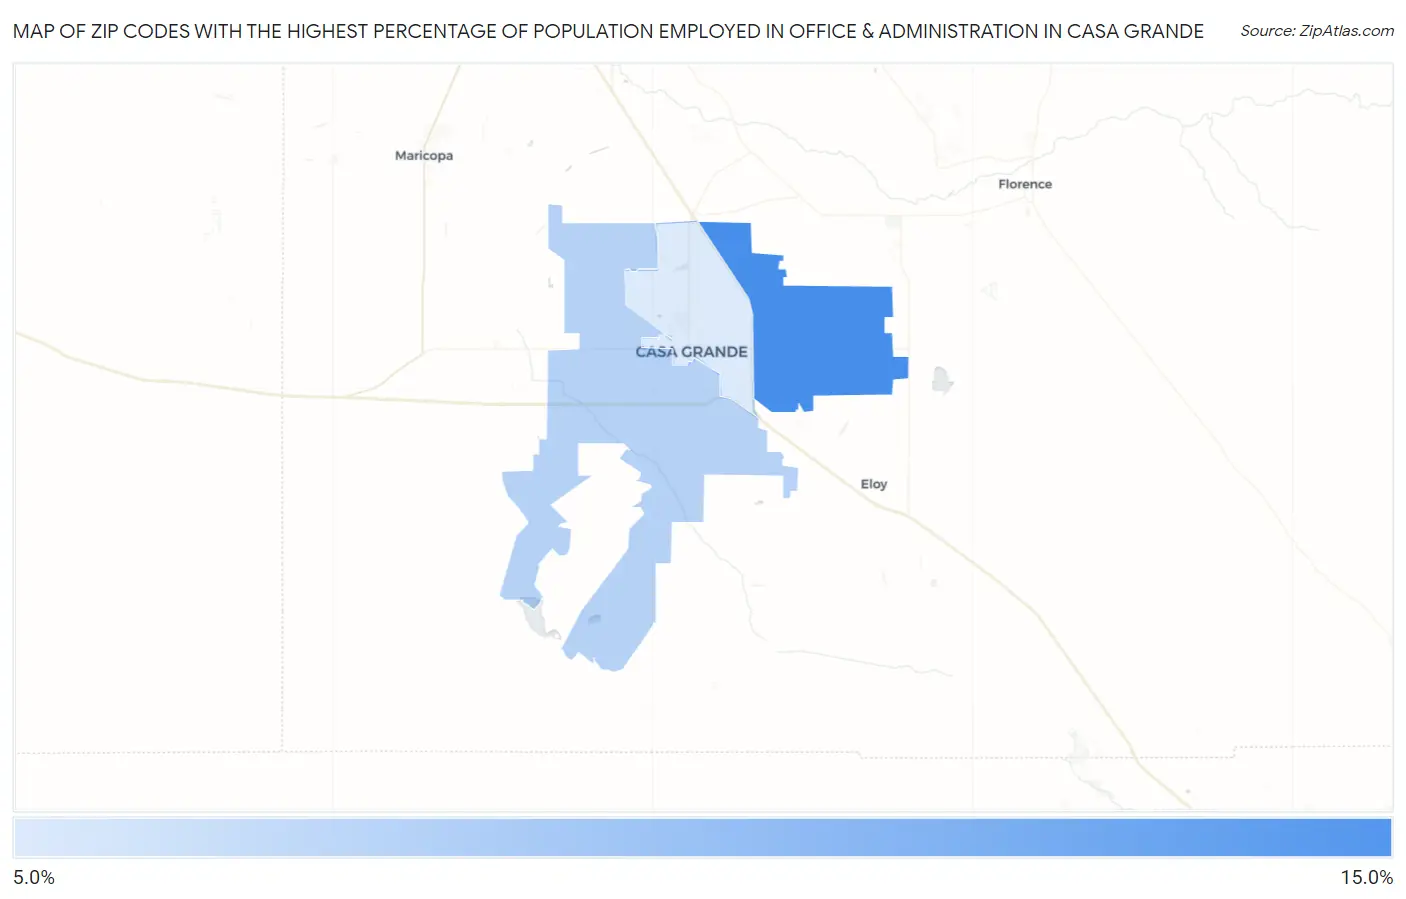
Map of Zip Codes with the Highest Percentage of Population Employed in Office & Administration in Casa Grande
0.0%
15.0%
Zip Codes with the Highest Percentage of Population Employed in Office & Administration in Casa Grande, AZ
| Zip Code | % Employed | vs State | vs National | |
| 1. | 85194 | 13.7% | 12.6%(+1.12)#130 | 10.9%(+2.85)#6,520 |
| 2. | 85193 | 11.5% | 12.6%(-1.08)#216 | 10.9%(+0.650)#12,223 |
| 3. | 85122 | 10.7% | 12.6%(-1.85)#247 | 10.9%(-0.120)#14,692 |
1
Common Questions
What are the Top Zip Codes with the Highest Percentage of Population Employed in Office & Administration in Casa Grande, AZ?
Top Zip Codes with the Highest Percentage of Population Employed in Office & Administration in Casa Grande, AZ are:
What zip code has the Highest Percentage of Population Employed in Office & Administration in Casa Grande, AZ?
85194 has the Highest Percentage of Population Employed in Office & Administration in Casa Grande, AZ with 13.7%.
What is the Percentage of Population Employed in Office & Administration in Casa Grande, AZ?
Percentage of Population Employed in Office & Administration in Casa Grande is 11.5%.
What is the Percentage of Population Employed in Office & Administration in Arizona?
Percentage of Population Employed in Office & Administration in Arizona is 12.6%.
What is the Percentage of Population Employed in Office & Administration in the United States?
Percentage of Population Employed in Office & Administration in the United States is 10.9%.