Zip Codes with the Highest Percentage of Population Employed in Legal Services & Support in Casa Grande, AZ
RELATED REPORTS & OPTIONS
Legal Services & Support
Casa Grande
Compare Zip Codes
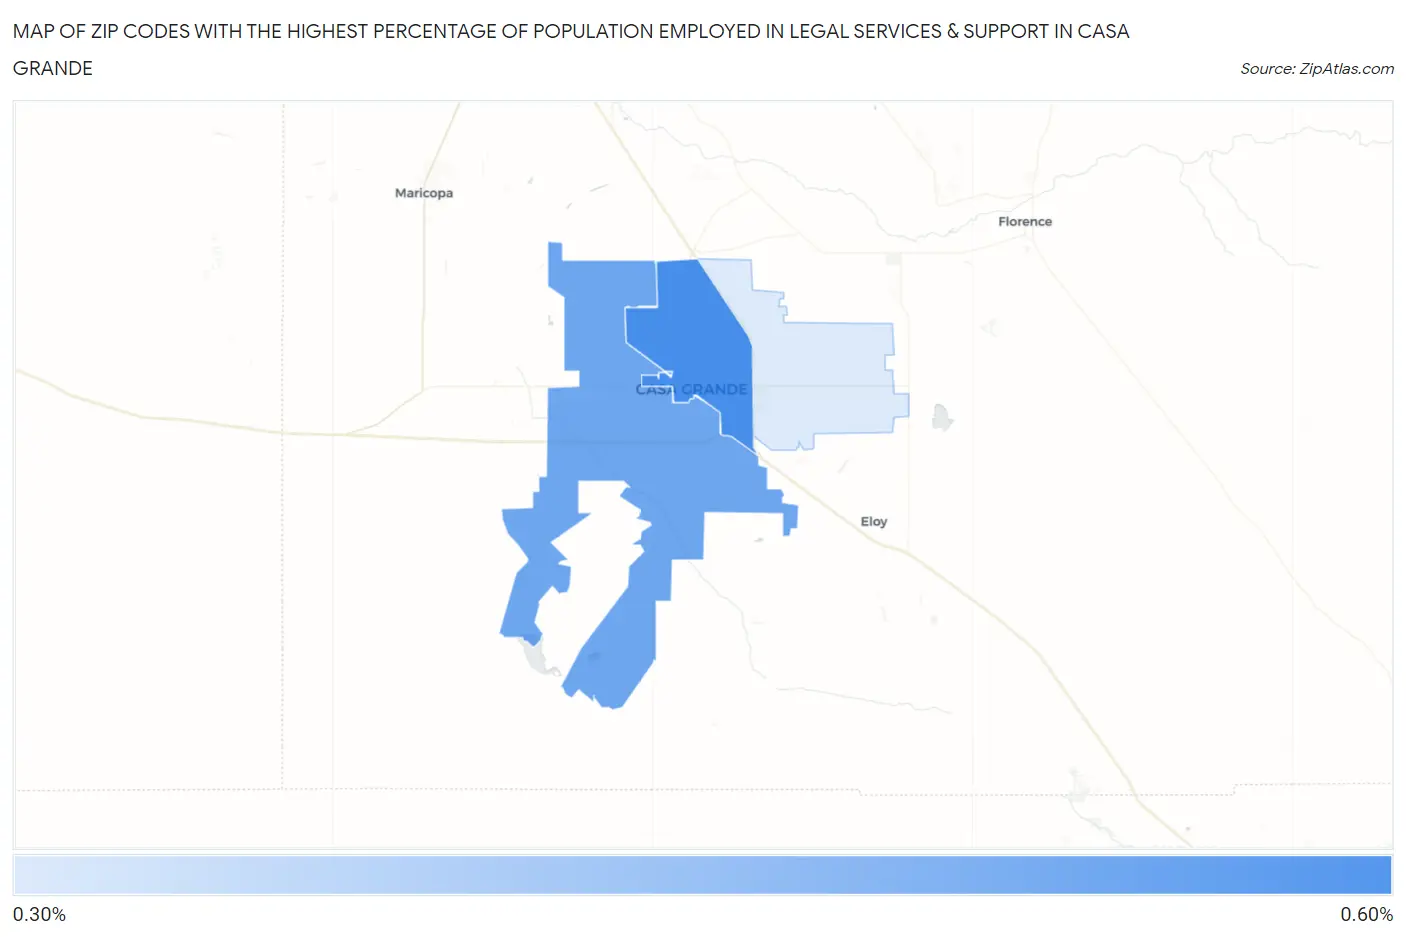
Map of Zip Codes with the Highest Percentage of Population Employed in Legal Services & Support in Casa Grande
0.0%
0.60%
Zip Codes with the Highest Percentage of Population Employed in Legal Services & Support in Casa Grande, AZ
| Zip Code | % Employed | vs State | vs National | |
| 1. | 85122 | 0.59% | 0.99%(-0.391)#166 | 1.2%(-0.589)#11,521 |
| 2. | 85193 | 0.54% | 0.99%(-0.450)#173 | 1.2%(-0.647)#12,190 |
| 3. | 85194 | 0.37% | 0.99%(-0.612)#201 | 1.2%(-0.809)#14,149 |
1
Common Questions
What are the Top Zip Codes with the Highest Percentage of Population Employed in Legal Services & Support in Casa Grande, AZ?
Top Zip Codes with the Highest Percentage of Population Employed in Legal Services & Support in Casa Grande, AZ are:
What zip code has the Highest Percentage of Population Employed in Legal Services & Support in Casa Grande, AZ?
85122 has the Highest Percentage of Population Employed in Legal Services & Support in Casa Grande, AZ with 0.59%.
What is the Percentage of Population Employed in Legal Services & Support in Casa Grande, AZ?
Percentage of Population Employed in Legal Services & Support in Casa Grande is 0.36%.
What is the Percentage of Population Employed in Legal Services & Support in Arizona?
Percentage of Population Employed in Legal Services & Support in Arizona is 0.99%.
What is the Percentage of Population Employed in Legal Services & Support in the United States?
Percentage of Population Employed in Legal Services & Support in the United States is 1.2%.