Area Code 747
Area Code 747 Map
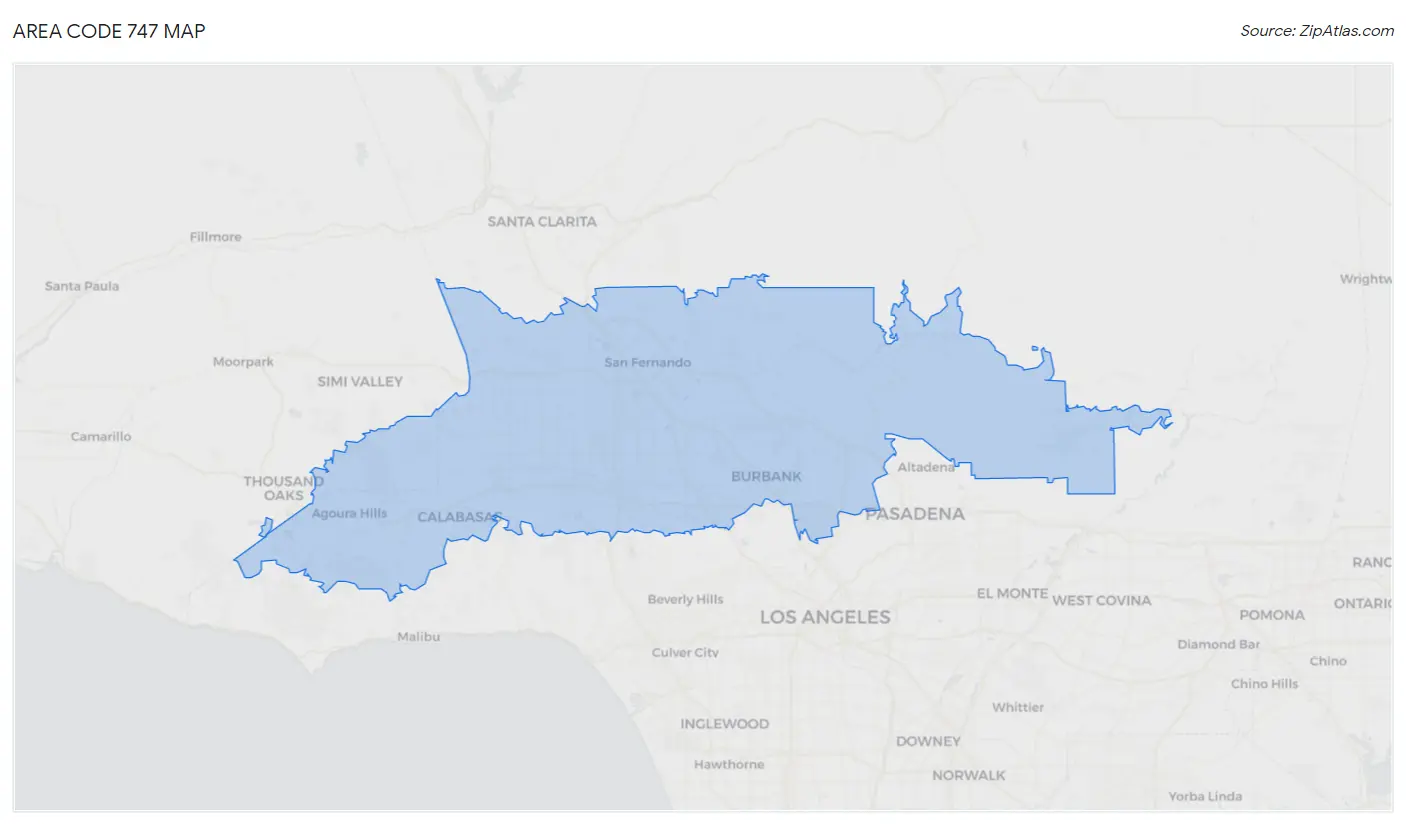
Area Code 747 Overview
734,515
TOTAL POPULATION
365,076
MALE POPULATION
369,439
FEMALE POPULATION
98.82
MALES / 100 FEMALES
101.20
FEMALES / 100 MALES
39.5
MEDIAN AGE
3.4
AVG FAMILY SIZE
2.8
AVG HOUSEHOLD SIZE
$51,172
PER CAPITA INCOME
$115,544
AVG FAMILY INCOME
$93,695
AVG HOUSEHOLD INCOME
20.5%
WAGE / INCOME GAP [ % ]
79.5¢/ $1
WAGE / INCOME GAP [ $ ]
$10,206
FAMILY INCOME DEFICIT
10.36
INEQUALITY / GINI INDEX
400,054
LABOR FORCE [ PEOPLE ]
66.5%
PERCENT IN LABOR FORCE
6.9%
UNEMPLOYMENT RATE
Race in Area Code 747
The most populous races in Area Code 747 are White / Caucasian (347,956 | 47.4%), Hispanic or Latino (335,399 | 45.7%), and Some other Race (166,407 | 22.7%).
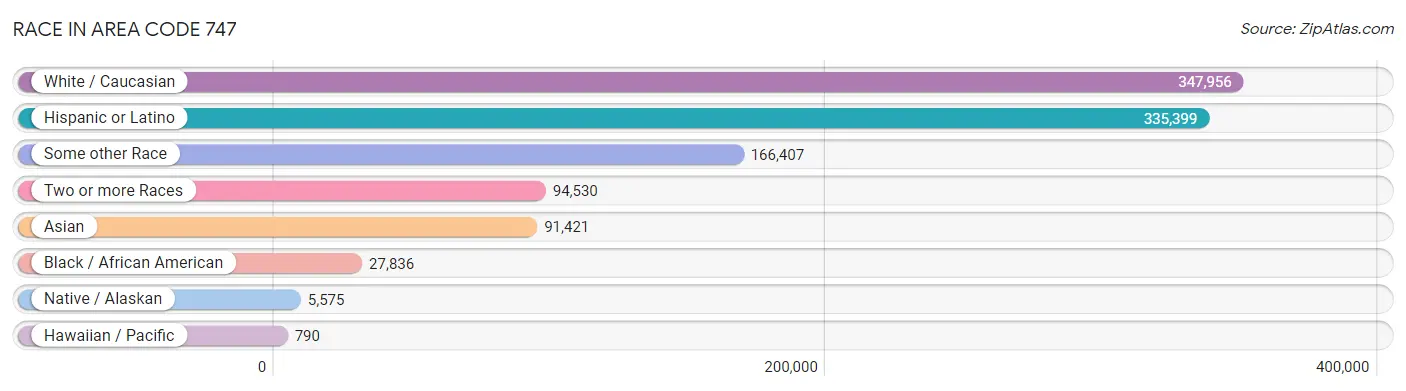
| Race | # Population | % Population |
| Asian | 91,421 | 12.4% |
| Black / African American | 27,836 | 3.8% |
| Hawaiian / Pacific | 790 | 0.1% |
| Hispanic or Latino | 335,399 | 45.7% |
| Native / Alaskan | 5,575 | 0.8% |
| White / Caucasian | 347,956 | 47.4% |
| Two or more Races | 94,530 | 12.9% |
| Some other Race | 166,407 | 22.7% |
| Total | 734,515 | 100.0% |
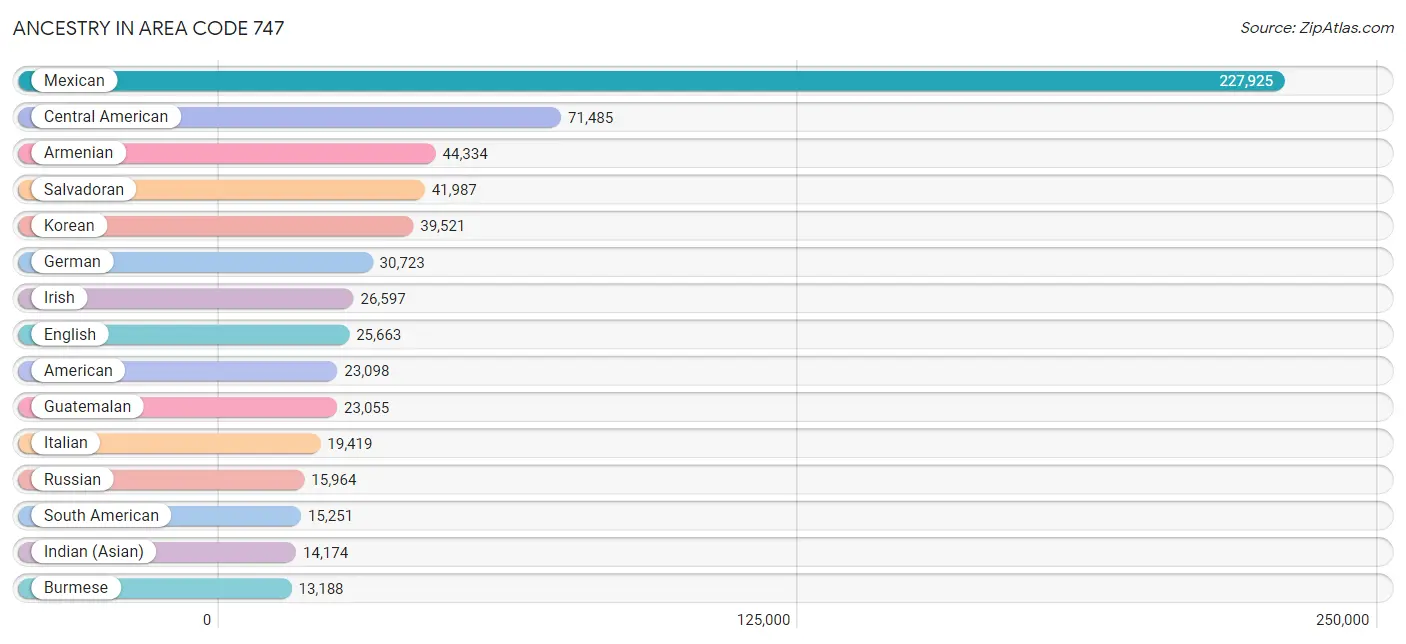
Ancestry in Area Code 747
The most populous ancestries reported in Area Code 747 are Mexican (227,925 | 31.0%), Central American (71,485 | 9.7%), Armenian (44,334 | 6.0%), Salvadoran (41,987 | 5.7%), and Korean (39,521 | 5.4%), together accounting for 57.9% of all Area Code 747 residents.
| Ancestry | # Population | % Population |
| Afghan | 1,314 | 0.2% |
| African | 2,801 | 0.4% |
| Alaska Native | 7 | 0.0% |
| Albanian | 105 | 0.0% |
| Aleut | 21 | 0.0% |
| American | 23,098 | 3.1% |
| Apache | 353 | 0.1% |
| Arab | 8,450 | 1.1% |
| Argentinean | 2,133 | 0.3% |
| Armenian | 44,334 | 6.0% |
| Assyrian / Chaldean / Syriac | 690 | 0.1% |
| Australian | 301 | 0.0% |
| Austrian | 1,566 | 0.2% |
| Bahamian | 137 | 0.0% |
| Bangladeshi | 20 | 0.0% |
| Basque | 361 | 0.1% |
| Belgian | 350 | 0.1% |
| Belizean | 446 | 0.1% |
| Bermudan | 14 | 0.0% |
| Bhutanese | 6,546 | 0.9% |
| Blackfeet | 268 | 0.0% |
| Bolivian | 429 | 0.1% |
| Brazilian | 901 | 0.1% |
| British | 2,716 | 0.4% |
| British West Indian | 97 | 0.0% |
| Bulgarian | 545 | 0.1% |
| Burmese | 13,188 | 1.8% |
| Cajun | 26 | 0.0% |
| Cambodian | 43 | 0.0% |
| Canadian | 1,165 | 0.2% |
| Cape Verdean | 232 | 0.0% |
| Celtic | 25 | 0.0% |
| Central American | 71,485 | 9.7% |
| Central American Indian | 1,564 | 0.2% |
| Cherokee | 1,377 | 0.2% |
| Cheyenne | 17 | 0.0% |
| Chickasaw | 73 | 0.0% |
| Chilean | 883 | 0.1% |
| Chinese | 9 | 0.0% |
| Chippewa | 50 | 0.0% |
| Choctaw | 404 | 0.1% |
| Colombian | 3,764 | 0.5% |
| Comanche | 26 | 0.0% |
| Costa Rican | 900 | 0.1% |
| Cree | 48 | 0.0% |
| Creek | 14 | 0.0% |
| Croatian | 471 | 0.1% |
| Cuban | 2,997 | 0.4% |
| Cypriot | 22 | 0.0% |
| Czech | 1,021 | 0.1% |
| Czechoslovakian | 416 | 0.1% |
| Danish | 1,174 | 0.2% |
| Delaware | 5 | 0.0% |
| Dominican | 641 | 0.1% |
| Dutch | 2,561 | 0.4% |
| Dutch West Indian | 4 | 0.0% |
| Eastern European | 4,770 | 0.6% |
| Ecuadorian | 1,643 | 0.2% |
| Egyptian | 1,980 | 0.3% |
| English | 25,663 | 3.5% |
| Estonian | 66 | 0.0% |
| Ethiopian | 204 | 0.0% |
| European | 8,510 | 1.2% |
| Filipino | 982 | 0.1% |
| Finnish | 680 | 0.1% |
| French | 6,742 | 0.9% |
| French American Indian | 12 | 0.0% |
| French Canadian | 913 | 0.1% |
| German | 30,723 | 4.2% |
| Ghanaian | 564 | 0.1% |
| Greek | 2,823 | 0.4% |
| Guamanian / Chamorro | 479 | 0.1% |
| Guatemalan | 23,055 | 3.1% |
| Guyanese | 46 | 0.0% |
| Haitian | 202 | 0.0% |
| Honduran | 2,695 | 0.4% |
| Hopi | 19 | 0.0% |
| Hungarian | 2,799 | 0.4% |
| Icelander | 47 | 0.0% |
| Indian (Asian) | 14,174 | 1.9% |
| Indonesian | 104 | 0.0% |
| Inupiat | 67 | 0.0% |
| Iranian | 13,077 | 1.8% |
| Iraqi | 457 | 0.1% |
| Irish | 26,597 | 3.6% |
| Iroquois | 62 | 0.0% |
| Israeli | 2,702 | 0.4% |
| Italian | 19,419 | 2.6% |
| Jamaican | 967 | 0.1% |
| Japanese | 720 | 0.1% |
| Jordanian | 264 | 0.0% |
| Kenyan | 101 | 0.0% |
| Kiowa | 10 | 0.0% |
| Korean | 39,521 | 5.4% |
| Laotian | 2,148 | 0.3% |
| Latvian | 199 | 0.0% |
| Lebanese | 2,026 | 0.3% |
| Liberian | 15 | 0.0% |
| Lithuanian | 699 | 0.1% |
| Macedonian | 104 | 0.0% |
| Malaysian | 148 | 0.0% |
| Maltese | 74 | 0.0% |
| Mexican | 227,925 | 31.0% |
| Mexican American Indian | 3,680 | 0.5% |
| Mongolian | 119 | 0.0% |
| Moroccan | 526 | 0.1% |
| Native Hawaiian | 544 | 0.1% |
| Navajo | 562 | 0.1% |
| Nicaraguan | 2,241 | 0.3% |
| Nigerian | 627 | 0.1% |
| Northern European | 664 | 0.1% |
| Norwegian | 2,958 | 0.4% |
| Okinawan | 18 | 0.0% |
| Osage | 34 | 0.0% |
| Paiute | 10 | 0.0% |
| Pakistani | 3,314 | 0.4% |
| Palestinian | 470 | 0.1% |
| Panamanian | 374 | 0.1% |
| Paraguayan | 42 | 0.0% |
| Pennsylvania German | 145 | 0.0% |
| Peruvian | 5,030 | 0.7% |
| Polish | 11,263 | 1.5% |
| Portuguese | 1,262 | 0.2% |
| Potawatomi | 7 | 0.0% |
| Pueblo | 193 | 0.0% |
| Puerto Rican | 3,061 | 0.4% |
| Romanian | 2,059 | 0.3% |
| Russian | 15,964 | 2.2% |
| Salvadoran | 41,987 | 5.7% |
| Samoan | 490 | 0.1% |
| Scandinavian | 675 | 0.1% |
| Scotch-Irish | 2,129 | 0.3% |
| Scottish | 4,545 | 0.6% |
| Seminole | 47 | 0.0% |
| Senegalese | 46 | 0.0% |
| Serbian | 351 | 0.1% |
| Shoshone | 56 | 0.0% |
| Sierra Leonean | 28 | 0.0% |
| Sioux | 167 | 0.0% |
| Slavic | 191 | 0.0% |
| Slovak | 257 | 0.0% |
| Slovene | 207 | 0.0% |
| Somali | 12 | 0.0% |
| South African | 394 | 0.1% |
| South American | 15,251 | 2.1% |
| South American Indian | 108 | 0.0% |
| Soviet Union | 27 | 0.0% |
| Spaniard | 2,853 | 0.4% |
| Spanish | 1,677 | 0.2% |
| Spanish American | 105 | 0.0% |
| Spanish American Indian | 49 | 0.0% |
| Sri Lankan | 9,784 | 1.3% |
| Subsaharan African | 5,168 | 0.7% |
| Sudanese | 30 | 0.0% |
| Swedish | 2,820 | 0.4% |
| Swiss | 1,092 | 0.2% |
| Syrian | 662 | 0.1% |
| Taiwanese | 165 | 0.0% |
| Thai | 12,169 | 1.7% |
| Tlingit-Haida | 4 | 0.0% |
| Tohono O'Odham | 9 | 0.0% |
| Tongan | 302 | 0.0% |
| Trinidadian and Tobagonian | 199 | 0.0% |
| Turkish | 910 | 0.1% |
| U.S. Virgin Islander | 179 | 0.0% |
| Ugandan | 153 | 0.0% |
| Ukrainian | 3,210 | 0.4% |
| Uruguayan | 409 | 0.1% |
| Ute | 3 | 0.0% |
| Venezuelan | 791 | 0.1% |
| Vietnamese | 536 | 0.1% |
| Welsh | 1,535 | 0.2% |
| West Indian | 160 | 0.0% |
| Yaqui | 234 | 0.0% |
| Yugoslavian | 140 | 0.0% |
| Yuman | 27 | 0.0% |
| Zimbabwean | 8 | 0.0% | View All 177 Rows |
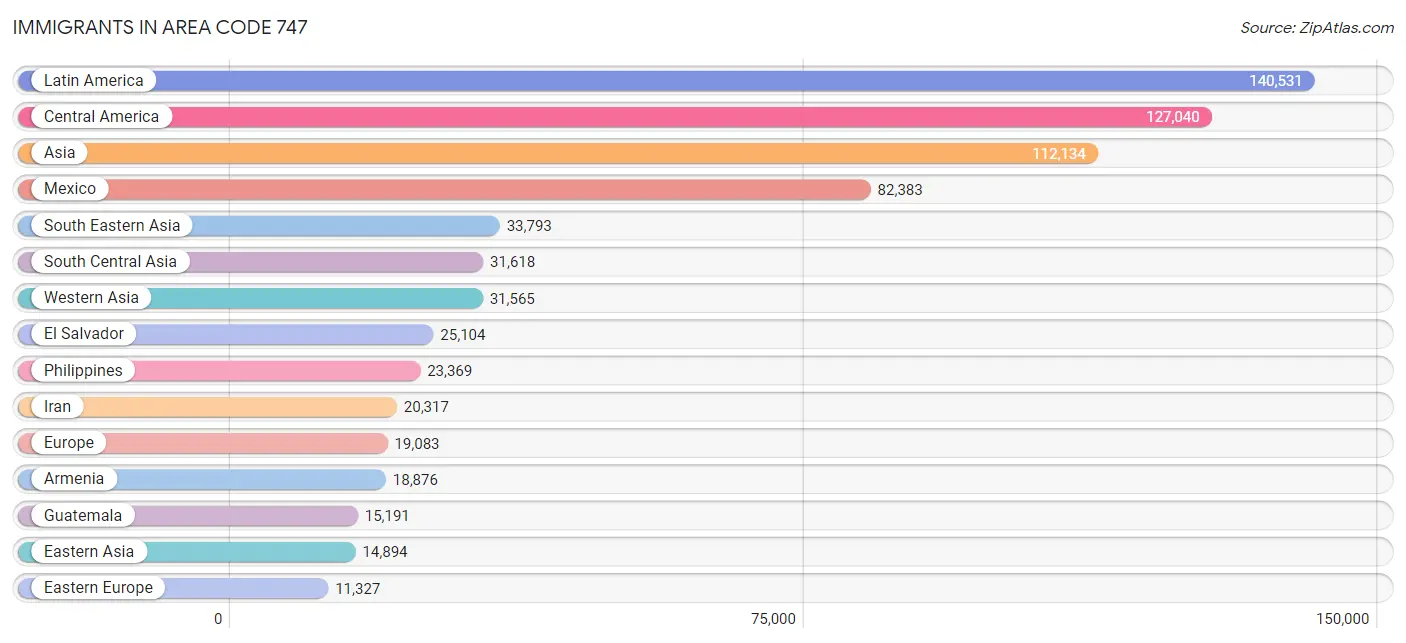
Immigrants in Area Code 747
The most numerous immigrant groups reported in Area Code 747 came from Latin America (140,531 | 19.1%), Central America (127,040 | 17.3%), Asia (112,134 | 15.3%), Mexico (82,383 | 11.2%), and South Eastern Asia (33,793 | 4.6%), together accounting for 67.5% of all Area Code 747 residents.
| Immigration Origin | # Population | % Population |
| Afghanistan | 836 | 0.1% |
| Africa | 4,504 | 0.6% |
| Albania | 33 | 0.0% |
| Argentina | 1,405 | 0.2% |
| Armenia | 18,876 | 2.6% |
| Asia | 112,134 | 15.3% |
| Australia | 348 | 0.1% |
| Austria | 220 | 0.0% |
| Azores | 11 | 0.0% |
| Bahamas | 8 | 0.0% |
| Bangladesh | 609 | 0.1% |
| Belarus | 384 | 0.1% |
| Belgium | 81 | 0.0% |
| Belize | 245 | 0.0% |
| Bolivia | 469 | 0.1% |
| Bosnia and Herzegovina | 200 | 0.0% |
| Brazil | 877 | 0.1% |
| Bulgaria | 707 | 0.1% |
| Cambodia | 292 | 0.0% |
| Cameroon | 19 | 0.0% |
| Canada | 1,878 | 0.3% |
| Caribbean | 2,437 | 0.3% |
| Central America | 127,040 | 17.3% |
| Chile | 692 | 0.1% |
| China | 5,734 | 0.8% |
| Colombia | 2,483 | 0.3% |
| Costa Rica | 277 | 0.0% |
| Croatia | 55 | 0.0% |
| Cuba | 1,274 | 0.2% |
| Czechoslovakia | 146 | 0.0% |
| Denmark | 101 | 0.0% |
| Dominican Republic | 220 | 0.0% |
| Eastern Africa | 865 | 0.1% |
| Eastern Asia | 14,894 | 2.0% |
| Eastern Europe | 11,327 | 1.5% |
| Ecuador | 978 | 0.1% |
| Egypt | 1,533 | 0.2% |
| El Salvador | 25,104 | 3.4% |
| England | 1,294 | 0.2% |
| Eritrea | 16 | 0.0% |
| Ethiopia | 207 | 0.0% |
| Europe | 19,083 | 2.6% |
| Fiji | 45 | 0.0% |
| France | 1,052 | 0.1% |
| Germany | 1,251 | 0.2% |
| Ghana | 382 | 0.1% |
| Greece | 371 | 0.1% |
| Grenada | 6 | 0.0% |
| Guatemala | 15,191 | 2.1% |
| Guyana | 56 | 0.0% |
| Haiti | 101 | 0.0% |
| Honduras | 2,459 | 0.3% |
| Hong Kong | 549 | 0.1% |
| Hungary | 386 | 0.1% |
| India | 7,408 | 1.0% |
| Indonesia | 1,424 | 0.2% |
| Iran | 20,317 | 2.8% |
| Iraq | 2,056 | 0.3% |
| Ireland | 225 | 0.0% |
| Israel | 2,762 | 0.4% |
| Italy | 903 | 0.1% |
| Jamaica | 452 | 0.1% |
| Japan | 1,595 | 0.2% |
| Jordan | 382 | 0.1% |
| Kazakhstan | 262 | 0.0% |
| Kenya | 201 | 0.0% |
| Korea | 7,555 | 1.0% |
| Kuwait | 342 | 0.1% |
| Laos | 39 | 0.0% |
| Latin America | 140,531 | 19.1% |
| Latvia | 57 | 0.0% |
| Lebanon | 2,762 | 0.4% |
| Liberia | 22 | 0.0% |
| Lithuania | 37 | 0.0% |
| Malaysia | 192 | 0.0% |
| Mexico | 82,383 | 11.2% |
| Middle Africa | 97 | 0.0% |
| Moldova | 365 | 0.1% |
| Morocco | 239 | 0.0% |
| Nepal | 302 | 0.0% |
| Netherlands | 242 | 0.0% |
| Nicaragua | 1,134 | 0.2% |
| Nigeria | 378 | 0.1% |
| North Macedonia | 111 | 0.0% |
| Northern Africa | 1,888 | 0.3% |
| Northern Europe | 2,949 | 0.4% |
| Norway | 60 | 0.0% |
| Oceania | 831 | 0.1% |
| Pakistan | 999 | 0.1% |
| Panama | 192 | 0.0% |
| Peru | 3,016 | 0.4% |
| Philippines | 23,369 | 3.2% |
| Poland | 705 | 0.1% |
| Portugal | 99 | 0.0% |
| Romania | 710 | 0.1% |
| Russia | 3,599 | 0.5% |
| Saudi Arabia | 100 | 0.0% |
| Scotland | 248 | 0.0% |
| Senegal | 46 | 0.0% |
| Serbia | 146 | 0.0% |
| Sierra Leone | 38 | 0.0% |
| Singapore | 79 | 0.0% |
| Somalia | 12 | 0.0% |
| South Africa | 511 | 0.1% |
| South America | 11,054 | 1.5% |
| South Central Asia | 31,618 | 4.3% |
| South Eastern Asia | 33,793 | 4.6% |
| Southern Europe | 1,654 | 0.2% |
| Spain | 281 | 0.0% |
| Sri Lanka | 485 | 0.1% |
| Sweden | 117 | 0.0% |
| Switzerland | 269 | 0.0% |
| Syria | 1,897 | 0.3% |
| Taiwan | 1,604 | 0.2% |
| Thailand | 2,161 | 0.3% |
| Trinidad and Tobago | 142 | 0.0% |
| Turkey | 867 | 0.1% |
| Uganda | 348 | 0.1% |
| Ukraine | 3,168 | 0.4% |
| Uruguay | 212 | 0.0% |
| Uzbekistan | 338 | 0.1% |
| Venezuela | 764 | 0.1% |
| Vietnam | 6,162 | 0.8% |
| West Indies | 117 | 0.0% |
| Western Africa | 890 | 0.1% |
| Western Asia | 31,565 | 4.3% |
| Western Europe | 3,115 | 0.4% |
| Zaire | 78 | 0.0% |
| Zimbabwe | 21 | 0.0% | View All 129 Rows |
Sex and Age in Area Code 747
Sex and Age in Area Code 747
The most populous age groups in Area Code 747 are 30 to 34 Years (29,759 | 8.2%) for men and 25 to 29 Years (28,874 | 7.8%) for women.
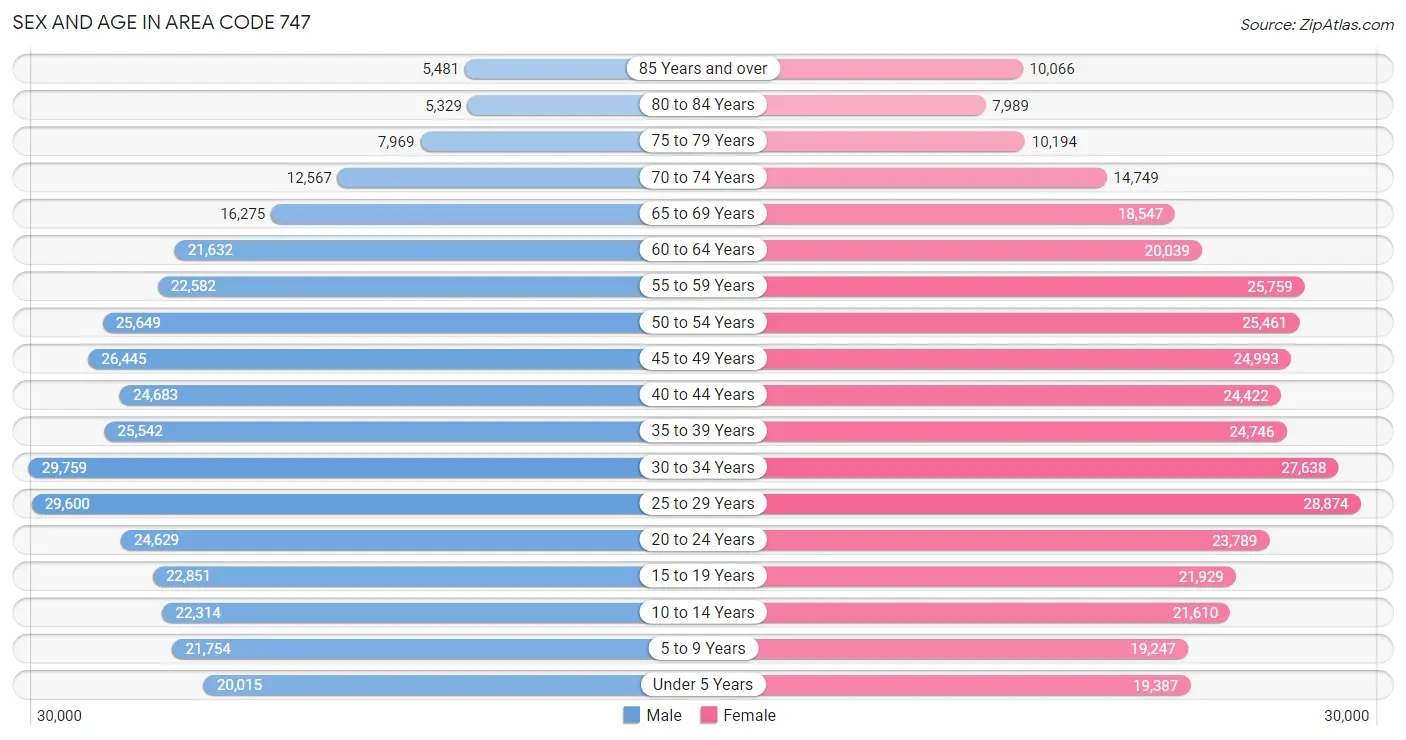
| Age Bracket | Male | Female |
| Under 5 Years | 20,015 (5.5%) | 19,387 (5.2%) |
| 5 to 9 Years | 21,754 (6.0%) | 19,247 (5.2%) |
| 10 to 14 Years | 22,314 (6.1%) | 21,610 (5.9%) |
| 15 to 19 Years | 22,851 (6.3%) | 21,929 (5.9%) |
| 20 to 24 Years | 24,629 (6.8%) | 23,789 (6.4%) |
| 25 to 29 Years | 29,600 (8.1%) | 28,874 (7.8%) |
| 30 to 34 Years | 29,759 (8.2%) | 27,638 (7.5%) |
| 35 to 39 Years | 25,542 (7.0%) | 24,746 (6.7%) |
| 40 to 44 Years | 24,683 (6.8%) | 24,422 (6.6%) |
| 45 to 49 Years | 26,445 (7.2%) | 24,993 (6.8%) |
| 50 to 54 Years | 25,649 (7.0%) | 25,461 (6.9%) |
| 55 to 59 Years | 22,582 (6.2%) | 25,759 (7.0%) |
| 60 to 64 Years | 21,632 (5.9%) | 20,039 (5.4%) |
| 65 to 69 Years | 16,275 (4.5%) | 18,547 (5.0%) |
| 70 to 74 Years | 12,567 (3.4%) | 14,749 (4.0%) |
| 75 to 79 Years | 7,969 (2.2%) | 10,194 (2.8%) |
| 80 to 84 Years | 5,329 (1.5%) | 7,989 (2.2%) |
| 85 Years and over | 5,481 (1.5%) | 10,066 (2.7%) |
| Total | 365,076 (100.0%) | 369,439 (100.0%) |
Families and Households in Area Code 747
Median Family Size in Area Code 747
The median family size in Area Code 747 is 3.41 persons per family, with married-couple families (117,058 | 70.0%) accounting for the largest median family size of 3.5109 persons per family. On the other hand, single male/father families (16,561 | 9.9%) represent the smallest median family size with 3.08 persons per family.
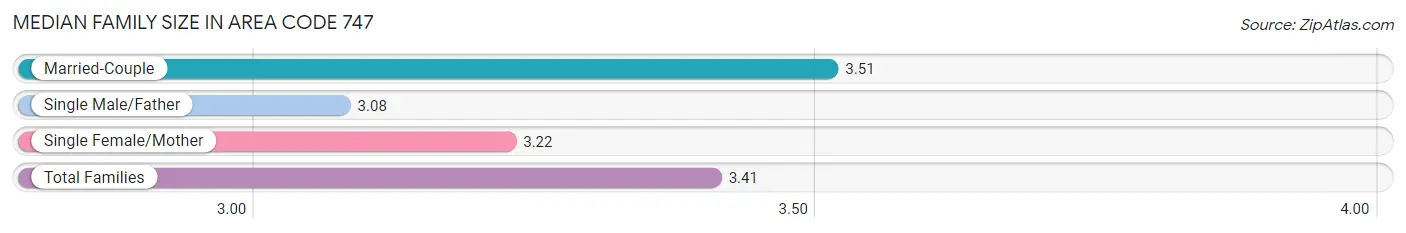
| Family Type | # Families | Family Size |
| Married-Couple | 117,058 (70.0%) | 3.51 |
| Single Male/Father | 16,561 (9.9%) | 3.08 |
| Single Female/Mother | 33,614 (20.1%) | 3.22 |
| Total Families | 167,233 (100.0%) | 3.41 |
Median Household Size in Area Code 747
The median household size in Area Code 747 is 2.84 persons per household, with married-couple households (117,058 | 48.0%) accounting for the largest median household size of 3.56409 persons per household. non-family households (76,767 | 31.5%) represent the smallest median household size with 1.36 persons per household.
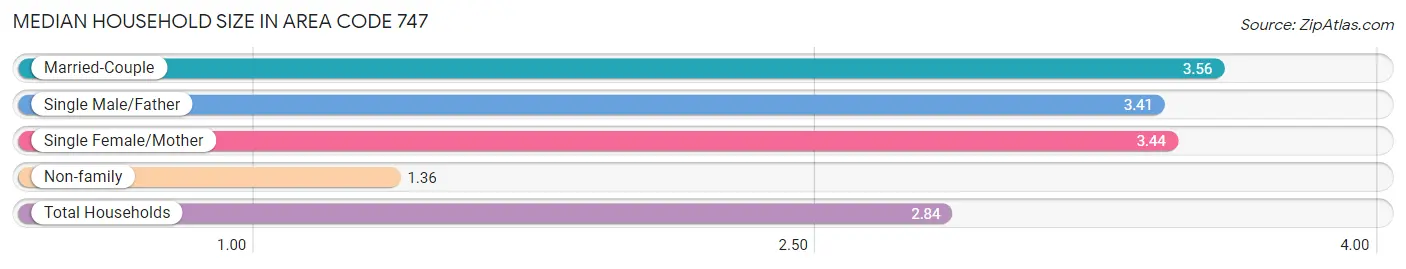
| Household Type | # Households | Household Size |
| Married-Couple | 117,058 (48.0%) | 3.56 |
| Single Male/Father | 16,561 (6.8%) | 3.41 |
| Single Female/Mother | 33,614 (13.8%) | 3.44 |
| Non-family | 76,767 (31.5%) | 1.36 |
| Total Households | 244,000 (100.0%) | 2.84 |
Household Size by Marriage Status in Area Code 747
Out of a total of 244,000 households in Area Code 747, 167,233 (68.5%) are family households, while 76,767 (31.5%) are nonfamily households. The most numerous type of family households are 2-person households, comprising 53,828, and the most common type of nonfamily households are 1-person households, comprising 58,322.
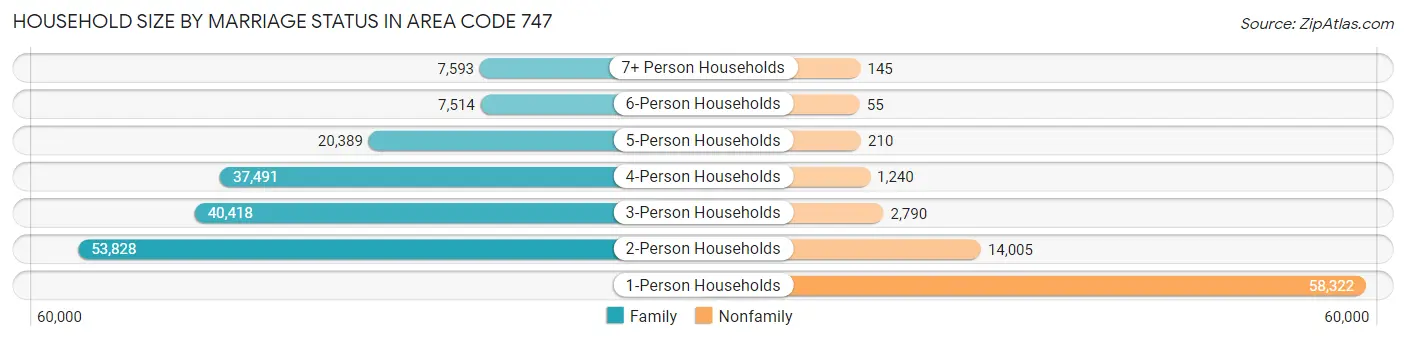
| Household Size | Family Households | Nonfamily Households |
| 1-Person Households | - | 58,322 (23.9%) |
| 2-Person Households | 53,828 (22.1%) | 14,005 (5.7%) |
| 3-Person Households | 40,418 (16.6%) | 2,790 (1.1%) |
| 4-Person Households | 37,491 (15.4%) | 1,240 (0.5%) |
| 5-Person Households | 20,389 (8.4%) | 210 (0.1%) |
| 6-Person Households | 7,514 (3.1%) | 55 (0.0%) |
| 7+ Person Households | 7,593 (3.1%) | 145 (0.1%) |
| Total | 167,233 (68.5%) | 76,767 (31.5%) |
Female Fertility in Area Code 747
Fertility by Age in Area Code 747
Average fertility rate in Area Code 747 is 53.7 births per 1,000 women. Women in the age bracket of 35 to 50 years have the highest fertility rate with 60.2 births per 1,000 women. Women in the age bracket of 20 to 34 years acount for 56.5% of all women with births.
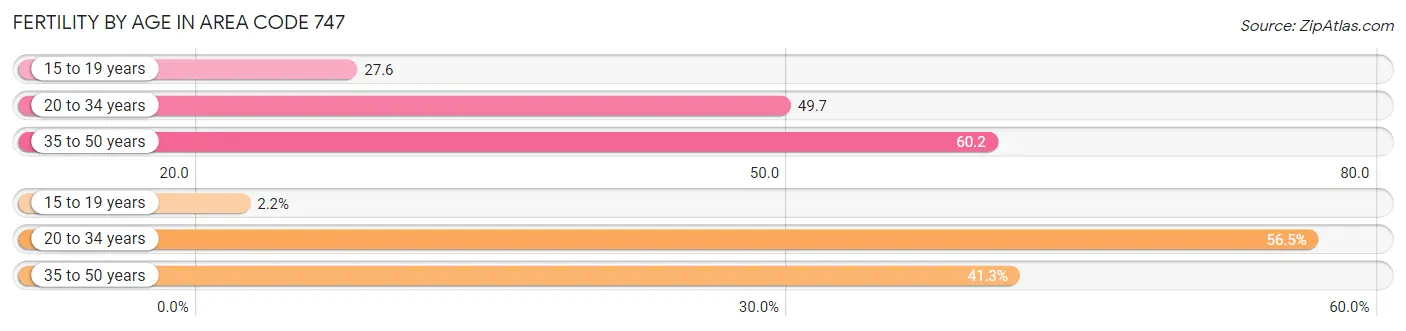
| Age Bracket | Women with Births | Births / 1,000 Women |
| 15 to 19 years | 169 (2.1%) | 27.6 |
| 20 to 34 years | 4,443 (56.5%) | 49.7 |
| 35 to 50 years | 3,248 (41.3%) | 60.2 |
| Total | 7,860 (100.0%) | 53.7 |
Fertility by Age by Marriage Status in Area Code 747
70.2% of women with births (7,860) in Area Code 747 are married. The highest percentage of unmarried women with births falls into 15 to 19 years age bracket with 99.4% of them unmarried at the time of birth, while the lowest percentage of unmarried women with births belong to 35 to 50 years age bracket with 27.2% of them unmarried.
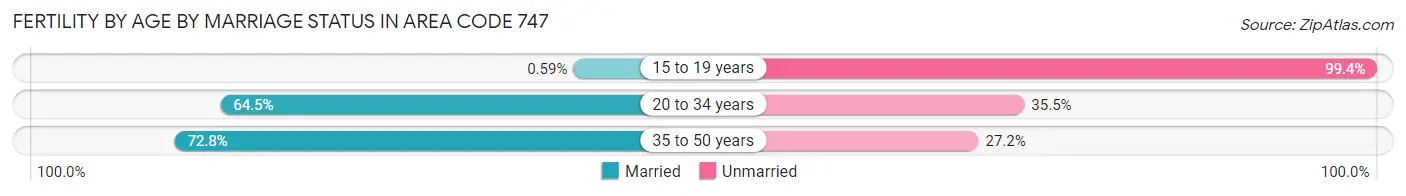
| Age Bracket | Married | Unmarried |
| 15 to 19 years | 1 (0.6%) | 168 (99.4%) |
| 20 to 34 years | 2,867 (64.5%) | 1,576 (35.5%) |
| 35 to 50 years | 2,366 (72.8%) | 882 (27.2%) |
| Total | 5,518 (70.2%) | 2,342 (29.8%) |
Fertility by Education in Area Code 747
Average fertility rate in Area Code 747 is 53.7 births per 1,000 women. Women with the education attainment of graduate degree have the highest fertility rate of 106.2 births per 1,000 women, while women with the education attainment of less than high school have the lowest fertility at 26.8 births per 1,000 women. Women with the education attainment of college or associate's degree represent 30.2% of all women with births.
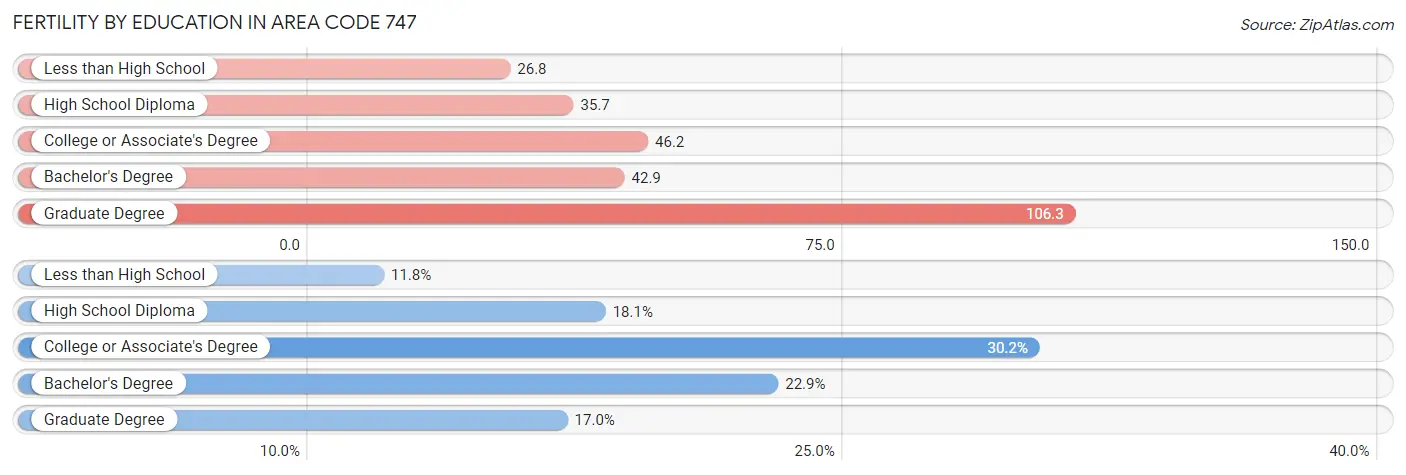
| Educational Attainment | Women with Births | Births / 1,000 Women |
| Less than High School | 929 (11.8%) | 26.8 |
| High School Diploma | 1,419 (18.0%) | 35.7 |
| College or Associate's Degree | 2,377 (30.2%) | 46.2 |
| Bachelor's Degree | 1,800 (22.9%) | 42.9 |
| Graduate Degree | 1,335 (17.0%) | 106.2 |
| Total | 7,860 (100.0%) | 53.7 |
Fertility by Education by Marriage Status in Area Code 747
29.8% of women with births in Area Code 747 are unmarried. Women with the educational attainment of graduate degree are most likely to be married with 90.0% of them married at childbirth, while women with the educational attainment of high school diploma are least likely to be married with 66.1% of them unmarried at childbirth.
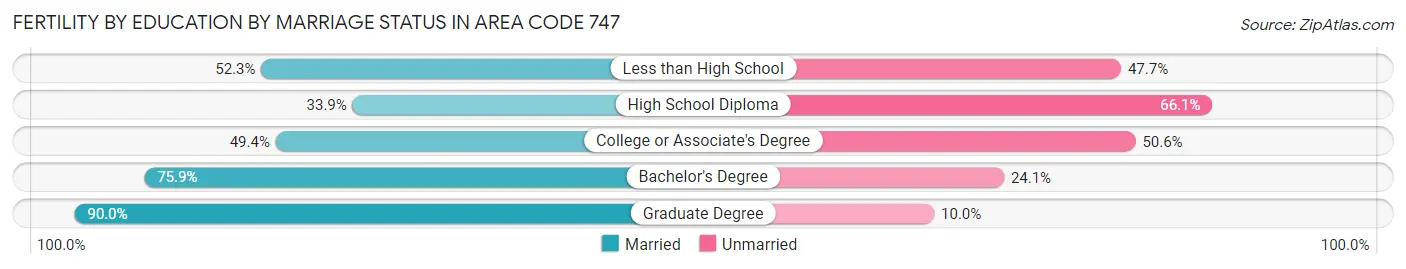
| Educational Attainment | Married | Unmarried |
| Less than High School | 486 (52.3%) | 443 (47.7%) |
| High School Diploma | 481 (33.9%) | 938 (66.1%) |
| College or Associate's Degree | 1,174 (49.4%) | 1,203 (50.6%) |
| Bachelor's Degree | 1,366 (75.9%) | 434 (24.1%) |
| Graduate Degree | 1,201 (90.0%) | 134 (10.0%) |
| Total | 5,518 (70.2%) | 2,342 (29.8%) |
Income in Area Code 747
Income Overview in Area Code 747
Per Capita Income in Area Code 747 is $51,172, while median incomes of families and households are $115,544 and $93,695 respectively.
| Characteristic | Number | Measure |
| Per Capita Income | 734,515 | $51,172 |
| Median Family Income | 167,233 | $115,544 |
| Mean Family Income | 167,233 | $3,378,554 |
| Median Household Income | 244,000 | $93,695 |
| Mean Household Income | 244,000 | $2,938,309 |
| Income Deficit | 167,233 | $10,206 |
| Wage / Income Gap (%) | 734,515 | 20.48% |
| Wage / Income Gap ($) | 734,515 | 79.52¢ per $1 |
| Gini / Inequality Index | 734,515 | 10.36 |
Earnings by Sex in Area Code 747
Average Earnings in Area Code 747 are $50,097, $59,952 for men and $41,928 for women, a difference of 30.1%.
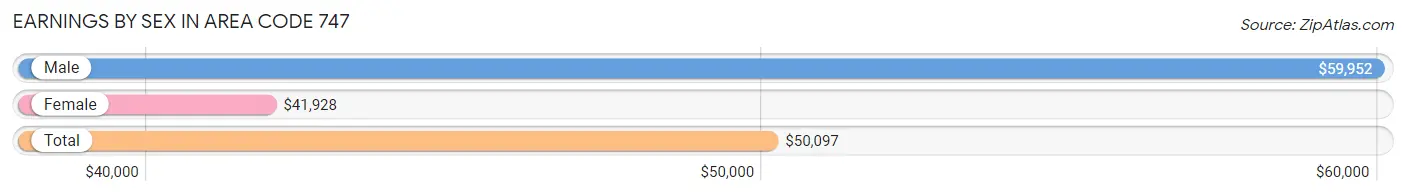
| Sex | Number | Average Earnings |
| Male | 215,902 (53.9%) | $59,952 |
| Female | 184,825 (46.1%) | $41,928 |
| Total | 400,727 (100.0%) | $50,097 |
Earnings by Sex by Income Bracket in Area Code 747
The most common earnings brackets in Area Code 747 are $100,000+ for men (44,687 | 20.7%) and $100,000+ for women (26,901 | 14.5%).
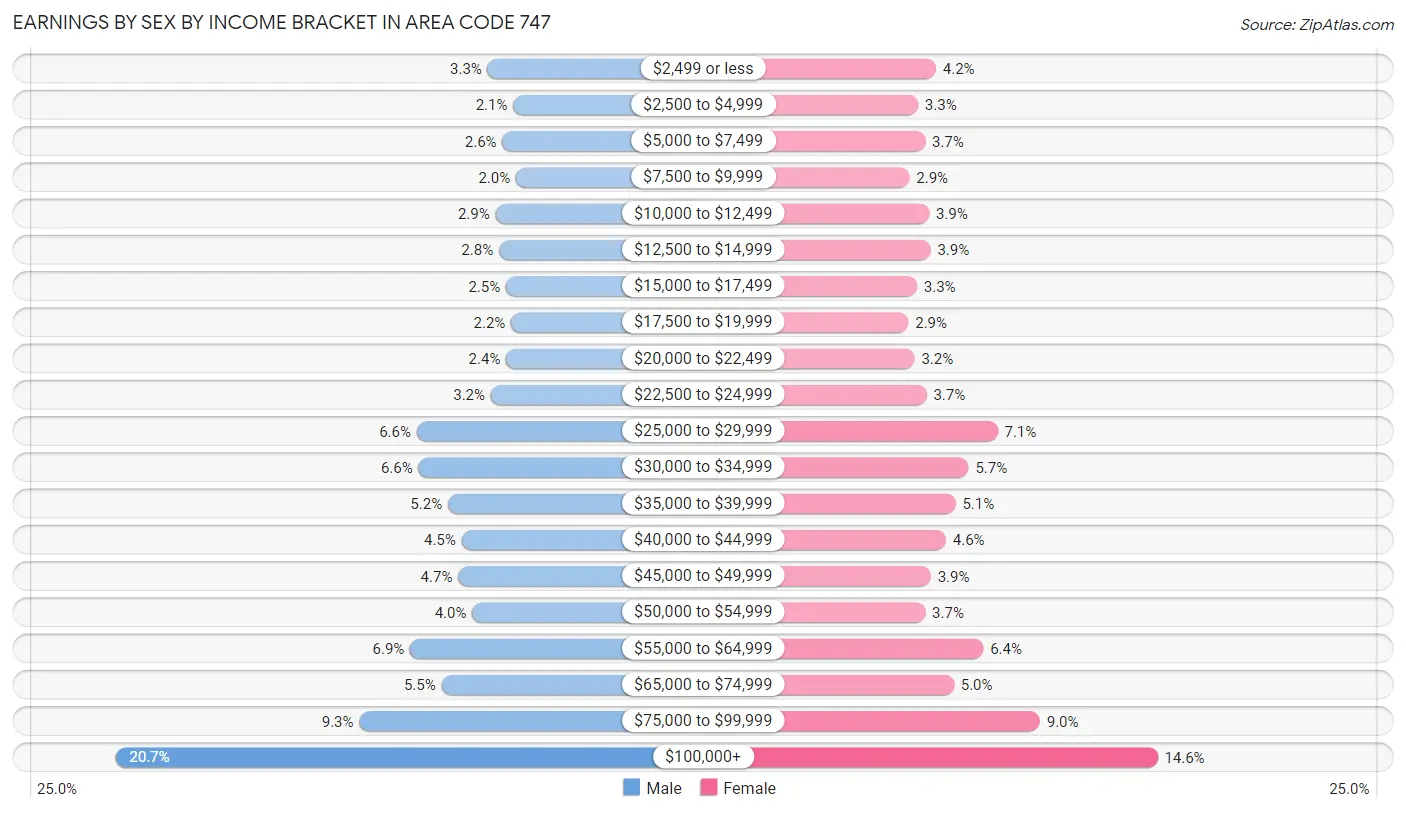
| Income | Male | Female |
| $2,499 or less | 7,138 (3.3%) | 7,710 (4.2%) |
| $2,500 to $4,999 | 4,546 (2.1%) | 6,155 (3.3%) |
| $5,000 to $7,499 | 5,660 (2.6%) | 6,770 (3.7%) |
| $7,500 to $9,999 | 4,271 (2.0%) | 5,411 (2.9%) |
| $10,000 to $12,499 | 6,337 (2.9%) | 7,109 (3.8%) |
| $12,500 to $14,999 | 5,994 (2.8%) | 7,250 (3.9%) |
| $15,000 to $17,499 | 5,290 (2.5%) | 6,059 (3.3%) |
| $17,500 to $19,999 | 4,767 (2.2%) | 5,320 (2.9%) |
| $20,000 to $22,499 | 5,271 (2.4%) | 5,858 (3.2%) |
| $22,500 to $24,999 | 6,822 (3.2%) | 6,903 (3.7%) |
| $25,000 to $29,999 | 14,306 (6.6%) | 13,051 (7.1%) |
| $30,000 to $34,999 | 14,133 (6.6%) | 10,528 (5.7%) |
| $35,000 to $39,999 | 11,164 (5.2%) | 9,401 (5.1%) |
| $40,000 to $44,999 | 9,770 (4.5%) | 8,574 (4.6%) |
| $45,000 to $49,999 | 10,128 (4.7%) | 7,268 (3.9%) |
| $50,000 to $54,999 | 8,698 (4.0%) | 6,791 (3.7%) |
| $55,000 to $64,999 | 14,983 (6.9%) | 11,815 (6.4%) |
| $65,000 to $74,999 | 11,807 (5.5%) | 9,251 (5.0%) |
| $75,000 to $99,999 | 20,130 (9.3%) | 16,700 (9.0%) |
| $100,000+ | 44,687 (20.7%) | 26,901 (14.5%) |
| Total | 215,902 (100.0%) | 184,825 (100.0%) |
Earnings by Sex by Educational Attainment in Area Code 747
Average earnings in Area Code 747 are $1,412,945 for men and $984,464 for women, a difference of 30.3%. Men with an educational attainment of graduate degree enjoy the highest average annual earnings of $1,963,899, while those with less than high school education earn the least with $621,946. Women with an educational attainment of graduate degree earn the most with the average annual earnings of $1,793,133, while those with less than high school education have the smallest earnings of $402,308.
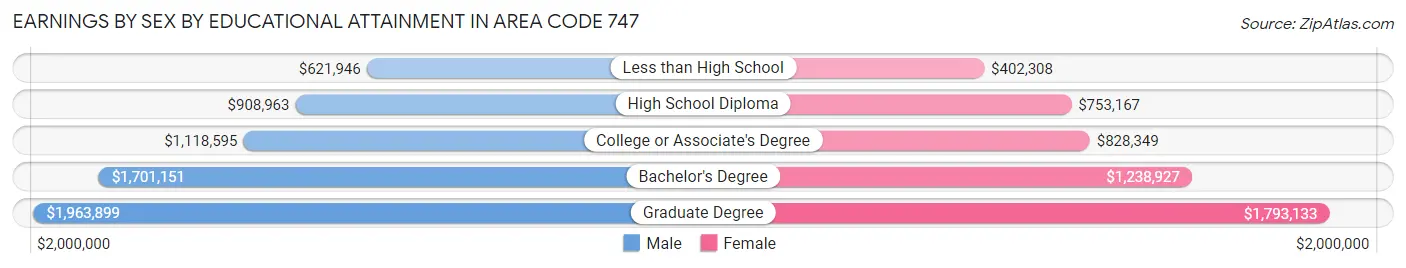
| Educational Attainment | Male Income | Female Income |
| Less than High School | $621,946 | $402,308 |
| High School Diploma | $908,963 | $753,167 |
| College or Associate's Degree | $1,118,595 | $828,349 |
| Bachelor's Degree | $1,701,151 | $1,238,927 |
| Graduate Degree | $1,963,899 | $1,793,133 |
| Total | $1,412,945 | $984,464 |
Family Income in Area Code 747
Family Income Brackets in Area Code 747
According to the Area Code 747 family income data, there are 850,547 families falling into the $200,000+ income range, which is the most common income bracket and makes up 508.6% of all families. Conversely, the $10,000 to $14,999 income bracket is the least frequent group with only 72,412 families (43.3%) belonging to this category.
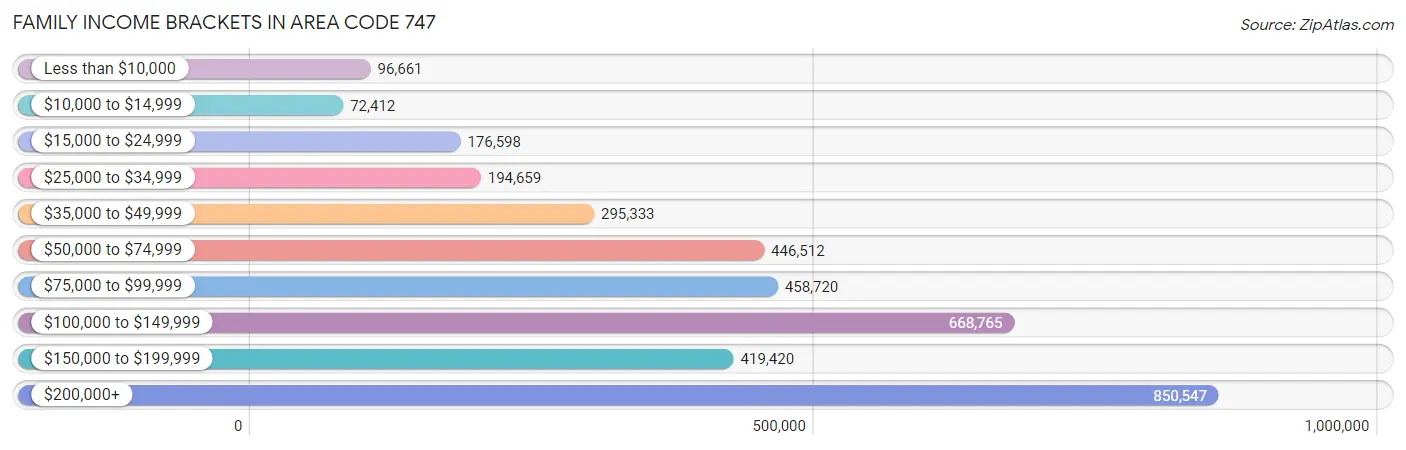
| Income Bracket | # Families | % Families |
| Less than $10,000 | 96,661 | 57.8% |
| $10,000 to $14,999 | 72,412 | 43.3% |
| $15,000 to $24,999 | 176,598 | 105.6% |
| $25,000 to $34,999 | 194,659 | 116.4% |
| $35,000 to $49,999 | 295,333 | 176.6% |
| $50,000 to $74,999 | 446,512 | 267.0% |
| $75,000 to $99,999 | 458,720 | 274.3% |
| $100,000 to $149,999 | 668,765 | 399.9% |
| $150,000 to $199,999 | 419,420 | 250.8% |
| $200,000+ | 850,547 | 508.6% |
Family Income by Famaliy Size in Area Code 747
7+ person families (6,289 | 3.8%) account for the highest median family income in Area Code 747 with $141,397 per family, while 2-person families (59,481 | 35.6%) have the highest median income of $45,250 per family member.
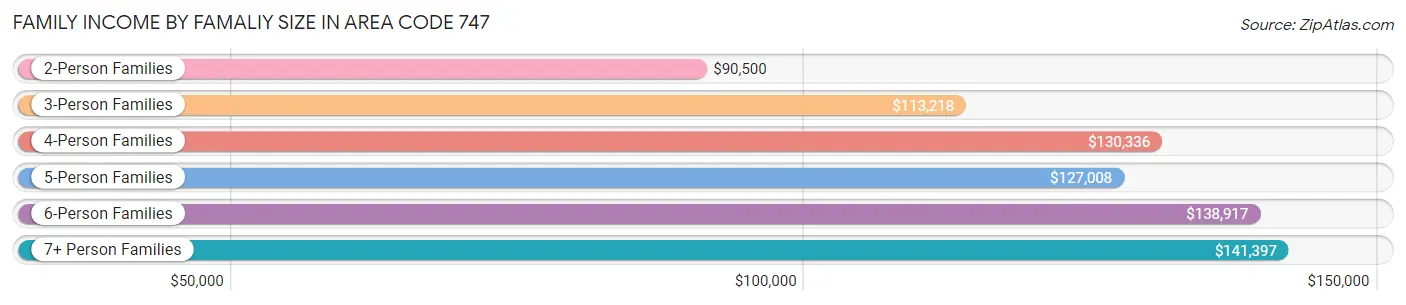
| Income Bracket | # Families | Median Income |
| 2-Person Families | 59,481 (35.6%) | $90,500 |
| 3-Person Families | 39,977 (23.9%) | $113,218 |
| 4-Person Families | 36,301 (21.7%) | $130,336 |
| 5-Person Families | 18,842 (11.3%) | $127,008 |
| 6-Person Families | 6,343 (3.8%) | $138,917 |
| 7+ Person Families | 6,289 (3.8%) | $141,397 |
| Total | 167,233 (100.0%) | $115,544 |
Family Income by Number of Earners in Area Code 747
The median family income in Area Code 747 is $115,544, with families comprising 3+ earners (31,614) having the highest median family income of $154,147, while families with no earners (16,919) have the lowest median family income of $45,006, accounting for 18.9% and 10.1% of families, respectively.
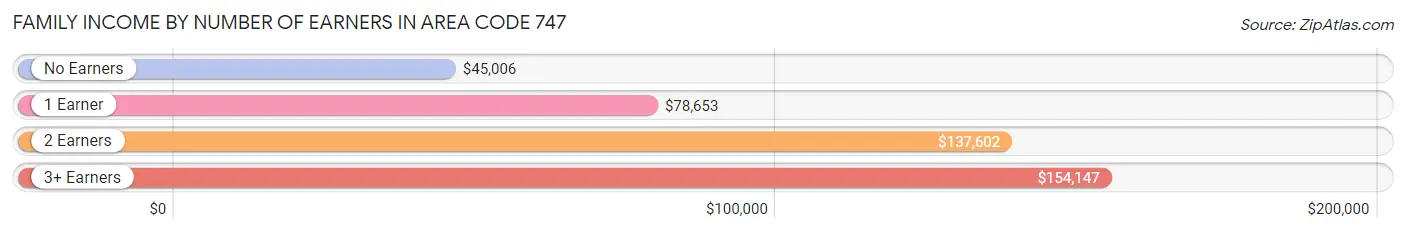
| Number of Earners | # Families | Median Income |
| No Earners | 16,919 (10.1%) | $45,006 |
| 1 Earner | 49,474 (29.6%) | $78,653 |
| 2 Earners | 69,226 (41.4%) | $137,602 |
| 3+ Earners | 31,614 (18.9%) | $154,147 |
| Total | 167,233 (100.0%) | $115,544 |
Household Income in Area Code 747
Household Income Brackets in Area Code 747
With 984,540 households falling in the category, the $200,000+ income range is the most frequent in Area Code 747, accounting for 403.5% of all households. In contrast, only 241,804 households (99.1%) fall into the less than $10,000 income bracket, making it the least populous group.
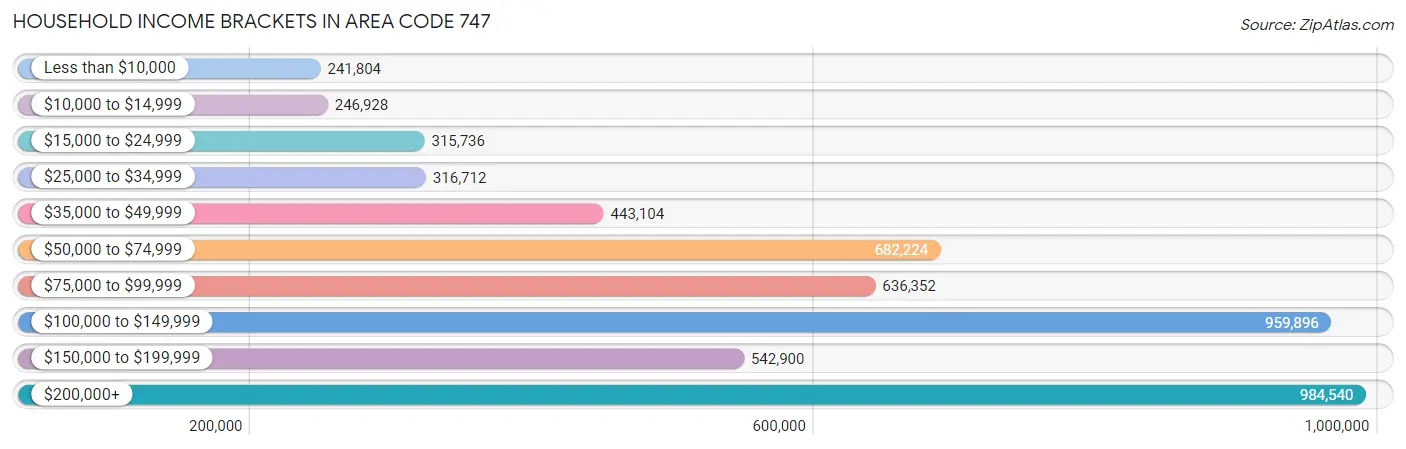
| Income Bracket | # Households | % Households |
| Less than $10,000 | 241,804 | 99.1% |
| $10,000 to $14,999 | 246,928 | 101.2% |
| $15,000 to $24,999 | 315,736 | 129.4% |
| $25,000 to $34,999 | 316,712 | 129.8% |
| $35,000 to $49,999 | 443,104 | 181.6% |
| $50,000 to $74,999 | 682,224 | 279.6% |
| $75,000 to $99,999 | 636,352 | 260.8% |
| $100,000 to $149,999 | 959,896 | 393.4% |
| $150,000 to $199,999 | 542,900 | 222.5% |
| $200,000+ | 984,540 | 403.5% |
Household Income by Householder Age in Area Code 747
The median household income in Area Code 747 is $93,695, with the highest median household income of $107,310 found in the 45 to 64 years age bracket for the primary householder. A total of 97,895 households (40.1%) fall into this category. Meanwhile, the 15 to 24 years age bracket for the primary householder has the lowest median household income of $48,399, with 5,762 households (2.4%) in this group.
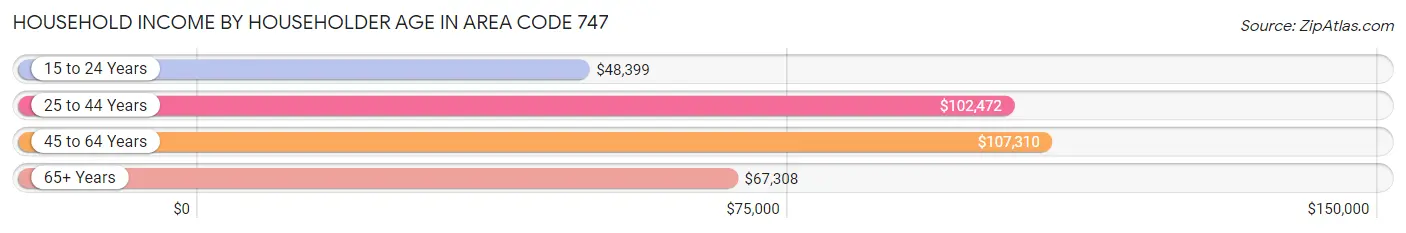
| Income Bracket | # Households | Median Income |
| 15 to 24 Years | 5,762 (2.4%) | $48,399 |
| 25 to 44 Years | 82,105 (33.7%) | $102,472 |
| 45 to 64 Years | 97,895 (40.1%) | $107,310 |
| 65+ Years | 58,238 (23.9%) | $67,308 |
| Total | 244,000 (100.0%) | $93,695 |
Poverty in Area Code 747
Income Below Poverty by Sex and Age in Area Code 747
With 12.2% poverty level for males and 14.1% for females among the residents of Area Code 747, 16 and 17 year old males and 75 year old and over females are the most vulnerable to poverty, with 1,842 males (19.5%) and 5,514 females (20.5%) in their respective age groups living below the poverty level.
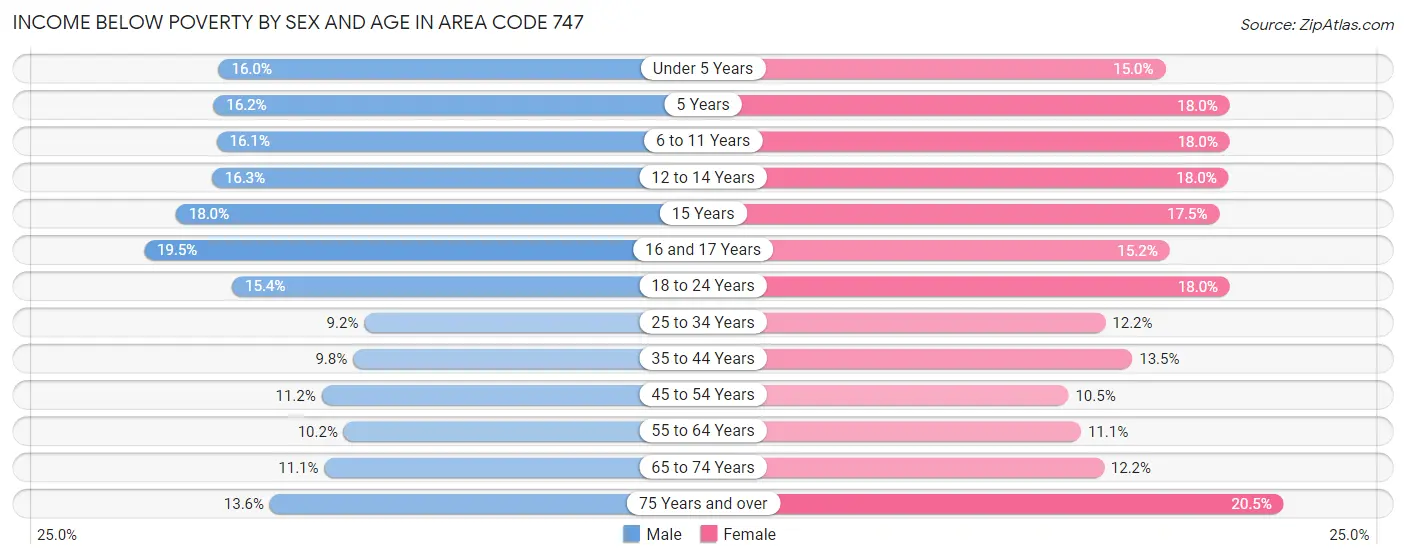
| Age Bracket | Male | Female |
| Under 5 Years | 3,170 (16.0%) | 2,849 (15.0%) |
| 5 Years | 596 (16.2%) | 597 (18.0%) |
| 6 to 11 Years | 4,224 (16.1%) | 4,389 (18.0%) |
| 12 to 14 Years | 2,181 (16.3%) | 2,272 (17.9%) |
| 15 Years | 838 (18.0%) | 769 (17.5%) |
| 16 and 17 Years | 1,842 (19.5%) | 1,320 (15.2%) |
| 18 to 24 Years | 5,105 (15.4%) | 5,873 (18.0%) |
| 25 to 34 Years | 5,482 (9.2%) | 6,911 (12.2%) |
| 35 to 44 Years | 4,895 (9.8%) | 6,623 (13.5%) |
| 45 to 54 Years | 5,829 (11.2%) | 5,302 (10.5%) |
| 55 to 64 Years | 4,471 (10.2%) | 5,063 (11.1%) |
| 65 to 74 Years | 3,153 (11.1%) | 4,003 (12.2%) |
| 75 Years and over | 2,478 (13.6%) | 5,514 (20.5%) |
| Total | 44,264 (12.2%) | 51,485 (14.1%) |
Income Above Poverty by Sex and Age in Area Code 747
According to the poverty statistics in Area Code 747, males aged 25 to 34 years and females aged 45 to 54 years are the age groups that are most secure financially, with 90.8% of males and 89.5% of females in these age groups living above the poverty line.
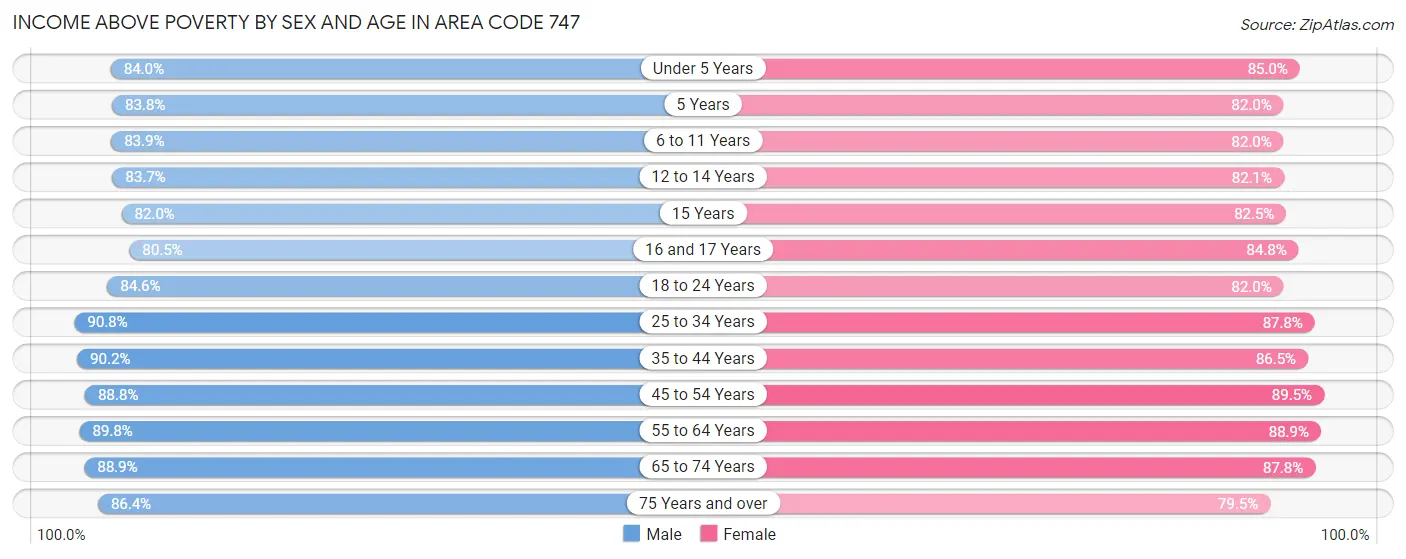
| Age Bracket | Male | Female |
| Under 5 Years | 16,639 (84.0%) | 16,138 (85.0%) |
| 5 Years | 3,075 (83.8%) | 2,722 (82.0%) |
| 6 to 11 Years | 22,030 (83.9%) | 19,999 (82.0%) |
| 12 to 14 Years | 11,190 (83.7%) | 10,382 (82.1%) |
| 15 Years | 3,822 (82.0%) | 3,621 (82.5%) |
| 16 and 17 Years | 7,626 (80.5%) | 7,359 (84.8%) |
| 18 to 24 Years | 28,116 (84.6%) | 26,743 (82.0%) |
| 25 to 34 Years | 53,841 (90.8%) | 49,590 (87.8%) |
| 35 to 44 Years | 45,265 (90.2%) | 42,520 (86.5%) |
| 45 to 54 Years | 46,117 (88.8%) | 45,086 (89.5%) |
| 55 to 64 Years | 39,407 (89.8%) | 40,551 (88.9%) |
| 65 to 74 Years | 25,283 (88.9%) | 28,919 (87.8%) |
| 75 Years and over | 15,720 (86.4%) | 21,387 (79.5%) |
| Total | 318,131 (87.8%) | 315,017 (86.0%) |
Income Below Poverty Among Married-Couple Families in Area Code 747
The poverty statistics for married-couple families in Area Code 747 show that 7.0% or 8,160 of the total 117,058 families live below the poverty line. Families with 3 or 4 children have the highest poverty rate of 18.7%, comprising of 1,711 families. On the other hand, families with no children have the lowest poverty rate of 5.0%, which includes 3,228 families.
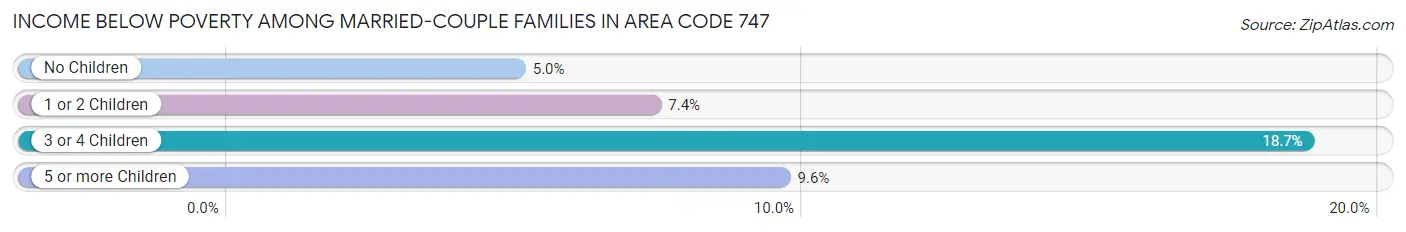
| Children | Above Poverty | Below Poverty |
| No Children | 61,156 (95.0%) | 3,228 (5.0%) |
| 1 or 2 Children | 39,823 (92.6%) | 3,168 (7.4%) |
| 3 or 4 Children | 7,421 (81.3%) | 1,711 (18.7%) |
| 5 or more Children | 498 (90.4%) | 53 (9.6%) |
| Total | 108,898 (93.0%) | 8,160 (7.0%) |
Income Below Poverty Among Single-Parent Households in Area Code 747
According to the poverty data in Area Code 747, 10.2% or 1,688 single-father households and 18.0% or 6,039 single-mother households are living below the poverty line. Among single-father households, those with 3 or 4 children have the highest poverty rate, with 309 households (24.9%) experiencing poverty. Likewise, among single-mother households, those with 5 or more children have the highest poverty rate, with 204 households (60.2%) falling below the poverty line.
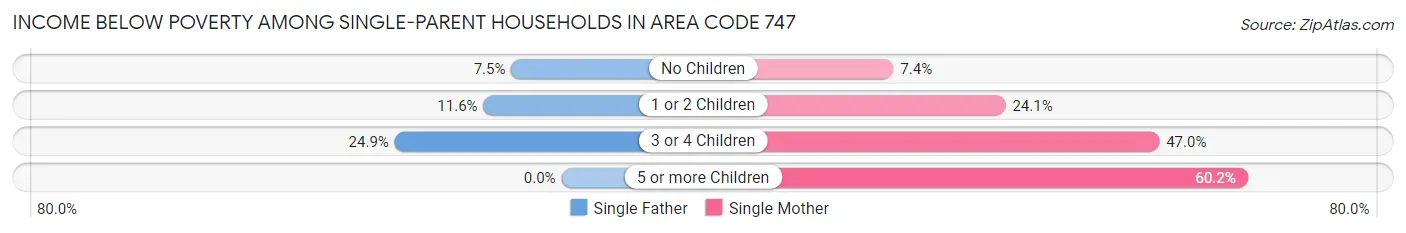
| Children | Single Father | Single Mother |
| No Children | 719 (7.5%) | 1,220 (7.4%) |
| 1 or 2 Children | 660 (11.6%) | 3,457 (24.1%) |
| 3 or 4 Children | 309 (24.9%) | 1,158 (47.0%) |
| 5 or more Children | 0 (0.0%) | 204 (60.2%) |
| Total | 1,688 (10.2%) | 6,039 (18.0%) |
Income Below Poverty Among Married-Couple vs Single-Parent Households in Area Code 747
The poverty data for Area Code 747 shows that 8,160 of the married-couple family households (7.0%) and 7,727 of the single-parent households (15.4%) are living below the poverty level. Within the married-couple family households, those with 3 or 4 children have the highest poverty rate, with 1,711 households (18.7%) falling below the poverty line. Among the single-parent households, those with 5 or more children have the highest poverty rate, with 204 household (55.1%) living below poverty.
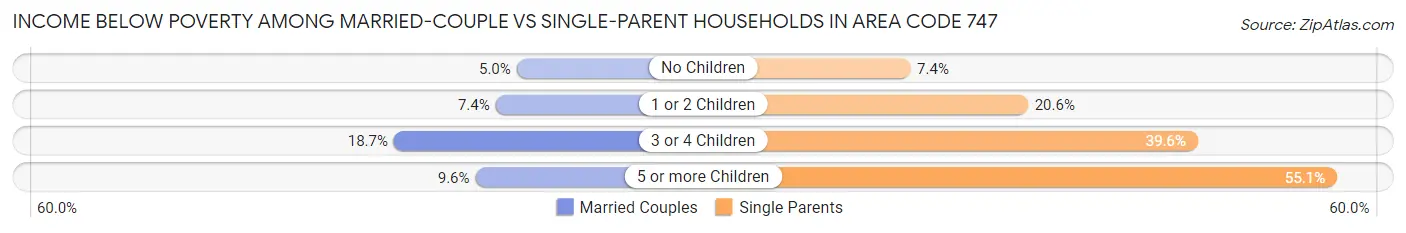
| Children | Married-Couple Families | Single-Parent Households |
| No Children | 3,228 (5.0%) | 1,939 (7.4%) |
| 1 or 2 Children | 3,168 (7.4%) | 4,117 (20.6%) |
| 3 or 4 Children | 1,711 (18.7%) | 1,467 (39.6%) |
| 5 or more Children | 53 (9.6%) | 204 (55.1%) |
| Total | 8,160 (7.0%) | 7,727 (15.4%) |
Employment Characteristics in Area Code 747
Employment by Class of Employer in Area Code 747
Among the 358,880 employed individuals in Area Code 747, private company employees (238,677 | 66.5%), self-employed (not incorporated) (36,355 | 10.1%), and not-for-profit organizations (24,381 | 6.8%) make up the most common classes of employment.
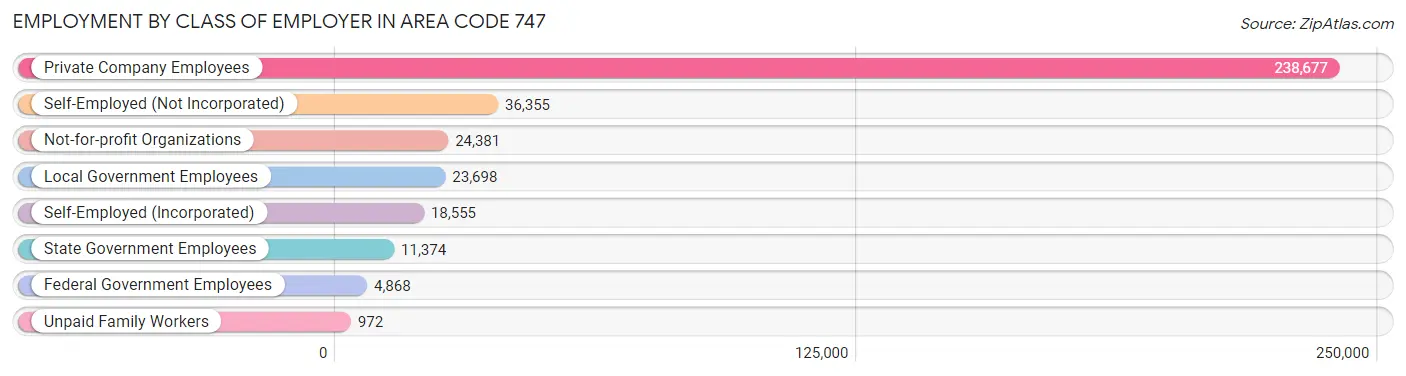
| Employer Class | # Employees | % Employees |
| Private Company Employees | 238,677 | 66.5% |
| Self-Employed (Incorporated) | 18,555 | 5.2% |
| Self-Employed (Not Incorporated) | 36,355 | 10.1% |
| Not-for-profit Organizations | 24,381 | 6.8% |
| Local Government Employees | 23,698 | 6.6% |
| State Government Employees | 11,374 | 3.2% |
| Federal Government Employees | 4,868 | 1.4% |
| Unpaid Family Workers | 972 | 0.3% |
| Total | 358,880 | 100.0% |
Employment Status by Age in Area Code 747
According to the labor force statistics for Area Code 747, out of the total population over 16 years of age (601,133), 66.5% or 400,054 individuals are in the labor force, with 6.9% or 27,684 of them unemployed. The age group with the highest labor force participation rate is 25 to 29 years, with 85.0% or 49,720 individuals in the labor force. Within the labor force, the 16 to 19 years age range has the highest percentage of unemployed individuals, with 389.5% or 37,154 of them being unemployed.
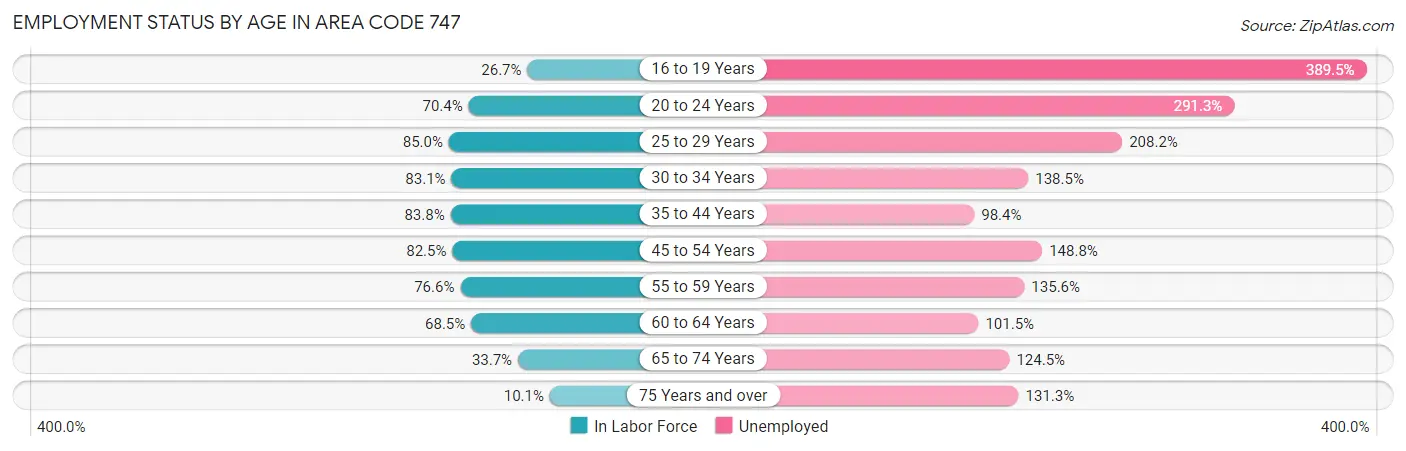
| Age Bracket | In Labor Force | Unemployed |
| 16 to 19 Years | 9,540 (26.7%) | 37,154 (389.5%) |
| 20 to 24 Years | 34,072 (70.4%) | 99,252 (291.3%) |
| 25 to 29 Years | 49,722 (85.0%) | 103,517 (208.2%) |
| 30 to 34 Years | 47,705 (83.1%) | 66,069 (138.5%) |
| 35 to 44 Years | 83,282 (83.8%) | 81,949 (98.4%) |
| 45 to 54 Years | 84,574 (82.5%) | 125,842 (148.8%) |
| 55 to 59 Years | 37,018 (76.6%) | 50,199 (135.6%) |
| 60 to 64 Years | 28,547 (68.5%) | 28,973 (101.5%) |
| 65 to 74 Years | 20,946 (33.7%) | 26,079 (124.5%) |
| 75 Years and over | 4,725 (10.1%) | 6,205 (131.3%) |
| Total | 400,054 (66.5%) | 27,676 (6.9%) |
Employment Status by Educational Attainment in Area Code 747
According to labor force statistics for Area Code 747, 81.4% of individuals (331,806) out of the total population between 25 and 64 years of age (407,824) are in the labor force, with 136.7% or 453,579 of them being unemployed. The group with the highest labor force participation rate are those with the educational attainment of bachelor's degree or higher, with 88.2% or 133,132 individuals in the labor force. Within the labor force, individuals with college / associate degree education have the highest percentage of unemployment, with 172.8% or 149,985 of them being unemployed.
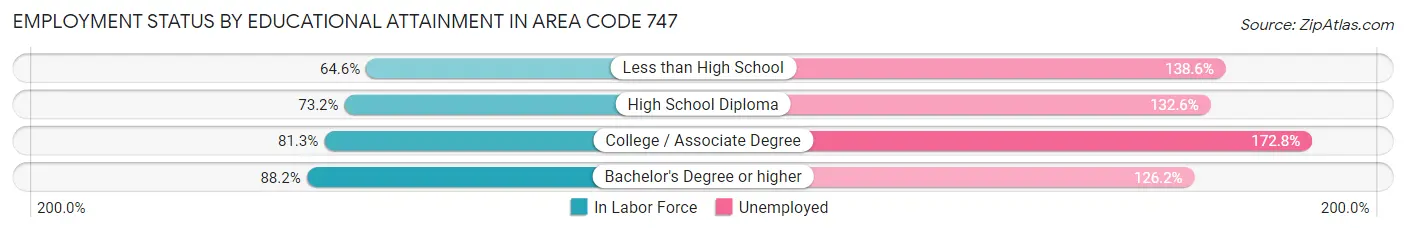
| Educational Attainment | In Labor Force | Unemployed |
| Less than High School | 44,511 (64.6%) | 95,505 (138.6%) |
| High School Diploma | 59,421 (73.2%) | 107,646 (132.6%) |
| College / Associate Degree | 86,792 (81.2%) | 184,597 (172.8%) |
| Bachelor's Degree or higher | 133,136 (88.2%) | 190,447 (126.2%) |
| Total | 331,802 (81.4%) | 557,495 (136.7%) |
Employment Occupations by Sex in Area Code 747
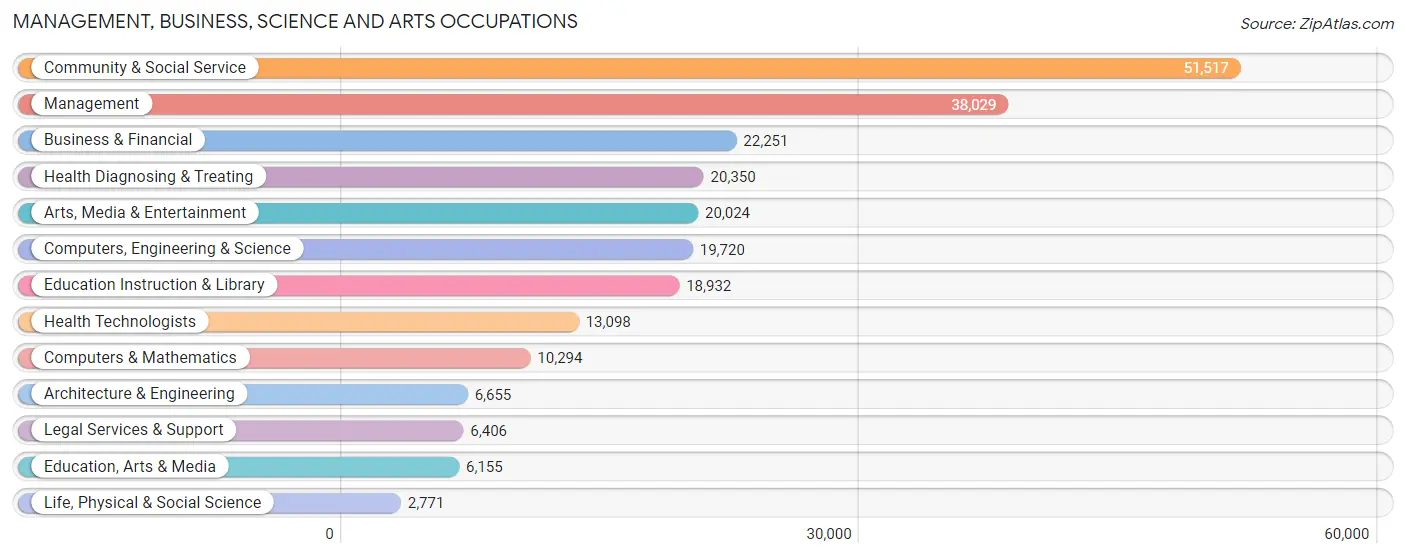
Management, Business, Science and Arts Occupations
The most common Management, Business, Science and Arts occupations in Area Code 747 are Community & Social Service (51,517 | 14.0%), Management (38,029 | 10.3%), Business & Financial (22,251 | 6.0%), Health Diagnosing & Treating (20,350 | 5.5%), and Arts, Media & Entertainment (20,024 | 5.4%).
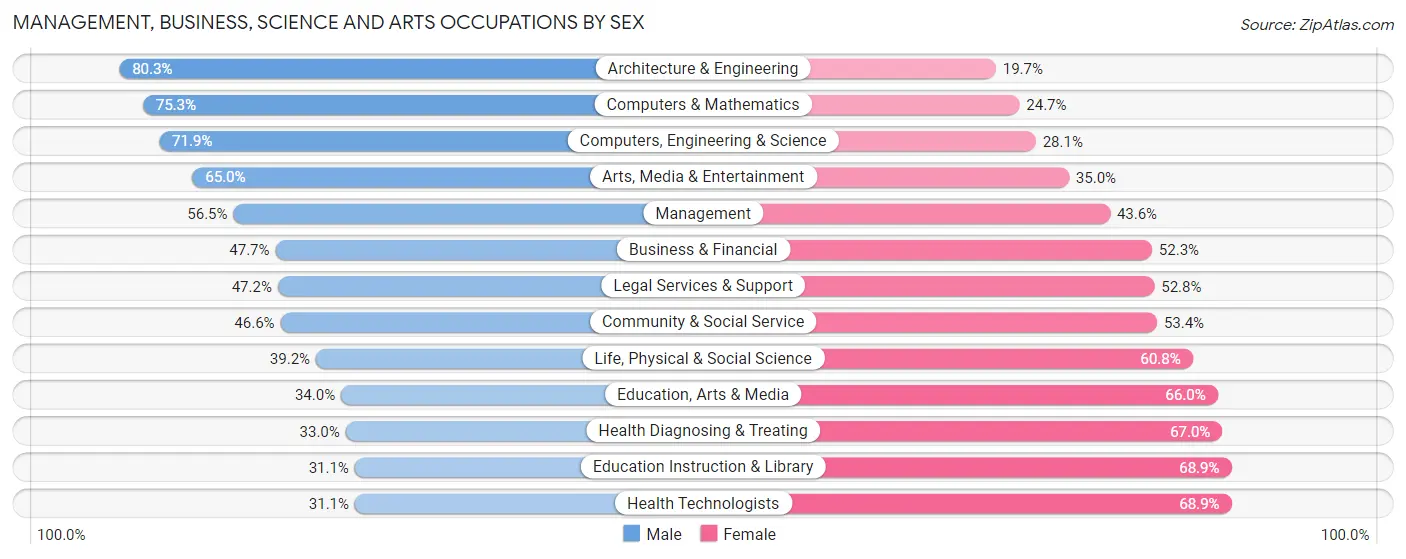
Management, Business, Science and Arts Occupations by Sex
Within the Management, Business, Science and Arts occupations in Area Code 747, the most male-oriented occupations are Architecture & Engineering (80.3%), Computers & Mathematics (75.3%), and Computers, Engineering & Science (71.9%), while the most female-oriented occupations are Health Technologists (68.9%), Education Instruction & Library (68.9%), and Health Diagnosing & Treating (67.0%).
| Occupation | Male | Female |
| Management | 21,466 (56.5%) | 16,563 (43.5%) |
| Business & Financial | 10,612 (47.7%) | 11,639 (52.3%) |
| Computers, Engineering & Science | 14,184 (71.9%) | 5,536 (28.1%) |
| Computers & Mathematics | 7,756 (75.3%) | 2,538 (24.7%) |
| Architecture & Engineering | 5,341 (80.3%) | 1,314 (19.7%) |
| Life, Physical & Social Science | 1,087 (39.2%) | 1,684 (60.8%) |
| Community & Social Service | 24,029 (46.6%) | 27,488 (53.4%) |
| Education, Arts & Media | 2,093 (34.0%) | 4,062 (66.0%) |
| Legal Services & Support | 3,023 (47.2%) | 3,383 (52.8%) |
| Education Instruction & Library | 5,896 (31.1%) | 13,036 (68.9%) |
| Arts, Media & Entertainment | 13,017 (65.0%) | 7,007 (35.0%) |
| Health Diagnosing & Treating | 6,723 (33.0%) | 13,627 (67.0%) |
| Health Technologists | 4,075 (31.1%) | 9,023 (68.9%) |
| Total (Category) | 77,014 (50.7%) | 74,853 (49.3%) |
| Total (Overall) | 199,634 (54.1%) | 169,169 (45.9%) |
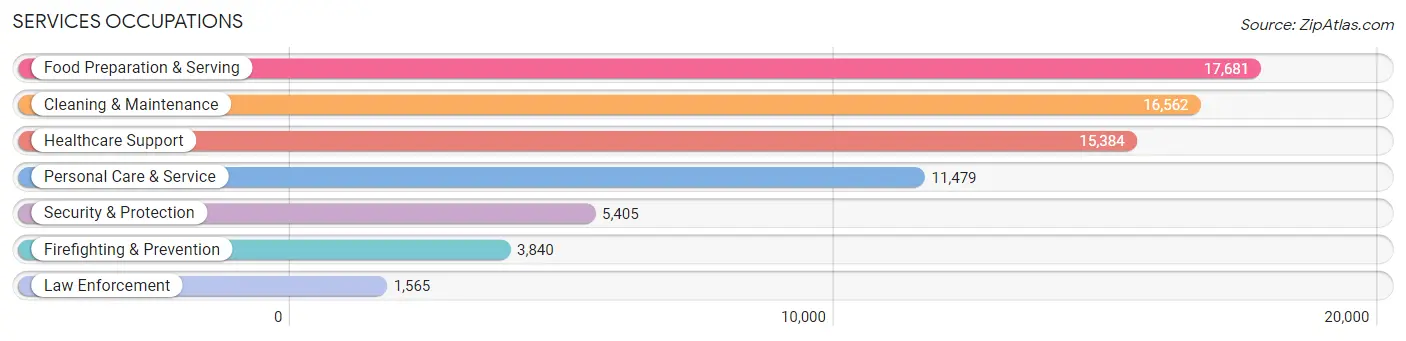
Services Occupations
The most common Services occupations in Area Code 747 are Food Preparation & Serving (17,681 | 4.8%), Cleaning & Maintenance (16,562 | 4.5%), Healthcare Support (15,384 | 4.2%), Personal Care & Service (11,479 | 3.1%), and Security & Protection (5,405 | 1.5%).
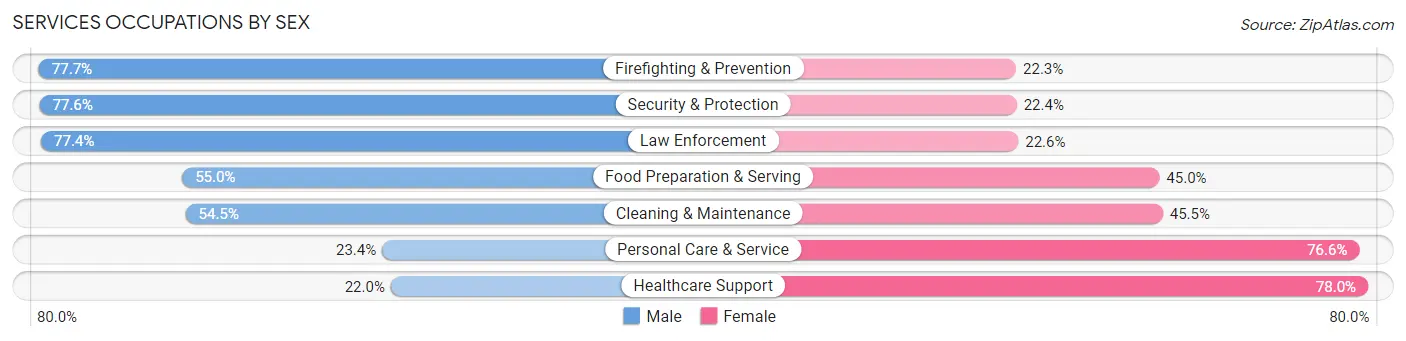
Services Occupations by Sex
Within the Services occupations in Area Code 747, the most male-oriented occupations are Firefighting & Prevention (77.7%), Security & Protection (77.6%), and Law Enforcement (77.4%), while the most female-oriented occupations are Healthcare Support (78.0%), Personal Care & Service (76.6%), and Cleaning & Maintenance (45.5%).
| Occupation | Male | Female |
| Healthcare Support | 3,384 (22.0%) | 12,000 (78.0%) |
| Security & Protection | 4,196 (77.6%) | 1,209 (22.4%) |
| Firefighting & Prevention | 2,985 (77.7%) | 855 (22.3%) |
| Law Enforcement | 1,211 (77.4%) | 354 (22.6%) |
| Food Preparation & Serving | 9,729 (55.0%) | 7,952 (45.0%) |
| Cleaning & Maintenance | 9,024 (54.5%) | 7,538 (45.5%) |
| Personal Care & Service | 2,684 (23.4%) | 8,795 (76.6%) |
| Total (Category) | 29,017 (43.6%) | 37,494 (56.4%) |
| Total (Overall) | 199,634 (54.1%) | 169,169 (45.9%) |
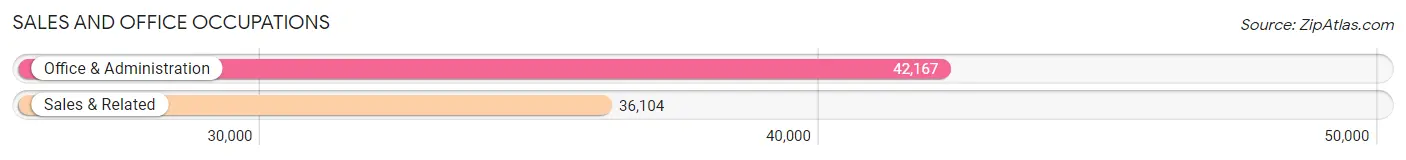
Sales and Office Occupations
The most common Sales and Office occupations in Area Code 747 are Office & Administration (42,167 | 11.4%), and Sales & Related (36,104 | 9.8%).
Sales and Office Occupations by Sex
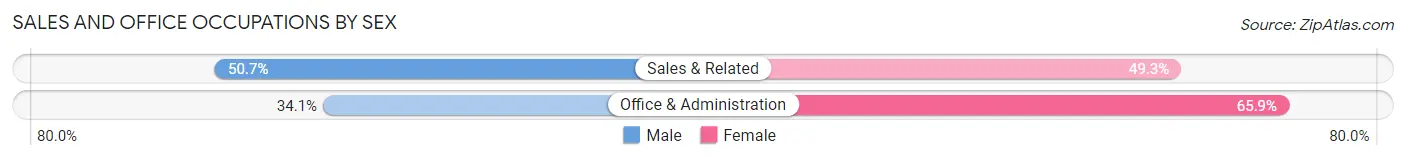
| Occupation | Male | Female |
| Sales & Related | 18,302 (50.7%) | 17,802 (49.3%) |
| Office & Administration | 14,384 (34.1%) | 27,783 (65.9%) |
| Total (Category) | 32,686 (41.8%) | 45,585 (58.2%) |
| Total (Overall) | 199,634 (54.1%) | 169,169 (45.9%) |
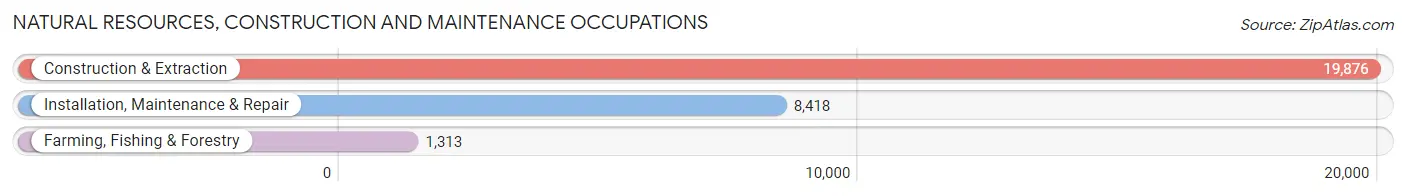
Natural Resources, Construction and Maintenance Occupations
The most common Natural Resources, Construction and Maintenance occupations in Area Code 747 are Construction & Extraction (19,876 | 5.4%), Installation, Maintenance & Repair (8,418 | 2.3%), and Farming, Fishing & Forestry (1,313 | 0.4%).
Natural Resources, Construction and Maintenance Occupations by Sex
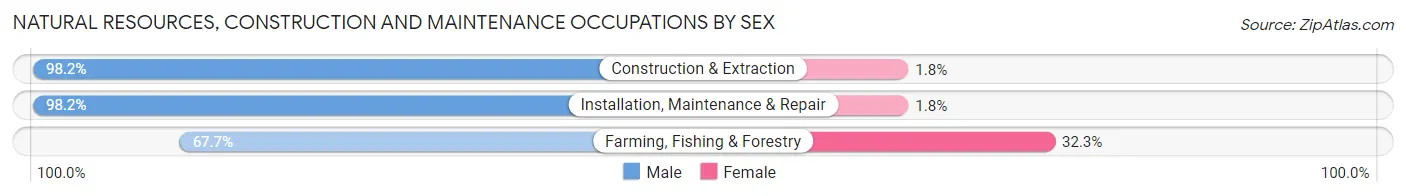
| Occupation | Male | Female |
| Farming, Fishing & Forestry | 889 (67.7%) | 424 (32.3%) |
| Construction & Extraction | 19,527 (98.2%) | 349 (1.8%) |
| Installation, Maintenance & Repair | 8,270 (98.2%) | 148 (1.8%) |
| Total (Category) | 28,686 (96.9%) | 921 (3.1%) |
| Total (Overall) | 199,634 (54.1%) | 169,169 (45.9%) |
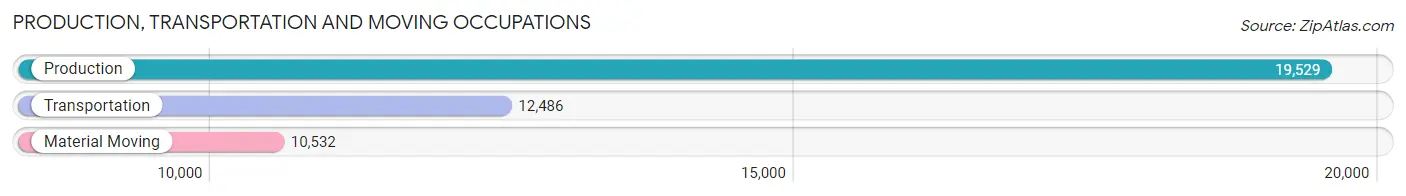
Production, Transportation and Moving Occupations
The most common Production, Transportation and Moving occupations in Area Code 747 are Production (19,529 | 5.3%), Transportation (12,486 | 3.4%), and Material Moving (10,532 | 2.9%).
Production, Transportation and Moving Occupations by Sex
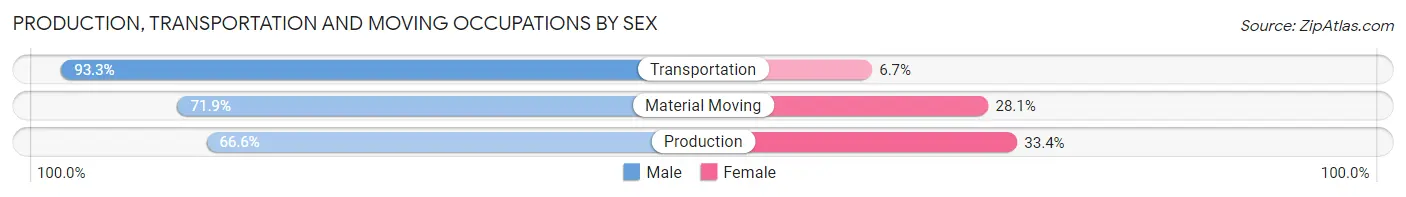
| Occupation | Male | Female |
| Production | 13,012 (66.6%) | 6,517 (33.4%) |
| Transportation | 11,644 (93.3%) | 842 (6.7%) |
| Material Moving | 7,575 (71.9%) | 2,957 (28.1%) |
| Total (Category) | 32,231 (75.7%) | 10,316 (24.2%) |
| Total (Overall) | 199,634 (54.1%) | 169,169 (45.9%) |
Employment Industries by Sex in Area Code 747
Employment Industries in Area Code 747
The major employment industries in Area Code 747 include Health Care & Social Assistance (52,089 | 14.1%), Retail Trade (36,930 | 10.0%), Professional & Scientific (31,264 | 8.5%), Manufacturing (30,297 | 8.2%), and Educational Services (28,248 | 7.7%).
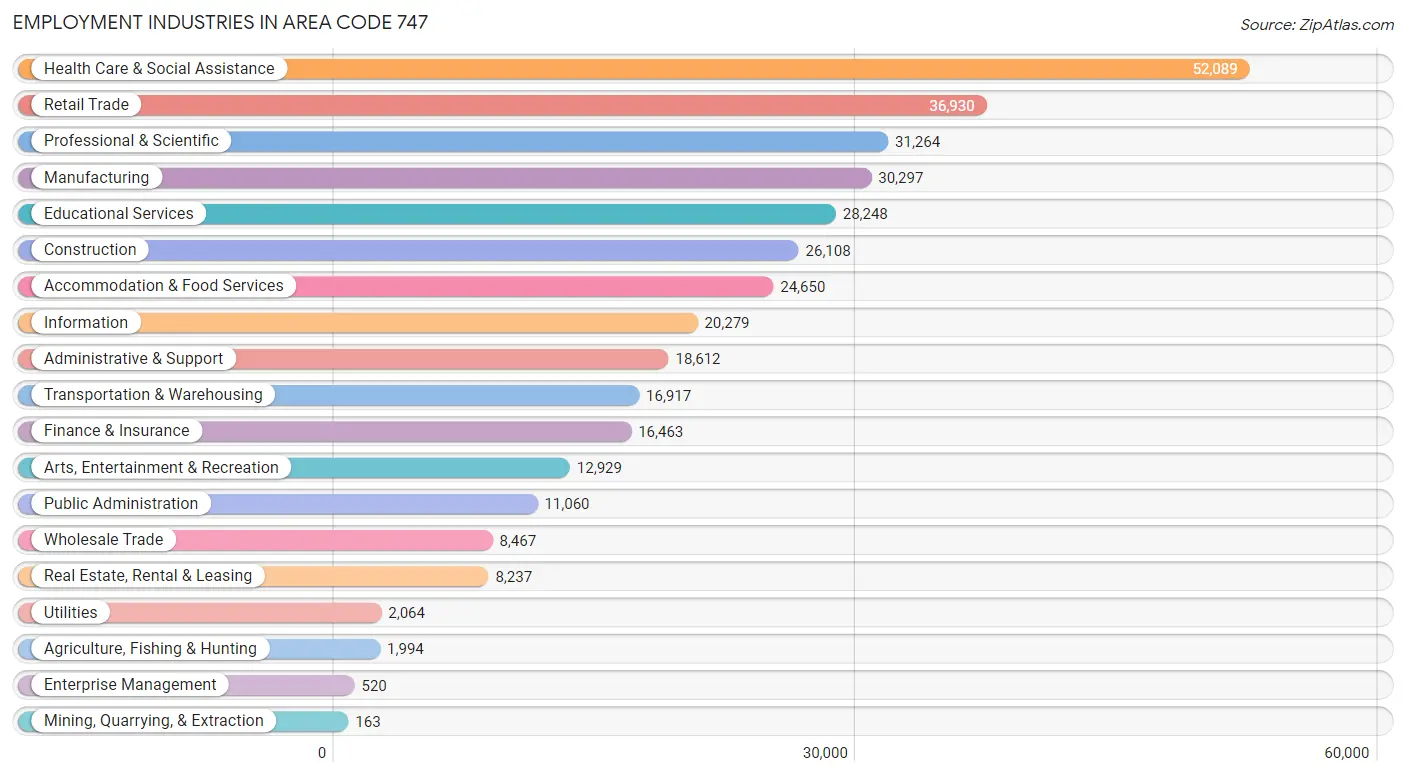
Employment Industries by Sex in Area Code 747
The Area Code 747 industries that see more men than women are Mining, Quarrying, & Extraction (100.0%), Construction (92.2%), and Transportation & Warehousing (77.8%), whereas the industries that tend to have a higher number of women are Health Care & Social Assistance (72.6%), Educational Services (64.0%), and Public Administration (52.0%).
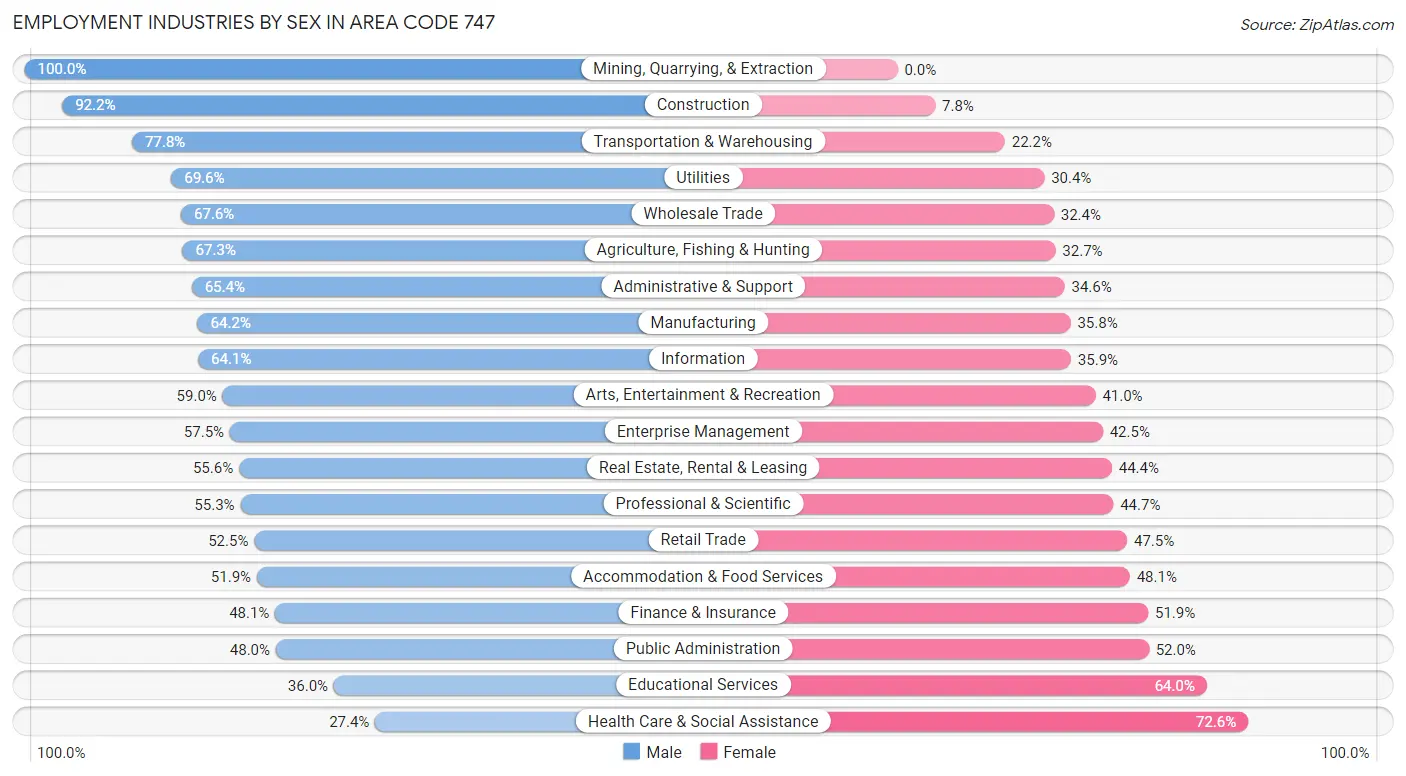
| Industry | Male | Female |
| Agriculture, Fishing & Hunting | 1,342 (67.3%) | 652 (32.7%) |
| Mining, Quarrying, & Extraction | 163 (100.0%) | 0 (0.0%) |
| Construction | 24,072 (92.2%) | 2,036 (7.8%) |
| Manufacturing | 19,444 (64.2%) | 10,853 (35.8%) |
| Wholesale Trade | 5,726 (67.6%) | 2,741 (32.4%) |
| Retail Trade | 19,379 (52.5%) | 17,551 (47.5%) |
| Transportation & Warehousing | 13,156 (77.8%) | 3,761 (22.2%) |
| Utilities | 1,437 (69.6%) | 627 (30.4%) |
| Information | 12,996 (64.1%) | 7,283 (35.9%) |
| Finance & Insurance | 7,924 (48.1%) | 8,539 (51.9%) |
| Real Estate, Rental & Leasing | 4,582 (55.6%) | 3,655 (44.4%) |
| Professional & Scientific | 17,298 (55.3%) | 13,966 (44.7%) |
| Enterprise Management | 299 (57.5%) | 221 (42.5%) |
| Administrative & Support | 12,174 (65.4%) | 6,438 (34.6%) |
| Educational Services | 10,165 (36.0%) | 18,083 (64.0%) |
| Health Care & Social Assistance | 14,288 (27.4%) | 37,801 (72.6%) |
| Arts, Entertainment & Recreation | 7,630 (59.0%) | 5,299 (41.0%) |
| Accommodation & Food Services | 12,798 (51.9%) | 11,852 (48.1%) |
| Public Administration | 5,308 (48.0%) | 5,752 (52.0%) |
| Total | 199,634 (54.1%) | 169,169 (45.9%) |
Education in Area Code 747
School Enrollment in Area Code 747
The most common levels of schooling among the 180,927 students in Area Code 747 are college / undergraduate (46,489 | 25.7%), high school (38,273 | 21.1%), and elementary school (33,302 | 18.4%).
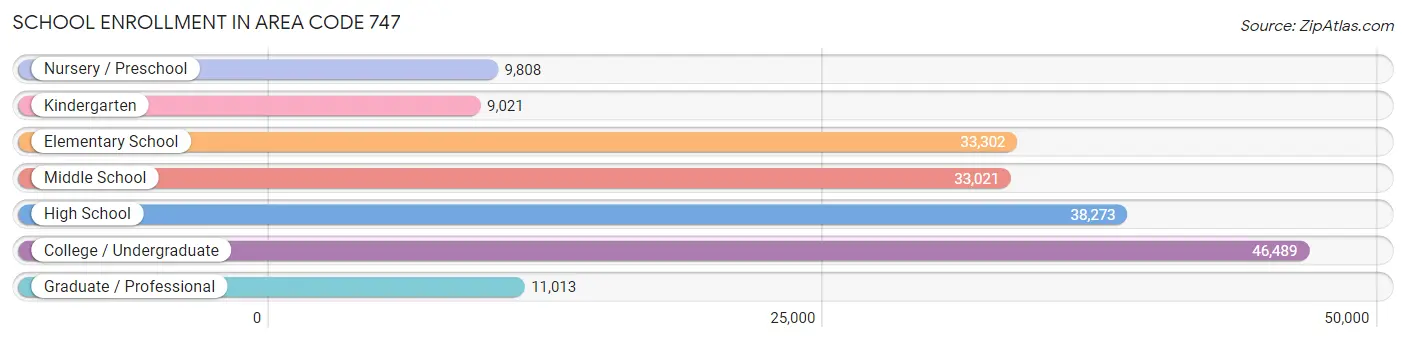
| School Level | # Students | % Students |
| Nursery / Preschool | 9,808 | 5.4% |
| Kindergarten | 9,021 | 5.0% |
| Elementary School | 33,302 | 18.4% |
| Middle School | 33,021 | 18.2% |
| High School | 38,273 | 21.1% |
| College / Undergraduate | 46,489 | 25.7% |
| Graduate / Professional | 11,013 | 6.1% |
| Total | 180,927 | 100.0% |
School Enrollment by Age by Funding Source in Area Code 747
Out of a total of 180,927 students who are enrolled in schools in Area Code 747, 29,956 (16.6%) attend a private institution, while the remaining 150,971 (83.4%) are enrolled in public schools. The age group of 3 to 4 year olds has the highest likelihood of being enrolled in private schools, with 4,163 (46.6% in the age bracket) enrolled. Conversely, the age group of 18 to 19 year olds has the lowest likelihood of being enrolled in a private school, with 12,444 (89.5% in the age bracket) attending a public institution.
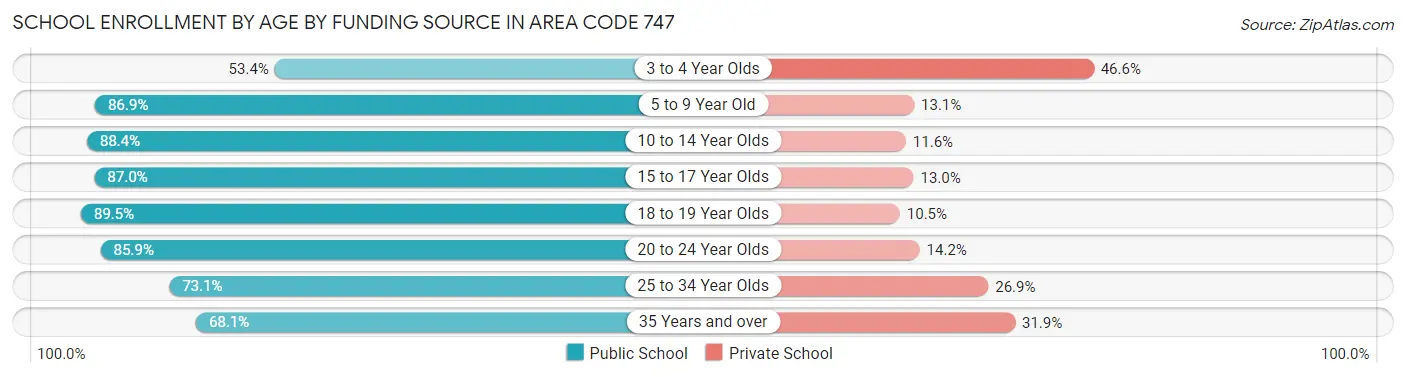
| Age Bracket | Public School | Private School |
| 3 to 4 Year Olds | 4,775 (53.4%) | 4,163 (46.6%) |
| 5 to 9 Year Old | 33,999 (86.9%) | 5,134 (13.1%) |
| 10 to 14 Year Olds | 38,048 (88.4%) | 4,986 (11.6%) |
| 15 to 17 Year Olds | 23,023 (87.0%) | 3,442 (13.0%) |
| 18 to 19 Year Olds | 12,444 (89.5%) | 1,455 (10.5%) |
| 20 to 24 Year Olds | 20,032 (85.9%) | 3,303 (14.1%) |
| 25 to 34 Year Olds | 12,232 (73.1%) | 4,511 (26.9%) |
| 35 Years and over | 6,386 (68.1%) | 2,994 (31.9%) |
| Total | 150,971 (83.4%) | 29,956 (16.6%) |
Educational Attainment by Field of Study in Area Code 747
Business (35,646 | 17.9%), social sciences (21,874 | 11.0%), visual & performing arts (18,657 | 9.3%), science & technology (16,749 | 8.4%), and communications (15,001 | 7.5%) are the most common fields of study among 199,510 individuals in Area Code 747 who have obtained a bachelor's degree or higher.
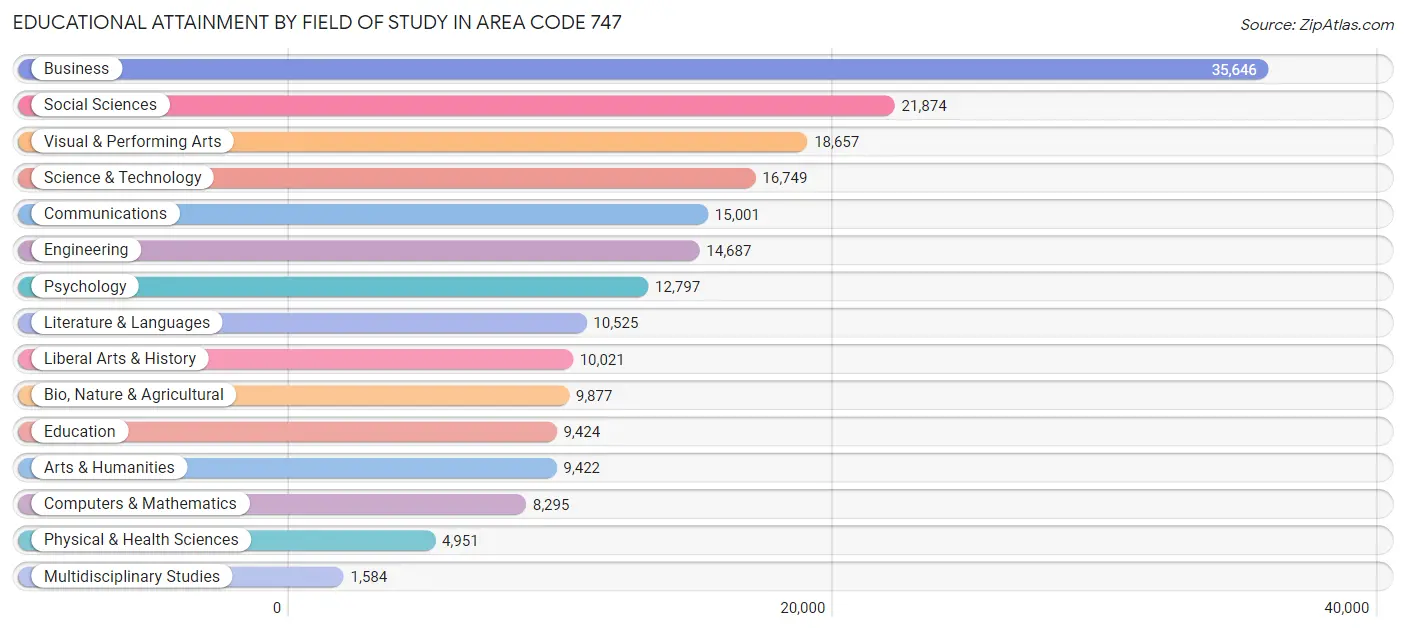
| Field of Study | # Graduates | % Graduates |
| Computers & Mathematics | 8,295 | 4.2% |
| Bio, Nature & Agricultural | 9,877 | 5.0% |
| Physical & Health Sciences | 4,951 | 2.5% |
| Psychology | 12,797 | 6.4% |
| Social Sciences | 21,874 | 11.0% |
| Engineering | 14,687 | 7.4% |
| Multidisciplinary Studies | 1,584 | 0.8% |
| Science & Technology | 16,749 | 8.4% |
| Business | 35,646 | 17.9% |
| Education | 9,424 | 4.7% |
| Literature & Languages | 10,525 | 5.3% |
| Liberal Arts & History | 10,021 | 5.0% |
| Visual & Performing Arts | 18,657 | 9.3% |
| Communications | 15,001 | 7.5% |
| Arts & Humanities | 9,422 | 4.7% |
| Total | 199,510 | 100.0% |
Transportation & Commute in Area Code 747
Vehicle Availability by Sex in Area Code 747
The most prevalent vehicle ownership categories in Area Code 747 are males with 2 vehicles (71,909, accounting for 37.0%) and females with 2 vehicles (60,302, making up 43.9%).
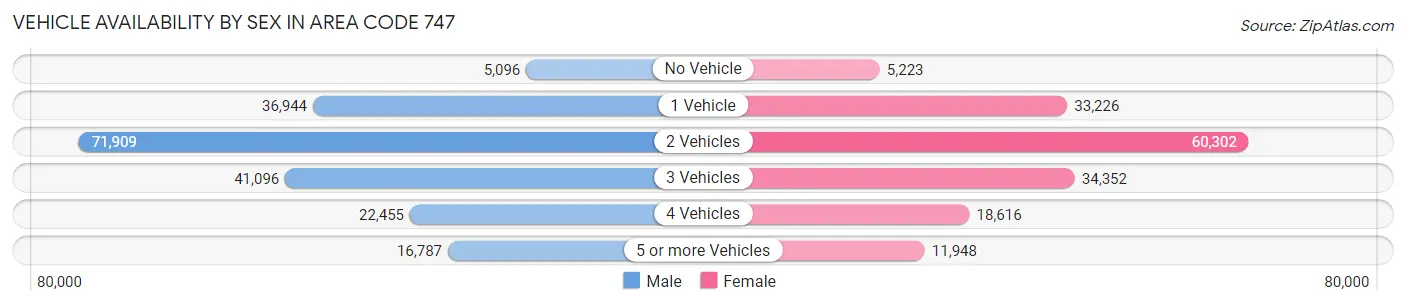
| Vehicles Available | Male | Female |
| No Vehicle | 5,096 (2.6%) | 5,223 (3.2%) |
| 1 Vehicle | 36,944 (19.0%) | 33,226 (20.3%) |
| 2 Vehicles | 71,909 (37.0%) | 60,302 (36.8%) |
| 3 Vehicles | 41,096 (21.1%) | 34,352 (21.0%) |
| 4 Vehicles | 22,455 (11.6%) | 18,616 (11.4%) |
| 5 or more Vehicles | 16,787 (8.6%) | 11,948 (7.3%) |
| Total | 194,287 (100.0%) | 163,667 (100.0%) |
Commute Time in Area Code 747
The most frequently occuring commute durations in Area Code 747 are 30 to 34 minutes (51,864 commuters, 16.9%), 15 to 19 minutes (43,888 commuters, 14.3%), and 20 to 24 minutes (41,618 commuters, 13.6%).
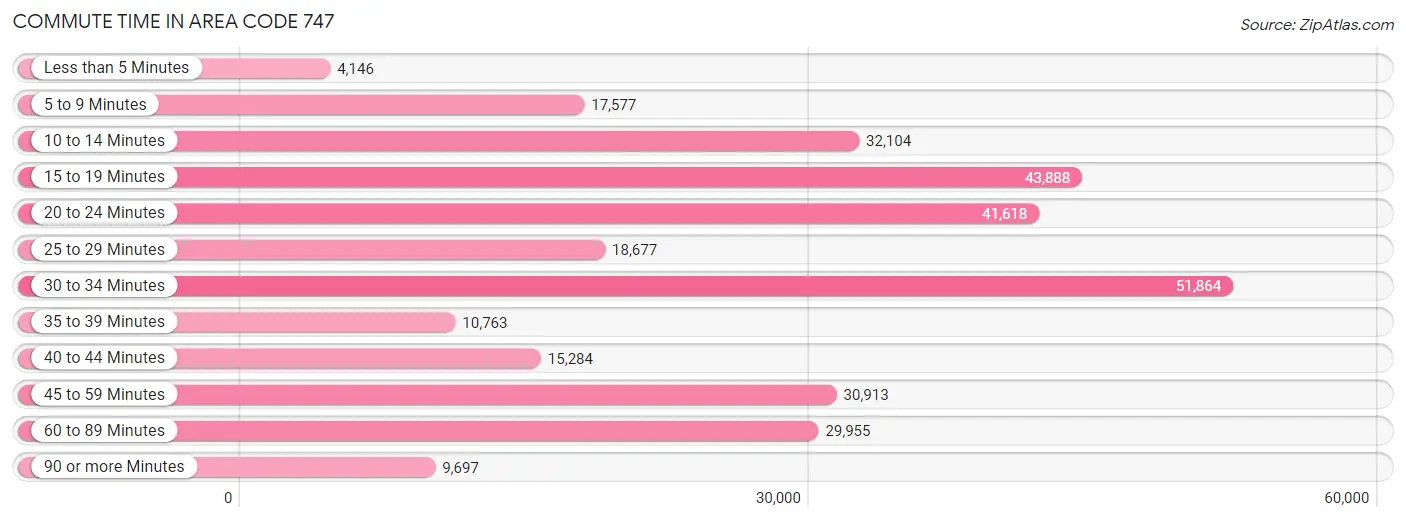
| Commute Time | # Commuters | % Commuters |
| Less than 5 Minutes | 4,146 | 1.3% |
| 5 to 9 Minutes | 17,577 | 5.7% |
| 10 to 14 Minutes | 32,104 | 10.5% |
| 15 to 19 Minutes | 43,888 | 14.3% |
| 20 to 24 Minutes | 41,618 | 13.6% |
| 25 to 29 Minutes | 18,677 | 6.1% |
| 30 to 34 Minutes | 51,864 | 16.9% |
| 35 to 39 Minutes | 10,763 | 3.5% |
| 40 to 44 Minutes | 15,284 | 5.0% |
| 45 to 59 Minutes | 30,913 | 10.1% |
| 60 to 89 Minutes | 29,955 | 9.8% |
| 90 or more Minutes | 9,697 | 3.2% |
Commute Time by Sex in Area Code 747
The most common commute times in Area Code 747 are 30 to 34 minutes (30,353 commuters, 18.0%) for males and 30 to 34 minutes (21,511 commuters, 15.6%) for females.
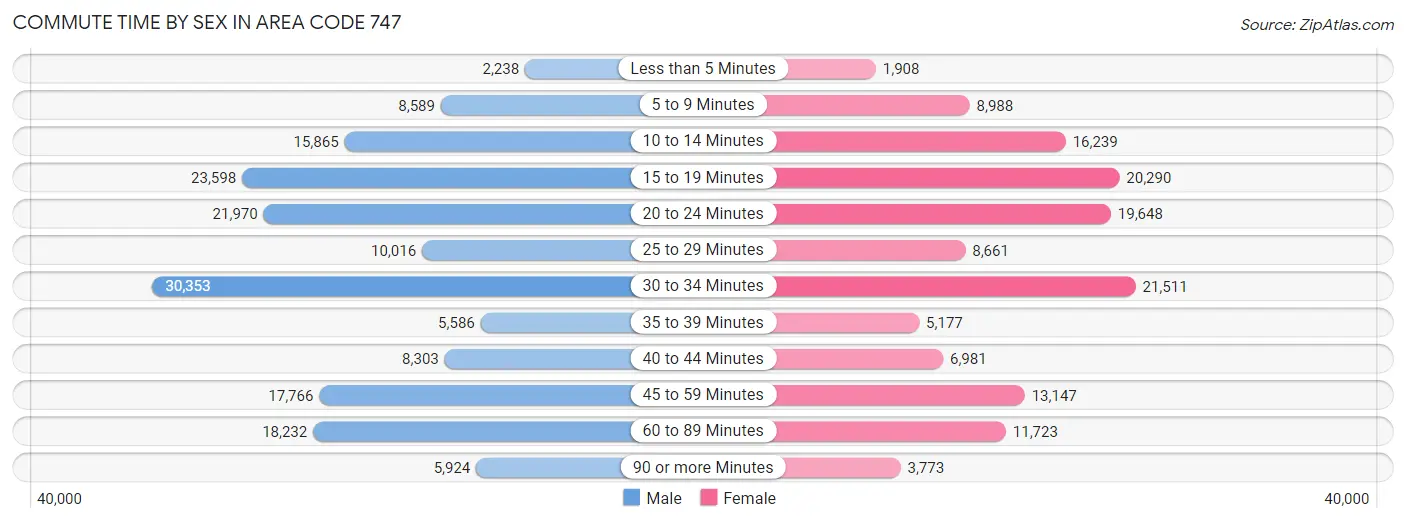
| Commute Time | Male | Female |
| Less than 5 Minutes | 2,238 (1.3%) | 1,908 (1.4%) |
| 5 to 9 Minutes | 8,589 (5.1%) | 8,988 (6.5%) |
| 10 to 14 Minutes | 15,865 (9.4%) | 16,239 (11.8%) |
| 15 to 19 Minutes | 23,598 (14.0%) | 20,290 (14.7%) |
| 20 to 24 Minutes | 21,970 (13.0%) | 19,648 (14.2%) |
| 25 to 29 Minutes | 10,016 (5.9%) | 8,661 (6.3%) |
| 30 to 34 Minutes | 30,353 (18.0%) | 21,511 (15.6%) |
| 35 to 39 Minutes | 5,586 (3.3%) | 5,177 (3.7%) |
| 40 to 44 Minutes | 8,303 (4.9%) | 6,981 (5.1%) |
| 45 to 59 Minutes | 17,766 (10.5%) | 13,147 (9.5%) |
| 60 to 89 Minutes | 18,232 (10.8%) | 11,723 (8.5%) |
| 90 or more Minutes | 5,924 (3.5%) | 3,773 (2.7%) |
Time of Departure to Work by Sex in Area Code 747
The most frequent times of departure to work in Area Code 747 are 7:00 AM to 7:29 AM (22,785, 13.5%) for males and 7:00 AM to 7:29 AM (21,086, 15.3%) for females.
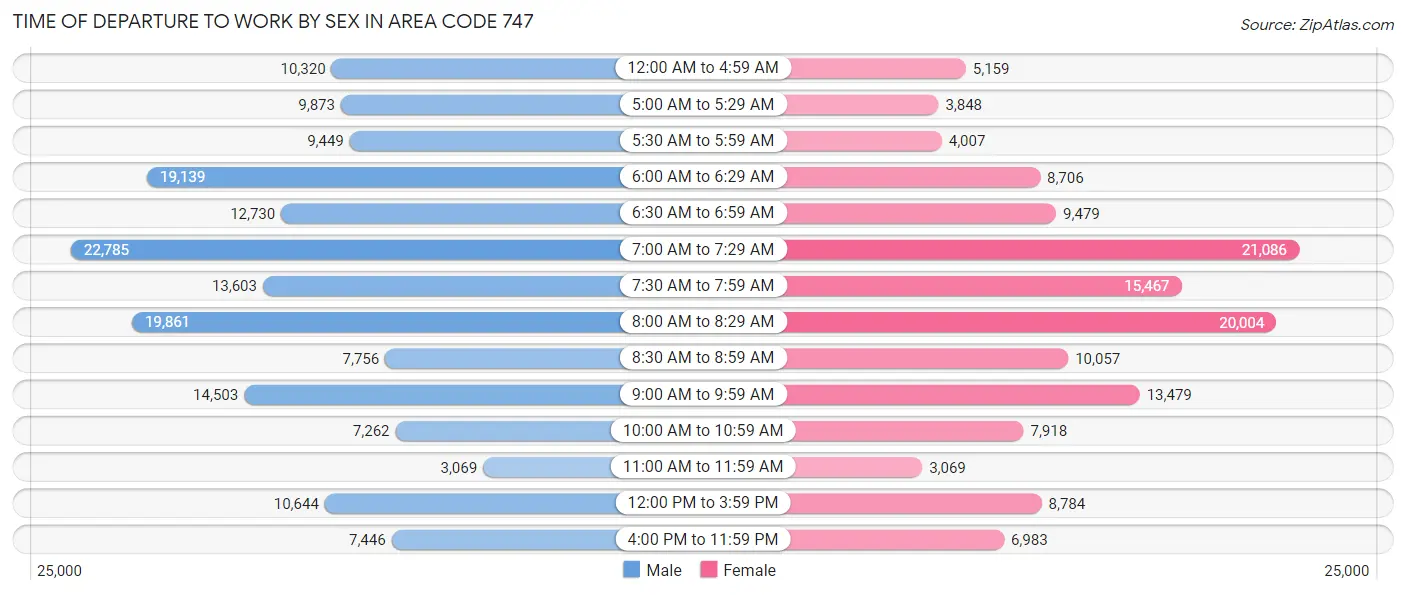
| Time of Departure | Male | Female |
| 12:00 AM to 4:59 AM | 10,320 (6.1%) | 5,159 (3.7%) |
| 5:00 AM to 5:29 AM | 9,873 (5.9%) | 3,848 (2.8%) |
| 5:30 AM to 5:59 AM | 9,449 (5.6%) | 4,007 (2.9%) |
| 6:00 AM to 6:29 AM | 19,139 (11.4%) | 8,706 (6.3%) |
| 6:30 AM to 6:59 AM | 12,730 (7.6%) | 9,479 (6.9%) |
| 7:00 AM to 7:29 AM | 22,785 (13.5%) | 21,086 (15.3%) |
| 7:30 AM to 7:59 AM | 13,603 (8.1%) | 15,467 (11.2%) |
| 8:00 AM to 8:29 AM | 19,861 (11.8%) | 20,004 (14.5%) |
| 8:30 AM to 8:59 AM | 7,756 (4.6%) | 10,057 (7.3%) |
| 9:00 AM to 9:59 AM | 14,503 (8.6%) | 13,479 (9.8%) |
| 10:00 AM to 10:59 AM | 7,262 (4.3%) | 7,918 (5.7%) |
| 11:00 AM to 11:59 AM | 3,069 (1.8%) | 3,069 (2.2%) |
| 12:00 PM to 3:59 PM | 10,644 (6.3%) | 8,784 (6.4%) |
| 4:00 PM to 11:59 PM | 7,446 (4.4%) | 6,983 (5.1%) |
| Total | 168,440 (100.0%) | 138,046 (100.0%) |
Housing Occupancy in Area Code 747
Occupancy by Ownership in Area Code 747
Of the total 244,000 dwellings in Area Code 747, owner-occupied units account for 121,621 (49.8%), while renter-occupied units make up 122,379 (50.2%).
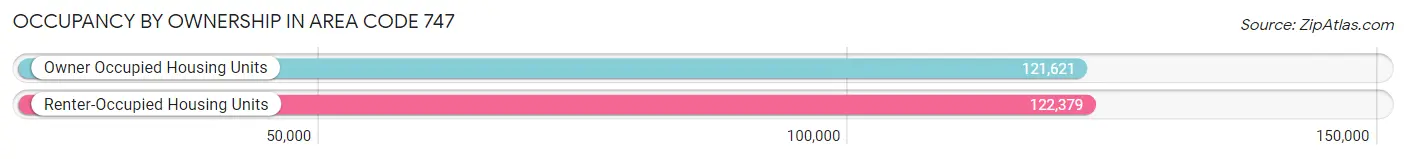
| Occupancy | # Housing Units | % Housing Units |
| Owner Occupied Housing Units | 121,621 | 49.8% |
| Renter-Occupied Housing Units | 122,379 | 50.2% |
| Total Occupied Housing Units | 244,000 | 100.0% |
Occupancy by Household Size in Area Code 747
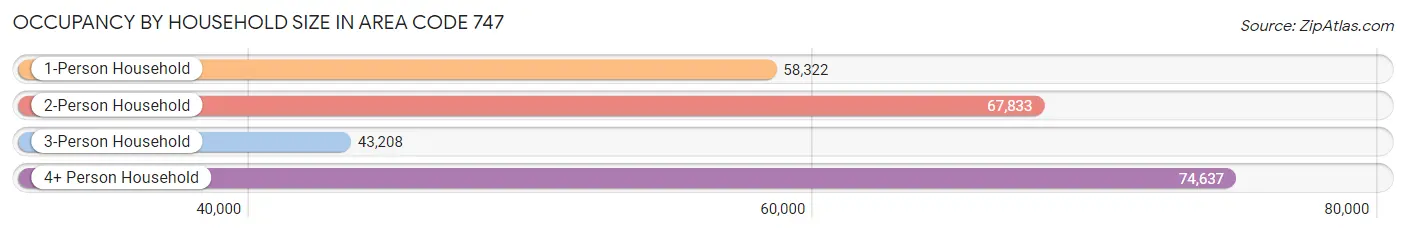
| Household Size | # Housing Units | % Housing Units |
| 1-Person Household | 58,322 | 23.9% |
| 2-Person Household | 67,833 | 27.8% |
| 3-Person Household | 43,208 | 17.7% |
| 4+ Person Household | 74,637 | 30.6% |
| Total Housing Units | 244,000 | 100.0% |
Occupancy by Ownership by Household Size in Area Code 747
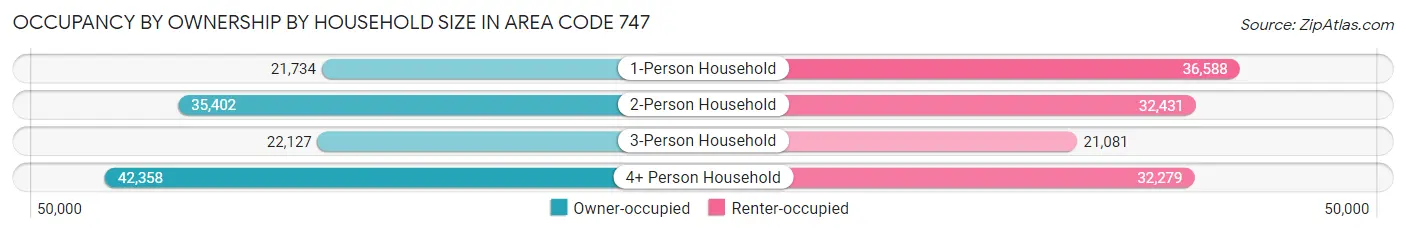
| Household Size | Owner-occupied | Renter-occupied |
| 1-Person Household | 21,734 (37.3%) | 36,588 (62.7%) |
| 2-Person Household | 35,402 (52.2%) | 32,431 (47.8%) |
| 3-Person Household | 22,127 (51.2%) | 21,081 (48.8%) |
| 4+ Person Household | 42,358 (56.8%) | 32,279 (43.2%) |
| Total Housing Units | 121,621 (49.8%) | 122,379 (50.2%) |
Occupancy by Educational Attainment in Area Code 747
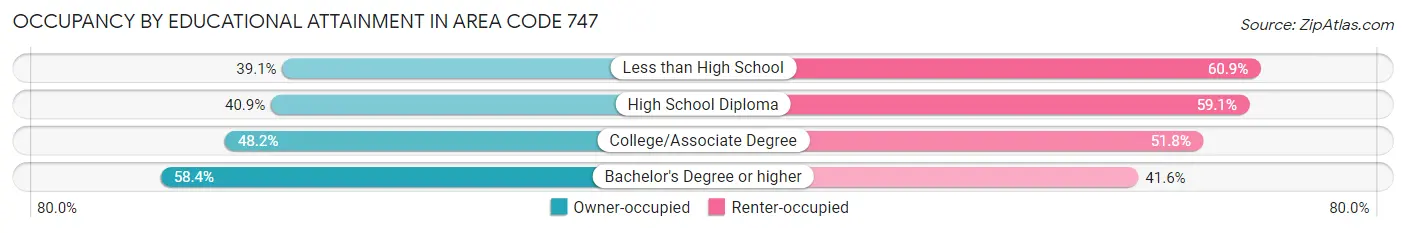
| Household Size | Owner-occupied | Renter-occupied |
| Less than High School | 14,624 (39.1%) | 22,764 (60.9%) |
| High School Diploma | 16,574 (40.9%) | 23,937 (59.1%) |
| College/Associate Degree | 31,160 (48.2%) | 33,474 (51.8%) |
| Bachelor's Degree or higher | 59,263 (58.4%) | 42,204 (41.6%) |
Occupancy by Age of Householder in Area Code 747
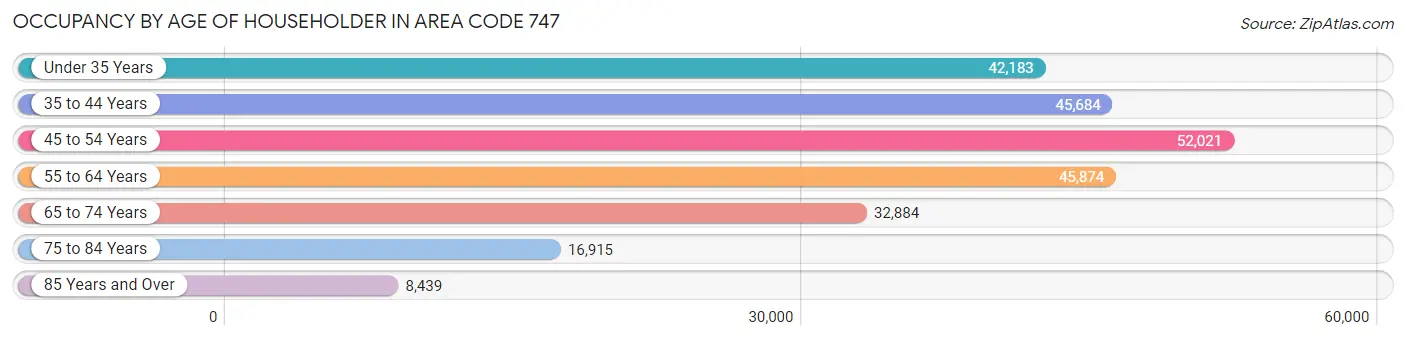
| Age Bracket | # Households | % Households |
| Under 35 Years | 42,183 | 17.3% |
| 35 to 44 Years | 45,684 | 18.7% |
| 45 to 54 Years | 52,021 | 21.3% |
| 55 to 64 Years | 45,874 | 18.8% |
| 65 to 74 Years | 32,884 | 13.5% |
| 75 to 84 Years | 16,915 | 6.9% |
| 85 Years and Over | 8,439 | 3.5% |
| Total | 244,000 | 100.0% |
Housing Finances in Area Code 747
Median Income by Occupancy in Area Code 747
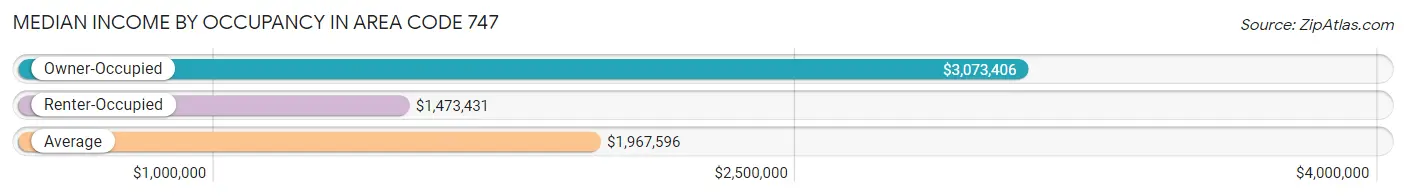
| Occupancy Type | # Households | Median Income |
| Owner-Occupied | 121,621 (49.8%) | $3,073,406 |
| Renter-Occupied | 122,379 (50.2%) | $1,473,431 |
| Average | 244,000 (100.0%) | $1,967,596 |
Occupancy by Householder Income Bracket in Area Code 747
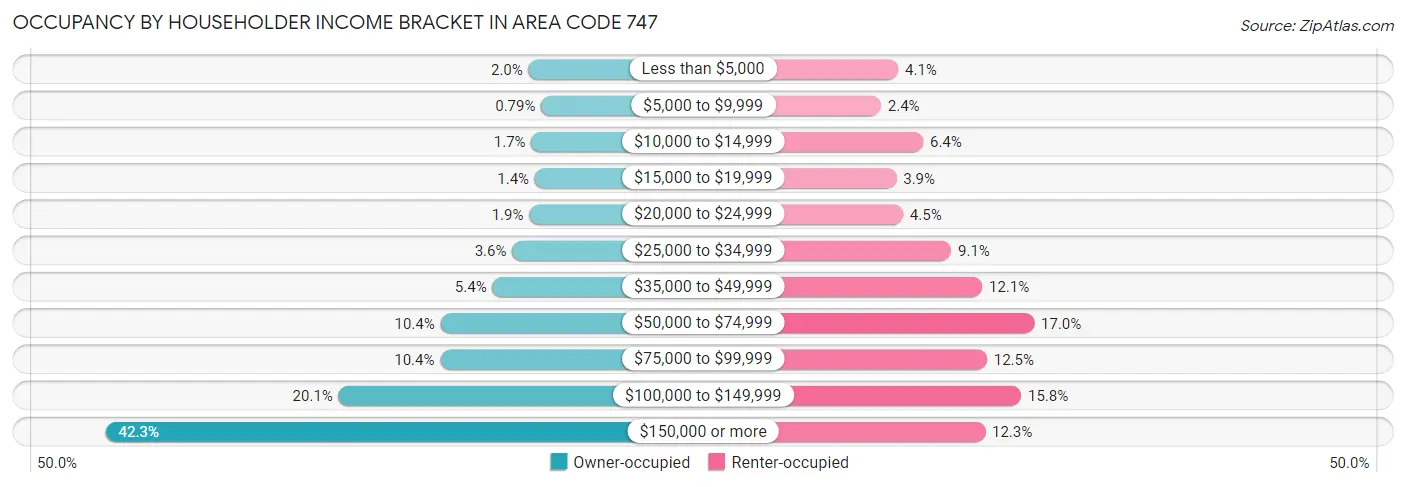
| Income Bracket | Owner-occupied | Renter-occupied |
| Less than $5,000 | 2,429 (2.0%) | 4,956 (4.1%) |
| $5,000 to $9,999 | 955 (0.8%) | 2,950 (2.4%) |
| $10,000 to $14,999 | 2,101 (1.7%) | 7,863 (6.4%) |
| $15,000 to $19,999 | 1,701 (1.4%) | 4,743 (3.9%) |
| $20,000 to $24,999 | 2,347 (1.9%) | 5,516 (4.5%) |
| $25,000 to $34,999 | 4,320 (3.5%) | 11,134 (9.1%) |
| $35,000 to $49,999 | 6,614 (5.4%) | 14,747 (12.0%) |
| $50,000 to $74,999 | 12,638 (10.4%) | 20,799 (17.0%) |
| $75,000 to $99,999 | 12,656 (10.4%) | 15,296 (12.5%) |
| $100,000 to $149,999 | 24,436 (20.1%) | 19,287 (15.8%) |
| $150,000 or more | 51,424 (42.3%) | 15,088 (12.3%) |
| Total | 121,621 (100.0%) | 122,379 (100.0%) |
Monthly Housing Cost Tiers in Area Code 747
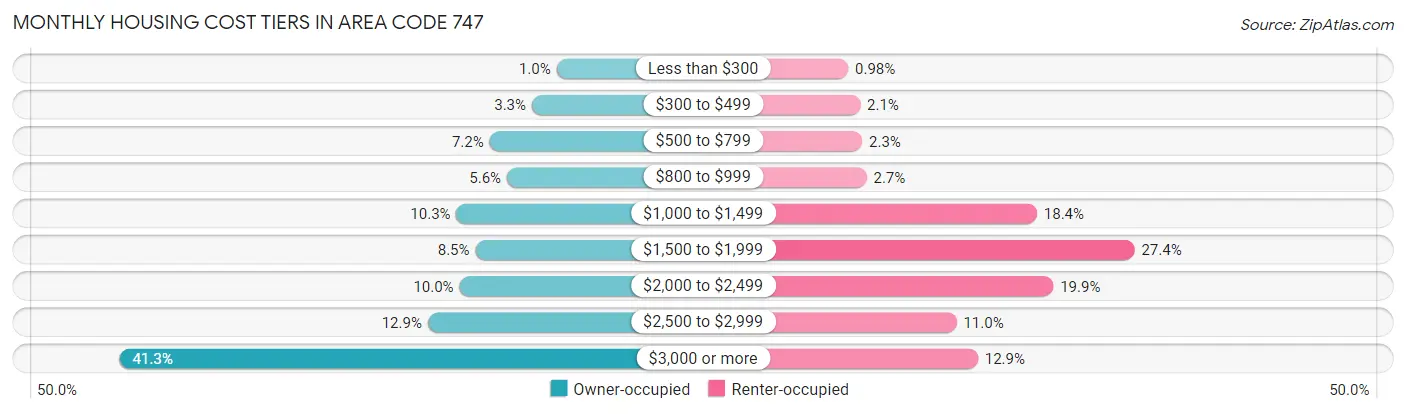
| Monthly Cost | Owner-occupied | Renter-occupied |
| Less than $300 | 1,258 (1.0%) | 1,203 (1.0%) |
| $300 to $499 | 4,010 (3.3%) | 2,552 (2.1%) |
| $500 to $799 | 8,756 (7.2%) | 2,782 (2.3%) |
| $800 to $999 | 6,813 (5.6%) | 3,275 (2.7%) |
| $1,000 to $1,499 | 12,471 (10.2%) | 22,474 (18.4%) |
| $1,500 to $1,999 | 10,333 (8.5%) | 33,471 (27.4%) |
| $2,000 to $2,499 | 12,122 (10.0%) | 24,314 (19.9%) |
| $2,500 to $2,999 | 15,682 (12.9%) | 13,415 (11.0%) |
| $3,000 or more | 50,176 (41.3%) | 15,811 (12.9%) |
| Total | 121,621 (100.0%) | 122,379 (100.0%) |
Physical Housing Characteristics in Area Code 747
Housing Structures in Area Code 747
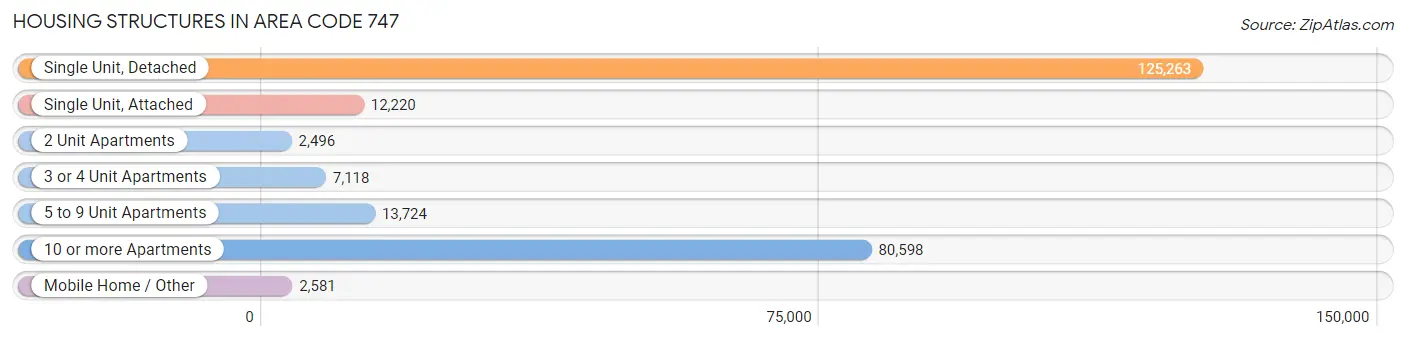
| Structure Type | # Housing Units | % Housing Units |
| Single Unit, Detached | 125,263 | 51.3% |
| Single Unit, Attached | 12,220 | 5.0% |
| 2 Unit Apartments | 2,496 | 1.0% |
| 3 or 4 Unit Apartments | 7,118 | 2.9% |
| 5 to 9 Unit Apartments | 13,724 | 5.6% |
| 10 or more Apartments | 80,598 | 33.0% |
| Mobile Home / Other | 2,581 | 1.1% |
| Total | 244,000 | 100.0% |
Housing Structures by Occupancy in Area Code 747
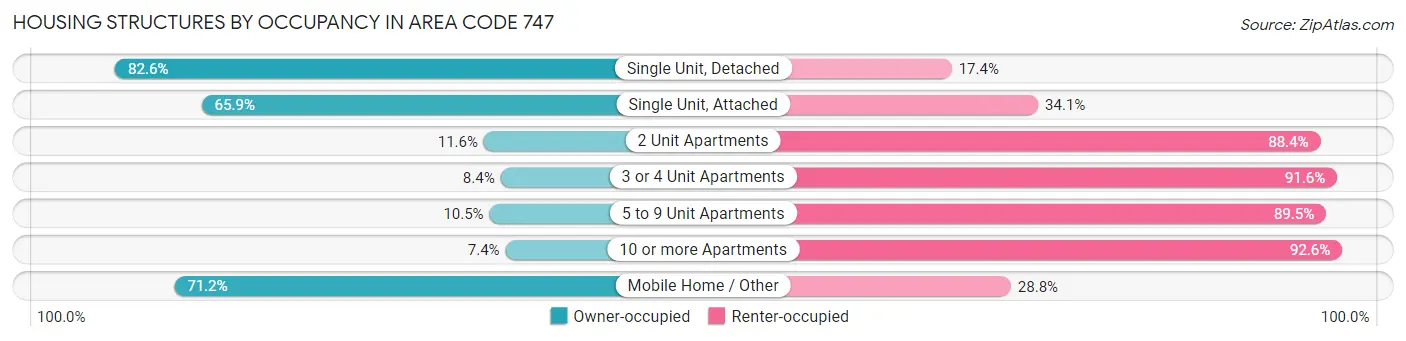
| Structure Type | Owner-occupied | Renter-occupied |
| Single Unit, Detached | 103,423 (82.6%) | 21,840 (17.4%) |
| Single Unit, Attached | 8,056 (65.9%) | 4,164 (34.1%) |
| 2 Unit Apartments | 289 (11.6%) | 2,207 (88.4%) |
| 3 or 4 Unit Apartments | 596 (8.4%) | 6,522 (91.6%) |
| 5 to 9 Unit Apartments | 1,441 (10.5%) | 12,283 (89.5%) |
| 10 or more Apartments | 5,979 (7.4%) | 74,619 (92.6%) |
| Mobile Home / Other | 1,837 (71.2%) | 744 (28.8%) |
| Total | 121,621 (49.8%) | 122,379 (50.2%) |
Housing Structures by Number of Rooms in Area Code 747
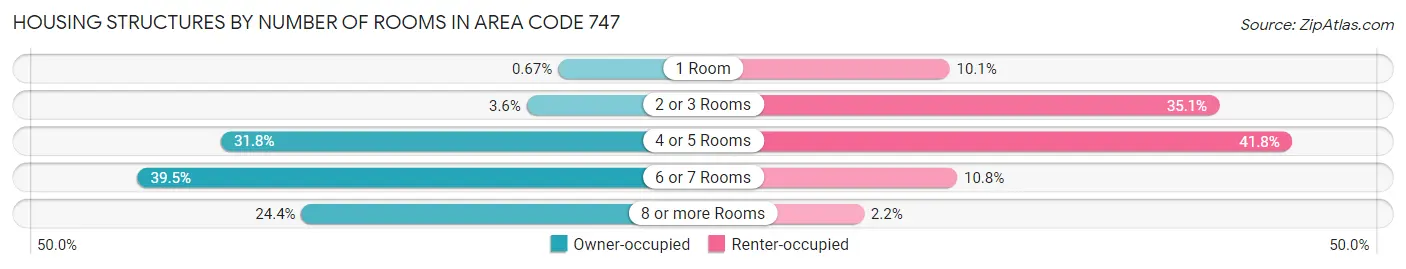
| Number of Rooms | Owner-occupied | Renter-occupied |
| 1 Room | 812 (0.7%) | 12,405 (10.1%) |
| 2 or 3 Rooms | 4,337 (3.6%) | 42,889 (35.0%) |
| 4 or 5 Rooms | 38,707 (31.8%) | 51,120 (41.8%) |
| 6 or 7 Rooms | 48,087 (39.5%) | 13,248 (10.8%) |
| 8 or more Rooms | 29,678 (24.4%) | 2,717 (2.2%) |
| Total | 121,621 (100.0%) | 122,379 (100.0%) |
Housing Structure by Heating Type in Area Code 747
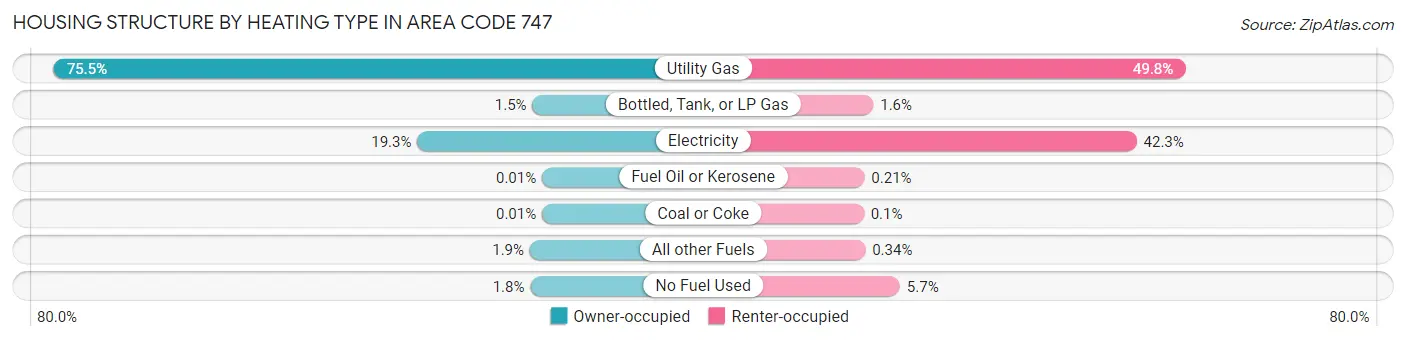
| Heating Type | Owner-occupied | Renter-occupied |
| Utility Gas | 91,812 (75.5%) | 60,925 (49.8%) |
| Bottled, Tank, or LP Gas | 1,814 (1.5%) | 1,938 (1.6%) |
| Electricity | 23,457 (19.3%) | 51,758 (42.3%) |
| Fuel Oil or Kerosene | 15 (0.0%) | 254 (0.2%) |
| Coal or Coke | 8 (0.0%) | 117 (0.1%) |
| All other Fuels | 2,296 (1.9%) | 411 (0.3%) |
| No Fuel Used | 2,219 (1.8%) | 6,976 (5.7%) |
| Total | 121,621 (100.0%) | 122,379 (100.0%) |
Household Vehicle Usage in Area Code 747
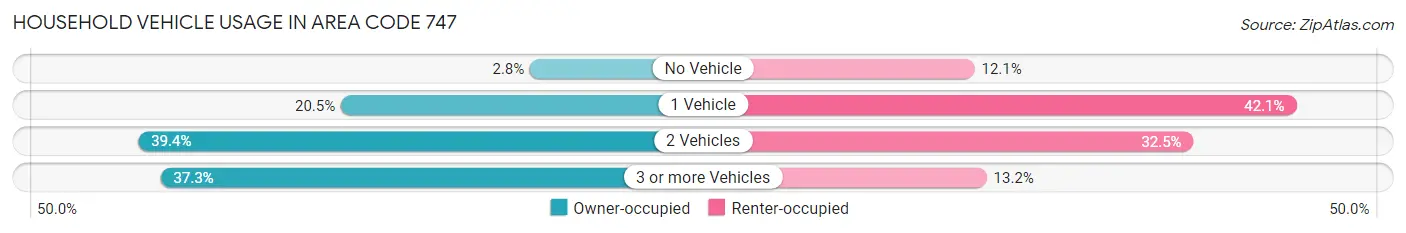
| Vehicles per Household | Owner-occupied | Renter-occupied |
| No Vehicle | 3,420 (2.8%) | 14,804 (12.1%) |
| 1 Vehicle | 24,881 (20.5%) | 51,569 (42.1%) |
| 2 Vehicles | 47,926 (39.4%) | 39,812 (32.5%) |
| 3 or more Vehicles | 45,394 (37.3%) | 16,194 (13.2%) |
| Total | 121,621 (100.0%) | 122,379 (100.0%) |
Real Estate & Mortgages in Area Code 747
Real Estate and Mortgage Overview in Area Code 747
| Characteristic | Without Mortgage | With Mortgage |
| Housing Units | 33,559 | 88,062 |
| Median Property Value | $17,694,100 | $18,965,200 |
| Median Household Income | $1,936,486 | $41,421 |
| Monthly Housing Costs | $19,314 | $49,730 |
| Real Estate Taxes | $83,848 | $1,349 |
Property Value by Mortgage Status in Area Code 747
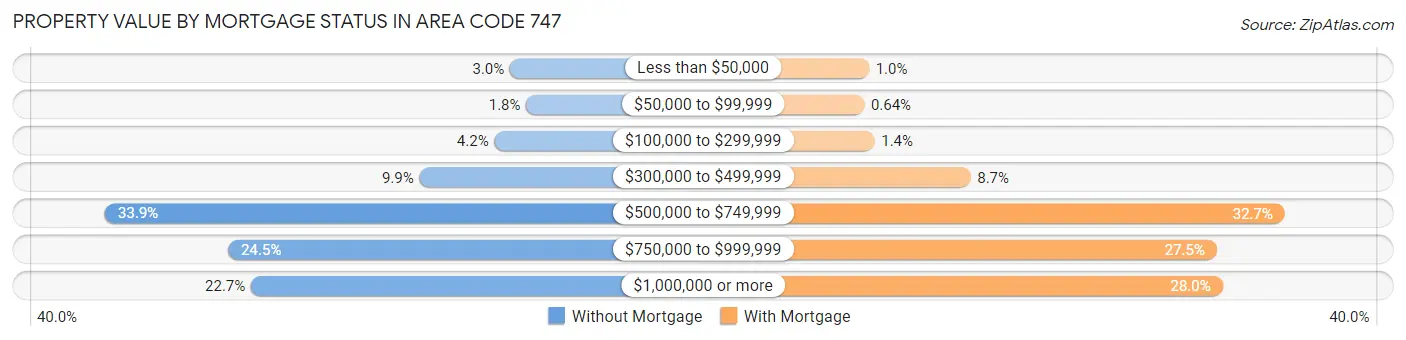
| Property Value | Without Mortgage | With Mortgage |
| Less than $50,000 | 1,009 (3.0%) | 883 (1.0%) |
| $50,000 to $99,999 | 595 (1.8%) | 564 (0.6%) |
| $100,000 to $299,999 | 1,410 (4.2%) | 1,261 (1.4%) |
| $300,000 to $499,999 | 3,325 (9.9%) | 7,699 (8.7%) |
| $500,000 to $749,999 | 11,369 (33.9%) | 28,798 (32.7%) |
| $750,000 to $999,999 | 8,221 (24.5%) | 24,237 (27.5%) |
| $1,000,000 or more | 7,630 (22.7%) | 24,620 (28.0%) |
| Total | 33,559 (100.0%) | 88,062 (100.0%) |
Household Income by Mortgage Status in Area Code 747
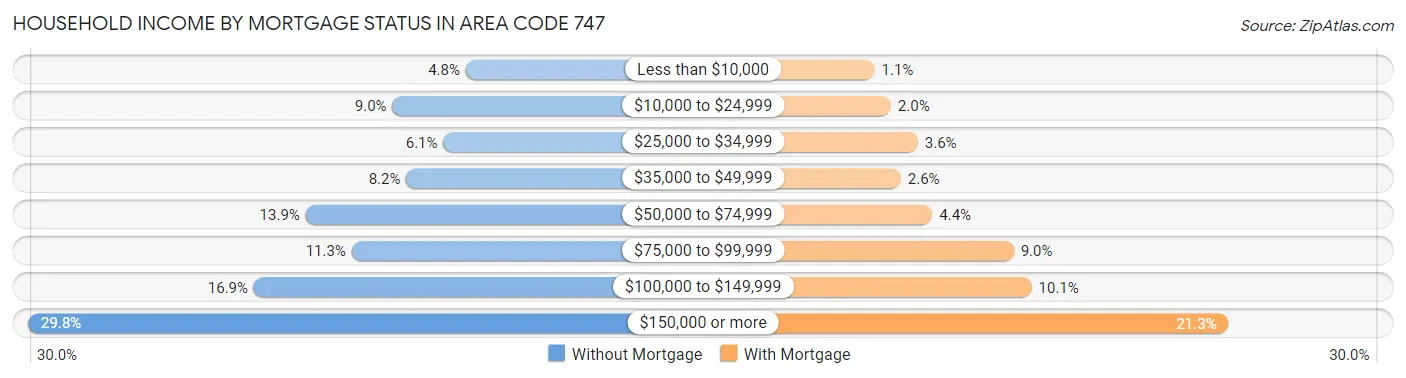
| Household Income | Without Mortgage | With Mortgage |
| Less than $10,000 | 1,608 (4.8%) | 958 (1.1%) |
| $10,000 to $24,999 | 3,013 (9.0%) | 1,776 (2.0%) |
| $25,000 to $34,999 | 2,038 (6.1%) | 3,136 (3.6%) |
| $35,000 to $49,999 | 2,750 (8.2%) | 2,282 (2.6%) |
| $50,000 to $74,999 | 4,677 (13.9%) | 3,864 (4.4%) |
| $75,000 to $99,999 | 3,797 (11.3%) | 7,961 (9.0%) |
| $100,000 to $149,999 | 5,673 (16.9%) | 8,859 (10.1%) |
| $150,000 or more | 10,003 (29.8%) | 18,763 (21.3%) |
| Total | 33,559 (100.0%) | 88,062 (100.0%) |
Property Value to Household Income Ratio in Area Code 747
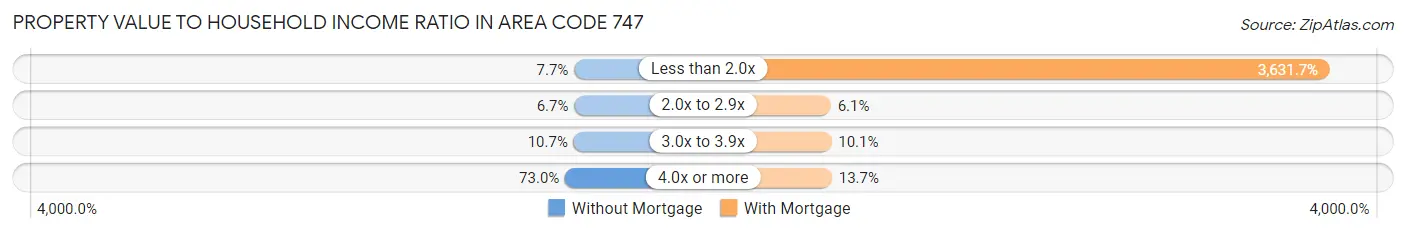
| Value-to-Income Ratio | Without Mortgage | With Mortgage |
| Less than 2.0x | 2,585 (7.7%) | 3,198,161 (3,631.7%) |
| 2.0x to 2.9x | 2,255 (6.7%) | 5,368 (6.1%) |
| 3.0x to 3.9x | 3,590 (10.7%) | 8,875 (10.1%) |
| 4.0x or more | 24,499 (73.0%) | 12,076 (13.7%) |
| Total | 33,559 (100.0%) | 88,062 (100.0%) |
Real Estate Taxes by Mortgage Status in Area Code 747
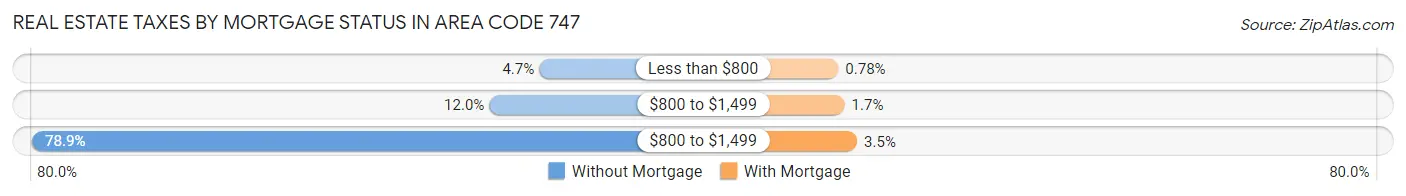
| Property Taxes | Without Mortgage | With Mortgage |
| Less than $800 | 1,569 (4.7%) | 689 (0.8%) |
| $800 to $1,499 | 4,017 (12.0%) | 1,493 (1.7%) |
| $800 to $1,499 | 26,475 (78.9%) | 3,098 (3.5%) |
| Total | 33,559 (100.0%) | 88,062 (100.0%) |
Health & Disability in Area Code 747
Health Insurance Coverage by Age in Area Code 747
| Age Bracket | With Coverage | Without Coverage |
| Under 6 Years | 45,297 (97.4%) | 1,218 (2.6%) |
| 6 to 18 Years | 109,592 (96.0%) | 4,571 (4.0%) |
| 19 to 25 Years | 59,303 (86.9%) | 8,968 (13.1%) |
| 26 to 34 Years | 88,762 (85.2%) | 15,420 (14.8%) |
| 35 to 44 Years | 87,390 (88.0%) | 11,913 (12.0%) |
| 45 to 54 Years | 89,874 (87.8%) | 12,443 (12.2%) |
| 55 to 64 Years | 81,749 (91.3%) | 7,743 (8.6%) |
| 65 to 74 Years | 59,735 (97.4%) | 1,623 (2.6%) |
| 75 Years and older | 44,708 (99.1%) | 391 (0.9%) |
| Total | 666,410 (91.2%) | 64,290 (8.8%) |
Health Insurance Coverage by Citizenship Status in Area Code 747
| Citizenship Status | With Coverage | Without Coverage |
| Native Born | 45,297 (97.4%) | 1,218 (2.6%) |
| Foreign Born, Citizen | 109,592 (96.0%) | 4,571 (4.0%) |
| Foreign Born, not a Citizen | 59,303 (86.9%) | 8,968 (13.1%) |
Health Insurance Coverage by Household Income in Area Code 747
| Household Income | With Coverage | Without Coverage |
| Under $25,000 | 59,077 (88.8%) | 7,439 (11.2%) |
| $25,000 to $49,999 | 84,105 (88.0%) | 11,479 (12.0%) |
| $50,000 to $74,999 | 85,442 (89.3%) | 10,205 (10.7%) |
| $75,000 to $99,999 | 76,795 (89.1%) | 9,366 (10.9%) |
| $100,000 and over | 356,743 (93.3%) | 25,439 (6.7%) |
Public vs Private Health Insurance Coverage by Age in Area Code 747
| Age Bracket | Public Insurance | Private Insurance |
| Under 6 | 21,299 (45.8%) | 25,587 (55.0%) |
| 6 to 18 Years | 52,659 (46.1%) | 61,630 (54.0%) |
| 19 to 25 Years | 20,382 (29.8%) | 40,580 (59.4%) |
| 25 to 34 Years | 26,644 (25.6%) | 64,486 (61.9%) |
| 35 to 44 Years | 22,737 (22.9%) | 66,808 (67.3%) |
| 45 to 54 Years | 23,765 (23.2%) | 68,496 (66.9%) |
| 55 to 64 Years | 23,646 (26.4%) | 60,336 (67.4%) |
| 65 to 74 Years | 55,688 (90.8%) | 24,538 (40.0%) |
| 75 Years and over | 43,851 (97.2%) | 16,441 (36.5%) |
| Total | 290,671 (39.8%) | 428,902 (58.7%) |
Disability Status by Sex by Age in Area Code 747
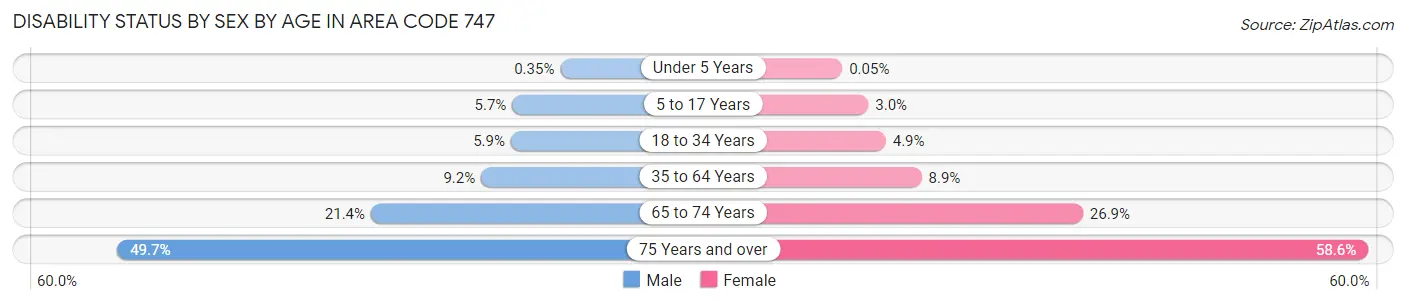
| Age Bracket | Male | Female |
| Under 5 Years | 70 (0.4%) | 10 (0.1%) |
| 5 to 17 Years | 3,318 (5.7%) | 1,596 (3.0%) |
| 18 to 34 Years | 5,415 (5.9%) | 4,363 (4.9%) |
| 35 to 64 Years | 13,384 (9.2%) | 12,908 (8.9%) |
| 65 to 74 Years | 6,096 (21.4%) | 8,841 (26.9%) |
| 75 Years and over | 9,040 (49.7%) | 15,764 (58.6%) |
Disability Class by Sex by Age in Area Code 747
Disability Class: Hearing Difficulty
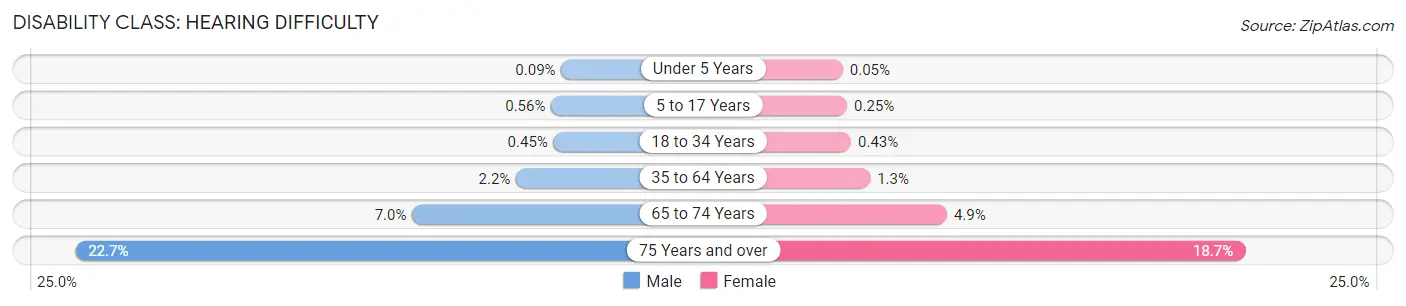
| Age Bracket | Male | Female |
| Under 5 Years | 18 (0.1%) | 10 (0.1%) |
| 5 to 17 Years | 328 (0.6%) | 134 (0.3%) |
| 18 to 34 Years | 415 (0.4%) | 386 (0.4%) |
| 35 to 64 Years | 3,201 (2.2%) | 1,917 (1.3%) |
| 65 to 74 Years | 1,993 (7.0%) | 1,608 (4.9%) |
| 75 Years and over | 4,121 (22.7%) | 5,033 (18.7%) |
Disability Class: Vision Difficulty
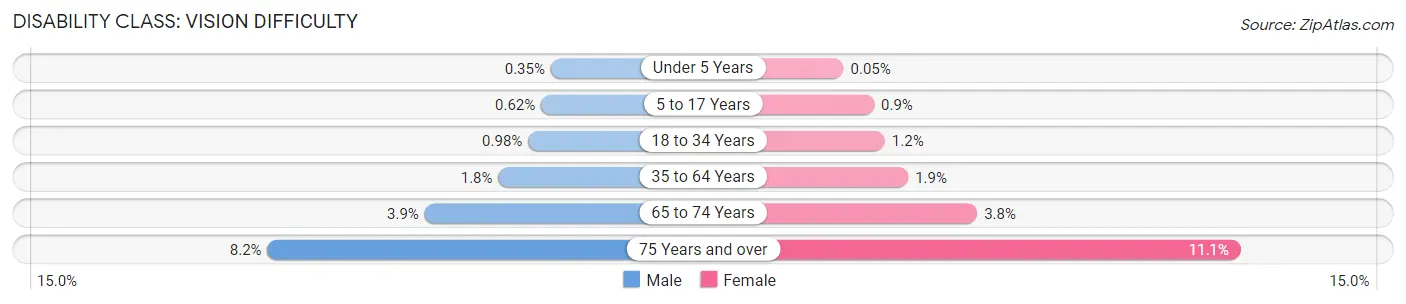
| Age Bracket | Male | Female |
| Under 5 Years | 70 (0.4%) | 10 (0.1%) |
| 5 to 17 Years | 360 (0.6%) | 486 (0.9%) |
| 18 to 34 Years | 911 (1.0%) | 1,067 (1.2%) |
| 35 to 64 Years | 2,646 (1.8%) | 2,683 (1.8%) |
| 65 to 74 Years | 1,099 (3.9%) | 1,241 (3.8%) |
| 75 Years and over | 1,499 (8.2%) | 2,988 (11.1%) |
Disability Class: Cognitive Difficulty
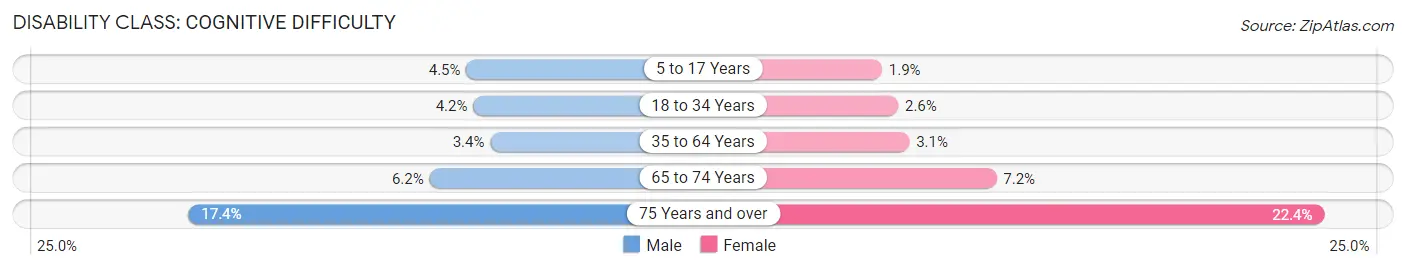
| Age Bracket | Male | Female |
| 5 to 17 Years | 2,620 (4.5%) | 1,004 (1.9%) |
| 18 to 34 Years | 3,865 (4.2%) | 2,326 (2.6%) |
| 35 to 64 Years | 4,945 (3.4%) | 4,542 (3.1%) |
| 65 to 74 Years | 1,765 (6.2%) | 2,361 (7.2%) |
| 75 Years and over | 3,166 (17.4%) | 6,024 (22.4%) |
Disability Class: Ambulatory Difficulty
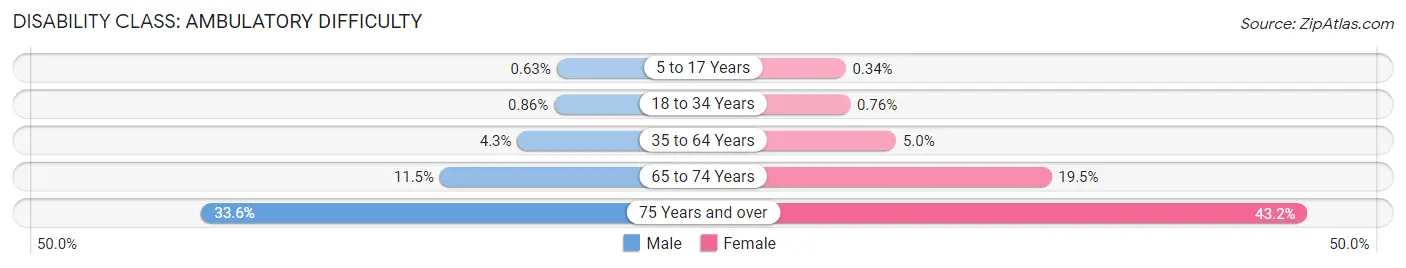
| Age Bracket | Male | Female |
| 5 to 17 Years | 365 (0.6%) | 185 (0.3%) |
| 18 to 34 Years | 797 (0.9%) | 680 (0.8%) |
| 35 to 64 Years | 6,232 (4.3%) | 7,302 (5.0%) |
| 65 to 74 Years | 3,258 (11.5%) | 6,402 (19.5%) |
| 75 Years and over | 6,112 (33.6%) | 11,625 (43.2%) |
Disability Class: Self-Care Difficulty
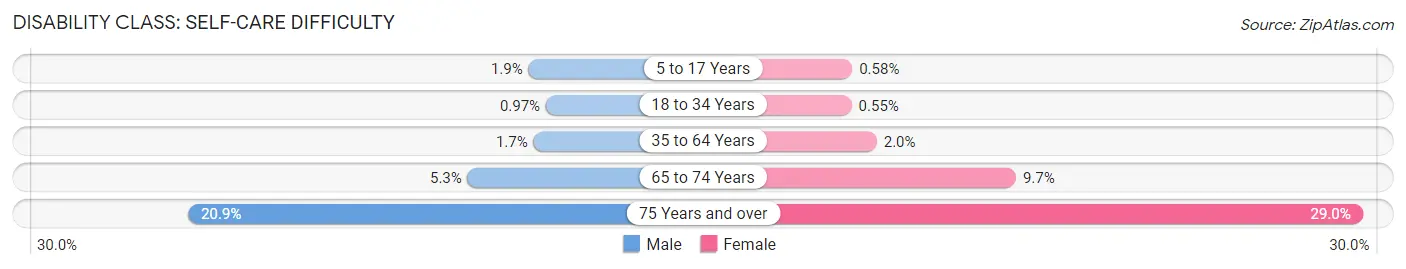
| Age Bracket | Male | Female |
| 5 to 17 Years | 1,129 (1.9%) | 315 (0.6%) |
| 18 to 34 Years | 896 (1.0%) | 491 (0.5%) |
| 35 to 64 Years | 2,426 (1.7%) | 2,827 (1.9%) |
| 65 to 74 Years | 1,517 (5.3%) | 3,192 (9.7%) |
| 75 Years and over | 3,804 (20.9%) | 7,801 (29.0%) |
Technology Access in Area Code 747
Computing Device Access in Area Code 747
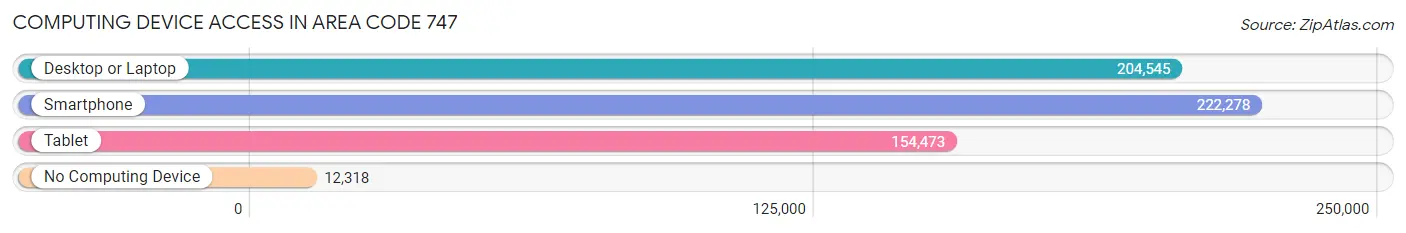
| Device Type | # Households | % Households |
| Desktop or Laptop | 204,545 | 83.8% |
| Smartphone | 222,278 | 91.1% |
| Tablet | 154,473 | 63.3% |
| No Computing Device | 12,318 | 5.1% |
| Total | 244,000 | 100.0% |
Internet Access in Area Code 747
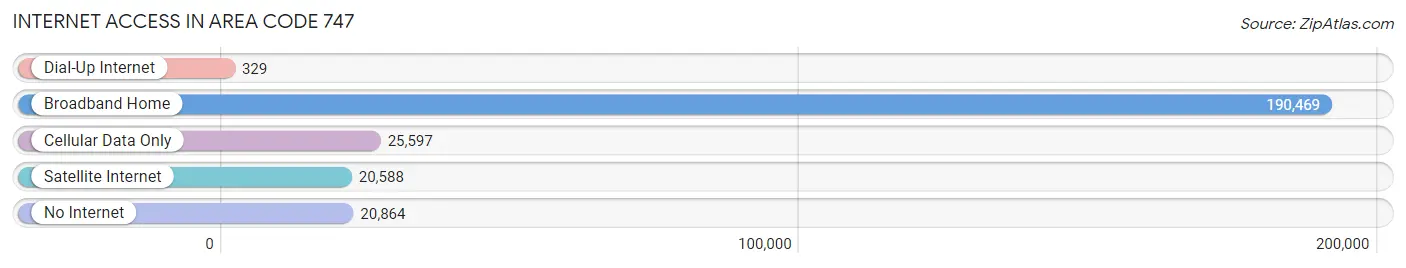
| Internet Type | # Households | % Households |
| Dial-Up Internet | 329 | 0.1% |
| Broadband Home | 190,469 | 78.1% |
| Cellular Data Only | 25,597 | 10.5% |
| Satellite Internet | 20,588 | 8.4% |
| No Internet | 20,864 | 8.6% |
| Total | 244,000 | 100.0% |
Area Code 747 Summary
Geography
Area code 747 is a telephone area code in the North American Numbering Plan (NANP) for the San Fernando Valley region of Los Angeles, California. It was created in July 2017 as an overlay to area code 818.
Social
Area code 747 is a relatively new area code, and as such, it has not yet developed a distinct social identity. However, it is associated with the San Fernando Valley region of Los Angeles, which is known for its diverse population and vibrant culture.
Economics
Area code 747 is located in one of the most economically prosperous regions of the United States. The San Fernando Valley is home to many large corporations, including Warner Bros. and Universal Studios, and is a major hub for the entertainment industry.
Demographics
The population of the San Fernando Valley is estimated to be around 1.8 million people. The area is ethnically diverse, with a large Hispanic population, as well as significant numbers of African Americans, Asians, and other ethnicities. The median household income in the area is around $60,000.
Common Questions
What is the Total Population of Area Code 747?
Total Population of Area Code 747 is 734,515.
What is the Total Male Population of Area Code 747?
Total Male Population of Area Code 747 is 365,076.
What is the Total Female Population of Area Code 747?
Total Female Population of Area Code 747 is 369,439.
What is the Ratio of Males per 100 Females in Area Code 747?
There are 98.82 Males per 100 Females in Area Code 747.
What is the Ratio of Females per 100 Males in Area Code 747?
There are 101.20 Females per 100 Males in Area Code 747.
What is the Median Population Age in Area Code 747?
Median Population Age in Area Code 747 is 39.5 Years.
What is the Average Family Size in Area Code 747
Average Family Size in Area Code 747 is 3.4 People.
What is the Average Household Size in Area Code 747
Average Household Size in Area Code 747 is 2.8 People.
What is Per Capita Income in Area Code 747?
Per Capita income in Area Code 747 is $51,172.
What is the Median Family Income in Area Code 747?
Median Family Income in Area Code 747 is $115,544.
What is the Median Household income in Area Code 747?
Median Household Income in Area Code 747 is $93,695.
What is Income or Wage Gap in Area Code 747?
Income or Wage Gap in Area Code 747 is 20.5%.
Women in Area Code 747 earn 79.5 cents for every dollar earned by a man.
What is Family Income Deficit in Area Code 747?
Family Income Deficit in Area Code 747 is $10,206.
Families that are below poverty line in Area Code 747 earn $10,206 less on average than the poverty threshold level.
What is Inequality or Gini Index in Area Code 747?
Inequality or Gini Index in Area Code 747 is 10.36.
How Large is the Labor Force in Area Code 747?
There are 400,054 People in the Labor Forcein in Area Code 747.
What is the Percentage of People in the Labor Force in Area Code 747?
66.5% of People are in the Labor Force in Area Code 747.
What is the Unemployment Rate in Area Code 747?
Unemployment Rate in Area Code 747 is 6.9%.