St Michael, AK
St Michael Map
St Michael Overview
308
TOTAL POPULATION
180
MALE POPULATION
128
FEMALE POPULATION
140.62
MALES / 100 FEMALES
71.11
FEMALES / 100 MALES
19.7
MEDIAN AGE
4.6
AVG FAMILY SIZE
4.7
AVG HOUSEHOLD SIZE
$11,900
PER CAPITA INCOME
$41,250
AVG FAMILY INCOME
$46,875
AVG HOUSEHOLD INCOME
8.8%
WAGE / INCOME GAP [ % ]
91.2¢/ $1
WAGE / INCOME GAP [ $ ]
0.42
INEQUALITY / GINI INDEX
111
LABOR FORCE [ PEOPLE ]
59.0%
PERCENT IN LABOR FORCE
36.9%
UNEMPLOYMENT RATE
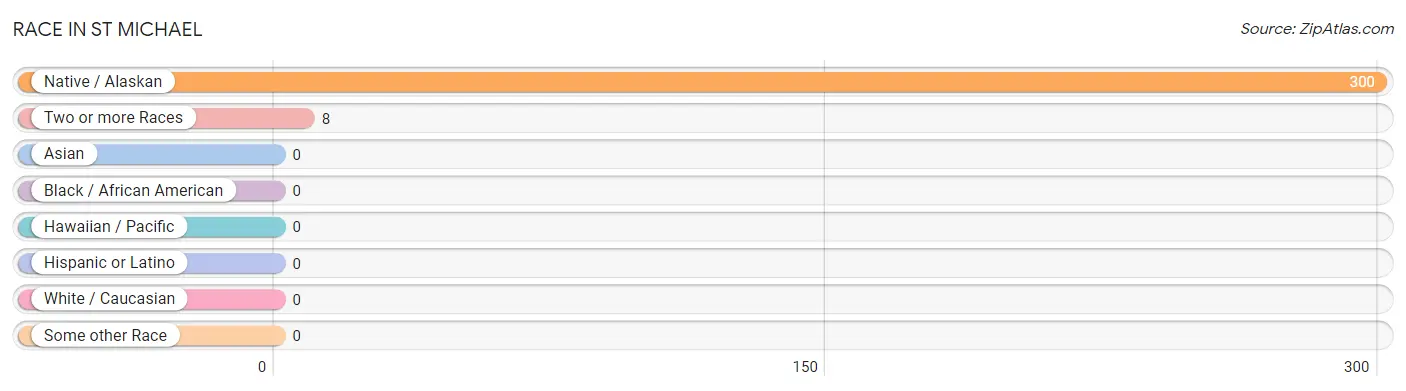
Race in St Michael
The most populous races in St Michael are Native / Alaskan (300 | 97.4%), and Two or more Races (8 | 2.6%).
| Race | # Population | % Population |
| Asian | 0 | 0.0% |
| Black / African American | 0 | 0.0% |
| Hawaiian / Pacific | 0 | 0.0% |
| Hispanic or Latino | 0 | 0.0% |
| Native / Alaskan | 300 | 97.4% |
| White / Caucasian | 0 | 0.0% |
| Two or more Races | 8 | 2.6% |
| Some other Race | 0 | 0.0% |
| Total | 308 | 100.0% |
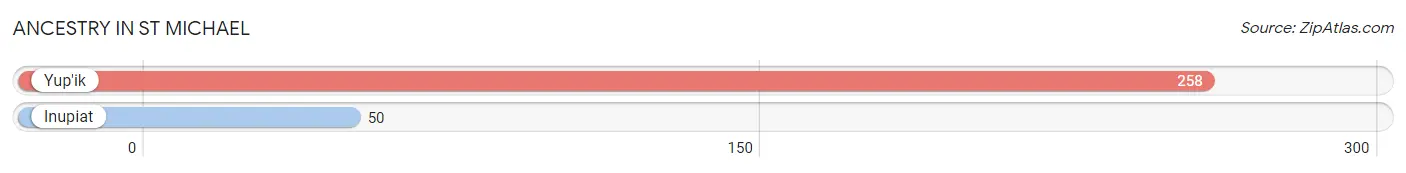
Ancestry in St Michael
The most populous ancestries reported in St Michael are Yup'ik (258 | 83.8%), and Inupiat (50 | 16.2%), together accounting for 100.0% of all St Michael residents.
| Ancestry | # Population | % Population |
| Inupiat | 50 | 16.2% |
| Yup'ik | 258 | 83.8% | View All 2 Rows |
Immigrants in St Michael

| Immigration Origin | # Population | % Population | View All 0 Rows |
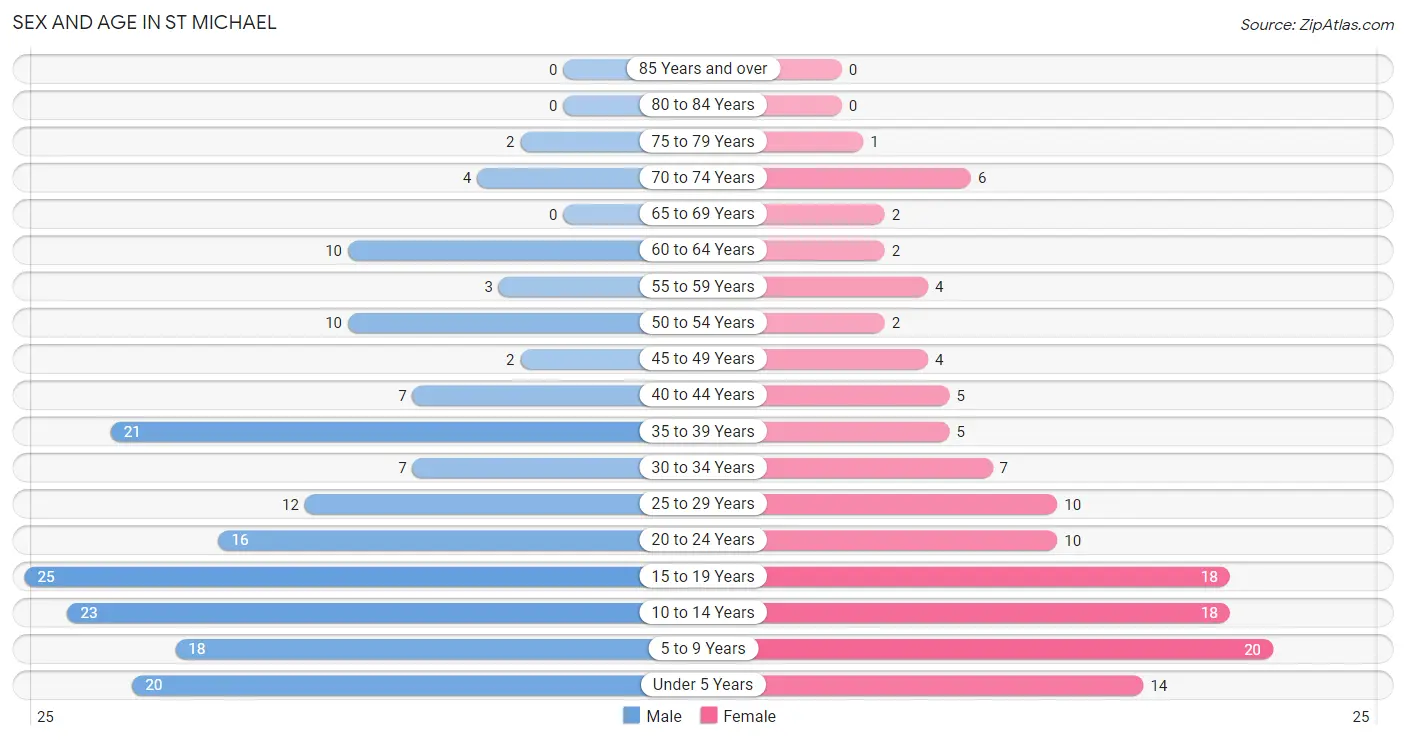
Sex and Age in St Michael
Sex and Age in St Michael
The most populous age groups in St Michael are 15 to 19 Years (25 | 13.9%) for men and 5 to 9 Years (20 | 15.6%) for women.
| Age Bracket | Male | Female |
| Under 5 Years | 20 (11.1%) | 14 (10.9%) |
| 5 to 9 Years | 18 (10.0%) | 20 (15.6%) |
| 10 to 14 Years | 23 (12.8%) | 18 (14.1%) |
| 15 to 19 Years | 25 (13.9%) | 18 (14.1%) |
| 20 to 24 Years | 16 (8.9%) | 10 (7.8%) |
| 25 to 29 Years | 12 (6.7%) | 10 (7.8%) |
| 30 to 34 Years | 7 (3.9%) | 7 (5.5%) |
| 35 to 39 Years | 21 (11.7%) | 5 (3.9%) |
| 40 to 44 Years | 7 (3.9%) | 5 (3.9%) |
| 45 to 49 Years | 2 (1.1%) | 4 (3.1%) |
| 50 to 54 Years | 10 (5.6%) | 2 (1.6%) |
| 55 to 59 Years | 3 (1.7%) | 4 (3.1%) |
| 60 to 64 Years | 10 (5.6%) | 2 (1.6%) |
| 65 to 69 Years | 0 (0.0%) | 2 (1.6%) |
| 70 to 74 Years | 4 (2.2%) | 6 (4.7%) |
| 75 to 79 Years | 2 (1.1%) | 1 (0.8%) |
| 80 to 84 Years | 0 (0.0%) | 0 (0.0%) |
| 85 Years and over | 0 (0.0%) | 0 (0.0%) |
| Total | 180 (100.0%) | 128 (100.0%) |
Families and Households in St Michael
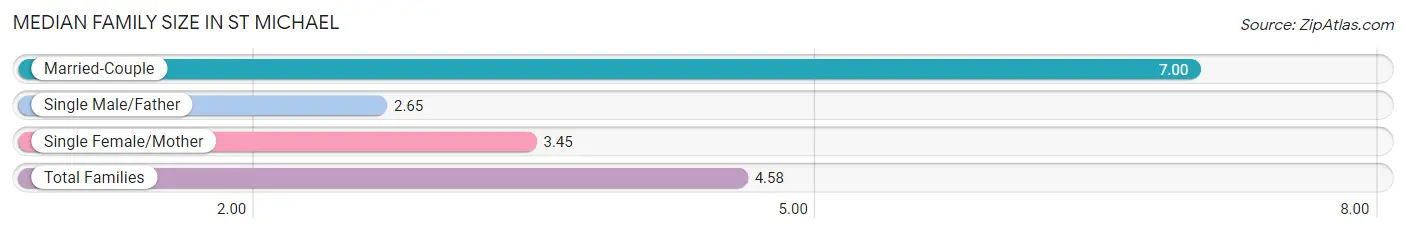
Median Family Size in St Michael
The median family size in St Michael is 4.58 persons per family, with married-couple families (23 | 38.3%) accounting for the largest median family size of 7 persons per family. On the other hand, single male/father families (17 | 28.3%) represent the smallest median family size with 2.65 persons per family.
| Family Type | # Families | Family Size |
| Married-Couple | 23 (38.3%) | 7.00 |
| Single Male/Father | 17 (28.3%) | 2.65 |
| Single Female/Mother | 20 (33.3%) | 3.45 |
| Total Families | 60 (100.0%) | 4.58 |
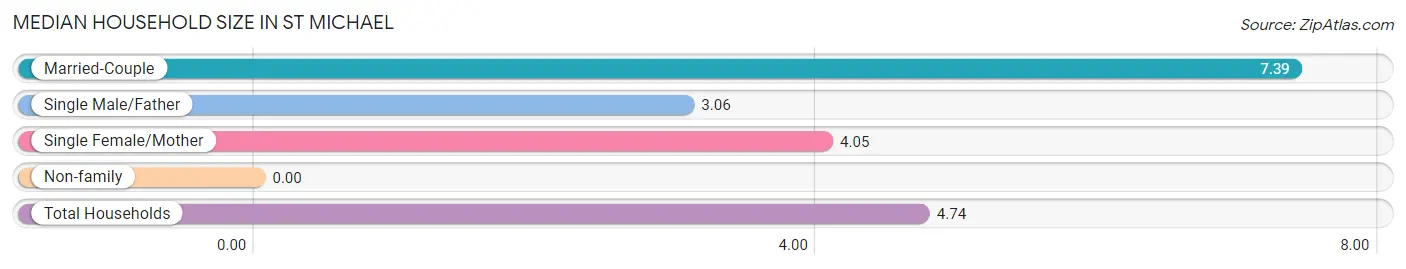
Median Household Size in St Michael
| Household Type | # Households | Household Size |
| Married-Couple | 23 (35.4%) | 7.39 |
| Single Male/Father | 17 (26.2%) | 3.06 |
| Single Female/Mother | 20 (30.8%) | 4.05 |
| Non-family | 5 (7.7%) | - |
| Total Households | 65 (100.0%) | 4.74 |
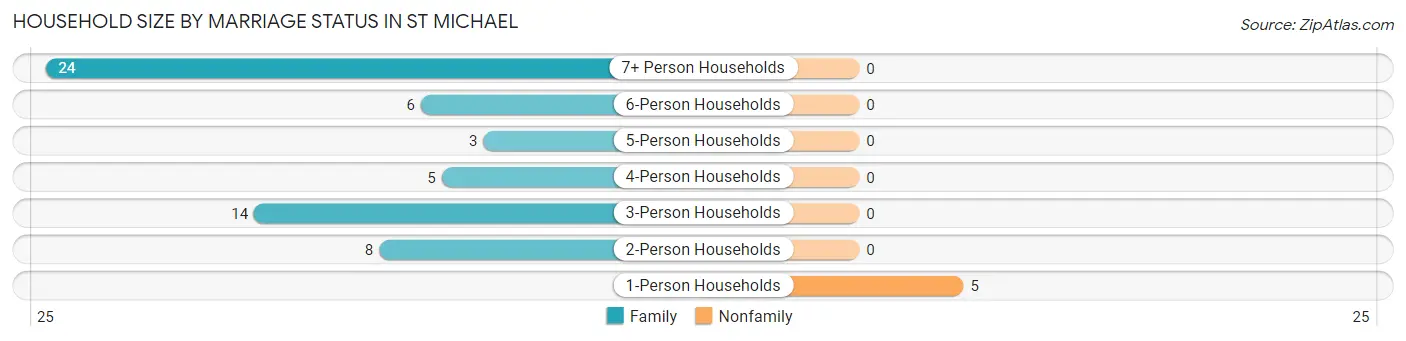
Household Size by Marriage Status in St Michael
Out of a total of 65 households in St Michael, 60 (92.3%) are family households, while 5 (7.7%) are nonfamily households. The most numerous type of family households are 7+ person households, comprising 24, and the most common type of nonfamily households are 1-person households, comprising 5.
| Household Size | Family Households | Nonfamily Households |
| 1-Person Households | - | 5 (7.7%) |
| 2-Person Households | 8 (12.3%) | 0 (0.0%) |
| 3-Person Households | 14 (21.5%) | 0 (0.0%) |
| 4-Person Households | 5 (7.7%) | 0 (0.0%) |
| 5-Person Households | 3 (4.6%) | 0 (0.0%) |
| 6-Person Households | 6 (9.2%) | 0 (0.0%) |
| 7+ Person Households | 24 (36.9%) | 0 (0.0%) |
| Total | 60 (92.3%) | 5 (7.7%) |
Female Fertility in St Michael
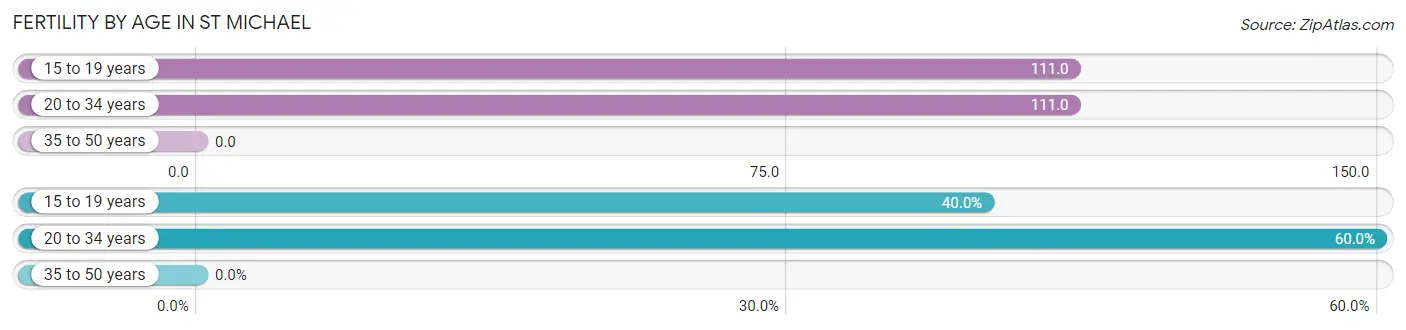
Fertility by Age in St Michael
Average fertility rate in St Michael is 85.0 births per 1,000 women. Women in the age bracket of 15 to 19 years have the highest fertility rate with 111.0 births per 1,000 women. Women in the age bracket of 20 to 34 years acount for 60.0% of all women with births.
| Age Bracket | Women with Births | Births / 1,000 Women |
| 15 to 19 years | 2 (40.0%) | 111.0 |
| 20 to 34 years | 3 (60.0%) | 111.0 |
| 35 to 50 years | 0 (0.0%) | 0.0 |
| Total | 5 (100.0%) | 85.0 |
Fertility by Age by Marriage Status in St Michael
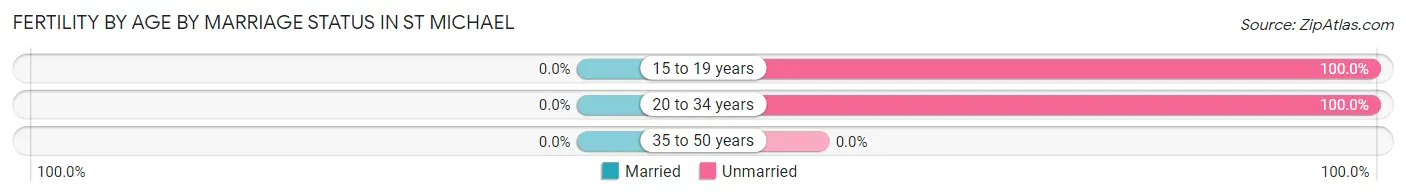
| Age Bracket | Married | Unmarried |
| 15 to 19 years | 0 (0.0%) | 2 (100.0%) |
| 20 to 34 years | 0 (0.0%) | 3 (100.0%) |
| 35 to 50 years | 0 (0.0%) | 0 (0.0%) |
| Total | 0 (0.0%) | 5 (100.0%) |
Fertility by Education in St Michael
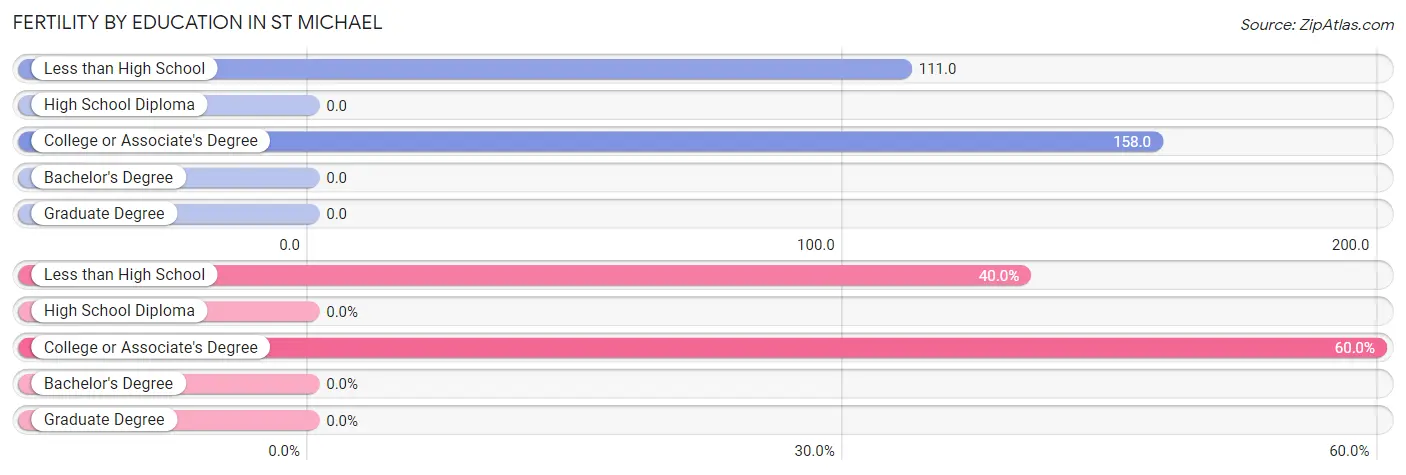
| Educational Attainment | Women with Births | Births / 1,000 Women |
| Less than High School | 2 (40.0%) | 111.0 |
| High School Diploma | 0 (0.0%) | 0.0 |
| College or Associate's Degree | 3 (60.0%) | 158.0 |
| Bachelor's Degree | 0 (0.0%) | 0.0 |
| Graduate Degree | 0 (0.0%) | 0.0 |
| Total | 5 (100.0%) | 85.0 |
Fertility by Education by Marriage Status in St Michael
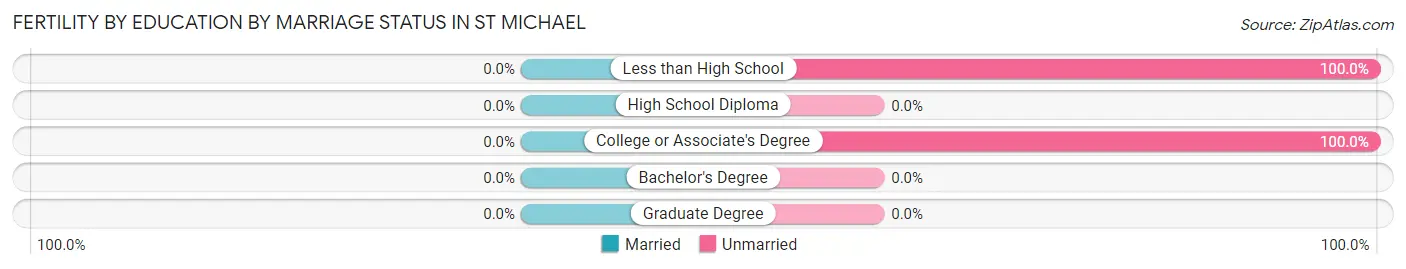
| Educational Attainment | Married | Unmarried |
| Less than High School | 0 (0.0%) | 2 (100.0%) |
| High School Diploma | 0 (0.0%) | 0 (0.0%) |
| College or Associate's Degree | 0 (0.0%) | 3 (100.0%) |
| Bachelor's Degree | 0 (0.0%) | 0 (0.0%) |
| Graduate Degree | 0 (0.0%) | 0 (0.0%) |
| Total | 0 (0.0%) | 5 (100.0%) |
Income in St Michael
Income Overview in St Michael
Per Capita Income in St Michael is $11,900, while median incomes of families and households are $41,250 and $46,875 respectively.
| Characteristic | Number | Measure |
| Per Capita Income | 308 | $11,900 |
| Median Family Income | 60 | $41,250 |
| Mean Family Income | 60 | $53,452 |
| Median Household Income | 65 | $46,875 |
| Mean Household Income | 65 | $58,609 |
| Income Deficit | 60 | $0 |
| Wage / Income Gap (%) | 308 | 8.78% |
| Wage / Income Gap ($) | 308 | 91.22¢ per $1 |
| Gini / Inequality Index | 308 | 0.42 |
Earnings by Sex in St Michael
Average Earnings in St Michael are $14,583, $15,417 for men and $14,063 for women, a difference of 8.8%.
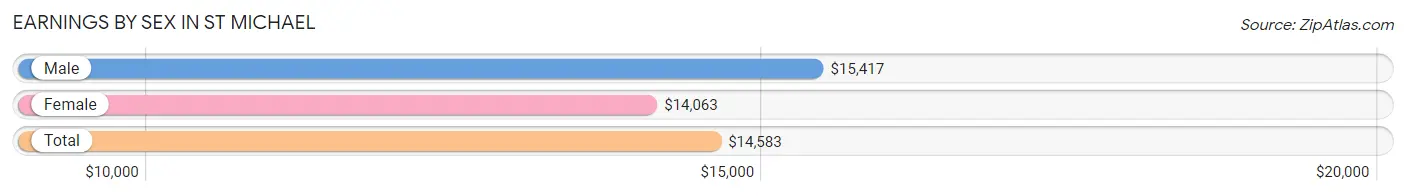
| Sex | Number | Average Earnings |
| Male | 77 (63.1%) | $15,417 |
| Female | 45 (36.9%) | $14,063 |
| Total | 122 (100.0%) | $14,583 |
Earnings by Sex by Income Bracket in St Michael
The most common earnings brackets in St Michael are $2,499 or less for men (16 | 20.8%) and $2,500 to $4,999 for women (7 | 15.6%).
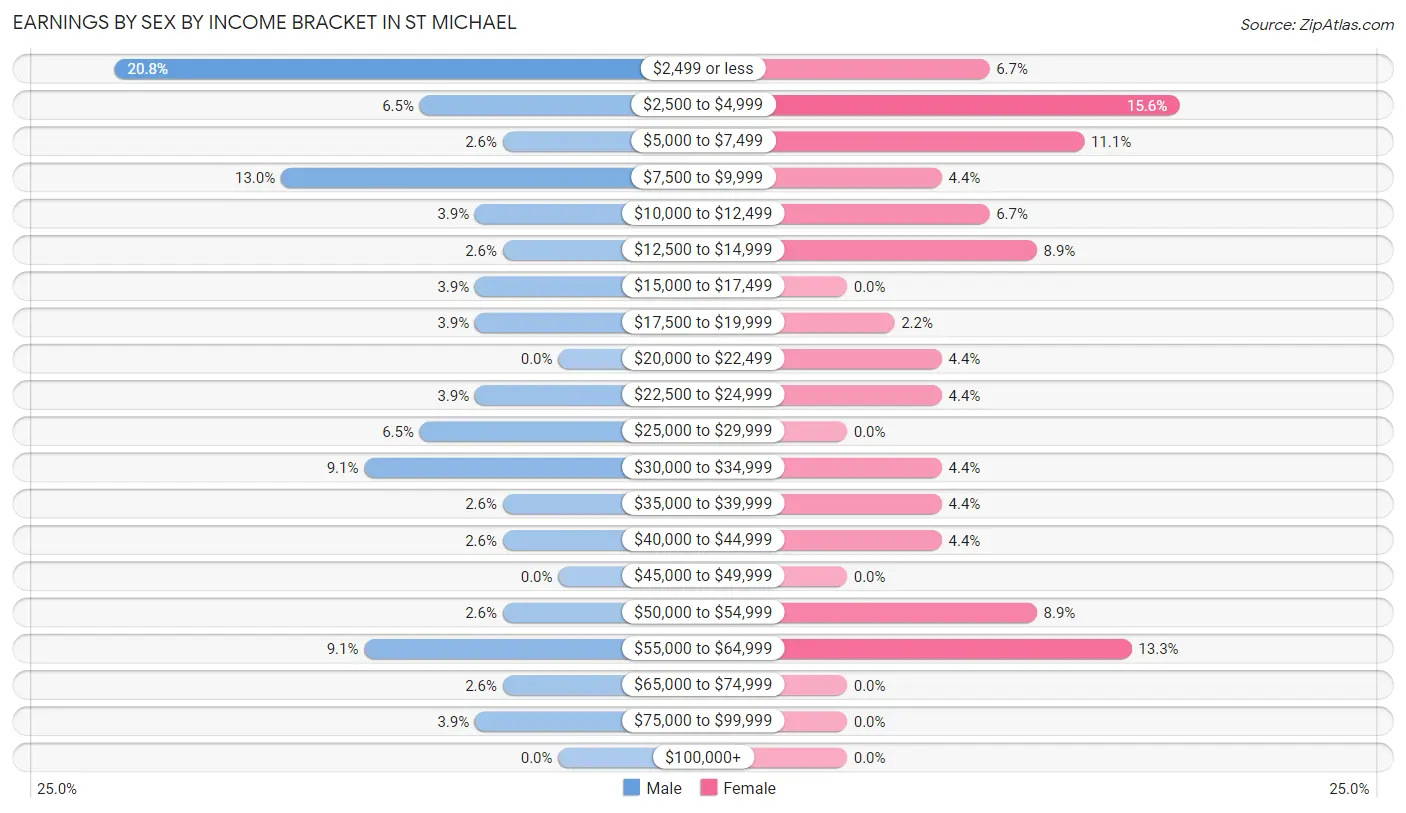
| Income | Male | Female |
| $2,499 or less | 16 (20.8%) | 3 (6.7%) |
| $2,500 to $4,999 | 5 (6.5%) | 7 (15.6%) |
| $5,000 to $7,499 | 2 (2.6%) | 5 (11.1%) |
| $7,500 to $9,999 | 10 (13.0%) | 2 (4.4%) |
| $10,000 to $12,499 | 3 (3.9%) | 3 (6.7%) |
| $12,500 to $14,999 | 2 (2.6%) | 4 (8.9%) |
| $15,000 to $17,499 | 3 (3.9%) | 0 (0.0%) |
| $17,500 to $19,999 | 3 (3.9%) | 1 (2.2%) |
| $20,000 to $22,499 | 0 (0.0%) | 2 (4.4%) |
| $22,500 to $24,999 | 3 (3.9%) | 2 (4.4%) |
| $25,000 to $29,999 | 5 (6.5%) | 0 (0.0%) |
| $30,000 to $34,999 | 7 (9.1%) | 2 (4.4%) |
| $35,000 to $39,999 | 2 (2.6%) | 2 (4.4%) |
| $40,000 to $44,999 | 2 (2.6%) | 2 (4.4%) |
| $45,000 to $49,999 | 0 (0.0%) | 0 (0.0%) |
| $50,000 to $54,999 | 2 (2.6%) | 4 (8.9%) |
| $55,000 to $64,999 | 7 (9.1%) | 6 (13.3%) |
| $65,000 to $74,999 | 2 (2.6%) | 0 (0.0%) |
| $75,000 to $99,999 | 3 (3.9%) | 0 (0.0%) |
| $100,000+ | 0 (0.0%) | 0 (0.0%) |
| Total | 77 (100.0%) | 45 (100.0%) |
Earnings by Sex by Educational Attainment in St Michael
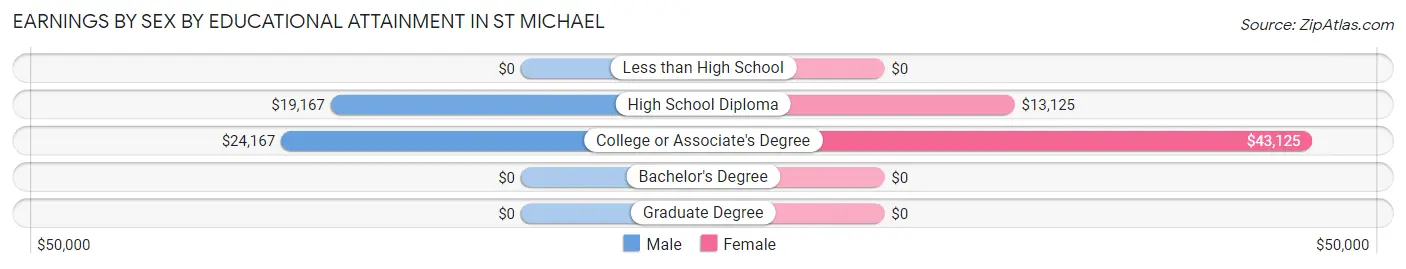
| Educational Attainment | Male Income | Female Income |
| Less than High School | - | - |
| High School Diploma | $19,167 | $13,125 |
| College or Associate's Degree | $24,167 | $43,125 |
| Bachelor's Degree | - | - |
| Graduate Degree | - | - |
| Total | $24,167 | $0 |
Family Income in St Michael
Family Income Brackets in St Michael
According to the St Michael family income data, there are 10 families falling into the $25,000 to $34,999 income range, which is the most common income bracket and makes up 16.7% of all families.
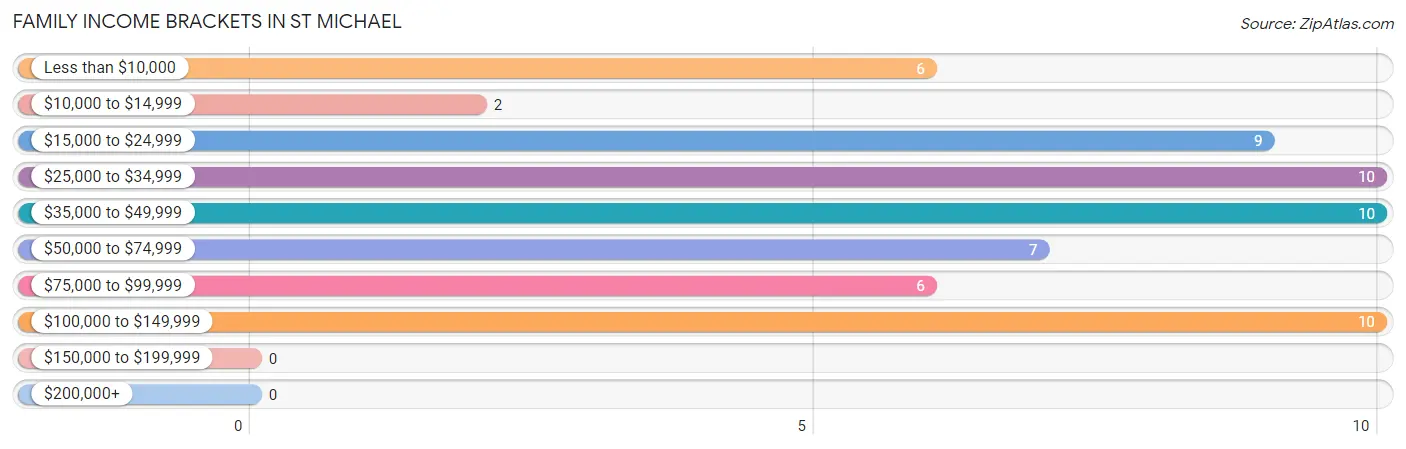
| Income Bracket | # Families | % Families |
| Less than $10,000 | 6 | 10.0% |
| $10,000 to $14,999 | 2 | 3.3% |
| $15,000 to $24,999 | 9 | 15.0% |
| $25,000 to $34,999 | 10 | 16.7% |
| $35,000 to $49,999 | 10 | 16.7% |
| $50,000 to $74,999 | 7 | 11.7% |
| $75,000 to $99,999 | 6 | 10.0% |
| $100,000 to $149,999 | 10 | 16.7% |
| $150,000 to $199,999 | 0 | 0.0% |
| $200,000+ | 0 | 0.0% |
Family Income by Famaliy Size in St Michael
7+ person families (20 | 33.3%) account for the highest median family income in St Michael with $77,500 per family, while 6-person families (6 | 10.0%) have the highest median income of $11,458 per family member.
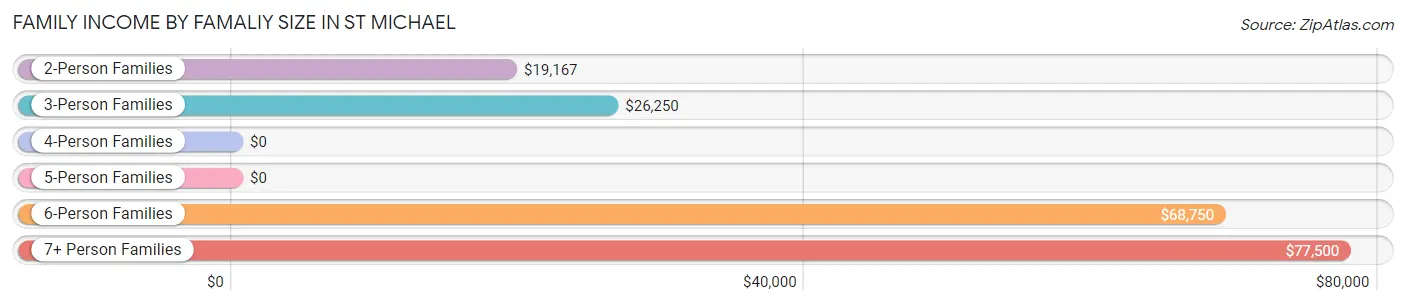
| Income Bracket | # Families | Median Income |
| 2-Person Families | 16 (26.7%) | $19,167 |
| 3-Person Families | 9 (15.0%) | $26,250 |
| 4-Person Families | 4 (6.7%) | $0 |
| 5-Person Families | 5 (8.3%) | $0 |
| 6-Person Families | 6 (10.0%) | $68,750 |
| 7+ Person Families | 20 (33.3%) | $77,500 |
| Total | 60 (100.0%) | $41,250 |
Family Income by Number of Earners in St Michael
The median family income in St Michael is $41,250, with families comprising 3+ earners (10) having the highest median family income of $138,125, while families with 1 earner (21) have the lowest median family income of $26,250, accounting for 16.7% and 35.0% of families, respectively.
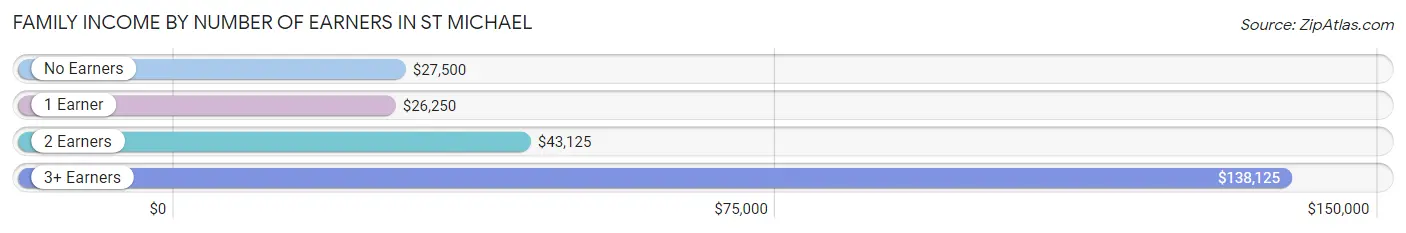
| Number of Earners | # Families | Median Income |
| No Earners | 8 (13.3%) | $27,500 |
| 1 Earner | 21 (35.0%) | $26,250 |
| 2 Earners | 21 (35.0%) | $43,125 |
| 3+ Earners | 10 (16.7%) | $138,125 |
| Total | 60 (100.0%) | $41,250 |
Household Income in St Michael
Household Income Brackets in St Michael
With 13 households falling in the category, the $25,000 to $34,999 income range is the most frequent in St Michael, accounting for 20.0% of all households.
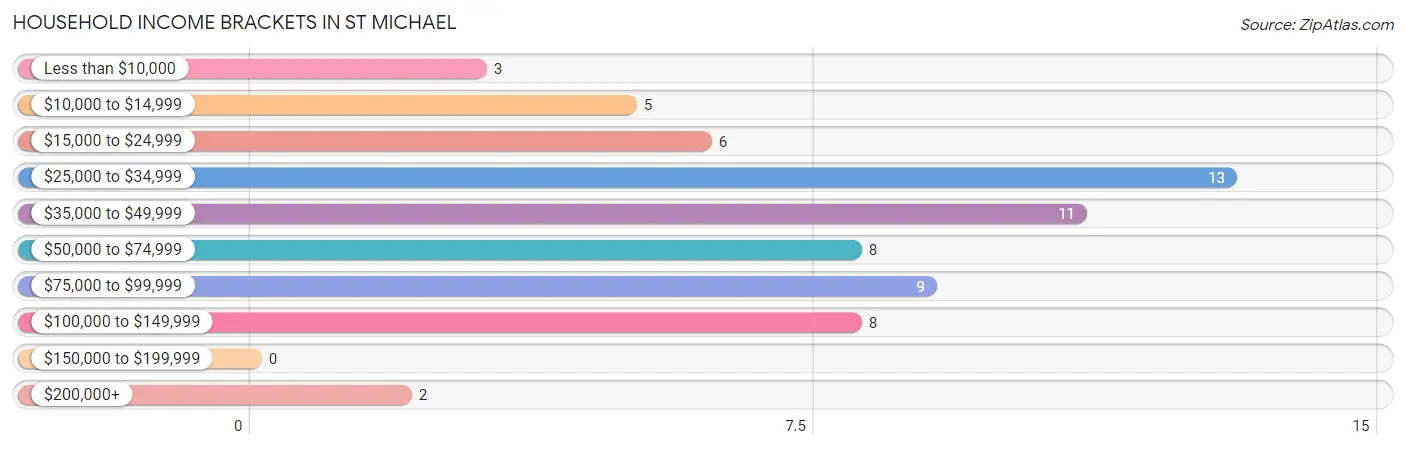
| Income Bracket | # Households | % Households |
| Less than $10,000 | 3 | 4.6% |
| $10,000 to $14,999 | 5 | 7.7% |
| $15,000 to $24,999 | 6 | 9.2% |
| $25,000 to $34,999 | 13 | 20.0% |
| $35,000 to $49,999 | 11 | 16.9% |
| $50,000 to $74,999 | 8 | 12.3% |
| $75,000 to $99,999 | 9 | 13.8% |
| $100,000 to $149,999 | 8 | 12.3% |
| $150,000 to $199,999 | 0 | 0.0% |
| $200,000+ | 2 | 3.1% |
Household Income by Householder Age in St Michael
The median household income in St Michael is $46,875, with the highest median household income of $62,500 found in the 45 to 64 years age bracket for the primary householder. A total of 22 households (33.9%) fall into this category. Meanwhile, the 15 to 24 years age bracket for the primary householder has the lowest median household income of $0, with 4 households (6.1%) in this group.
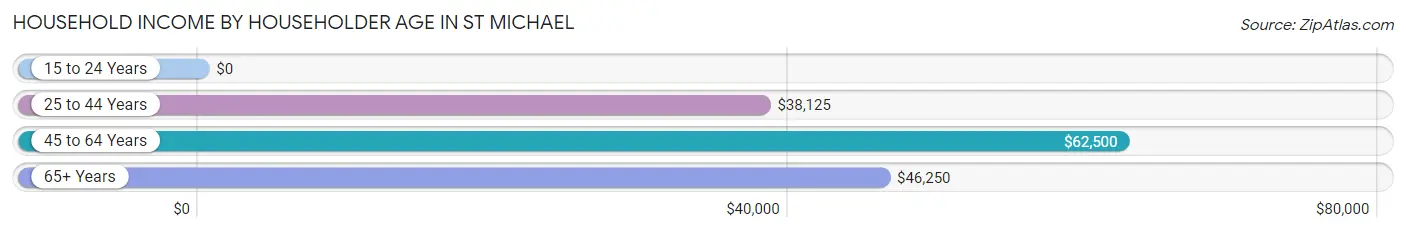
| Income Bracket | # Households | Median Income |
| 15 to 24 Years | 4 (6.1%) | $0 |
| 25 to 44 Years | 29 (44.6%) | $38,125 |
| 45 to 64 Years | 22 (33.9%) | $62,500 |
| 65+ Years | 10 (15.4%) | $46,250 |
| Total | 65 (100.0%) | $46,875 |
Poverty in St Michael
Income Below Poverty by Sex and Age in St Michael
With 24.3% poverty level for males and 18.0% for females among the residents of St Michael, 45 to 54 year old males and 25 to 34 year old females are the most vulnerable to poverty, with 6 males (50.0%) and 7 females (41.2%) in their respective age groups living below the poverty level.
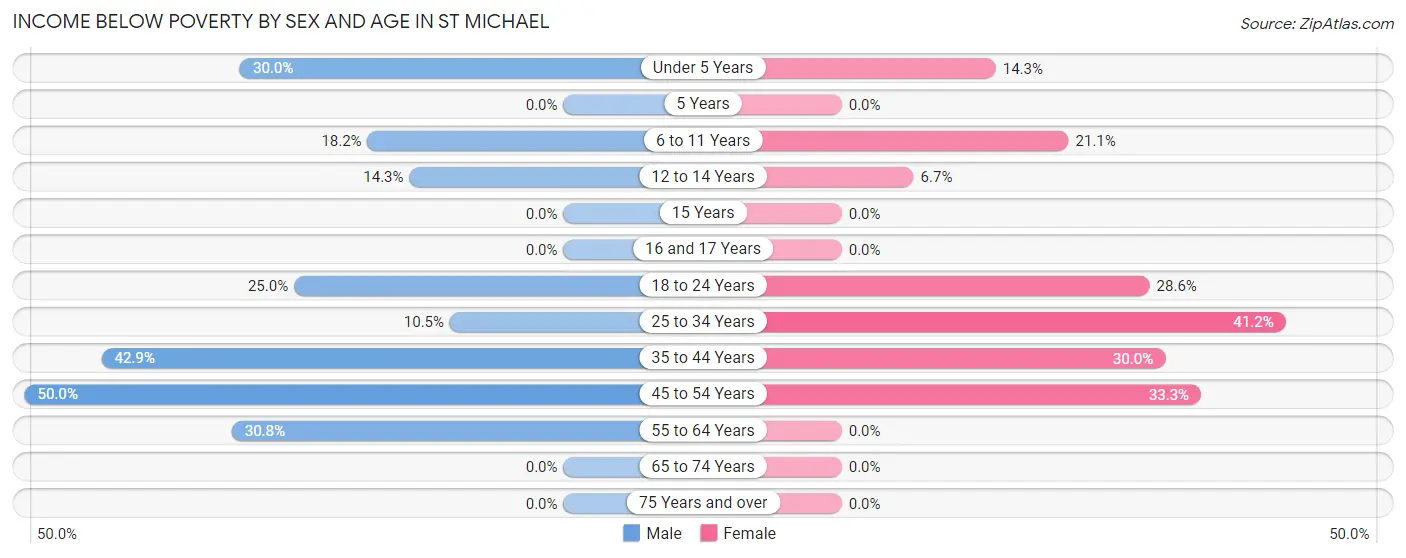
| Age Bracket | Male | Female |
| Under 5 Years | 6 (30.0%) | 2 (14.3%) |
| 5 Years | 0 (0.0%) | 0 (0.0%) |
| 6 to 11 Years | 4 (18.2%) | 4 (21.0%) |
| 12 to 14 Years | 2 (14.3%) | 1 (6.7%) |
| 15 Years | 0 (0.0%) | 0 (0.0%) |
| 16 and 17 Years | 0 (0.0%) | 0 (0.0%) |
| 18 to 24 Years | 7 (25.0%) | 4 (28.6%) |
| 25 to 34 Years | 2 (10.5%) | 7 (41.2%) |
| 35 to 44 Years | 12 (42.9%) | 3 (30.0%) |
| 45 to 54 Years | 6 (50.0%) | 2 (33.3%) |
| 55 to 64 Years | 4 (30.8%) | 0 (0.0%) |
| 65 to 74 Years | 0 (0.0%) | 0 (0.0%) |
| 75 Years and over | 0 (0.0%) | 0 (0.0%) |
| Total | 43 (24.3%) | 23 (18.0%) |
Income Above Poverty by Sex and Age in St Michael
According to the poverty statistics in St Michael, males aged 5 years and females aged 5 years are the age groups that are most secure financially, with 100.0% of males and 100.0% of females in these age groups living above the poverty line.
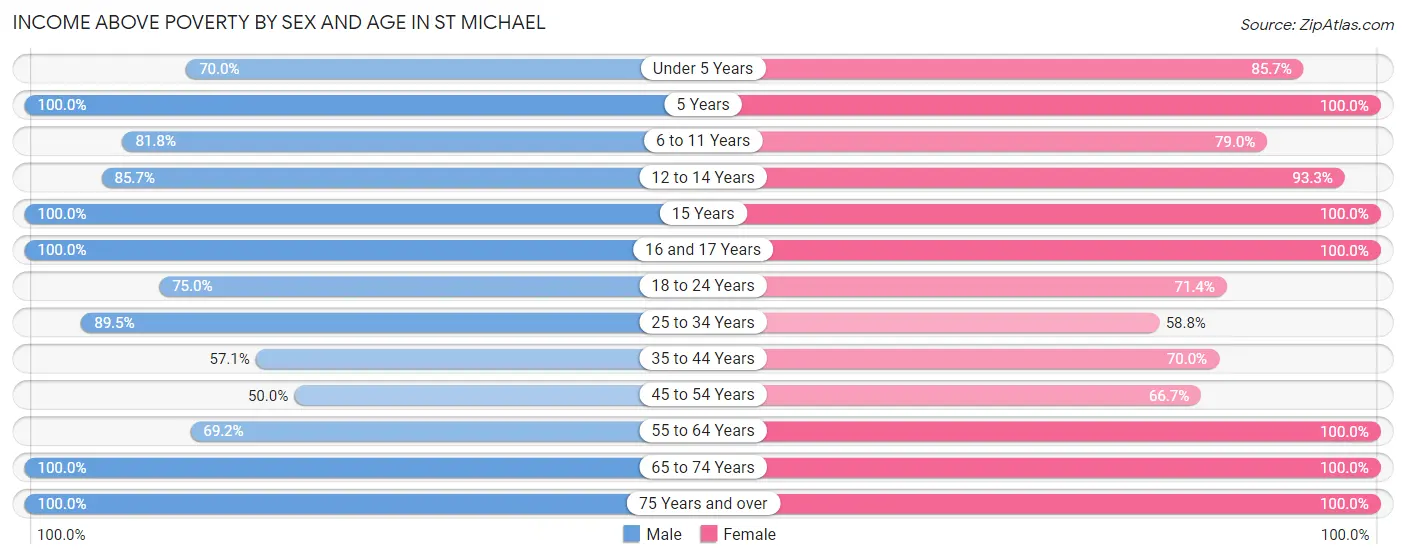
| Age Bracket | Male | Female |
| Under 5 Years | 14 (70.0%) | 12 (85.7%) |
| 5 Years | 2 (100.0%) | 4 (100.0%) |
| 6 to 11 Years | 18 (81.8%) | 15 (78.9%) |
| 12 to 14 Years | 12 (85.7%) | 14 (93.3%) |
| 15 Years | 3 (100.0%) | 4 (100.0%) |
| 16 and 17 Years | 10 (100.0%) | 10 (100.0%) |
| 18 to 24 Years | 21 (75.0%) | 10 (71.4%) |
| 25 to 34 Years | 17 (89.5%) | 10 (58.8%) |
| 35 to 44 Years | 16 (57.1%) | 7 (70.0%) |
| 45 to 54 Years | 6 (50.0%) | 4 (66.7%) |
| 55 to 64 Years | 9 (69.2%) | 6 (100.0%) |
| 65 to 74 Years | 4 (100.0%) | 8 (100.0%) |
| 75 Years and over | 2 (100.0%) | 1 (100.0%) |
| Total | 134 (75.7%) | 105 (82.0%) |
Income Below Poverty Among Married-Couple Families in St Michael
The poverty statistics for married-couple families in St Michael show that 13.0% or 3 of the total 23 families live below the poverty line. Families with 1 or 2 children have the highest poverty rate of 42.9%, comprising of 3 families. On the other hand, families with 3 or 4 children have the lowest poverty rate of 0.0%, which includes 0 families.
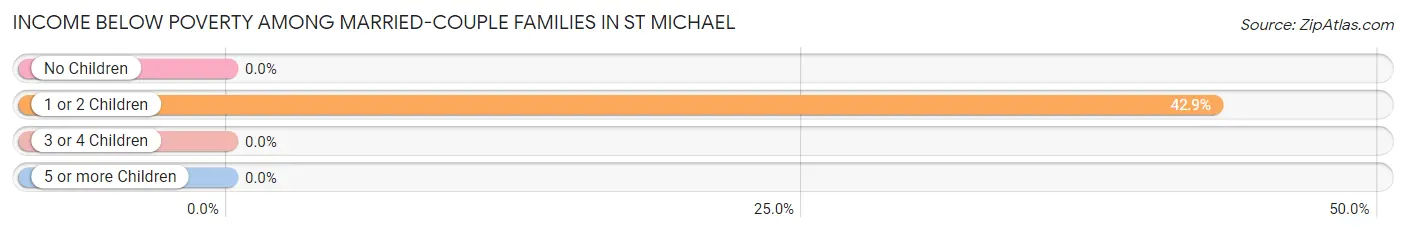
| Children | Above Poverty | Below Poverty |
| No Children | 0 (0.0%) | 0 (0.0%) |
| 1 or 2 Children | 4 (57.1%) | 3 (42.9%) |
| 3 or 4 Children | 6 (100.0%) | 0 (0.0%) |
| 5 or more Children | 10 (100.0%) | 0 (0.0%) |
| Total | 20 (87.0%) | 3 (13.0%) |
Income Below Poverty Among Single-Parent Households in St Michael
According to the poverty data in St Michael, 52.9% or 9 single-father households and 25.0% or 5 single-mother households are living below the poverty line. Among single-father households, those with 5 or more children have the highest poverty rate, with 3 households (100.0%) experiencing poverty. Likewise, among single-mother households, those with 1 or 2 children have the highest poverty rate, with 5 households (38.5%) falling below the poverty line.
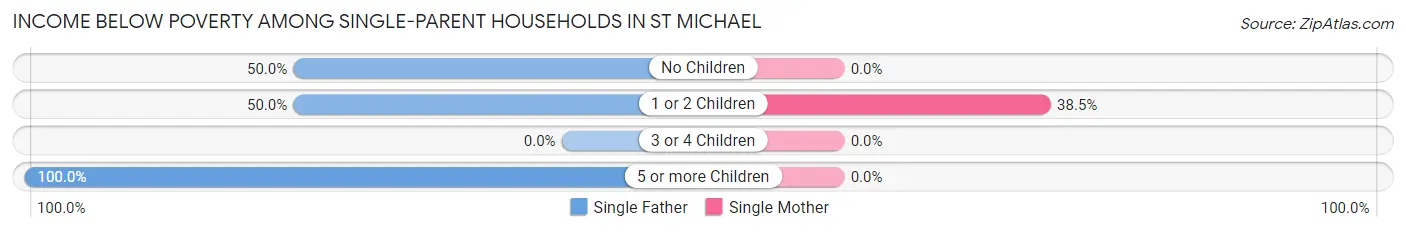
| Children | Single Father | Single Mother |
| No Children | 3 (50.0%) | 0 (0.0%) |
| 1 or 2 Children | 3 (50.0%) | 5 (38.5%) |
| 3 or 4 Children | 0 (0.0%) | 0 (0.0%) |
| 5 or more Children | 3 (100.0%) | 0 (0.0%) |
| Total | 9 (52.9%) | 5 (25.0%) |
Income Below Poverty Among Married-Couple vs Single-Parent Households in St Michael
The poverty data for St Michael shows that 3 of the married-couple family households (13.0%) and 14 of the single-parent households (37.8%) are living below the poverty level. Within the married-couple family households, those with 1 or 2 children have the highest poverty rate, with 3 households (42.9%) falling below the poverty line. Among the single-parent households, those with 5 or more children have the highest poverty rate, with 3 household (60.0%) living below poverty.
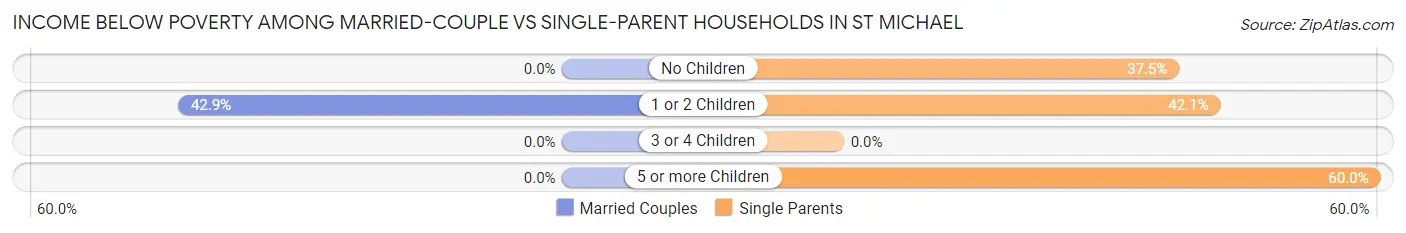
| Children | Married-Couple Families | Single-Parent Households |
| No Children | 0 (0.0%) | 3 (37.5%) |
| 1 or 2 Children | 3 (42.9%) | 8 (42.1%) |
| 3 or 4 Children | 0 (0.0%) | 0 (0.0%) |
| 5 or more Children | 0 (0.0%) | 3 (60.0%) |
| Total | 3 (13.0%) | 14 (37.8%) |
Employment Characteristics in St Michael
Employment by Class of Employer in St Michael
Among the 61 employed individuals in St Michael, local government employees (31 | 50.8%), private company employees (18 | 29.5%), and state government employees (6 | 9.8%) make up the most common classes of employment.
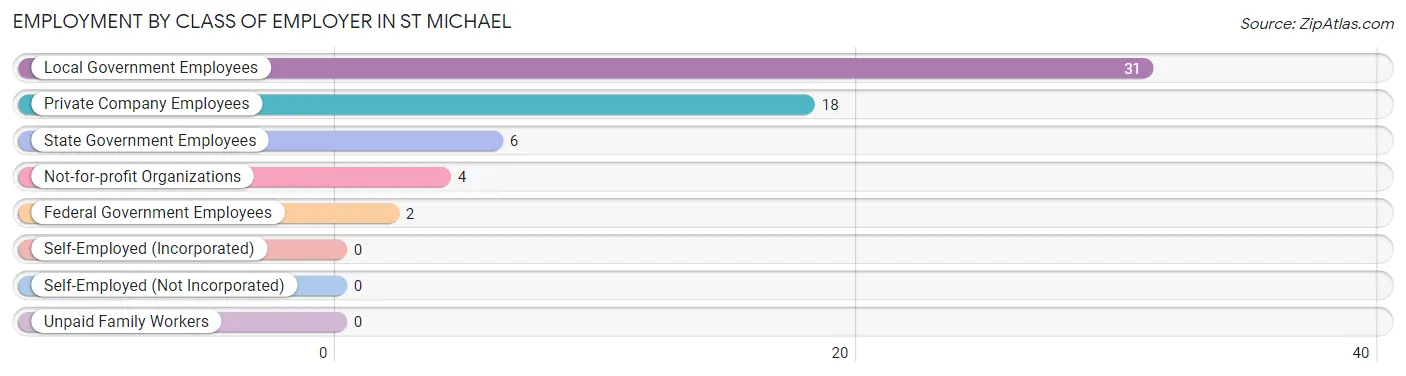
| Employer Class | # Employees | % Employees |
| Private Company Employees | 18 | 29.5% |
| Self-Employed (Incorporated) | 0 | 0.0% |
| Self-Employed (Not Incorporated) | 0 | 0.0% |
| Not-for-profit Organizations | 4 | 6.6% |
| Local Government Employees | 31 | 50.8% |
| State Government Employees | 6 | 9.8% |
| Federal Government Employees | 2 | 3.3% |
| Unpaid Family Workers | 0 | 0.0% |
| Total | 61 | 100.0% |
Employment Status by Age in St Michael
According to the labor force statistics for St Michael, out of the total population over 16 years of age (188), 59.0% or 111 individuals are in the labor force, with 36.9% or 41 of them unemployed. The age group with the highest labor force participation rate is 25 to 29 years, with 100.0% or 22 individuals in the labor force. Within the labor force, the 30 to 34 years age range has the highest percentage of unemployed individuals, with 80.0% or 4 of them being unemployed.
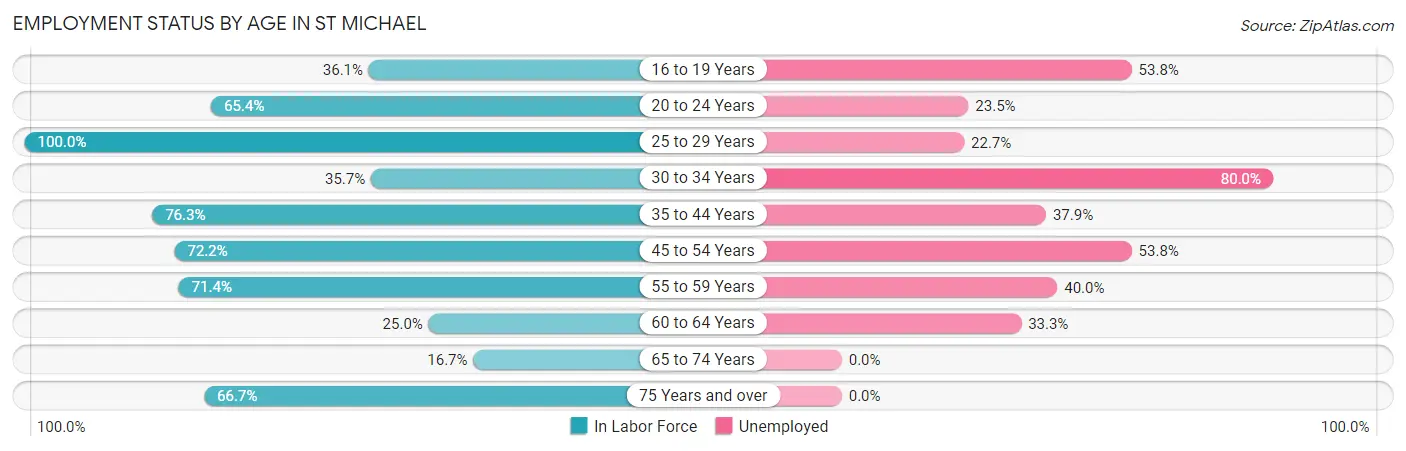
| Age Bracket | In Labor Force | Unemployed |
| 16 to 19 Years | 13 (36.1%) | 7 (53.8%) |
| 20 to 24 Years | 17 (65.4%) | 4 (23.5%) |
| 25 to 29 Years | 22 (100.0%) | 5 (22.7%) |
| 30 to 34 Years | 5 (35.7%) | 4 (80.0%) |
| 35 to 44 Years | 29 (76.3%) | 11 (37.9%) |
| 45 to 54 Years | 13 (72.2%) | 7 (53.8%) |
| 55 to 59 Years | 5 (71.4%) | 2 (40.0%) |
| 60 to 64 Years | 3 (25.0%) | 1 (33.3%) |
| 65 to 74 Years | 2 (16.7%) | 0 (0.0%) |
| 75 Years and over | 2 (66.7%) | 0 (0.0%) |
| Total | 111 (59.0%) | 41 (36.9%) |
Employment Status by Educational Attainment in St Michael
According to labor force statistics for St Michael, 69.4% of individuals (77) out of the total population between 25 and 64 years of age (111) are in the labor force, with 39.0% or 30 of them being unemployed. The group with the highest labor force participation rate are those with the educational attainment of bachelor's degree or higher, with 100.0% or 3 individuals in the labor force. Within the labor force, individuals with less than high school education have the highest percentage of unemployment, with 100.0% or 3 of them being unemployed.
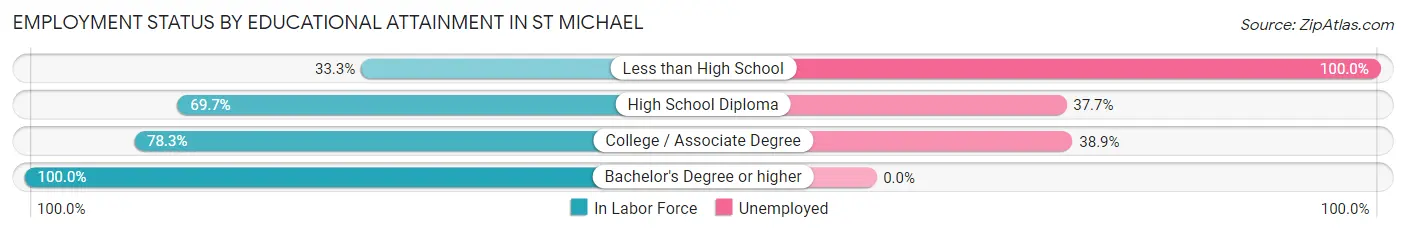
| Educational Attainment | In Labor Force | Unemployed |
| Less than High School | 3 (33.3%) | 9 (100.0%) |
| High School Diploma | 53 (69.7%) | 29 (37.7%) |
| College / Associate Degree | 18 (78.3%) | 9 (38.9%) |
| Bachelor's Degree or higher | 3 (100.0%) | 0 (0.0%) |
| Total | 77 (69.4%) | 43 (39.0%) |
Employment Occupations by Sex in St Michael
Management, Business, Science and Arts Occupations
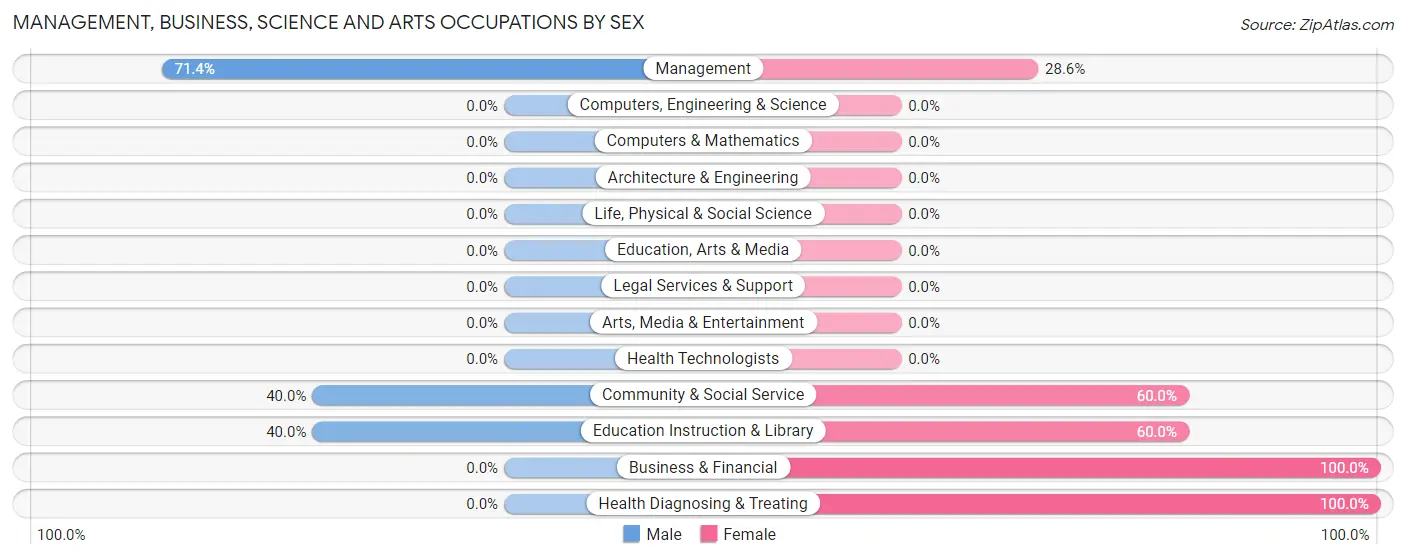
The most common Management, Business, Science and Arts occupations in St Michael are Community & Social Service (10 | 14.3%), Education Instruction & Library (10 | 14.3%), Management (7 | 10.0%), Business & Financial (2 | 2.9%), and Health Diagnosing & Treating (2 | 2.9%).
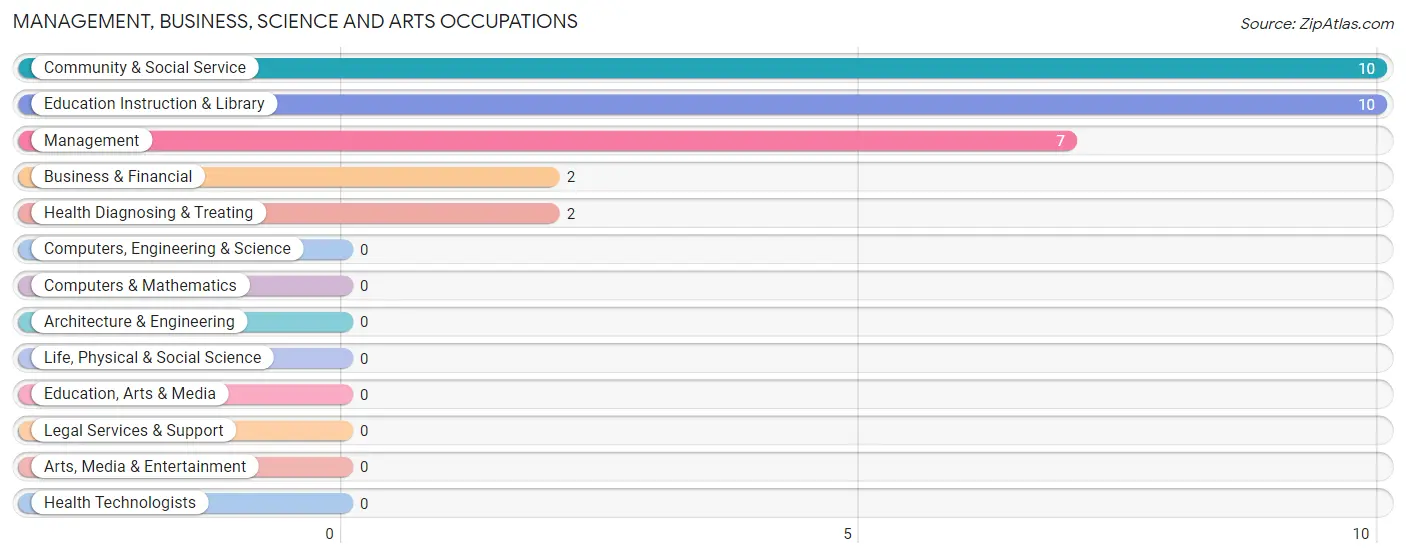
Management, Business, Science and Arts Occupations by Sex
Within the Management, Business, Science and Arts occupations in St Michael, the most male-oriented occupations are Management (71.4%), Community & Social Service (40.0%), and Education Instruction & Library (40.0%), while the most female-oriented occupations are Business & Financial (100.0%), Health Diagnosing & Treating (100.0%), and Community & Social Service (60.0%).
| Occupation | Male | Female |
| Management | 5 (71.4%) | 2 (28.6%) |
| Business & Financial | 0 (0.0%) | 2 (100.0%) |
| Computers, Engineering & Science | 0 (0.0%) | 0 (0.0%) |
| Computers & Mathematics | 0 (0.0%) | 0 (0.0%) |
| Architecture & Engineering | 0 (0.0%) | 0 (0.0%) |
| Life, Physical & Social Science | 0 (0.0%) | 0 (0.0%) |
| Community & Social Service | 4 (40.0%) | 6 (60.0%) |
| Education, Arts & Media | 0 (0.0%) | 0 (0.0%) |
| Legal Services & Support | 0 (0.0%) | 0 (0.0%) |
| Education Instruction & Library | 4 (40.0%) | 6 (60.0%) |
| Arts, Media & Entertainment | 0 (0.0%) | 0 (0.0%) |
| Health Diagnosing & Treating | 0 (0.0%) | 2 (100.0%) |
| Health Technologists | 0 (0.0%) | 0 (0.0%) |
| Total (Category) | 9 (42.9%) | 12 (57.1%) |
| Total (Overall) | 39 (55.7%) | 31 (44.3%) |
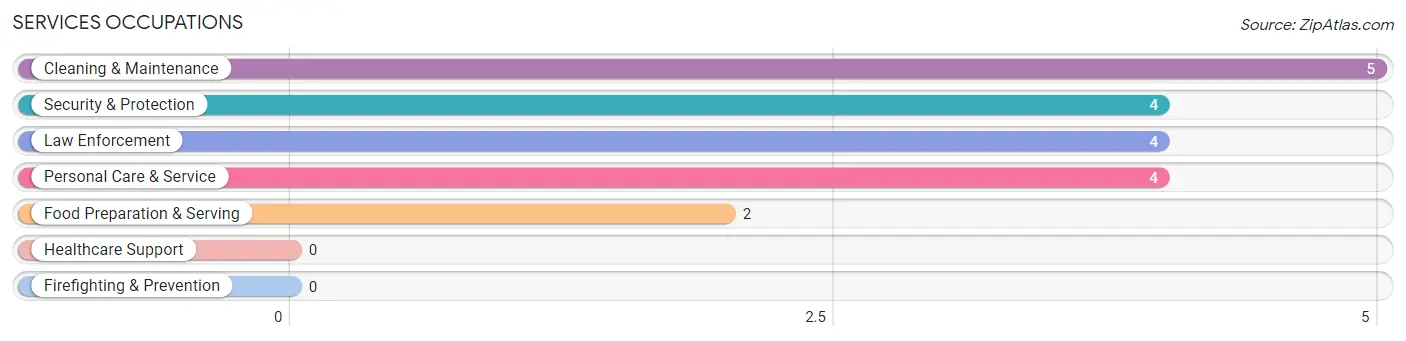
Services Occupations
The most common Services occupations in St Michael are Cleaning & Maintenance (5 | 7.1%), Security & Protection (4 | 5.7%), Law Enforcement (4 | 5.7%), Personal Care & Service (4 | 5.7%), and Food Preparation & Serving (2 | 2.9%).
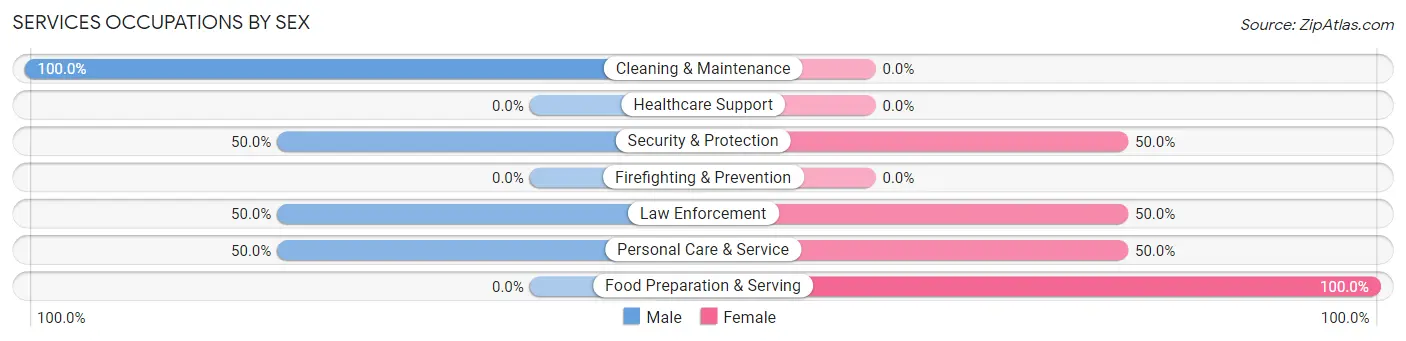
Services Occupations by Sex
Within the Services occupations in St Michael, the most male-oriented occupations are Cleaning & Maintenance (100.0%), Security & Protection (50.0%), and Law Enforcement (50.0%), while the most female-oriented occupations are Food Preparation & Serving (100.0%), Security & Protection (50.0%), and Law Enforcement (50.0%).
| Occupation | Male | Female |
| Healthcare Support | 0 (0.0%) | 0 (0.0%) |
| Security & Protection | 2 (50.0%) | 2 (50.0%) |
| Firefighting & Prevention | 0 (0.0%) | 0 (0.0%) |
| Law Enforcement | 2 (50.0%) | 2 (50.0%) |
| Food Preparation & Serving | 0 (0.0%) | 2 (100.0%) |
| Cleaning & Maintenance | 5 (100.0%) | 0 (0.0%) |
| Personal Care & Service | 2 (50.0%) | 2 (50.0%) |
| Total (Category) | 9 (60.0%) | 6 (40.0%) |
| Total (Overall) | 39 (55.7%) | 31 (44.3%) |
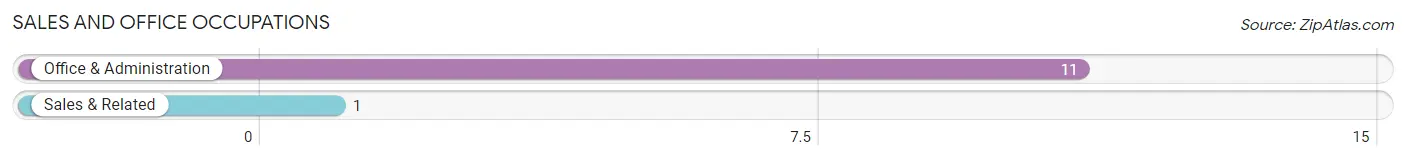
Sales and Office Occupations
The most common Sales and Office occupations in St Michael are Office & Administration (11 | 15.7%), and Sales & Related (1 | 1.4%).
Sales and Office Occupations by Sex
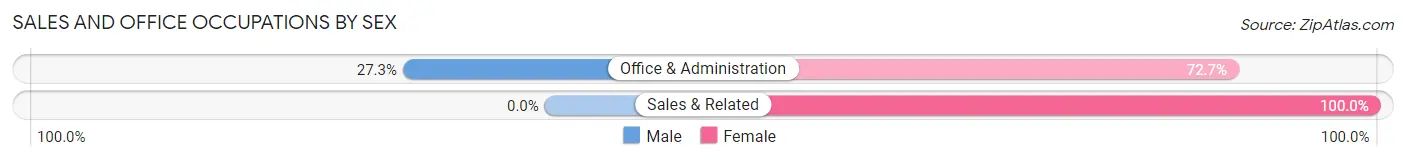
| Occupation | Male | Female |
| Sales & Related | 0 (0.0%) | 1 (100.0%) |
| Office & Administration | 3 (27.3%) | 8 (72.7%) |
| Total (Category) | 3 (25.0%) | 9 (75.0%) |
| Total (Overall) | 39 (55.7%) | 31 (44.3%) |
Natural Resources, Construction and Maintenance Occupations
The most common Natural Resources, Construction and Maintenance occupations in St Michael are , and Construction & Extraction (3 | 4.3%).
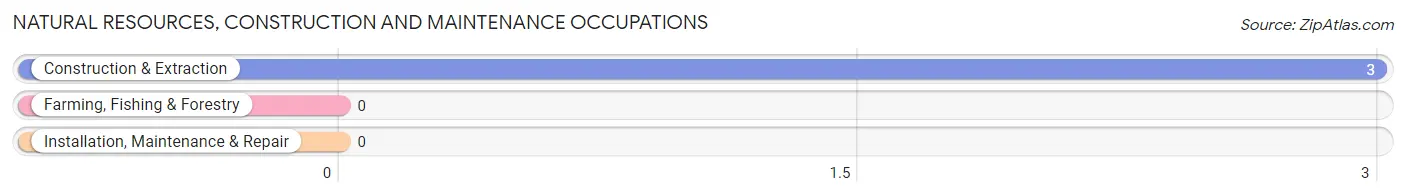
Natural Resources, Construction and Maintenance Occupations by Sex
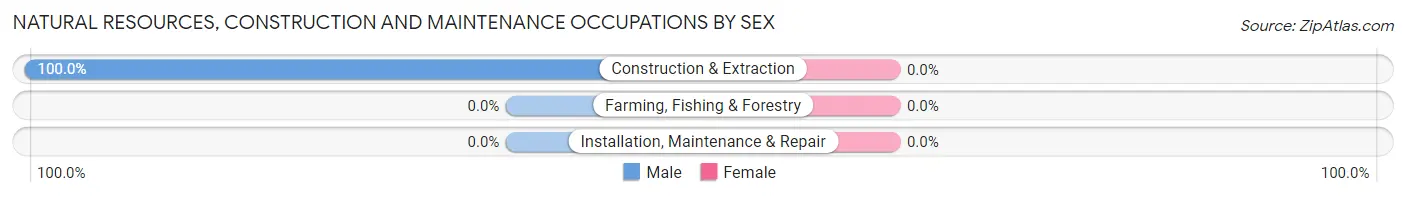
| Occupation | Male | Female |
| Farming, Fishing & Forestry | 0 (0.0%) | 0 (0.0%) |
| Construction & Extraction | 3 (100.0%) | 0 (0.0%) |
| Installation, Maintenance & Repair | 0 (0.0%) | 0 (0.0%) |
| Total (Category) | 3 (100.0%) | 0 (0.0%) |
| Total (Overall) | 39 (55.7%) | 31 (44.3%) |
Production, Transportation and Moving Occupations
The most common Production, Transportation and Moving occupations in St Michael are Production (8 | 11.4%), Material Moving (7 | 10.0%), and Transportation (4 | 5.7%).
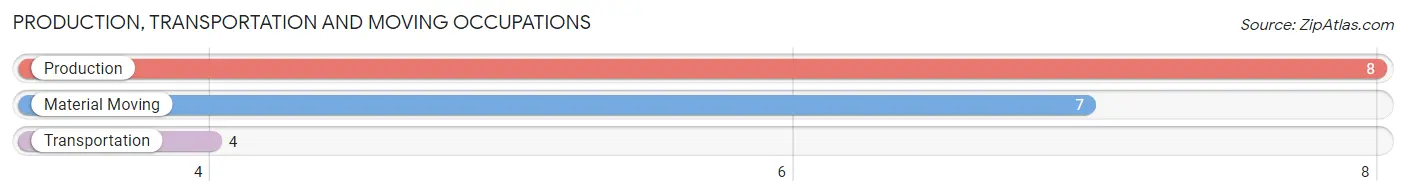
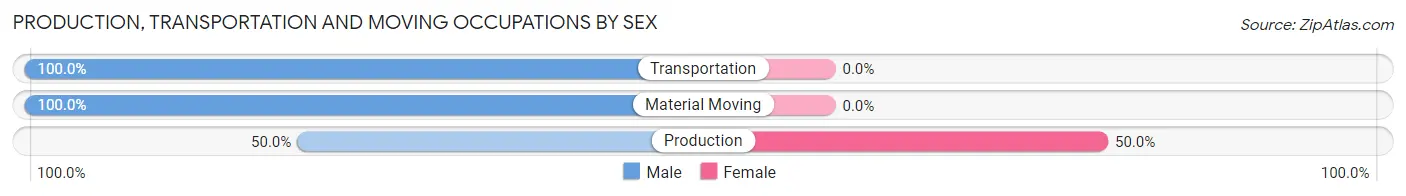
Production, Transportation and Moving Occupations by Sex
| Occupation | Male | Female |
| Production | 4 (50.0%) | 4 (50.0%) |
| Transportation | 4 (100.0%) | 0 (0.0%) |
| Material Moving | 7 (100.0%) | 0 (0.0%) |
| Total (Category) | 15 (78.9%) | 4 (21.0%) |
| Total (Overall) | 39 (55.7%) | 31 (44.3%) |
Employment Industries by Sex in St Michael
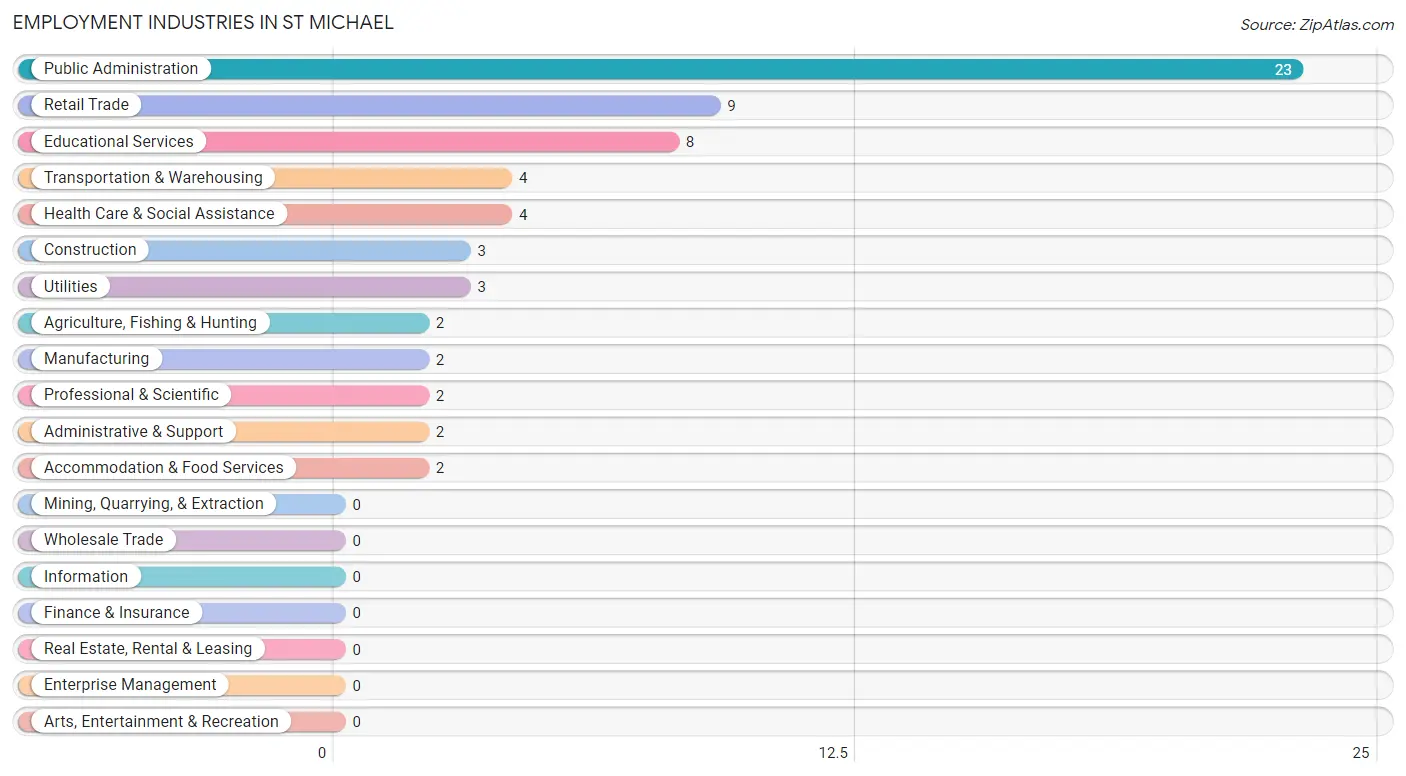
Employment Industries in St Michael
The major employment industries in St Michael include Public Administration (23 | 32.9%), Retail Trade (9 | 12.9%), Educational Services (8 | 11.4%), Transportation & Warehousing (4 | 5.7%), and Health Care & Social Assistance (4 | 5.7%).
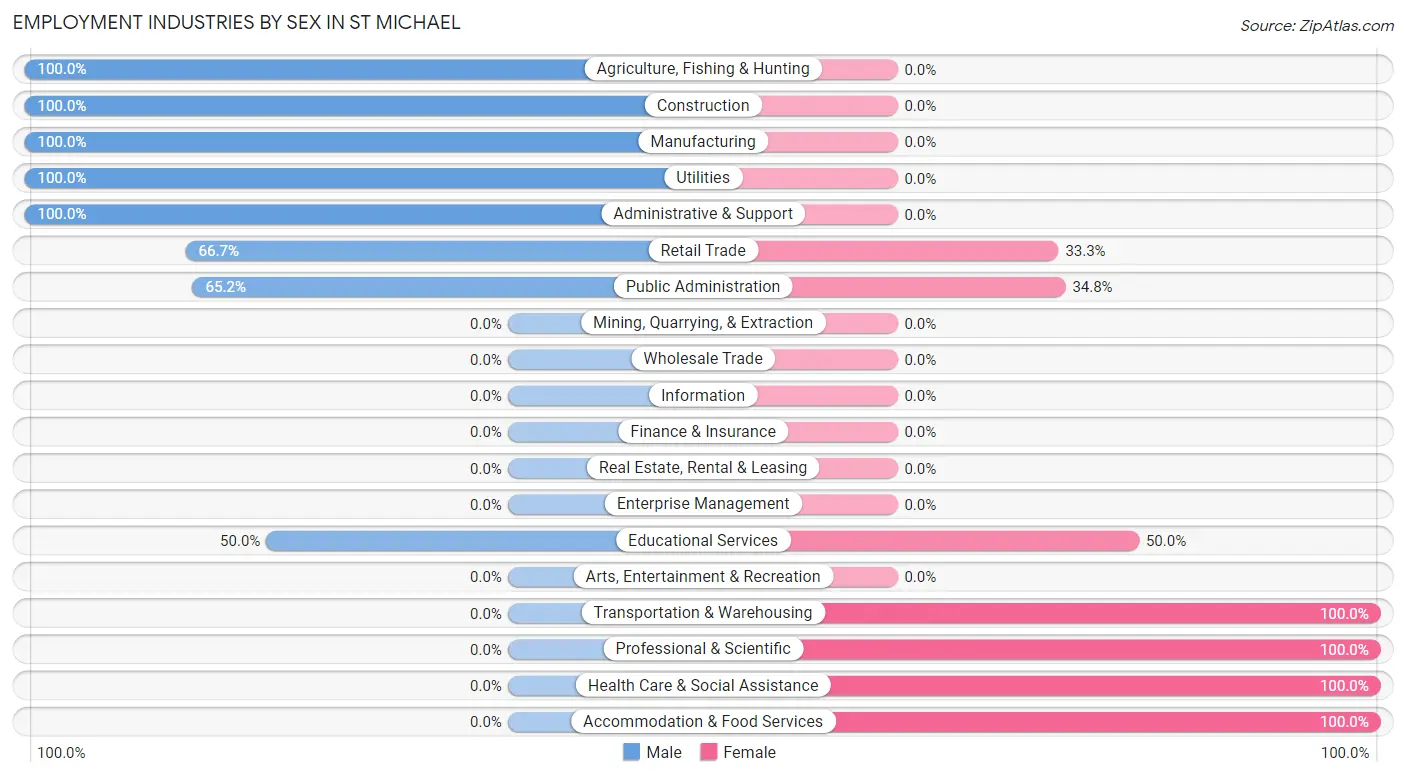
Employment Industries by Sex in St Michael
The St Michael industries that see more men than women are Agriculture, Fishing & Hunting (100.0%), Construction (100.0%), and Manufacturing (100.0%), whereas the industries that tend to have a higher number of women are Transportation & Warehousing (100.0%), Professional & Scientific (100.0%), and Health Care & Social Assistance (100.0%).
| Industry | Male | Female |
| Agriculture, Fishing & Hunting | 2 (100.0%) | 0 (0.0%) |
| Mining, Quarrying, & Extraction | 0 (0.0%) | 0 (0.0%) |
| Construction | 3 (100.0%) | 0 (0.0%) |
| Manufacturing | 2 (100.0%) | 0 (0.0%) |
| Wholesale Trade | 0 (0.0%) | 0 (0.0%) |
| Retail Trade | 6 (66.7%) | 3 (33.3%) |
| Transportation & Warehousing | 0 (0.0%) | 4 (100.0%) |
| Utilities | 3 (100.0%) | 0 (0.0%) |
| Information | 0 (0.0%) | 0 (0.0%) |
| Finance & Insurance | 0 (0.0%) | 0 (0.0%) |
| Real Estate, Rental & Leasing | 0 (0.0%) | 0 (0.0%) |
| Professional & Scientific | 0 (0.0%) | 2 (100.0%) |
| Enterprise Management | 0 (0.0%) | 0 (0.0%) |
| Administrative & Support | 2 (100.0%) | 0 (0.0%) |
| Educational Services | 4 (50.0%) | 4 (50.0%) |
| Health Care & Social Assistance | 0 (0.0%) | 4 (100.0%) |
| Arts, Entertainment & Recreation | 0 (0.0%) | 0 (0.0%) |
| Accommodation & Food Services | 0 (0.0%) | 2 (100.0%) |
| Public Administration | 15 (65.2%) | 8 (34.8%) |
| Total | 39 (55.7%) | 31 (44.3%) |
Education in St Michael
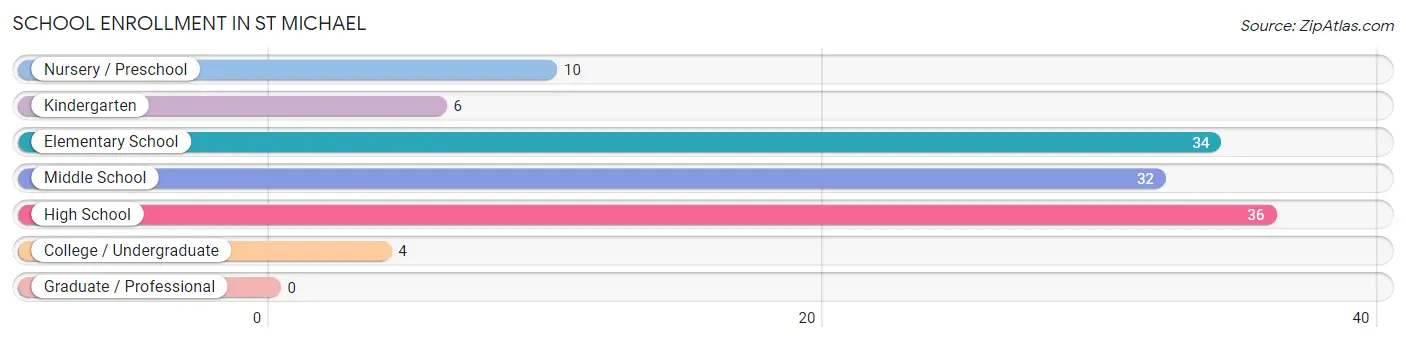
School Enrollment in St Michael
The most common levels of schooling among the 122 students in St Michael are high school (36 | 29.5%), elementary school (34 | 27.9%), and middle school (32 | 26.2%).
| School Level | # Students | % Students |
| Nursery / Preschool | 10 | 8.2% |
| Kindergarten | 6 | 4.9% |
| Elementary School | 34 | 27.9% |
| Middle School | 32 | 26.2% |
| High School | 36 | 29.5% |
| College / Undergraduate | 4 | 3.3% |
| Graduate / Professional | 0 | 0.0% |
| Total | 122 | 100.0% |
School Enrollment by Age by Funding Source in St Michael
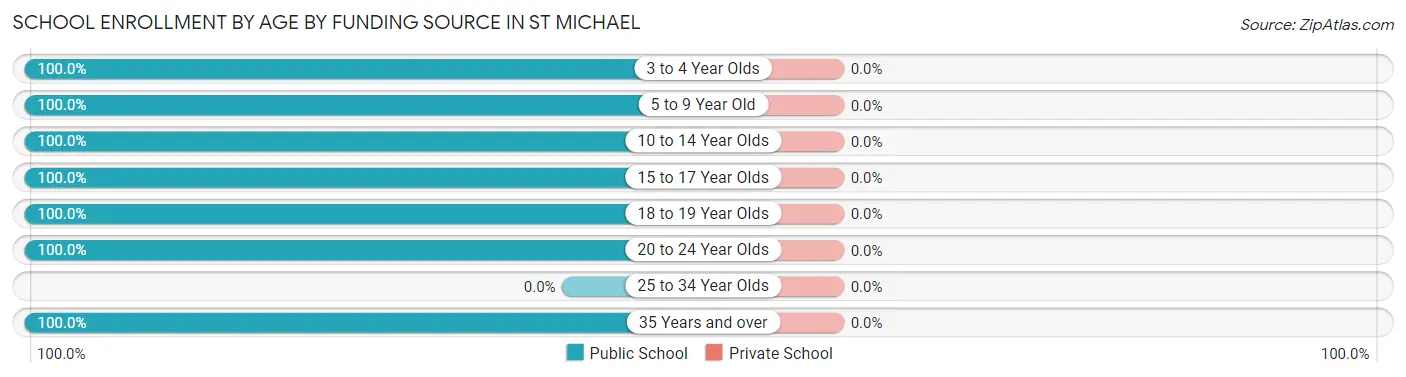
| Age Bracket | Public School | Private School |
| 3 to 4 Year Olds | 12 (100.0%) | 0 (0.0%) |
| 5 to 9 Year Old | 36 (100.0%) | 0 (0.0%) |
| 10 to 14 Year Olds | 41 (100.0%) | 0 (0.0%) |
| 15 to 17 Year Olds | 27 (100.0%) | 0 (0.0%) |
| 18 to 19 Year Olds | 2 (100.0%) | 0 (0.0%) |
| 20 to 24 Year Olds | 2 (100.0%) | 0 (0.0%) |
| 25 to 34 Year Olds | 0 (0.0%) | 0 (0.0%) |
| 35 Years and over | 2 (100.0%) | 0 (0.0%) |
| Total | 122 (100.0%) | 0 (0.0%) |
Educational Attainment by Field of Study in St Michael
Education (2 | 66.7%), and psychology (1 | 33.3%) are the most common fields of study among 3 individuals in St Michael who have obtained a bachelor's degree or higher.
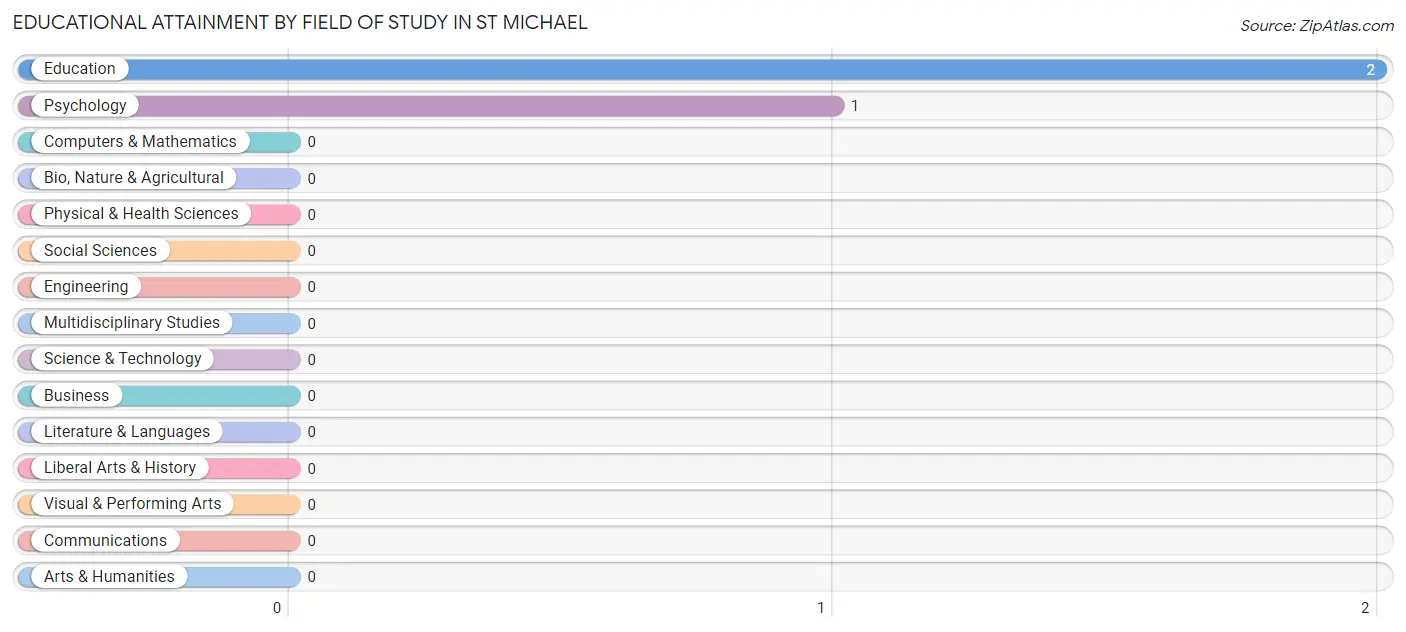
| Field of Study | # Graduates | % Graduates |
| Computers & Mathematics | 0 | 0.0% |
| Bio, Nature & Agricultural | 0 | 0.0% |
| Physical & Health Sciences | 0 | 0.0% |
| Psychology | 1 | 33.3% |
| Social Sciences | 0 | 0.0% |
| Engineering | 0 | 0.0% |
| Multidisciplinary Studies | 0 | 0.0% |
| Science & Technology | 0 | 0.0% |
| Business | 0 | 0.0% |
| Education | 2 | 66.7% |
| Literature & Languages | 0 | 0.0% |
| Liberal Arts & History | 0 | 0.0% |
| Visual & Performing Arts | 0 | 0.0% |
| Communications | 0 | 0.0% |
| Arts & Humanities | 0 | 0.0% |
| Total | 3 | 100.0% |
Transportation & Commute in St Michael
Vehicle Availability by Sex in St Michael
The most prevalent vehicle ownership categories in St Michael are males with no vehicle (36, accounting for 100.0%) and females with no vehicle (24, making up 144.0%).
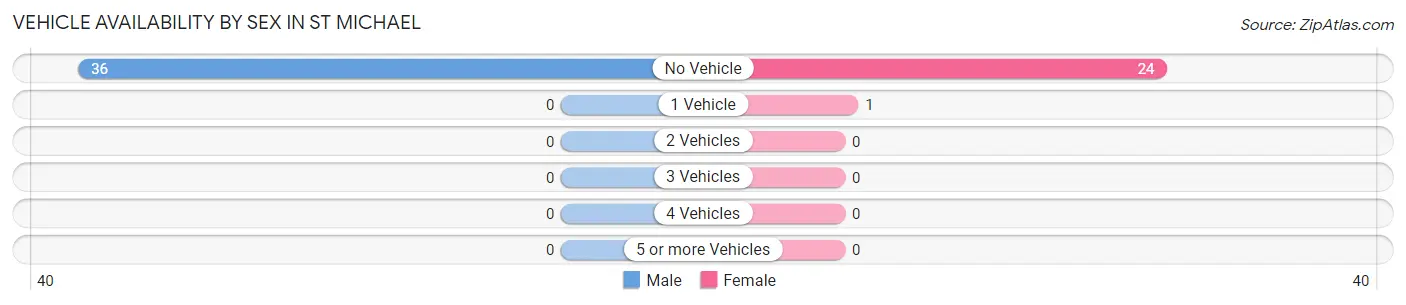
| Vehicles Available | Male | Female |
| No Vehicle | 36 (100.0%) | 24 (96.0%) |
| 1 Vehicle | 0 (0.0%) | 1 (4.0%) |
| 2 Vehicles | 0 (0.0%) | 0 (0.0%) |
| 3 Vehicles | 0 (0.0%) | 0 (0.0%) |
| 4 Vehicles | 0 (0.0%) | 0 (0.0%) |
| 5 or more Vehicles | 0 (0.0%) | 0 (0.0%) |
| Total | 36 (100.0%) | 25 (100.0%) |
Commute Time in St Michael
The most frequently occuring commute durations in St Michael are less than 5 minutes (24 commuters, 42.1%), 5 to 9 minutes (19 commuters, 33.3%), and 10 to 14 minutes (9 commuters, 15.8%).
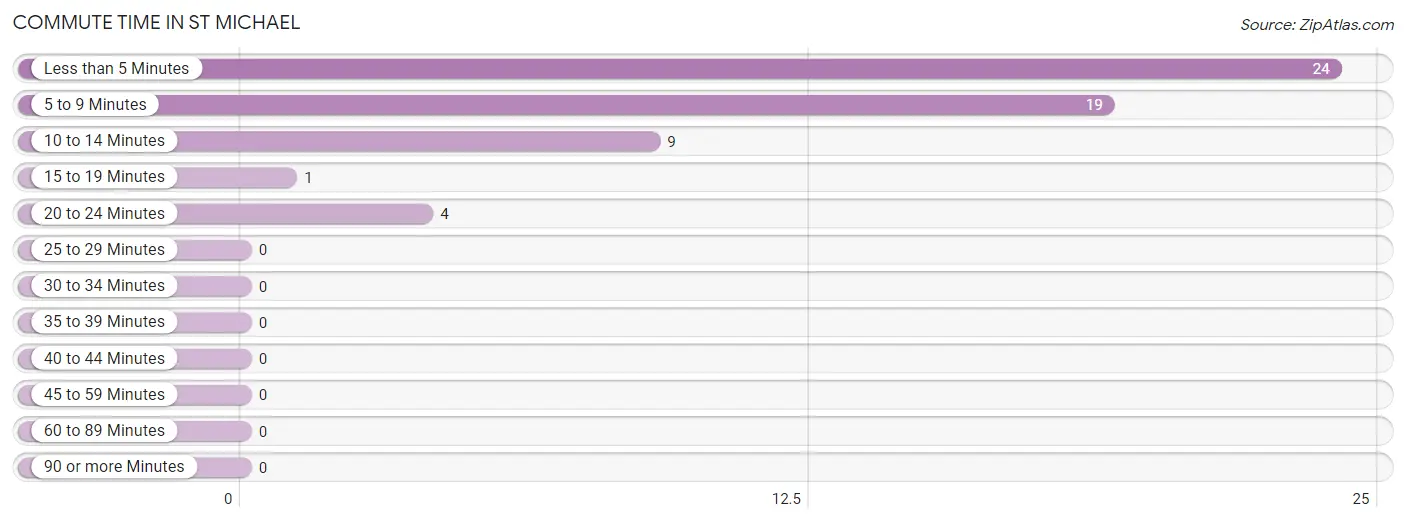
| Commute Time | # Commuters | % Commuters |
| Less than 5 Minutes | 24 | 42.1% |
| 5 to 9 Minutes | 19 | 33.3% |
| 10 to 14 Minutes | 9 | 15.8% |
| 15 to 19 Minutes | 1 | 1.8% |
| 20 to 24 Minutes | 4 | 7.0% |
| 25 to 29 Minutes | 0 | 0.0% |
| 30 to 34 Minutes | 0 | 0.0% |
| 35 to 39 Minutes | 0 | 0.0% |
| 40 to 44 Minutes | 0 | 0.0% |
| 45 to 59 Minutes | 0 | 0.0% |
| 60 to 89 Minutes | 0 | 0.0% |
| 90 or more Minutes | 0 | 0.0% |
Commute Time by Sex in St Michael
The most common commute times in St Michael are less than 5 minutes (16 commuters, 47.1%) for males and less than 5 minutes (8 commuters, 34.8%) for females.
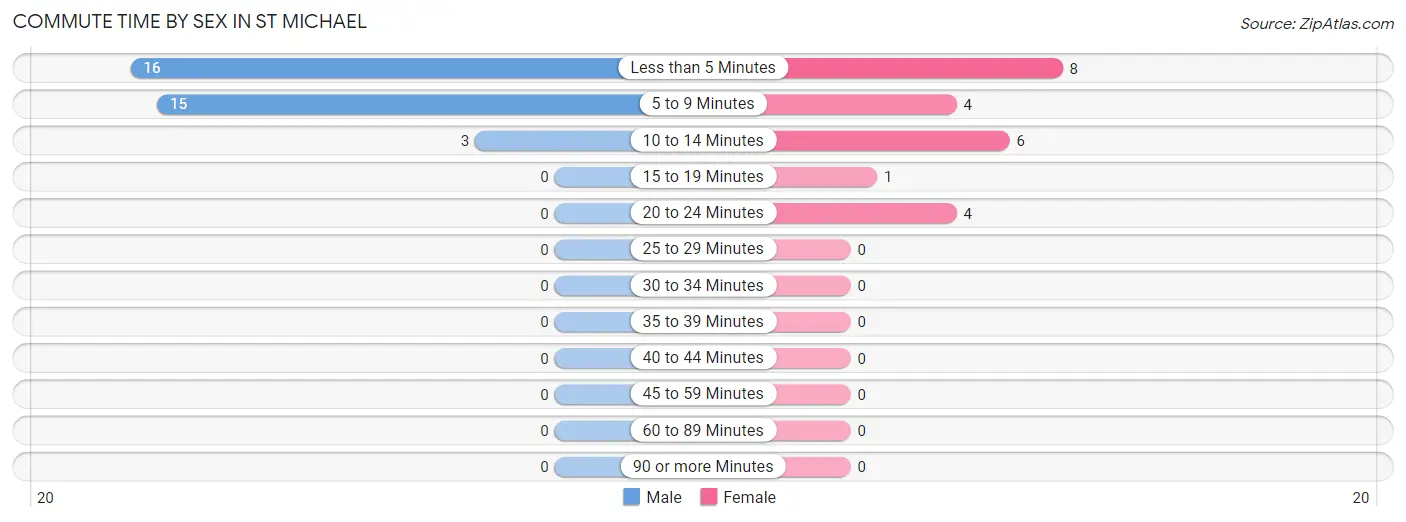
| Commute Time | Male | Female |
| Less than 5 Minutes | 16 (47.1%) | 8 (34.8%) |
| 5 to 9 Minutes | 15 (44.1%) | 4 (17.4%) |
| 10 to 14 Minutes | 3 (8.8%) | 6 (26.1%) |
| 15 to 19 Minutes | 0 (0.0%) | 1 (4.3%) |
| 20 to 24 Minutes | 0 (0.0%) | 4 (17.4%) |
| 25 to 29 Minutes | 0 (0.0%) | 0 (0.0%) |
| 30 to 34 Minutes | 0 (0.0%) | 0 (0.0%) |
| 35 to 39 Minutes | 0 (0.0%) | 0 (0.0%) |
| 40 to 44 Minutes | 0 (0.0%) | 0 (0.0%) |
| 45 to 59 Minutes | 0 (0.0%) | 0 (0.0%) |
| 60 to 89 Minutes | 0 (0.0%) | 0 (0.0%) |
| 90 or more Minutes | 0 (0.0%) | 0 (0.0%) |
Time of Departure to Work by Sex in St Michael
The most frequent times of departure to work in St Michael are 9:00 AM to 9:59 AM (12, 35.3%) for males and 8:30 AM to 8:59 AM (8, 34.8%) for females.
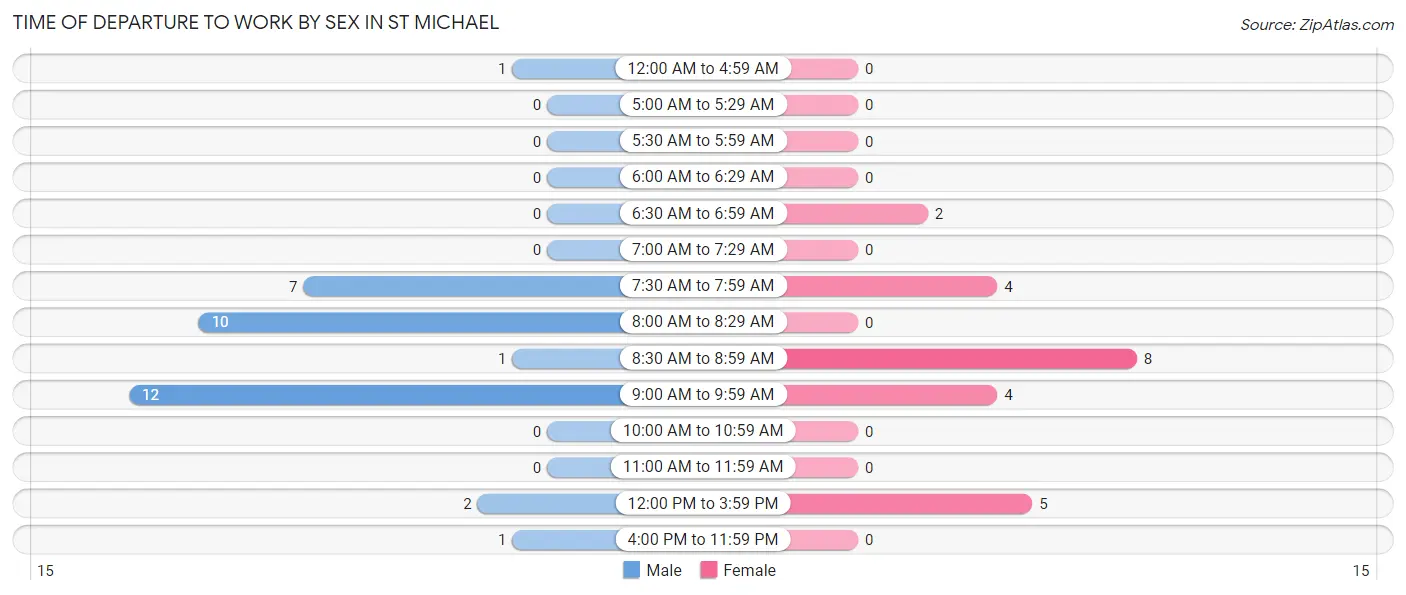
| Time of Departure | Male | Female |
| 12:00 AM to 4:59 AM | 1 (2.9%) | 0 (0.0%) |
| 5:00 AM to 5:29 AM | 0 (0.0%) | 0 (0.0%) |
| 5:30 AM to 5:59 AM | 0 (0.0%) | 0 (0.0%) |
| 6:00 AM to 6:29 AM | 0 (0.0%) | 0 (0.0%) |
| 6:30 AM to 6:59 AM | 0 (0.0%) | 2 (8.7%) |
| 7:00 AM to 7:29 AM | 0 (0.0%) | 0 (0.0%) |
| 7:30 AM to 7:59 AM | 7 (20.6%) | 4 (17.4%) |
| 8:00 AM to 8:29 AM | 10 (29.4%) | 0 (0.0%) |
| 8:30 AM to 8:59 AM | 1 (2.9%) | 8 (34.8%) |
| 9:00 AM to 9:59 AM | 12 (35.3%) | 4 (17.4%) |
| 10:00 AM to 10:59 AM | 0 (0.0%) | 0 (0.0%) |
| 11:00 AM to 11:59 AM | 0 (0.0%) | 0 (0.0%) |
| 12:00 PM to 3:59 PM | 2 (5.9%) | 5 (21.7%) |
| 4:00 PM to 11:59 PM | 1 (2.9%) | 0 (0.0%) |
| Total | 34 (100.0%) | 23 (100.0%) |
Housing Occupancy in St Michael
Occupancy by Ownership in St Michael
Of the total 65 dwellings in St Michael, owner-occupied units account for 41 (63.1%), while renter-occupied units make up 24 (36.9%).
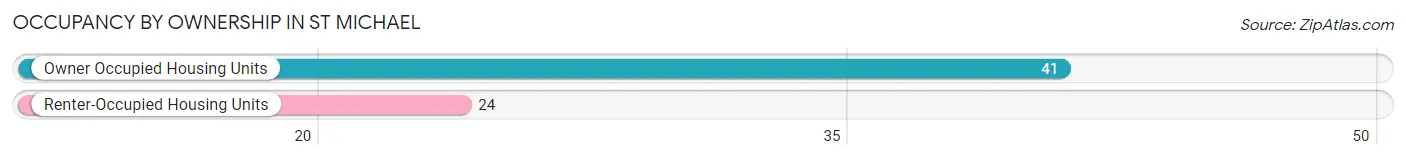
| Occupancy | # Housing Units | % Housing Units |
| Owner Occupied Housing Units | 41 | 63.1% |
| Renter-Occupied Housing Units | 24 | 36.9% |
| Total Occupied Housing Units | 65 | 100.0% |
Occupancy by Household Size in St Michael
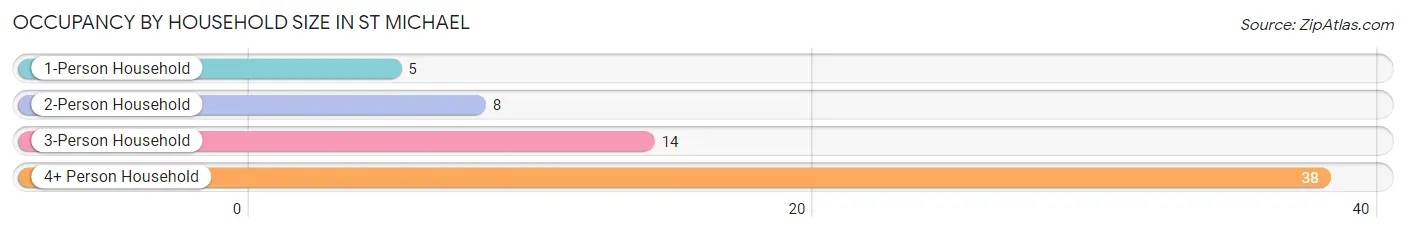
| Household Size | # Housing Units | % Housing Units |
| 1-Person Household | 5 | 7.7% |
| 2-Person Household | 8 | 12.3% |
| 3-Person Household | 14 | 21.5% |
| 4+ Person Household | 38 | 58.5% |
| Total Housing Units | 65 | 100.0% |
Occupancy by Ownership by Household Size in St Michael
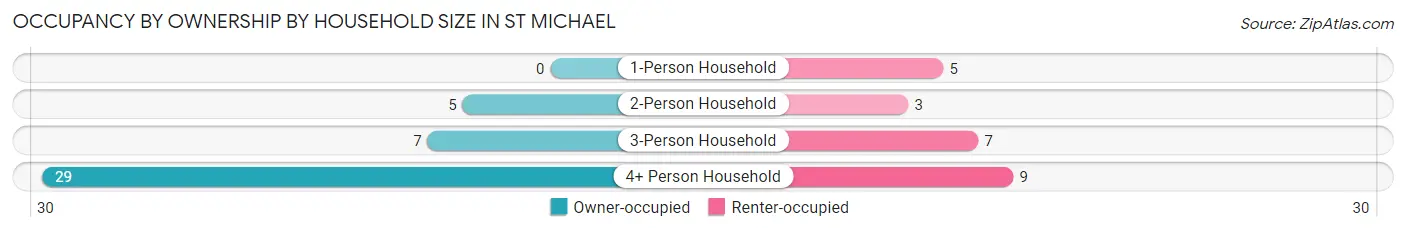
| Household Size | Owner-occupied | Renter-occupied |
| 1-Person Household | 0 (0.0%) | 5 (100.0%) |
| 2-Person Household | 5 (62.5%) | 3 (37.5%) |
| 3-Person Household | 7 (50.0%) | 7 (50.0%) |
| 4+ Person Household | 29 (76.3%) | 9 (23.7%) |
| Total Housing Units | 41 (63.1%) | 24 (36.9%) |
Occupancy by Educational Attainment in St Michael
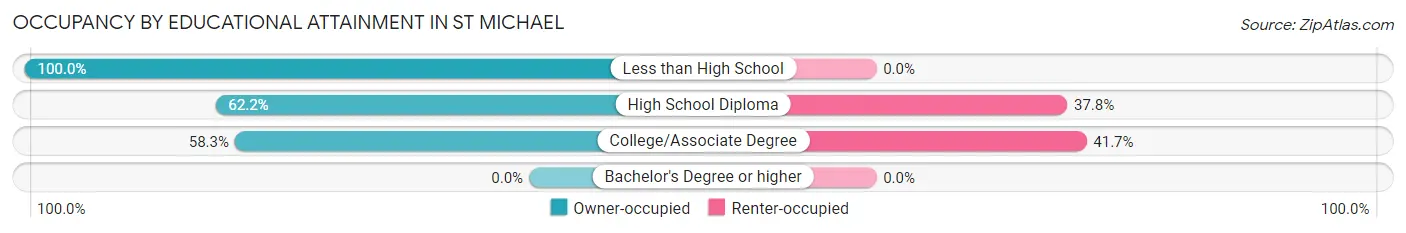
| Household Size | Owner-occupied | Renter-occupied |
| Less than High School | 4 (100.0%) | 0 (0.0%) |
| High School Diploma | 23 (62.2%) | 14 (37.8%) |
| College/Associate Degree | 14 (58.3%) | 10 (41.7%) |
| Bachelor's Degree or higher | 0 (0.0%) | 0 (0.0%) |
Occupancy by Age of Householder in St Michael
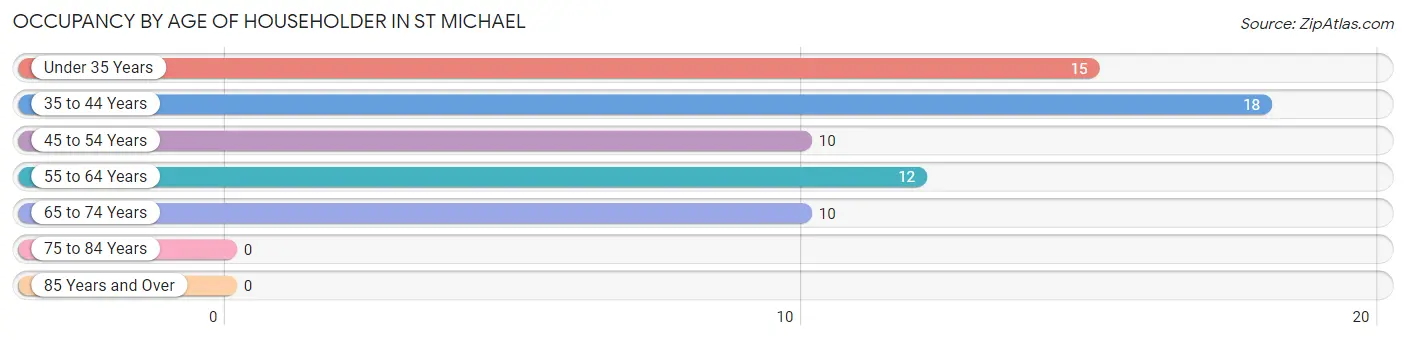
| Age Bracket | # Households | % Households |
| Under 35 Years | 15 | 23.1% |
| 35 to 44 Years | 18 | 27.7% |
| 45 to 54 Years | 10 | 15.4% |
| 55 to 64 Years | 12 | 18.5% |
| 65 to 74 Years | 10 | 15.4% |
| 75 to 84 Years | 0 | 0.0% |
| 85 Years and Over | 0 | 0.0% |
| Total | 65 | 100.0% |
Housing Finances in St Michael
Median Income by Occupancy in St Michael
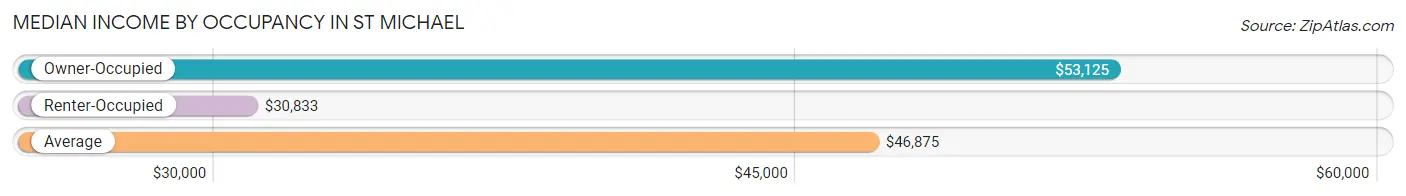
| Occupancy Type | # Households | Median Income |
| Owner-Occupied | 41 (63.1%) | $53,125 |
| Renter-Occupied | 24 (36.9%) | $30,833 |
| Average | 65 (100.0%) | $46,875 |
Occupancy by Householder Income Bracket in St Michael
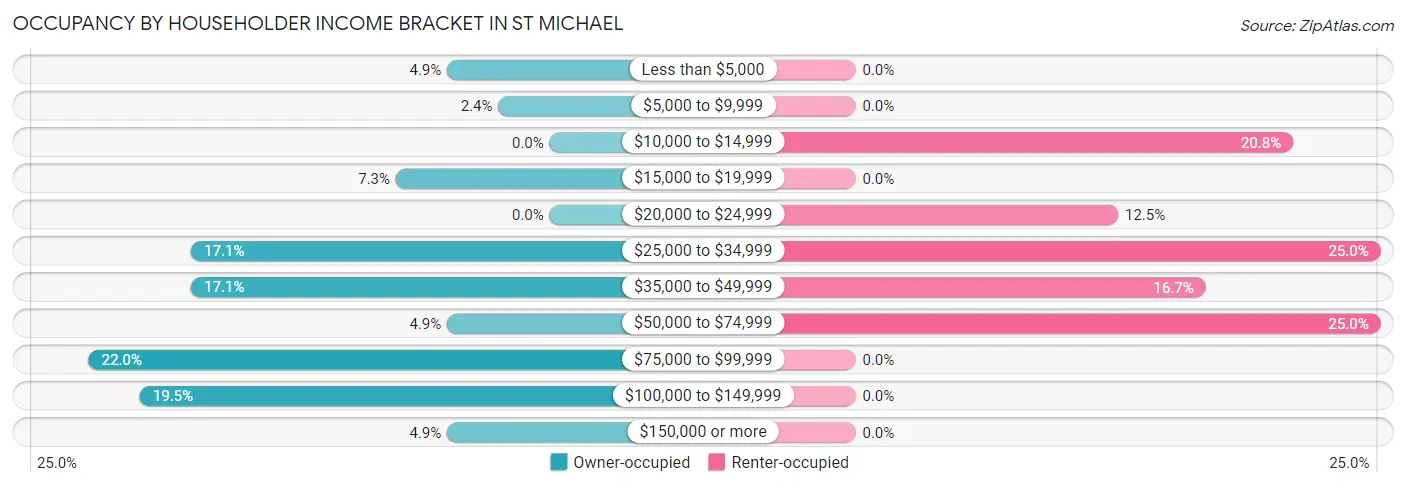
| Income Bracket | Owner-occupied | Renter-occupied |
| Less than $5,000 | 2 (4.9%) | 0 (0.0%) |
| $5,000 to $9,999 | 1 (2.4%) | 0 (0.0%) |
| $10,000 to $14,999 | 0 (0.0%) | 5 (20.8%) |
| $15,000 to $19,999 | 3 (7.3%) | 0 (0.0%) |
| $20,000 to $24,999 | 0 (0.0%) | 3 (12.5%) |
| $25,000 to $34,999 | 7 (17.1%) | 6 (25.0%) |
| $35,000 to $49,999 | 7 (17.1%) | 4 (16.7%) |
| $50,000 to $74,999 | 2 (4.9%) | 6 (25.0%) |
| $75,000 to $99,999 | 9 (22.0%) | 0 (0.0%) |
| $100,000 to $149,999 | 8 (19.5%) | 0 (0.0%) |
| $150,000 or more | 2 (4.9%) | 0 (0.0%) |
| Total | 41 (100.0%) | 24 (100.0%) |
Monthly Housing Cost Tiers in St Michael
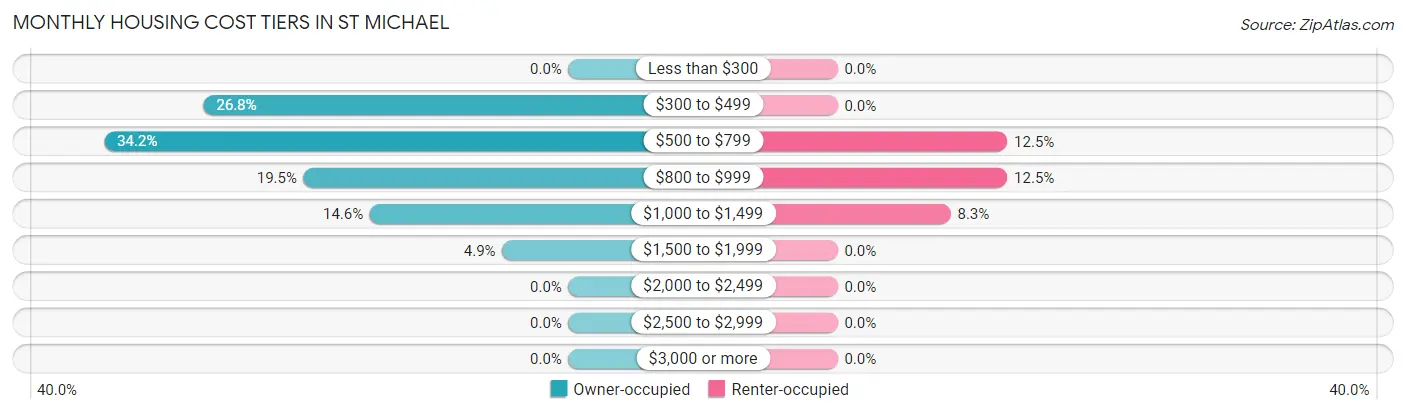
| Monthly Cost | Owner-occupied | Renter-occupied |
| Less than $300 | 0 (0.0%) | 0 (0.0%) |
| $300 to $499 | 11 (26.8%) | 0 (0.0%) |
| $500 to $799 | 14 (34.2%) | 3 (12.5%) |
| $800 to $999 | 8 (19.5%) | 3 (12.5%) |
| $1,000 to $1,499 | 6 (14.6%) | 2 (8.3%) |
| $1,500 to $1,999 | 2 (4.9%) | 0 (0.0%) |
| $2,000 to $2,499 | 0 (0.0%) | 0 (0.0%) |
| $2,500 to $2,999 | 0 (0.0%) | 0 (0.0%) |
| $3,000 or more | 0 (0.0%) | 0 (0.0%) |
| Total | 41 (100.0%) | 24 (100.0%) |
Physical Housing Characteristics in St Michael
Housing Structures in St Michael
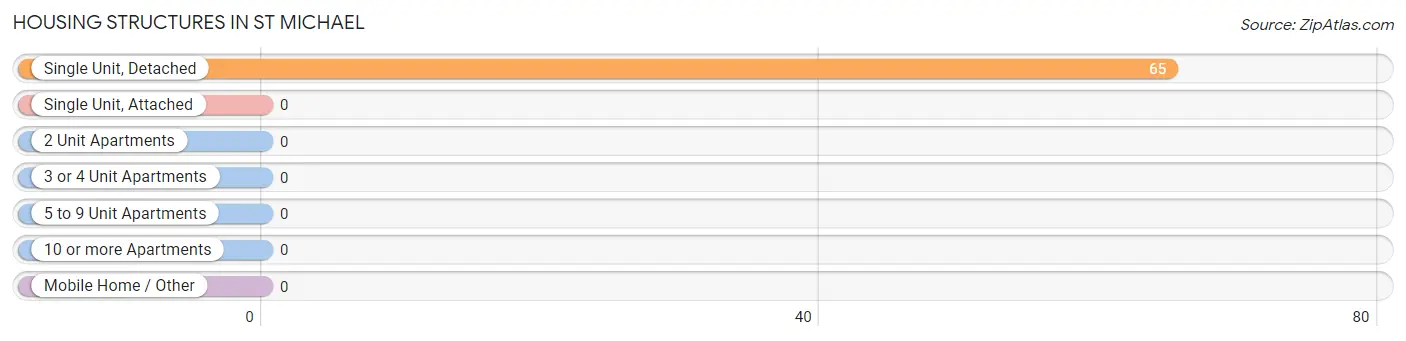
| Structure Type | # Housing Units | % Housing Units |
| Single Unit, Detached | 65 | 100.0% |
| Single Unit, Attached | 0 | 0.0% |
| 2 Unit Apartments | 0 | 0.0% |
| 3 or 4 Unit Apartments | 0 | 0.0% |
| 5 to 9 Unit Apartments | 0 | 0.0% |
| 10 or more Apartments | 0 | 0.0% |
| Mobile Home / Other | 0 | 0.0% |
| Total | 65 | 100.0% |
Housing Structures by Occupancy in St Michael
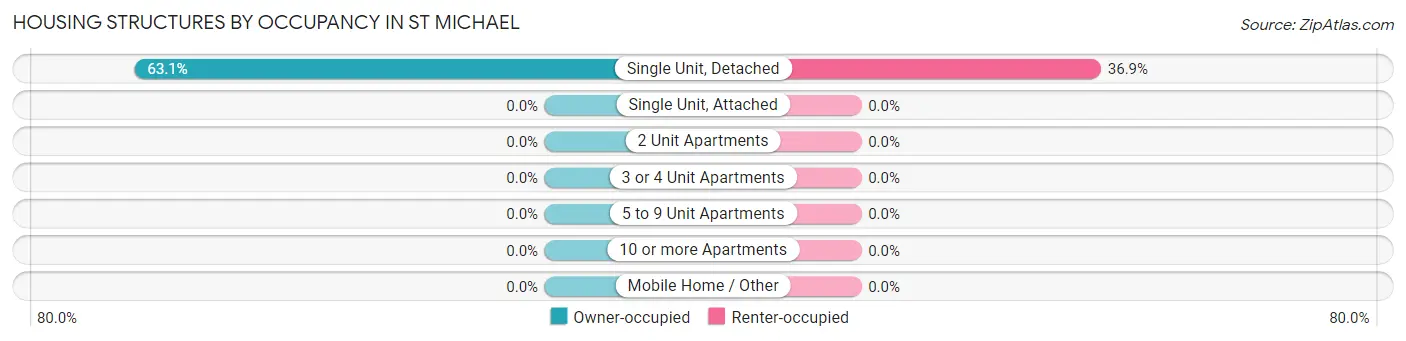
| Structure Type | Owner-occupied | Renter-occupied |
| Single Unit, Detached | 41 (63.1%) | 24 (36.9%) |
| Single Unit, Attached | 0 (0.0%) | 0 (0.0%) |
| 2 Unit Apartments | 0 (0.0%) | 0 (0.0%) |
| 3 or 4 Unit Apartments | 0 (0.0%) | 0 (0.0%) |
| 5 to 9 Unit Apartments | 0 (0.0%) | 0 (0.0%) |
| 10 or more Apartments | 0 (0.0%) | 0 (0.0%) |
| Mobile Home / Other | 0 (0.0%) | 0 (0.0%) |
| Total | 41 (63.1%) | 24 (36.9%) |
Housing Structures by Number of Rooms in St Michael
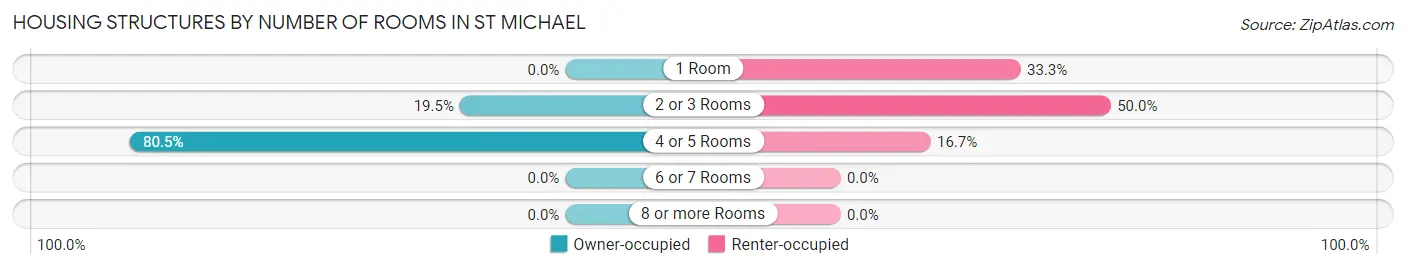
| Number of Rooms | Owner-occupied | Renter-occupied |
| 1 Room | 0 (0.0%) | 8 (33.3%) |
| 2 or 3 Rooms | 8 (19.5%) | 12 (50.0%) |
| 4 or 5 Rooms | 33 (80.5%) | 4 (16.7%) |
| 6 or 7 Rooms | 0 (0.0%) | 0 (0.0%) |
| 8 or more Rooms | 0 (0.0%) | 0 (0.0%) |
| Total | 41 (100.0%) | 24 (100.0%) |
Housing Structure by Heating Type in St Michael
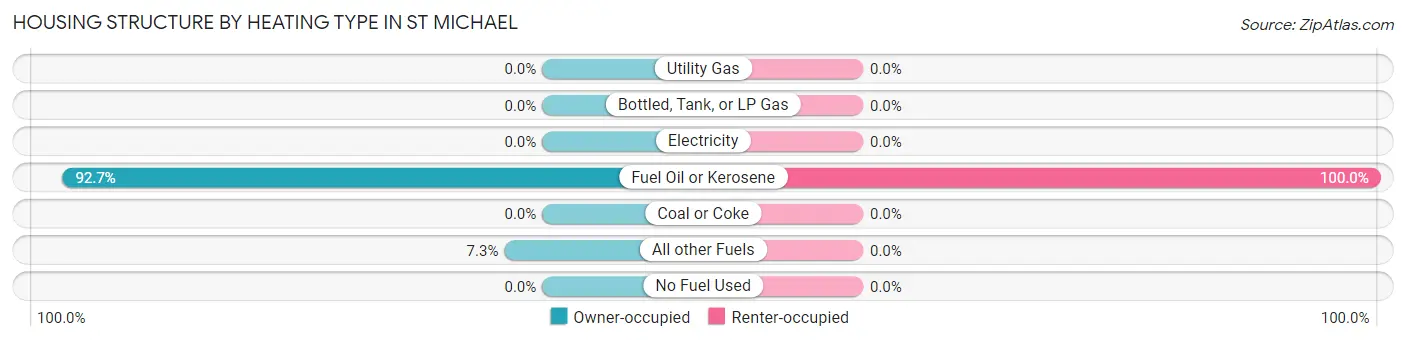
| Heating Type | Owner-occupied | Renter-occupied |
| Utility Gas | 0 (0.0%) | 0 (0.0%) |
| Bottled, Tank, or LP Gas | 0 (0.0%) | 0 (0.0%) |
| Electricity | 0 (0.0%) | 0 (0.0%) |
| Fuel Oil or Kerosene | 38 (92.7%) | 24 (100.0%) |
| Coal or Coke | 0 (0.0%) | 0 (0.0%) |
| All other Fuels | 3 (7.3%) | 0 (0.0%) |
| No Fuel Used | 0 (0.0%) | 0 (0.0%) |
| Total | 41 (100.0%) | 24 (100.0%) |
Household Vehicle Usage in St Michael
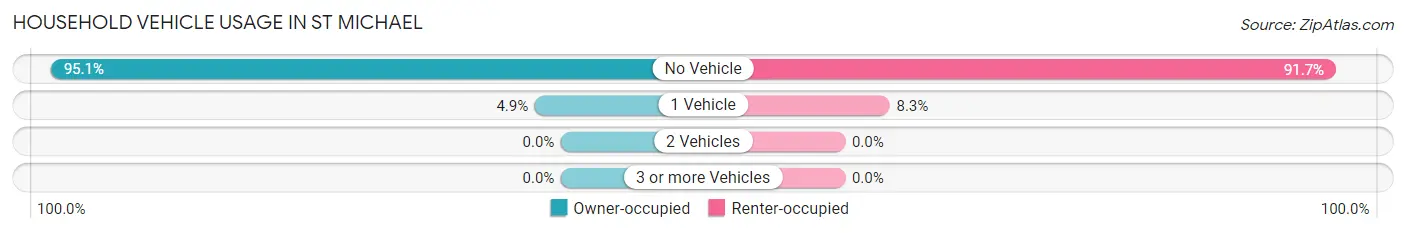
| Vehicles per Household | Owner-occupied | Renter-occupied |
| No Vehicle | 39 (95.1%) | 22 (91.7%) |
| 1 Vehicle | 2 (4.9%) | 2 (8.3%) |
| 2 Vehicles | 0 (0.0%) | 0 (0.0%) |
| 3 or more Vehicles | 0 (0.0%) | 0 (0.0%) |
| Total | 41 (100.0%) | 24 (100.0%) |
Real Estate & Mortgages in St Michael
Real Estate and Mortgage Overview in St Michael
| Characteristic | Without Mortgage | With Mortgage |
| Housing Units | 26 | 15 |
| Median Property Value | $36,700 | $0 |
| Median Household Income | $51,250 | $2 |
| Monthly Housing Costs | $650 | $0 |
| Real Estate Taxes | - | - |
Property Value by Mortgage Status in St Michael
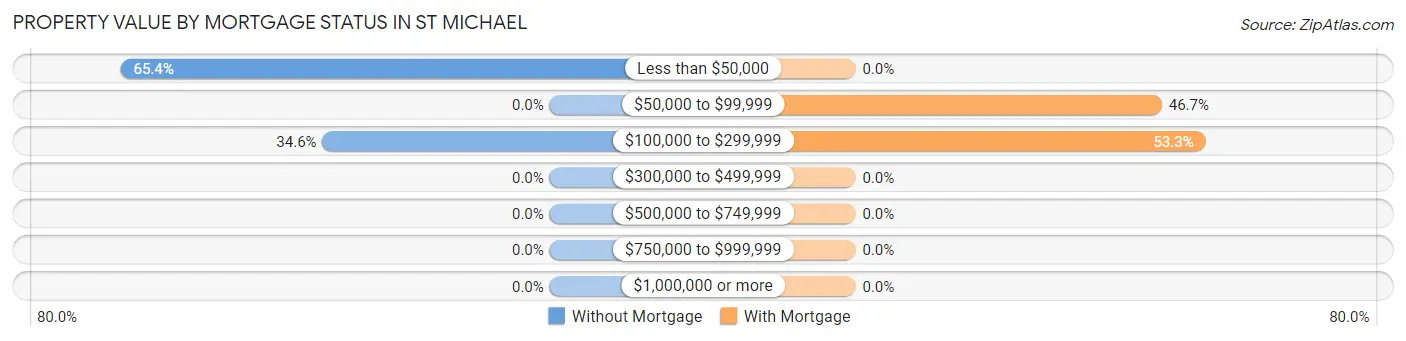
| Property Value | Without Mortgage | With Mortgage |
| Less than $50,000 | 17 (65.4%) | 0 (0.0%) |
| $50,000 to $99,999 | 0 (0.0%) | 7 (46.7%) |
| $100,000 to $299,999 | 9 (34.6%) | 8 (53.3%) |
| $300,000 to $499,999 | 0 (0.0%) | 0 (0.0%) |
| $500,000 to $749,999 | 0 (0.0%) | 0 (0.0%) |
| $750,000 to $999,999 | 0 (0.0%) | 0 (0.0%) |
| $1,000,000 or more | 0 (0.0%) | 0 (0.0%) |
| Total | 26 (100.0%) | 15 (100.0%) |
Household Income by Mortgage Status in St Michael
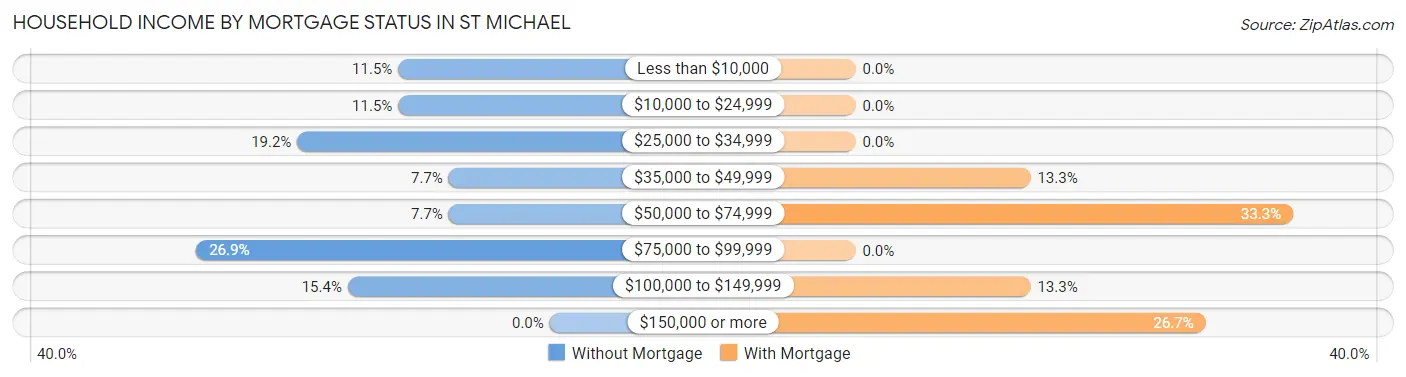
| Household Income | Without Mortgage | With Mortgage |
| Less than $10,000 | 3 (11.5%) | 0 (0.0%) |
| $10,000 to $24,999 | 3 (11.5%) | 0 (0.0%) |
| $25,000 to $34,999 | 5 (19.2%) | 0 (0.0%) |
| $35,000 to $49,999 | 2 (7.7%) | 2 (13.3%) |
| $50,000 to $74,999 | 2 (7.7%) | 5 (33.3%) |
| $75,000 to $99,999 | 7 (26.9%) | 0 (0.0%) |
| $100,000 to $149,999 | 4 (15.4%) | 2 (13.3%) |
| $150,000 or more | 0 (0.0%) | 4 (26.7%) |
| Total | 26 (100.0%) | 15 (100.0%) |
Property Value to Household Income Ratio in St Michael
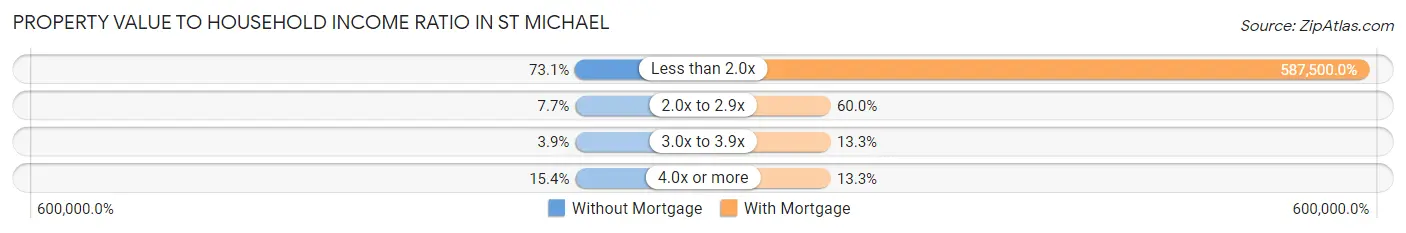
| Value-to-Income Ratio | Without Mortgage | With Mortgage |
| Less than 2.0x | 19 (73.1%) | 88,125 (587,500.0%) |
| 2.0x to 2.9x | 2 (7.7%) | 9 (60.0%) |
| 3.0x to 3.9x | 1 (3.8%) | 2 (13.3%) |
| 4.0x or more | 4 (15.4%) | 2 (13.3%) |
| Total | 26 (100.0%) | 15 (100.0%) |
Real Estate Taxes by Mortgage Status in St Michael
| Property Taxes | Without Mortgage | With Mortgage |
| Less than $800 | 0 (0.0%) | 0 (0.0%) |
| $800 to $1,499 | 0 (0.0%) | 0 (0.0%) |
| $800 to $1,499 | 0 (0.0%) | 0 (0.0%) |
| Total | 26 (100.0%) | 15 (100.0%) |
Health & Disability in St Michael
Health Insurance Coverage by Age in St Michael
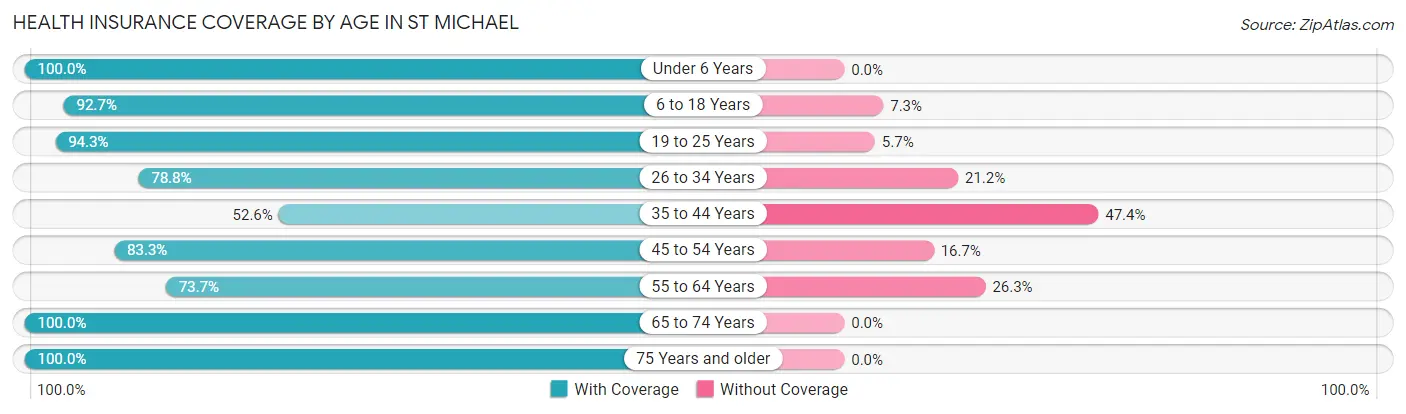
| Age Bracket | With Coverage | Without Coverage |
| Under 6 Years | 40 (100.0%) | 0 (0.0%) |
| 6 to 18 Years | 102 (92.7%) | 8 (7.3%) |
| 19 to 25 Years | 33 (94.3%) | 2 (5.7%) |
| 26 to 34 Years | 26 (78.8%) | 7 (21.2%) |
| 35 to 44 Years | 20 (52.6%) | 18 (47.4%) |
| 45 to 54 Years | 15 (83.3%) | 3 (16.7%) |
| 55 to 64 Years | 14 (73.7%) | 5 (26.3%) |
| 65 to 74 Years | 12 (100.0%) | 0 (0.0%) |
| 75 Years and older | 3 (100.0%) | 0 (0.0%) |
| Total | 265 (86.0%) | 43 (14.0%) |
Health Insurance Coverage by Citizenship Status in St Michael
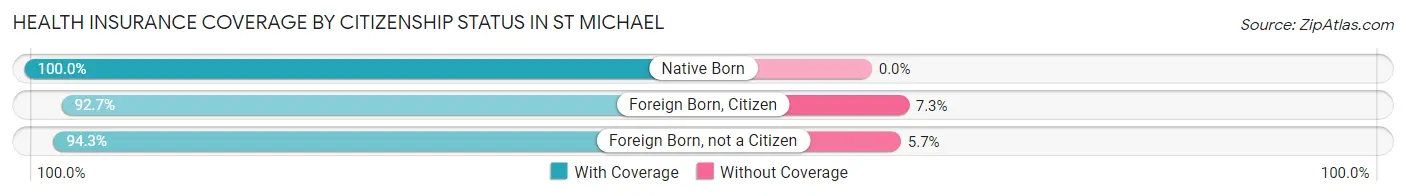
| Citizenship Status | With Coverage | Without Coverage |
| Native Born | 40 (100.0%) | 0 (0.0%) |
| Foreign Born, Citizen | 102 (92.7%) | 8 (7.3%) |
| Foreign Born, not a Citizen | 33 (94.3%) | 2 (5.7%) |
Health Insurance Coverage by Household Income in St Michael
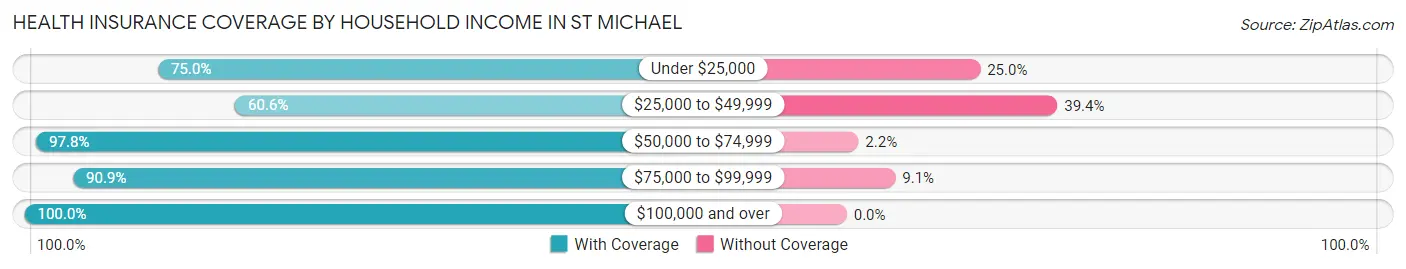
| Household Income | With Coverage | Without Coverage |
| Under $25,000 | 24 (75.0%) | 8 (25.0%) |
| $25,000 to $49,999 | 43 (60.6%) | 28 (39.4%) |
| $50,000 to $74,999 | 45 (97.8%) | 1 (2.2%) |
| $75,000 to $99,999 | 60 (90.9%) | 6 (9.1%) |
| $100,000 and over | 93 (100.0%) | 0 (0.0%) |
Public vs Private Health Insurance Coverage by Age in St Michael
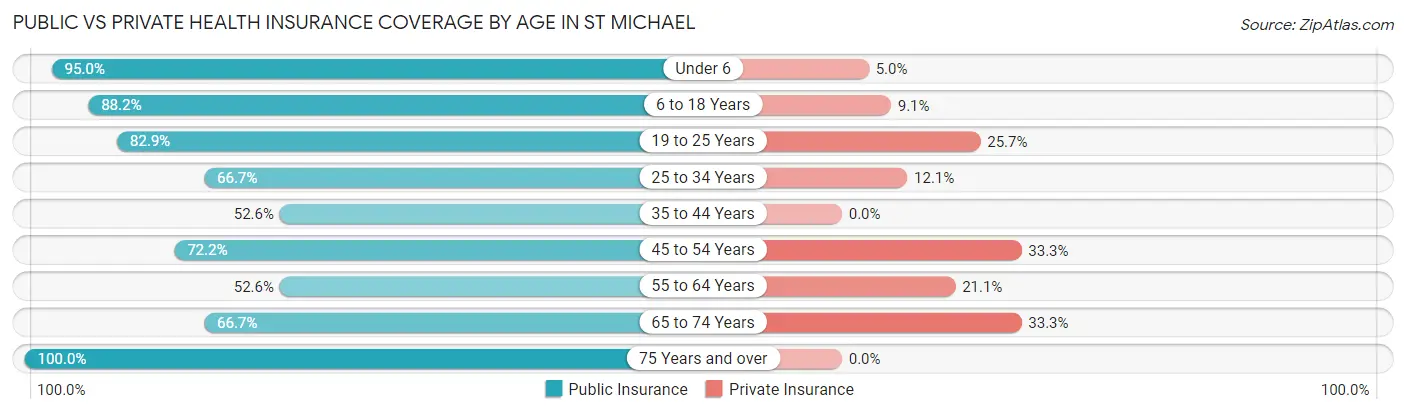
| Age Bracket | Public Insurance | Private Insurance |
| Under 6 | 38 (95.0%) | 2 (5.0%) |
| 6 to 18 Years | 97 (88.2%) | 10 (9.1%) |
| 19 to 25 Years | 29 (82.9%) | 9 (25.7%) |
| 25 to 34 Years | 22 (66.7%) | 4 (12.1%) |
| 35 to 44 Years | 20 (52.6%) | 0 (0.0%) |
| 45 to 54 Years | 13 (72.2%) | 6 (33.3%) |
| 55 to 64 Years | 10 (52.6%) | 4 (21.0%) |
| 65 to 74 Years | 8 (66.7%) | 4 (33.3%) |
| 75 Years and over | 3 (100.0%) | 0 (0.0%) |
| Total | 240 (77.9%) | 39 (12.7%) |
Disability Status by Sex by Age in St Michael
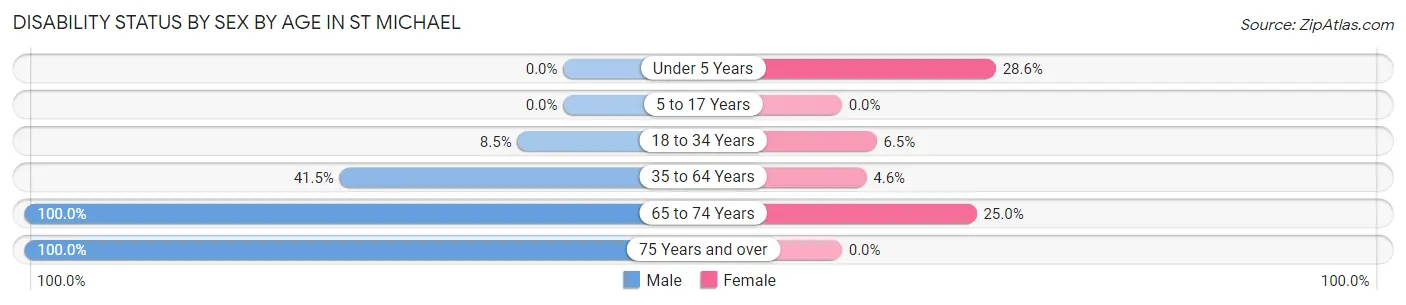
| Age Bracket | Male | Female |
| Under 5 Years | 0 (0.0%) | 4 (28.6%) |
| 5 to 17 Years | 0 (0.0%) | 0 (0.0%) |
| 18 to 34 Years | 4 (8.5%) | 2 (6.5%) |
| 35 to 64 Years | 22 (41.5%) | 1 (4.5%) |
| 65 to 74 Years | 4 (100.0%) | 2 (25.0%) |
| 75 Years and over | 2 (100.0%) | 0 (0.0%) |
Disability Class by Sex by Age in St Michael
Disability Class: Hearing Difficulty
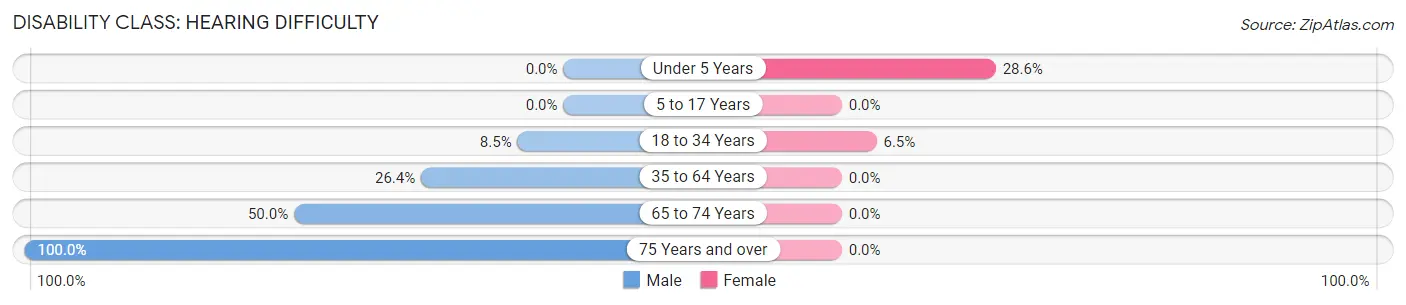
| Age Bracket | Male | Female |
| Under 5 Years | 0 (0.0%) | 4 (28.6%) |
| 5 to 17 Years | 0 (0.0%) | 0 (0.0%) |
| 18 to 34 Years | 4 (8.5%) | 2 (6.5%) |
| 35 to 64 Years | 14 (26.4%) | 0 (0.0%) |
| 65 to 74 Years | 2 (50.0%) | 0 (0.0%) |
| 75 Years and over | 2 (100.0%) | 0 (0.0%) |
Disability Class: Vision Difficulty
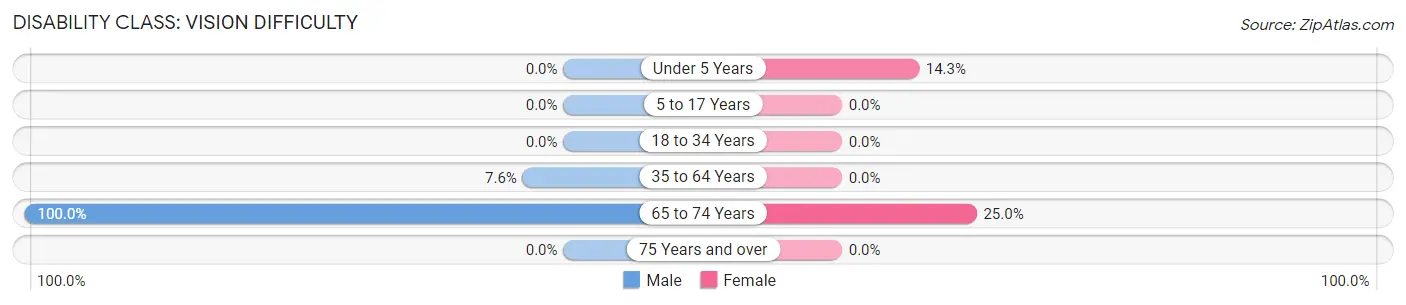
| Age Bracket | Male | Female |
| Under 5 Years | 0 (0.0%) | 2 (14.3%) |
| 5 to 17 Years | 0 (0.0%) | 0 (0.0%) |
| 18 to 34 Years | 0 (0.0%) | 0 (0.0%) |
| 35 to 64 Years | 4 (7.5%) | 0 (0.0%) |
| 65 to 74 Years | 4 (100.0%) | 2 (25.0%) |
| 75 Years and over | 0 (0.0%) | 0 (0.0%) |
Disability Class: Cognitive Difficulty
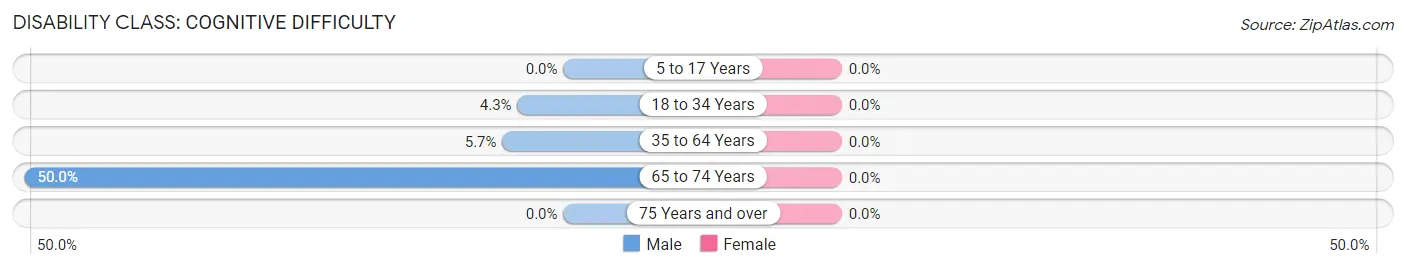
| Age Bracket | Male | Female |
| 5 to 17 Years | 0 (0.0%) | 0 (0.0%) |
| 18 to 34 Years | 2 (4.3%) | 0 (0.0%) |
| 35 to 64 Years | 3 (5.7%) | 0 (0.0%) |
| 65 to 74 Years | 2 (50.0%) | 0 (0.0%) |
| 75 Years and over | 0 (0.0%) | 0 (0.0%) |
Disability Class: Ambulatory Difficulty
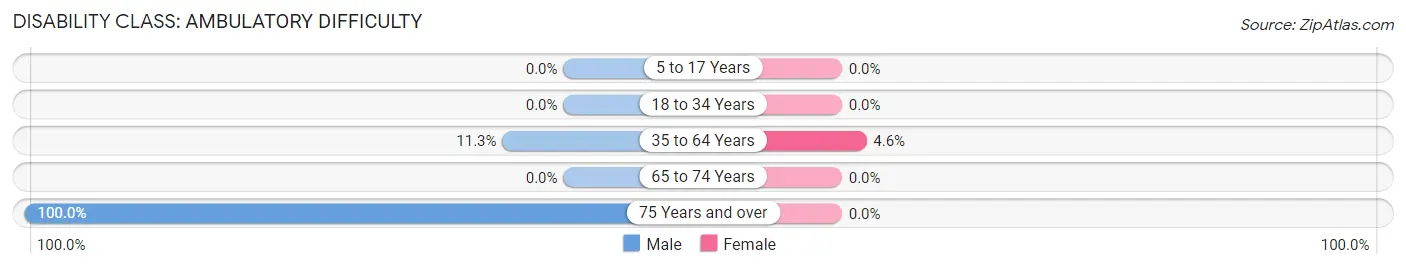
| Age Bracket | Male | Female |
| 5 to 17 Years | 0 (0.0%) | 0 (0.0%) |
| 18 to 34 Years | 0 (0.0%) | 0 (0.0%) |
| 35 to 64 Years | 6 (11.3%) | 1 (4.5%) |
| 65 to 74 Years | 0 (0.0%) | 0 (0.0%) |
| 75 Years and over | 2 (100.0%) | 0 (0.0%) |
Disability Class: Self-Care Difficulty
| Age Bracket | Male | Female |
| 5 to 17 Years | 0 (0.0%) | 0 (0.0%) |
| 18 to 34 Years | 0 (0.0%) | 0 (0.0%) |
| 35 to 64 Years | 0 (0.0%) | 0 (0.0%) |
| 65 to 74 Years | 0 (0.0%) | 0 (0.0%) |
| 75 Years and over | 0 (0.0%) | 0 (0.0%) |
Technology Access in St Michael
Computing Device Access in St Michael
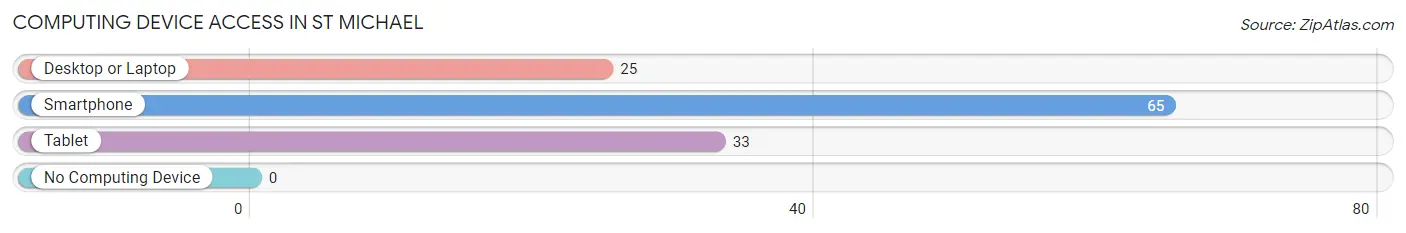
| Device Type | # Households | % Households |
| Desktop or Laptop | 25 | 38.5% |
| Smartphone | 65 | 100.0% |
| Tablet | 33 | 50.8% |
| No Computing Device | 0 | 0.0% |
| Total | 65 | 100.0% |
Internet Access in St Michael
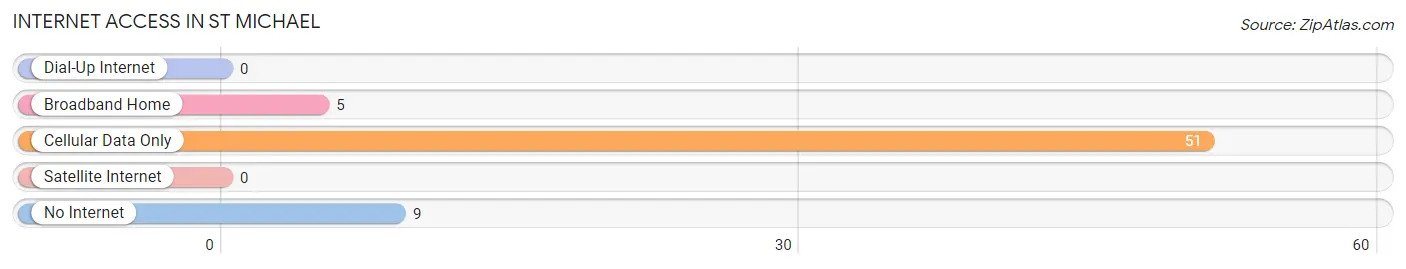
| Internet Type | # Households | % Households |
| Dial-Up Internet | 0 | 0.0% |
| Broadband Home | 5 | 7.7% |
| Cellular Data Only | 51 | 78.5% |
| Satellite Internet | 0 | 0.0% |
| No Internet | 9 | 13.9% |
| Total | 65 | 100.0% |
St Michael Summary
St. Michael is a small city located in the state of Alaska, United States. It is situated on the western side of the Norton Sound, on the northern coast of the Bering Sea. The city is located in the Nome Census Area, and is the largest city in the region. St. Michael has a population of approximately 890 people, as of the 2010 census.
Geography
St. Michael is located at the mouth of the Yukon River, on the western side of the Norton Sound. The city is situated on a small island, which is connected to the mainland by a causeway. The city is surrounded by the Bering Sea to the north, and the Yukon Delta National Wildlife Refuge to the south. The city is located in a tundra climate, with cold winters and mild summers. The average temperature in the summer is around 50°F, and the average temperature in the winter is around 10°F.
Economy
The economy of St. Michael is largely based on fishing and subsistence activities. The city is home to a number of commercial fishing operations, which provide employment for many of the city’s residents. The city also has a number of small businesses, including a grocery store, a hardware store, and a restaurant. The city is also home to a number of tourist attractions, including the St. Michael Historical Museum, the St. Michael Cultural Center, and the St. Michael Native Arts Center.
Demographics
As of the 2010 census, the population of St. Michael was 890 people. The racial makeup of the city was 85.2% Native American, 8.2% White, 0.7% Asian, 0.3% African American, and 5.6% from other races. The median household income in the city was $37,500, and the median family income was $41,250. The per capita income in the city was $17,857.
Conclusion
St. Michael is a small city located in the state of Alaska, United States. It is situated on the western side of the Norton Sound, on the northern coast of the Bering Sea. The city is located in the Nome Census Area, and is the largest city in the region. St. Michael has a population of approximately 890 people, as of the 2010 census. The economy of St. Michael is largely based on fishing and subsistence activities, and the city is home to a number of small businesses. The racial makeup of the city was 85.2% Native American, 8.2% White, 0.7% Asian, 0.3% African American, and 5.6% from other races. The median household income in the city was $37,500, and the median family income was $41,250. The per capita income in the city was $17,857. St. Michael is a unique city with a rich history and culture, and is a great place to visit and explore.
Common Questions
What is the Total Population of St Michael?
Total Population of St Michael is 308.
What is the Total Male Population of St Michael?
Total Male Population of St Michael is 180.
What is the Total Female Population of St Michael?
Total Female Population of St Michael is 128.
What is the Ratio of Males per 100 Females in St Michael?
There are 140.62 Males per 100 Females in St Michael.
What is the Ratio of Females per 100 Males in St Michael?
There are 71.11 Females per 100 Males in St Michael.
What is the Median Population Age in St Michael?
Median Population Age in St Michael is 19.7 Years.
What is the Average Family Size in St Michael
Average Family Size in St Michael is 4.6 People.
What is the Average Household Size in St Michael
Average Household Size in St Michael is 4.7 People.
What is Per Capita Income in St Michael?
Per Capita income in St Michael is $11,900.
What is the Median Family Income in St Michael?
Median Family Income in St Michael is $41,250.
What is the Median Household income in St Michael?
Median Household Income in St Michael is $46,875.
What is Income or Wage Gap in St Michael?
Income or Wage Gap in St Michael is 8.8%.
Women in St Michael earn 91.2 cents for every dollar earned by a man.
What is Inequality or Gini Index in St Michael?
Inequality or Gini Index in St Michael is 0.42.
How Large is the Labor Force in St Michael?
There are 111 People in the Labor Forcein in St Michael.
What is the Percentage of People in the Labor Force in St Michael?
59.0% of People are in the Labor Force in St Michael.
What is the Unemployment Rate in St Michael?
Unemployment Rate in St Michael is 36.9%.