St George, AK
St George Map
St George Overview
57
TOTAL POPULATION
27
MALE POPULATION
30
FEMALE POPULATION
90.00
MALES / 100 FEMALES
111.11
FEMALES / 100 MALES
39.2
MEDIAN AGE
6.2
AVG FAMILY SIZE
5.7
AVG HOUSEHOLD SIZE
$18,540
PER CAPITA INCOME
$103,750
AVG FAMILY INCOME
$92,500
AVG HOUSEHOLD INCOME
0.21
INEQUALITY / GINI INDEX
28
LABOR FORCE [ PEOPLE ]
56.0%
PERCENT IN LABOR FORCE
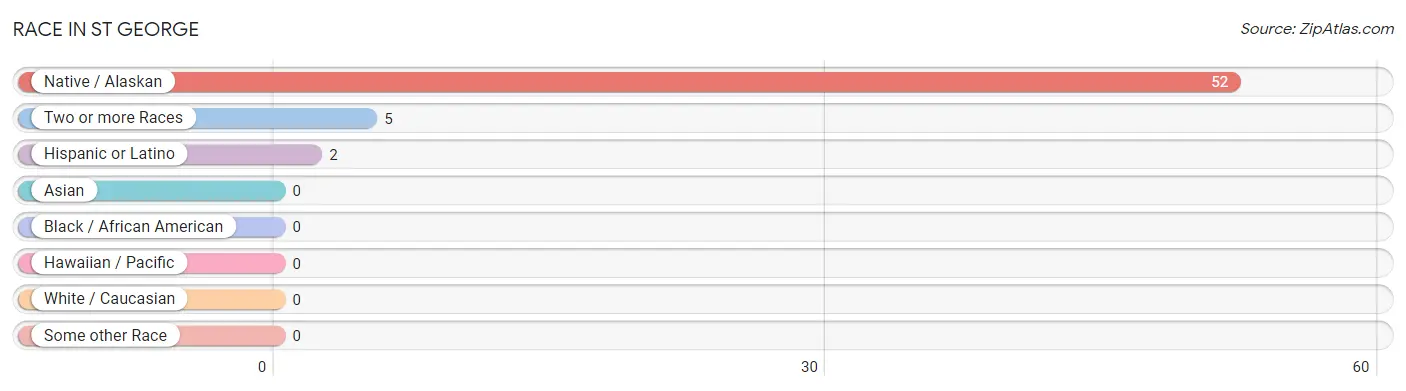
Race in St George
The most populous races in St George are Native / Alaskan (52 | 91.2%), Two or more Races (5 | 8.8%), and Hispanic or Latino (2 | 3.5%).
| Race | # Population | % Population |
| Asian | 0 | 0.0% |
| Black / African American | 0 | 0.0% |
| Hawaiian / Pacific | 0 | 0.0% |
| Hispanic or Latino | 2 | 3.5% |
| Native / Alaskan | 52 | 91.2% |
| White / Caucasian | 0 | 0.0% |
| Two or more Races | 5 | 8.8% |
| Some other Race | 0 | 0.0% |
| Total | 57 | 100.0% |
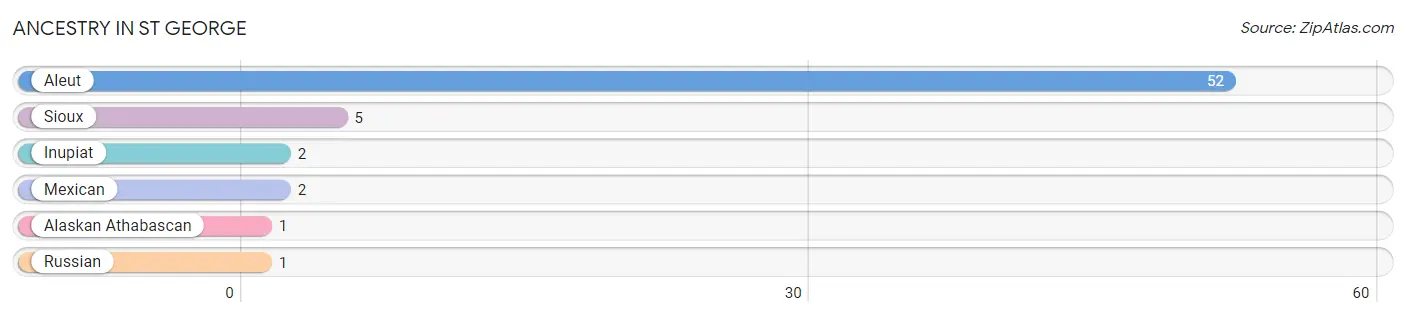
Ancestry in St George
The most populous ancestries reported in St George are Aleut (52 | 91.2%), Sioux (5 | 8.8%), Inupiat (2 | 3.5%), Mexican (2 | 3.5%), and Alaskan Athabascan (1 | 1.8%), together accounting for 108.8% of all St George residents.
| Ancestry | # Population | % Population |
| Alaskan Athabascan | 1 | 1.8% |
| Aleut | 52 | 91.2% |
| Inupiat | 2 | 3.5% |
| Mexican | 2 | 3.5% |
| Russian | 1 | 1.8% |
| Sioux | 5 | 8.8% | View All 6 Rows |
Immigrants in St George

| Immigration Origin | # Population | % Population | View All 0 Rows |
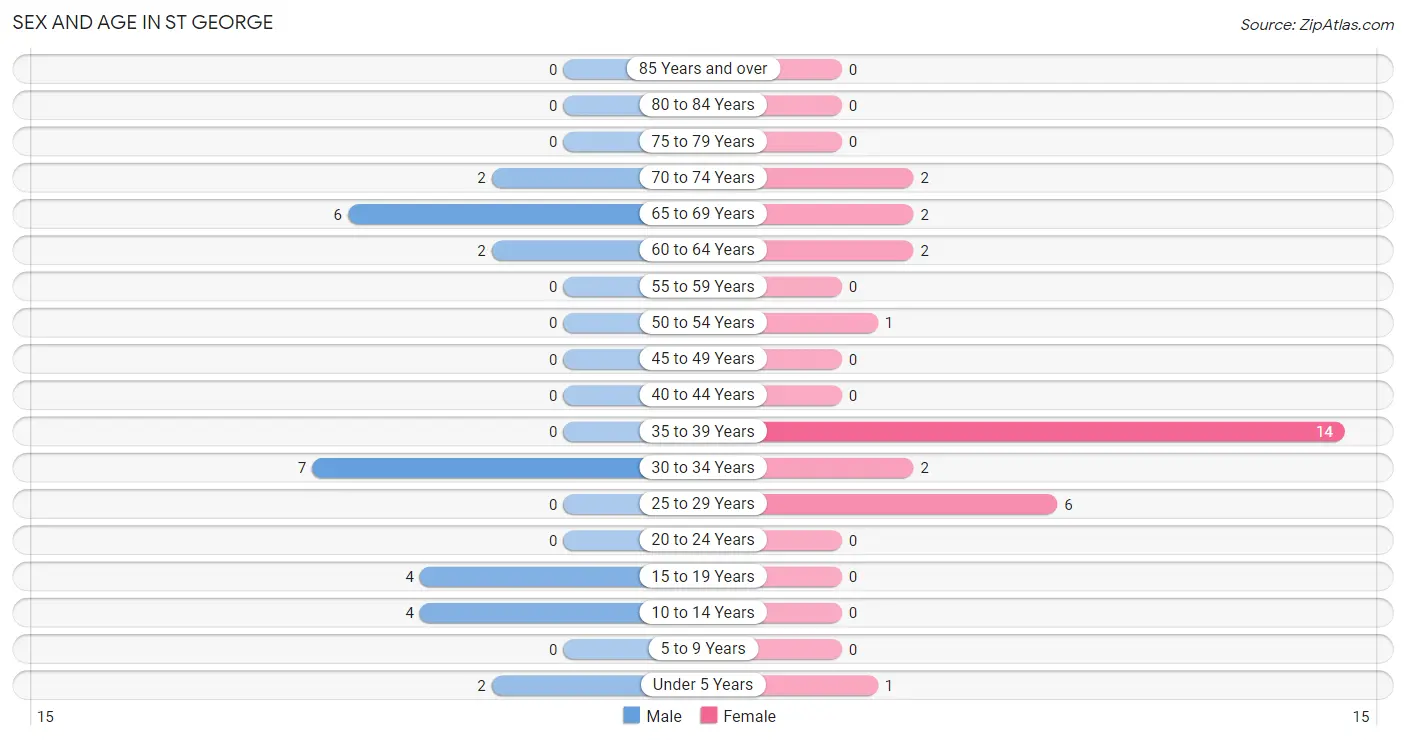
Sex and Age in St George
Sex and Age in St George
The most populous age groups in St George are 30 to 34 Years (7 | 25.9%) for men and 35 to 39 Years (14 | 46.7%) for women.
| Age Bracket | Male | Female |
| Under 5 Years | 2 (7.4%) | 1 (3.3%) |
| 5 to 9 Years | 0 (0.0%) | 0 (0.0%) |
| 10 to 14 Years | 4 (14.8%) | 0 (0.0%) |
| 15 to 19 Years | 4 (14.8%) | 0 (0.0%) |
| 20 to 24 Years | 0 (0.0%) | 0 (0.0%) |
| 25 to 29 Years | 0 (0.0%) | 6 (20.0%) |
| 30 to 34 Years | 7 (25.9%) | 2 (6.7%) |
| 35 to 39 Years | 0 (0.0%) | 14 (46.7%) |
| 40 to 44 Years | 0 (0.0%) | 0 (0.0%) |
| 45 to 49 Years | 0 (0.0%) | 0 (0.0%) |
| 50 to 54 Years | 0 (0.0%) | 1 (3.3%) |
| 55 to 59 Years | 0 (0.0%) | 0 (0.0%) |
| 60 to 64 Years | 2 (7.4%) | 2 (6.7%) |
| 65 to 69 Years | 6 (22.2%) | 2 (6.7%) |
| 70 to 74 Years | 2 (7.4%) | 2 (6.7%) |
| 75 to 79 Years | 0 (0.0%) | 0 (0.0%) |
| 80 to 84 Years | 0 (0.0%) | 0 (0.0%) |
| 85 Years and over | 0 (0.0%) | 0 (0.0%) |
| Total | 27 (100.0%) | 30 (100.0%) |
Families and Households in St George
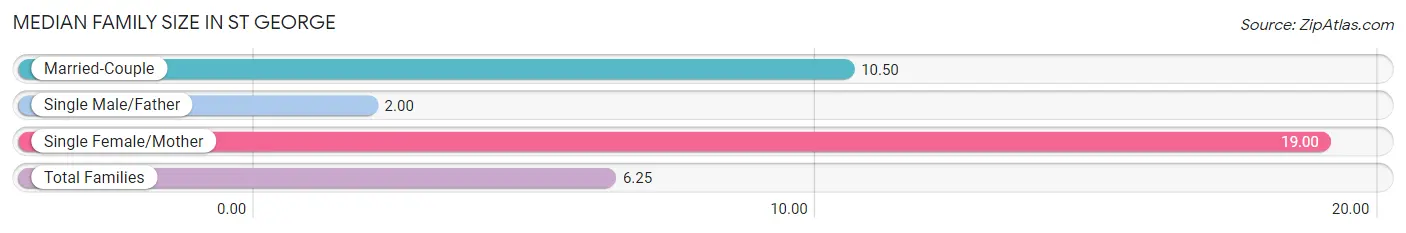
Median Family Size in St George
The median family size in St George is 6.25 persons per family, with single female/mother families (1 | 12.5%) accounting for the largest median family size of 19 persons per family. On the other hand, single male/father families (5 | 62.5%) represent the smallest median family size with 2.00 persons per family.
| Family Type | # Families | Family Size |
| Married-Couple | 2 (25.0%) | 10.50 |
| Single Male/Father | 5 (62.5%) | 2.00 |
| Single Female/Mother | 1 (12.5%) | 19.00 |
| Total Families | 8 (100.0%) | 6.25 |
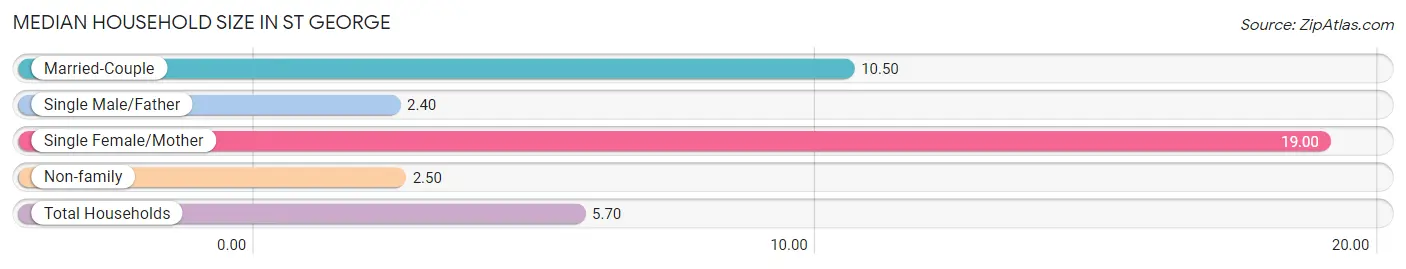
Median Household Size in St George
The median household size in St George is 5.70 persons per household, with single female/mother households (1 | 10.0%) accounting for the largest median household size of 19 persons per household. single male/father households (5 | 50.0%) represent the smallest median household size with 2.40 persons per household.
| Household Type | # Households | Household Size |
| Married-Couple | 2 (20.0%) | 10.50 |
| Single Male/Father | 5 (50.0%) | 2.40 |
| Single Female/Mother | 1 (10.0%) | 19.00 |
| Non-family | 2 (20.0%) | 2.50 |
| Total Households | 10 (100.0%) | 5.70 |
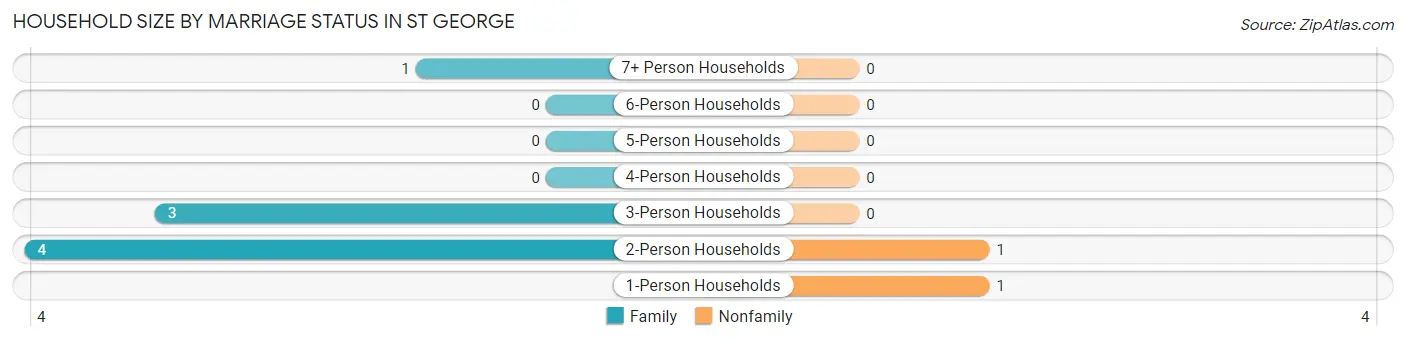
Household Size by Marriage Status in St George
Out of a total of 10 households in St George, 8 (80.0%) are family households, while 2 (20.0%) are nonfamily households. The most numerous type of family households are 2-person households, comprising 4, and the most common type of nonfamily households are 1-person households, comprising 1.
| Household Size | Family Households | Nonfamily Households |
| 1-Person Households | - | 1 (10.0%) |
| 2-Person Households | 4 (40.0%) | 1 (10.0%) |
| 3-Person Households | 3 (30.0%) | 0 (0.0%) |
| 4-Person Households | 0 (0.0%) | 0 (0.0%) |
| 5-Person Households | 0 (0.0%) | 0 (0.0%) |
| 6-Person Households | 0 (0.0%) | 0 (0.0%) |
| 7+ Person Households | 1 (10.0%) | 0 (0.0%) |
| Total | 8 (80.0%) | 2 (20.0%) |
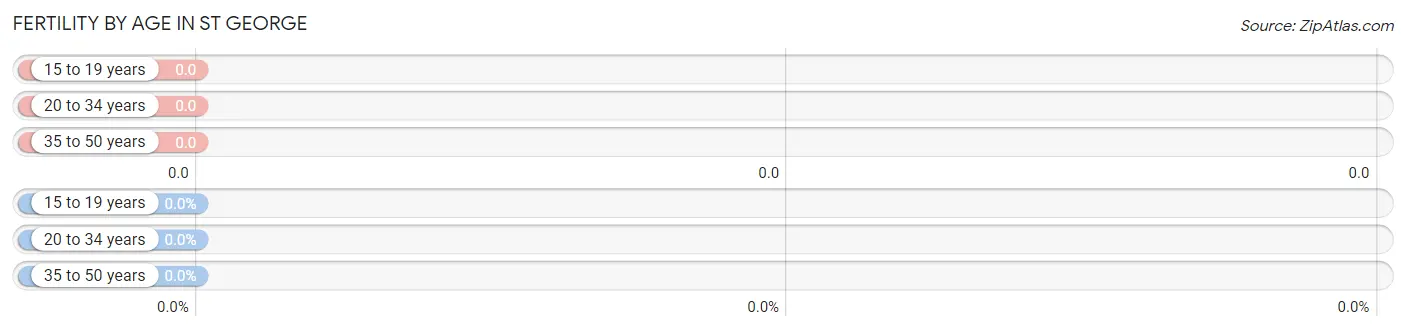
Female Fertility in St George
Fertility by Age in St George
| Age Bracket | Women with Births | Births / 1,000 Women |
| 15 to 19 years | 0 (0.0%) | 0.0 |
| 20 to 34 years | 0 (0.0%) | 0.0 |
| 35 to 50 years | 0 (0.0%) | 0.0 |
| Total | 0 (0.0%) | 0.0 |
Fertility by Age by Marriage Status in St George
| Age Bracket | Married | Unmarried |
| 15 to 19 years | 0 (0.0%) | 0 (0.0%) |
| 20 to 34 years | 0 (0.0%) | 0 (0.0%) |
| 35 to 50 years | 0 (0.0%) | 0 (0.0%) |
| Total | 0 (0.0%) | 0 (0.0%) |
Fertility by Education in St George
| Educational Attainment | Women with Births | Births / 1,000 Women |
| Less than High School | 0 (0.0%) | 0.0 |
| High School Diploma | 0 (0.0%) | 0.0 |
| College or Associate's Degree | 0 (0.0%) | 0.0 |
| Bachelor's Degree | 0 (0.0%) | 0.0 |
| Graduate Degree | 0 (0.0%) | 0.0 |
| Total | 0 (0.0%) | 0.0 |
Fertility by Education by Marriage Status in St George
| Educational Attainment | Married | Unmarried |
| Less than High School | 0 (0.0%) | 0 (0.0%) |
| High School Diploma | 0 (0.0%) | 0 (0.0%) |
| College or Associate's Degree | 0 (0.0%) | 0 (0.0%) |
| Bachelor's Degree | 0 (0.0%) | 0 (0.0%) |
| Graduate Degree | 0 (0.0%) | 0 (0.0%) |
| Total | 0 (0.0%) | 0 (0.0%) |
Income in St George
Income Overview in St George
Per Capita Income in St George is $18,540, while median incomes of families and households are $103,750 and $92,500 respectively.
| Characteristic | Number | Measure |
| Per Capita Income | 57 | $18,540 |
| Median Family Income | 8 | $103,750 |
| Mean Family Income | 8 | $81,638 |
| Median Household Income | 10 | $92,500 |
| Mean Household Income | 10 | $81,250 |
| Income Deficit | 8 | $0 |
| Wage / Income Gap (%) | 57 | 0.00% |
| Wage / Income Gap ($) | 57 | 100.00¢ per $1 |
| Gini / Inequality Index | 57 | 0.21 |
Earnings by Sex in St George
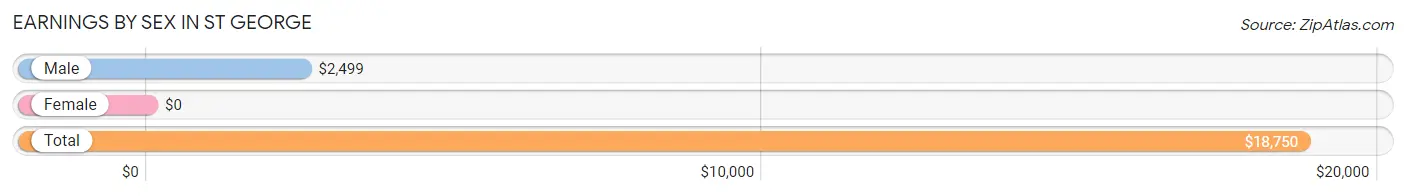
| Sex | Number | Average Earnings |
| Male | 9 (30.0%) | $2,499 |
| Female | 21 (70.0%) | $0 |
| Total | 30 (100.0%) | $18,750 |
Earnings by Sex by Income Bracket in St George
The most common earnings brackets in St George are $2,499 or less for men (5 | 55.6%) and $17,500 to $19,999 for women (14 | 66.7%).
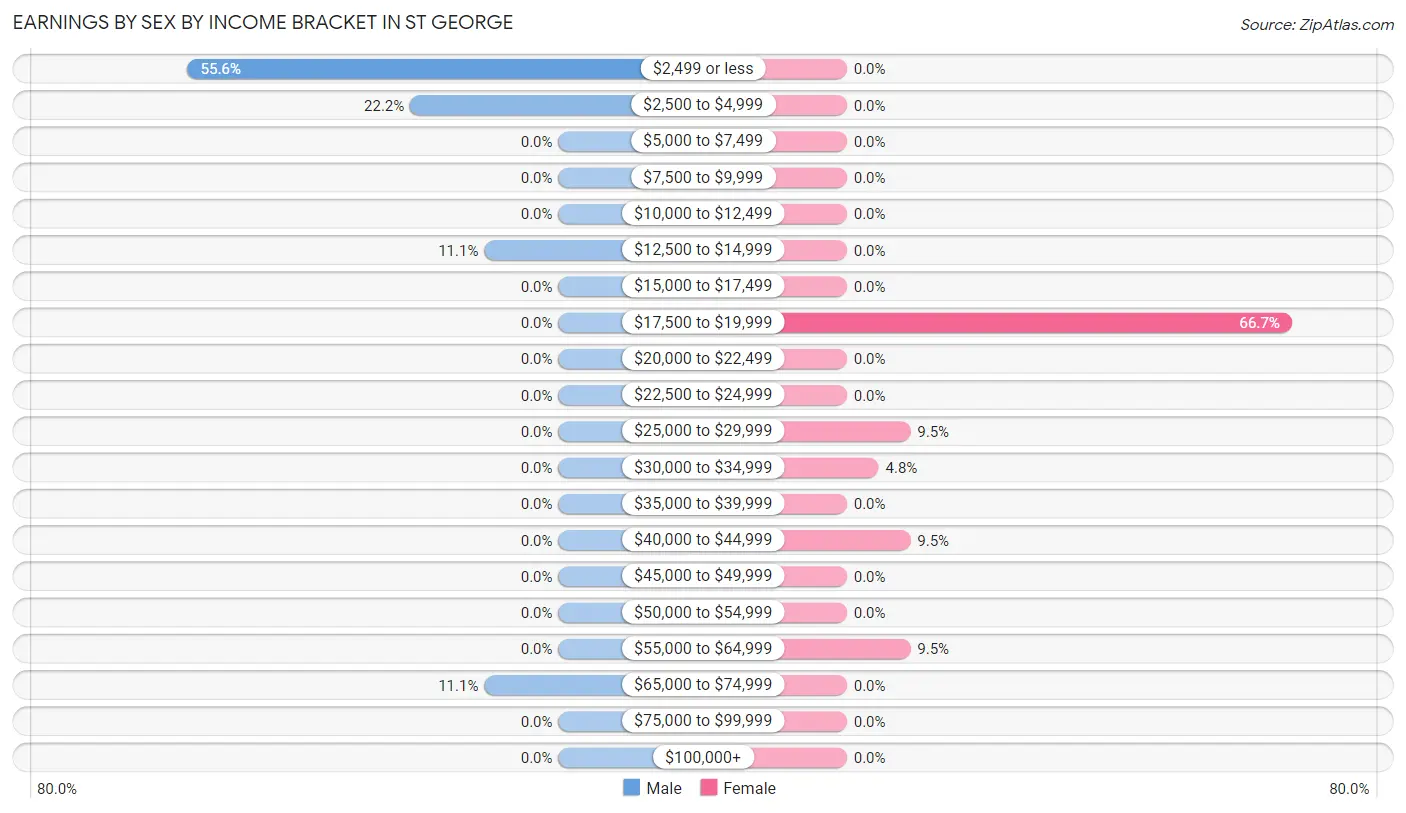
| Income | Male | Female |
| $2,499 or less | 5 (55.6%) | 0 (0.0%) |
| $2,500 to $4,999 | 2 (22.2%) | 0 (0.0%) |
| $5,000 to $7,499 | 0 (0.0%) | 0 (0.0%) |
| $7,500 to $9,999 | 0 (0.0%) | 0 (0.0%) |
| $10,000 to $12,499 | 0 (0.0%) | 0 (0.0%) |
| $12,500 to $14,999 | 1 (11.1%) | 0 (0.0%) |
| $15,000 to $17,499 | 0 (0.0%) | 0 (0.0%) |
| $17,500 to $19,999 | 0 (0.0%) | 14 (66.7%) |
| $20,000 to $22,499 | 0 (0.0%) | 0 (0.0%) |
| $22,500 to $24,999 | 0 (0.0%) | 0 (0.0%) |
| $25,000 to $29,999 | 0 (0.0%) | 2 (9.5%) |
| $30,000 to $34,999 | 0 (0.0%) | 1 (4.8%) |
| $35,000 to $39,999 | 0 (0.0%) | 0 (0.0%) |
| $40,000 to $44,999 | 0 (0.0%) | 2 (9.5%) |
| $45,000 to $49,999 | 0 (0.0%) | 0 (0.0%) |
| $50,000 to $54,999 | 0 (0.0%) | 0 (0.0%) |
| $55,000 to $64,999 | 0 (0.0%) | 2 (9.5%) |
| $65,000 to $74,999 | 1 (11.1%) | 0 (0.0%) |
| $75,000 to $99,999 | 0 (0.0%) | 0 (0.0%) |
| $100,000+ | 0 (0.0%) | 0 (0.0%) |
| Total | 9 (100.0%) | 21 (100.0%) |
Earnings by Sex by Educational Attainment in St George
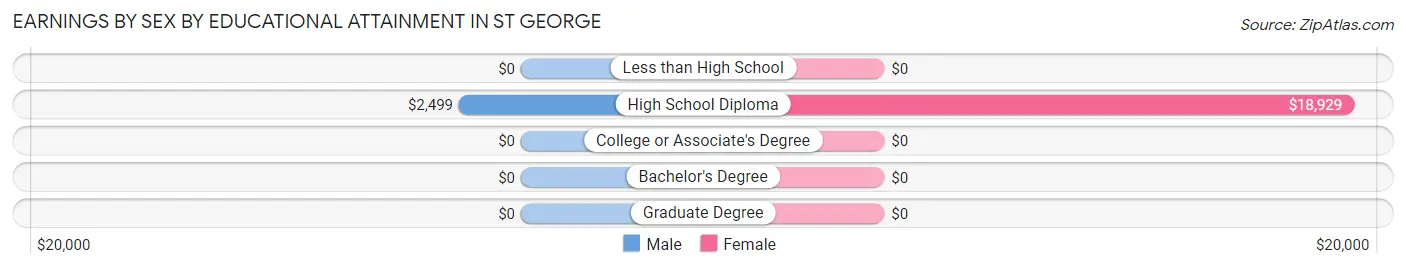
| Educational Attainment | Male Income | Female Income |
| Less than High School | - | - |
| High School Diploma | $2,499 | $18,929 |
| College or Associate's Degree | - | - |
| Bachelor's Degree | - | - |
| Graduate Degree | - | - |
| Total | $2,499 | $0 |
Family Income in St George
Family Income Brackets in St George
According to the St George family income data, there are 4 families falling into the $100,000 to $149,999 income range, which is the most common income bracket and makes up 50.0% of all families.
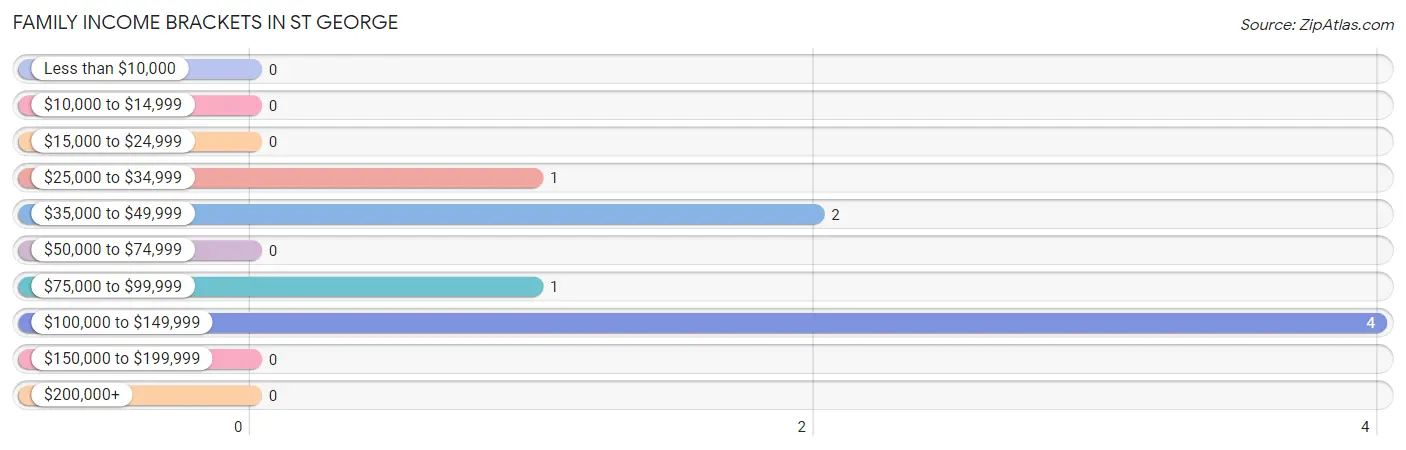
| Income Bracket | # Families | % Families |
| Less than $10,000 | 0 | 0.0% |
| $10,000 to $14,999 | 0 | 0.0% |
| $15,000 to $24,999 | 0 | 0.0% |
| $25,000 to $34,999 | 1 | 12.5% |
| $35,000 to $49,999 | 2 | 25.0% |
| $50,000 to $74,999 | 0 | 0.0% |
| $75,000 to $99,999 | 1 | 12.5% |
| $100,000 to $149,999 | 4 | 50.0% |
| $150,000 to $199,999 | 0 | 0.0% |
| $200,000+ | 0 | 0.0% |
Family Income by Famaliy Size in St George
2-person families (6 | 75.0%) account for the highest median family income in St George with $108,125 per family, while 2-person families (6 | 75.0%) have the highest median income of $54,062 per family member.
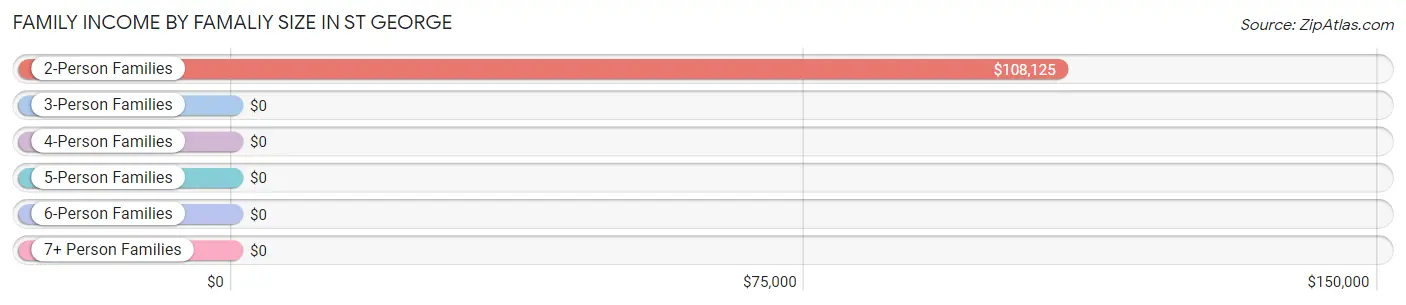
| Income Bracket | # Families | Median Income |
| 2-Person Families | 6 (75.0%) | $108,125 |
| 3-Person Families | 1 (12.5%) | $0 |
| 4-Person Families | 0 (0.0%) | $0 |
| 5-Person Families | 0 (0.0%) | $0 |
| 6-Person Families | 0 (0.0%) | $0 |
| 7+ Person Families | 1 (12.5%) | $0 |
| Total | 8 (100.0%) | $103,750 |
Family Income by Number of Earners in St George
| Number of Earners | # Families | Median Income |
| No Earners | 0 (0.0%) | $0 |
| 1 Earner | 5 (62.5%) | $0 |
| 2 Earners | 2 (25.0%) | $0 |
| 3+ Earners | 1 (12.5%) | $0 |
| Total | 8 (100.0%) | $103,750 |
Household Income in St George
Household Income Brackets in St George
With 4 households falling in the category, the $100,000 to $149,999 income range is the most frequent in St George, accounting for 40.0% of all households.
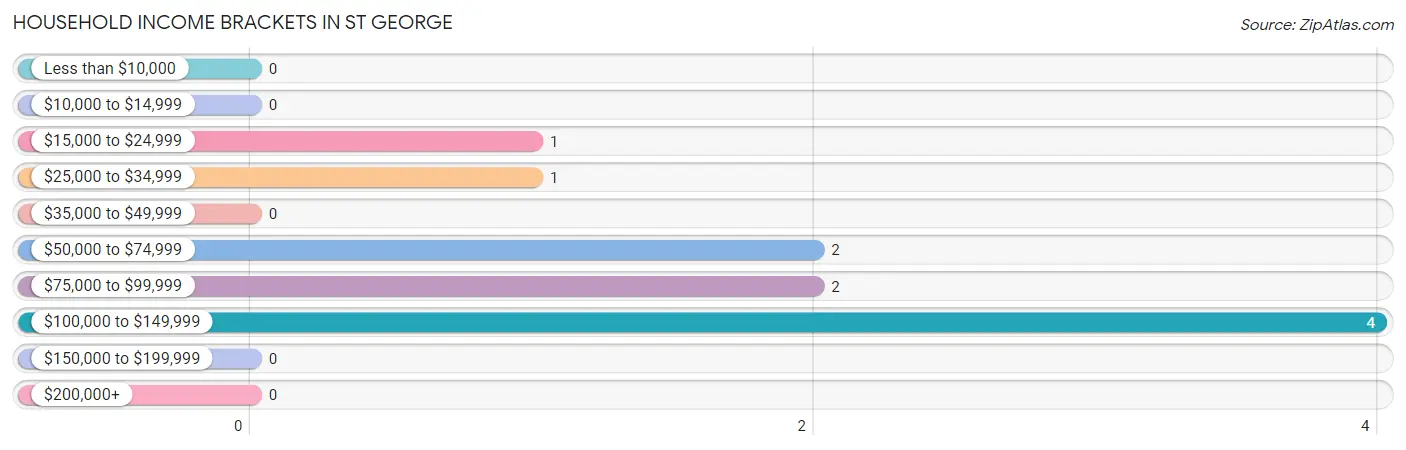
| Income Bracket | # Households | % Households |
| Less than $10,000 | 0 | 0.0% |
| $10,000 to $14,999 | 0 | 0.0% |
| $15,000 to $24,999 | 1 | 10.0% |
| $25,000 to $34,999 | 1 | 10.0% |
| $35,000 to $49,999 | 0 | 0.0% |
| $50,000 to $74,999 | 2 | 20.0% |
| $75,000 to $99,999 | 2 | 20.0% |
| $100,000 to $149,999 | 4 | 40.0% |
| $150,000 to $199,999 | 0 | 0.0% |
| $200,000+ | 0 | 0.0% |
Household Income by Householder Age in St George
The median household income in St George is $92,500, with the highest median household income of $98,750 found in the 65+ years age bracket for the primary householder. A total of 7 households (70.0%) fall into this category.
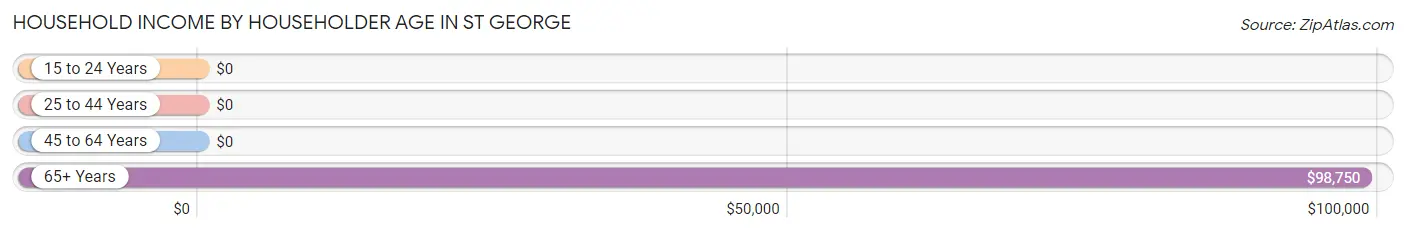
| Income Bracket | # Households | Median Income |
| 15 to 24 Years | 0 (0.0%) | $0 |
| 25 to 44 Years | 0 (0.0%) | $0 |
| 45 to 64 Years | 3 (30.0%) | $0 |
| 65+ Years | 7 (70.0%) | $98,750 |
| Total | 10 (100.0%) | $92,500 |
Poverty in St George
Income Below Poverty by Sex and Age in St George
With 40.7% poverty level for males and 30.0% for females among the residents of St George, under 5 year old males and under 5 year old females are the most vulnerable to poverty, with 2 males (100.0%) and 1 females (100.0%) in their respective age groups living below the poverty level.
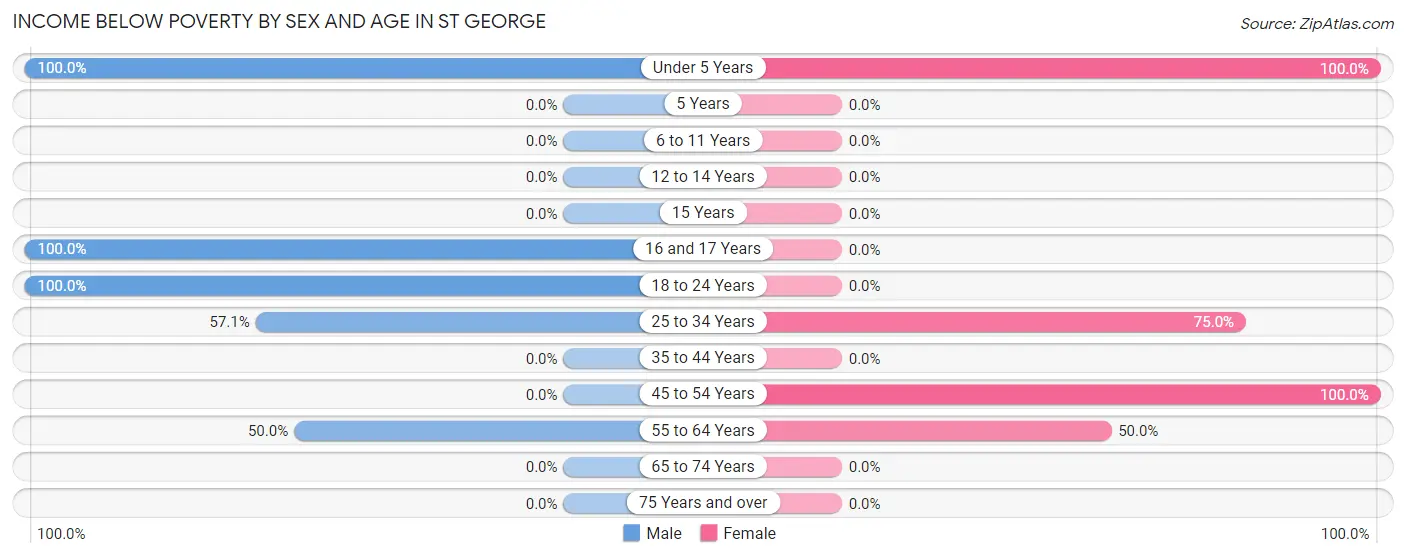
| Age Bracket | Male | Female |
| Under 5 Years | 2 (100.0%) | 1 (100.0%) |
| 5 Years | 0 (0.0%) | 0 (0.0%) |
| 6 to 11 Years | 0 (0.0%) | 0 (0.0%) |
| 12 to 14 Years | 0 (0.0%) | 0 (0.0%) |
| 15 Years | 0 (0.0%) | 0 (0.0%) |
| 16 and 17 Years | 2 (100.0%) | 0 (0.0%) |
| 18 to 24 Years | 2 (100.0%) | 0 (0.0%) |
| 25 to 34 Years | 4 (57.1%) | 6 (75.0%) |
| 35 to 44 Years | 0 (0.0%) | 0 (0.0%) |
| 45 to 54 Years | 0 (0.0%) | 1 (100.0%) |
| 55 to 64 Years | 1 (50.0%) | 1 (50.0%) |
| 65 to 74 Years | 0 (0.0%) | 0 (0.0%) |
| 75 Years and over | 0 (0.0%) | 0 (0.0%) |
| Total | 11 (40.7%) | 9 (30.0%) |
Income Above Poverty by Sex and Age in St George
According to the poverty statistics in St George, males aged 12 to 14 years and females aged 35 to 44 years are the age groups that are most secure financially, with 100.0% of males and 100.0% of females in these age groups living above the poverty line.
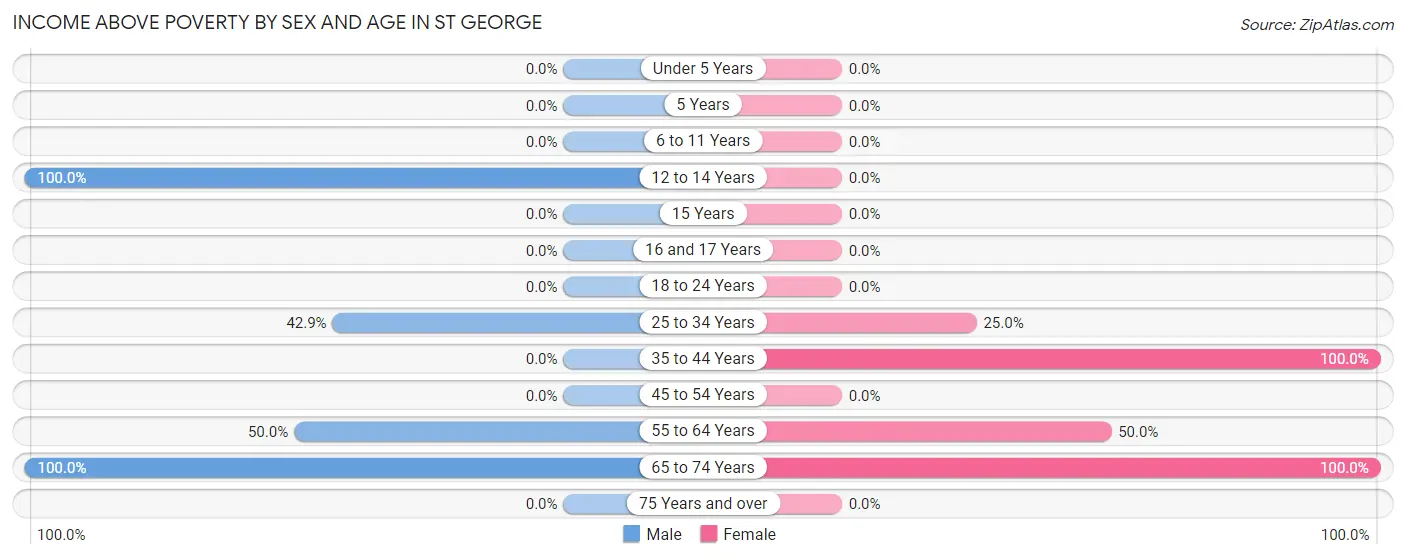
| Age Bracket | Male | Female |
| Under 5 Years | 0 (0.0%) | 0 (0.0%) |
| 5 Years | 0 (0.0%) | 0 (0.0%) |
| 6 to 11 Years | 0 (0.0%) | 0 (0.0%) |
| 12 to 14 Years | 4 (100.0%) | 0 (0.0%) |
| 15 Years | 0 (0.0%) | 0 (0.0%) |
| 16 and 17 Years | 0 (0.0%) | 0 (0.0%) |
| 18 to 24 Years | 0 (0.0%) | 0 (0.0%) |
| 25 to 34 Years | 3 (42.9%) | 2 (25.0%) |
| 35 to 44 Years | 0 (0.0%) | 14 (100.0%) |
| 45 to 54 Years | 0 (0.0%) | 0 (0.0%) |
| 55 to 64 Years | 1 (50.0%) | 1 (50.0%) |
| 65 to 74 Years | 8 (100.0%) | 4 (100.0%) |
| 75 Years and over | 0 (0.0%) | 0 (0.0%) |
| Total | 16 (59.3%) | 21 (70.0%) |
Income Below Poverty Among Married-Couple Families in St George
The poverty statistics for married-couple families in St George show that 50.0% or 1 of the total 2 families live below the poverty line. Families with 3 or 4 children have the highest poverty rate of 100.0%, comprising of 1 families. On the other hand, families with no children have the lowest poverty rate of 0.0%, which includes 0 families.
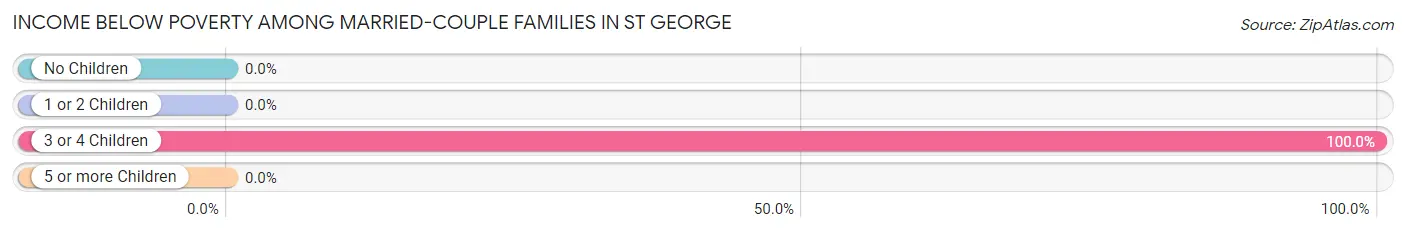
| Children | Above Poverty | Below Poverty |
| No Children | 1 (100.0%) | 0 (0.0%) |
| 1 or 2 Children | 0 (0.0%) | 0 (0.0%) |
| 3 or 4 Children | 0 (0.0%) | 1 (100.0%) |
| 5 or more Children | 0 (0.0%) | 0 (0.0%) |
| Total | 1 (50.0%) | 1 (50.0%) |
Income Below Poverty Among Single-Parent Households in St George
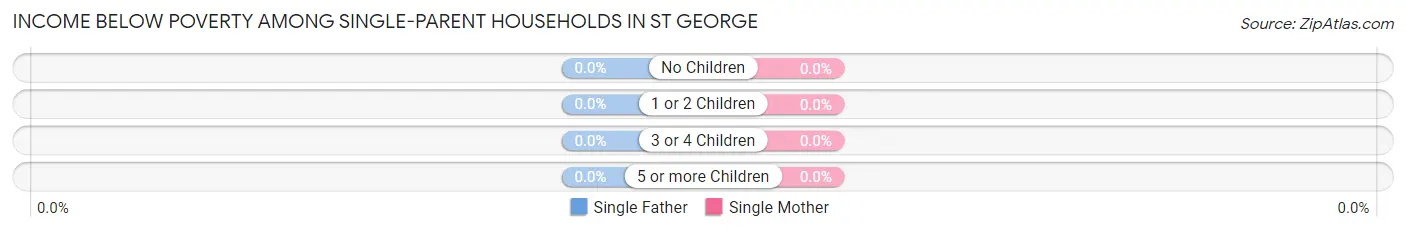
| Children | Single Father | Single Mother |
| No Children | 0 (0.0%) | 0 (0.0%) |
| 1 or 2 Children | 0 (0.0%) | 0 (0.0%) |
| 3 or 4 Children | 0 (0.0%) | 0 (0.0%) |
| 5 or more Children | 0 (0.0%) | 0 (0.0%) |
| Total | 0 (0.0%) | 0 (0.0%) |
Income Below Poverty Among Married-Couple vs Single-Parent Households in St George
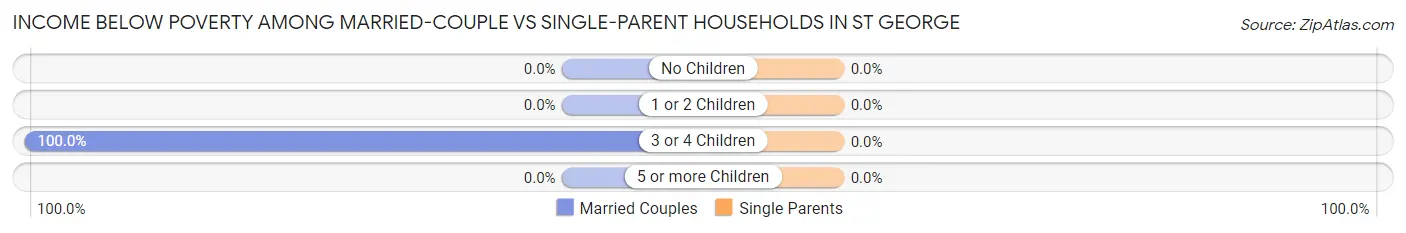
| Children | Married-Couple Families | Single-Parent Households |
| No Children | 0 (0.0%) | 0 (0.0%) |
| 1 or 2 Children | 0 (0.0%) | 0 (0.0%) |
| 3 or 4 Children | 1 (100.0%) | 0 (0.0%) |
| 5 or more Children | 0 (0.0%) | 0 (0.0%) |
| Total | 1 (50.0%) | 0 (0.0%) |
Employment Characteristics in St George
Employment by Class of Employer in St George
Among the 28 employed individuals in St George, federal government employees (14 | 50.0%), local government employees (6 | 21.4%), and private company employees (3 | 10.7%) make up the most common classes of employment.
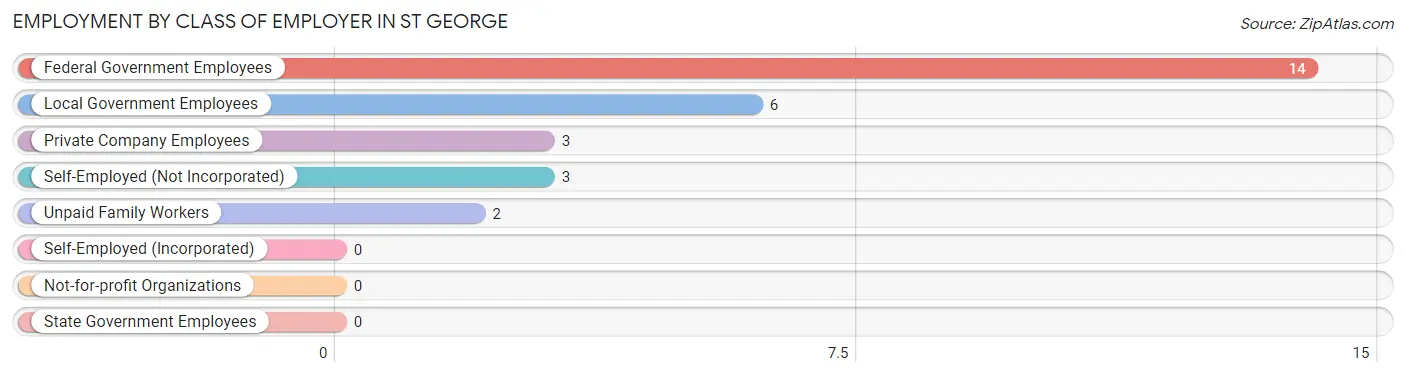
| Employer Class | # Employees | % Employees |
| Private Company Employees | 3 | 10.7% |
| Self-Employed (Incorporated) | 0 | 0.0% |
| Self-Employed (Not Incorporated) | 3 | 10.7% |
| Not-for-profit Organizations | 0 | 0.0% |
| Local Government Employees | 6 | 21.4% |
| State Government Employees | 0 | 0.0% |
| Federal Government Employees | 14 | 50.0% |
| Unpaid Family Workers | 2 | 7.1% |
| Total | 28 | 100.0% |
Employment Status by Age in St George
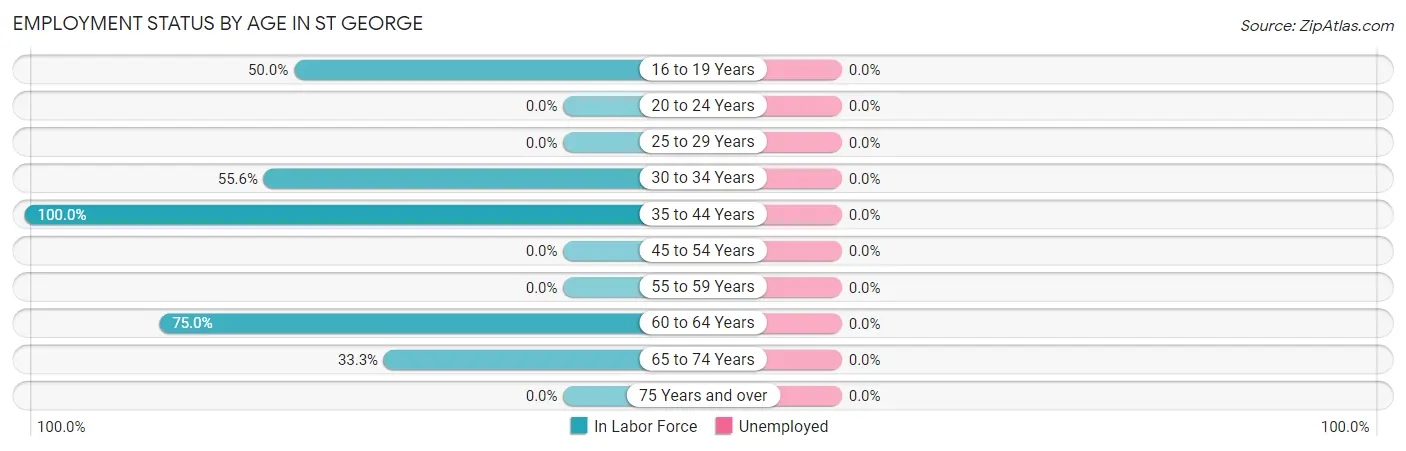
| Age Bracket | In Labor Force | Unemployed |
| 16 to 19 Years | 2 (50.0%) | 0 (0.0%) |
| 20 to 24 Years | 0 (0.0%) | 0 (0.0%) |
| 25 to 29 Years | 0 (0.0%) | 0 (0.0%) |
| 30 to 34 Years | 5 (55.6%) | 0 (0.0%) |
| 35 to 44 Years | 14 (100.0%) | 0 (0.0%) |
| 45 to 54 Years | 0 (0.0%) | 0 (0.0%) |
| 55 to 59 Years | 0 (0.0%) | 0 (0.0%) |
| 60 to 64 Years | 3 (75.0%) | 0 (0.0%) |
| 65 to 74 Years | 4 (33.3%) | 0 (0.0%) |
| 75 Years and over | 0 (0.0%) | 0 (0.0%) |
| Total | 28 (56.0%) | 0 (0.0%) |
Employment Status by Educational Attainment in St George
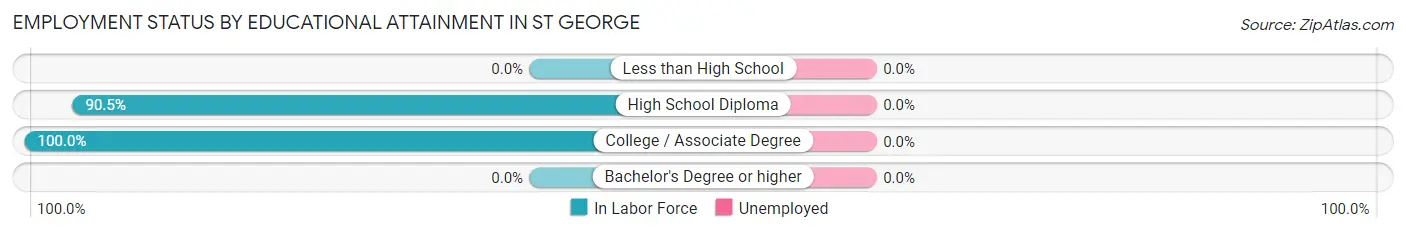
| Educational Attainment | In Labor Force | Unemployed |
| Less than High School | 0 (0.0%) | 0 (0.0%) |
| High School Diploma | 19 (90.5%) | 0 (0.0%) |
| College / Associate Degree | 3 (100.0%) | 0 (0.0%) |
| Bachelor's Degree or higher | 0 (0.0%) | 0 (0.0%) |
| Total | 22 (64.7%) | 0 (0.0%) |
Employment Occupations by Sex in St George
Management, Business, Science and Arts Occupations
The most common Management, Business, Science and Arts occupations in St George are Management (15 | 53.6%), Community & Social Service (2 | 7.1%), and Education Instruction & Library (2 | 7.1%).
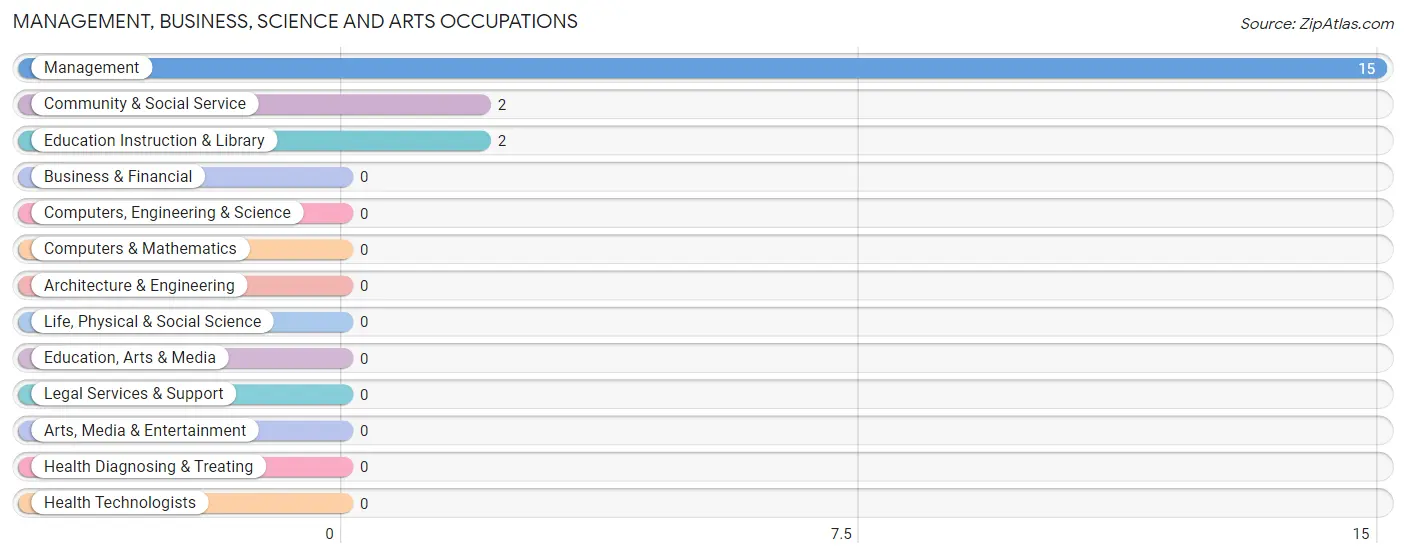
Management, Business, Science and Arts Occupations by Sex
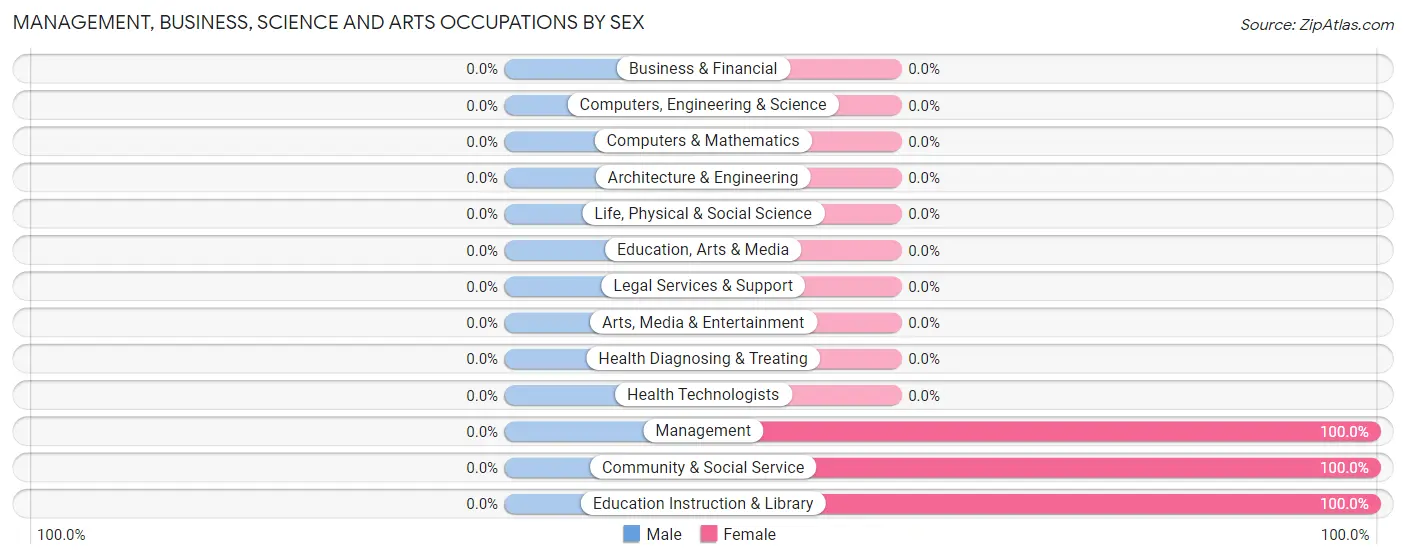
| Occupation | Male | Female |
| Management | 0 (0.0%) | 15 (100.0%) |
| Business & Financial | 0 (0.0%) | 0 (0.0%) |
| Computers, Engineering & Science | 0 (0.0%) | 0 (0.0%) |
| Computers & Mathematics | 0 (0.0%) | 0 (0.0%) |
| Architecture & Engineering | 0 (0.0%) | 0 (0.0%) |
| Life, Physical & Social Science | 0 (0.0%) | 0 (0.0%) |
| Community & Social Service | 0 (0.0%) | 2 (100.0%) |
| Education, Arts & Media | 0 (0.0%) | 0 (0.0%) |
| Legal Services & Support | 0 (0.0%) | 0 (0.0%) |
| Education Instruction & Library | 0 (0.0%) | 2 (100.0%) |
| Arts, Media & Entertainment | 0 (0.0%) | 0 (0.0%) |
| Health Diagnosing & Treating | 0 (0.0%) | 0 (0.0%) |
| Health Technologists | 0 (0.0%) | 0 (0.0%) |
| Total (Category) | 0 (0.0%) | 17 (100.0%) |
| Total (Overall) | 7 (25.0%) | 21 (75.0%) |
Services Occupations
The most common Services occupations in St George are , and Food Preparation & Serving (1 | 3.6%).
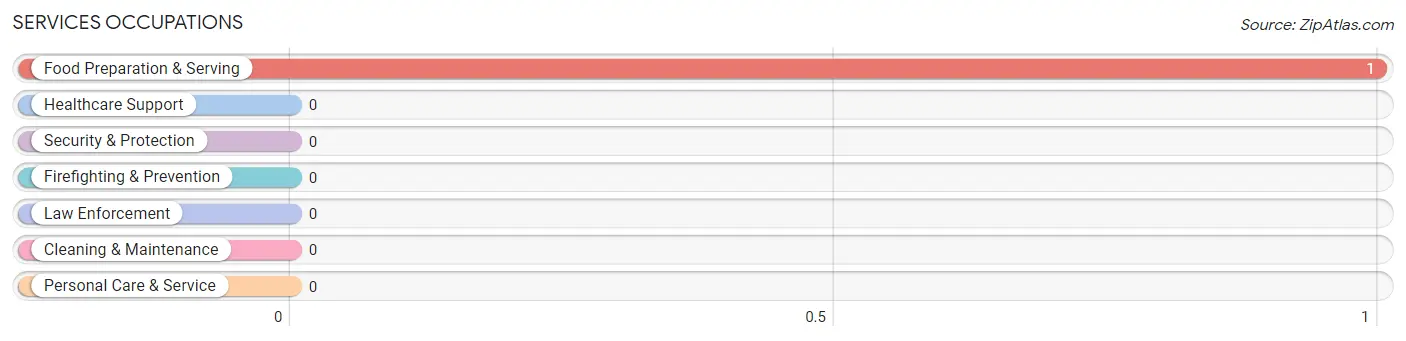
Services Occupations by Sex
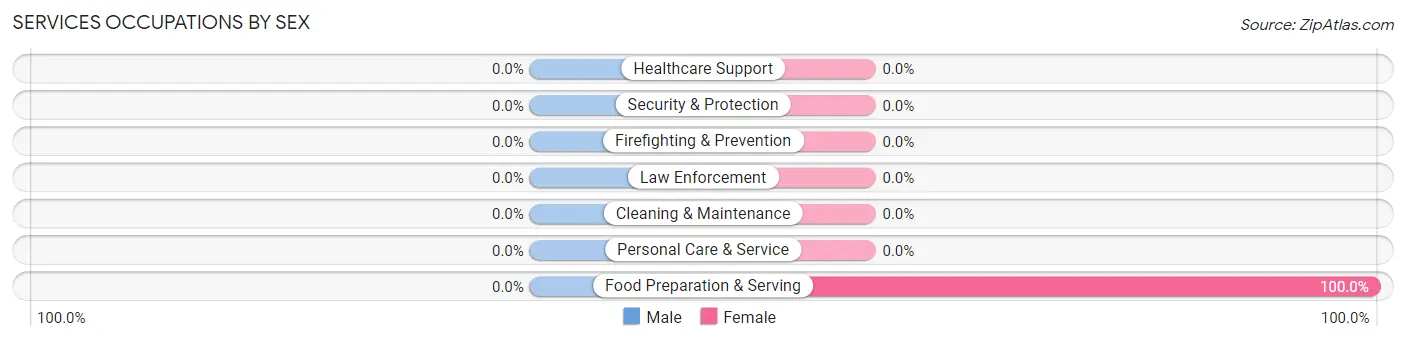
| Occupation | Male | Female |
| Healthcare Support | 0 (0.0%) | 0 (0.0%) |
| Security & Protection | 0 (0.0%) | 0 (0.0%) |
| Firefighting & Prevention | 0 (0.0%) | 0 (0.0%) |
| Law Enforcement | 0 (0.0%) | 0 (0.0%) |
| Food Preparation & Serving | 0 (0.0%) | 1 (100.0%) |
| Cleaning & Maintenance | 0 (0.0%) | 0 (0.0%) |
| Personal Care & Service | 0 (0.0%) | 0 (0.0%) |
| Total (Category) | 0 (0.0%) | 1 (100.0%) |
| Total (Overall) | 7 (25.0%) | 21 (75.0%) |
Sales and Office Occupations
The most common Sales and Office occupations in St George are , and Office & Administration (3 | 10.7%).
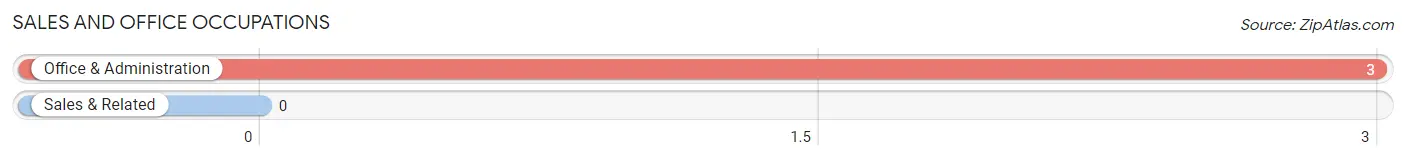
Sales and Office Occupations by Sex

| Occupation | Male | Female |
| Sales & Related | 0 (0.0%) | 0 (0.0%) |
| Office & Administration | 0 (0.0%) | 3 (100.0%) |
| Total (Category) | 0 (0.0%) | 3 (100.0%) |
| Total (Overall) | 7 (25.0%) | 21 (75.0%) |
Natural Resources, Construction and Maintenance Occupations
The most common Natural Resources, Construction and Maintenance occupations in St George are Farming, Fishing & Forestry (5 | 17.9%), and Construction & Extraction (1 | 3.6%).
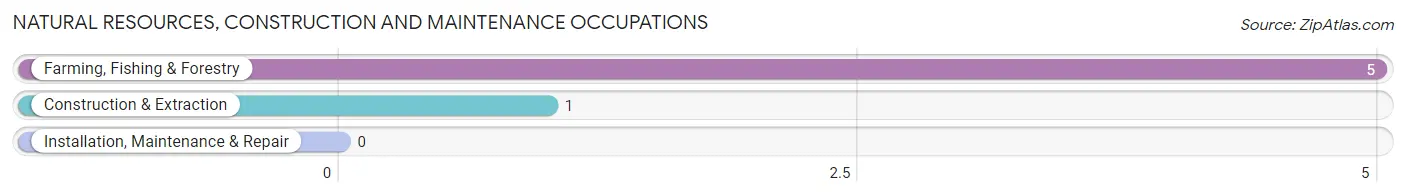
Natural Resources, Construction and Maintenance Occupations by Sex
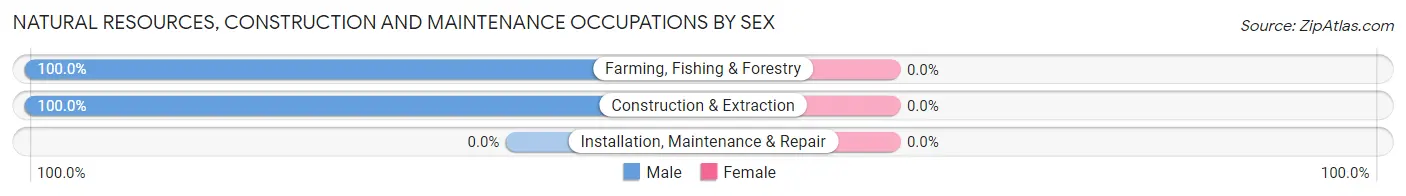
| Occupation | Male | Female |
| Farming, Fishing & Forestry | 5 (100.0%) | 0 (0.0%) |
| Construction & Extraction | 1 (100.0%) | 0 (0.0%) |
| Installation, Maintenance & Repair | 0 (0.0%) | 0 (0.0%) |
| Total (Category) | 6 (100.0%) | 0 (0.0%) |
| Total (Overall) | 7 (25.0%) | 21 (75.0%) |
Production, Transportation and Moving Occupations
The most common Production, Transportation and Moving occupations in St George are , and Transportation (1 | 3.6%).
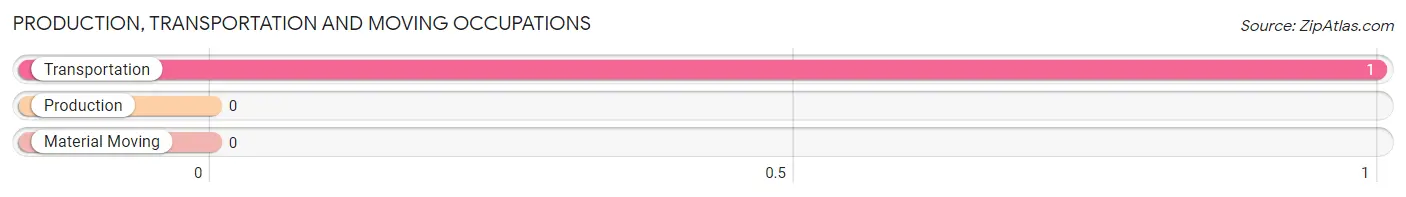
Production, Transportation and Moving Occupations by Sex
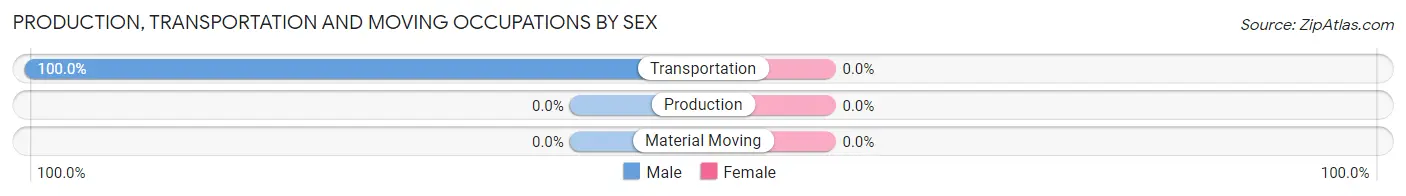
| Occupation | Male | Female |
| Production | 0 (0.0%) | 0 (0.0%) |
| Transportation | 1 (100.0%) | 0 (0.0%) |
| Material Moving | 0 (0.0%) | 0 (0.0%) |
| Total (Category) | 1 (100.0%) | 0 (0.0%) |
| Total (Overall) | 7 (25.0%) | 21 (75.0%) |
Employment Industries by Sex in St George
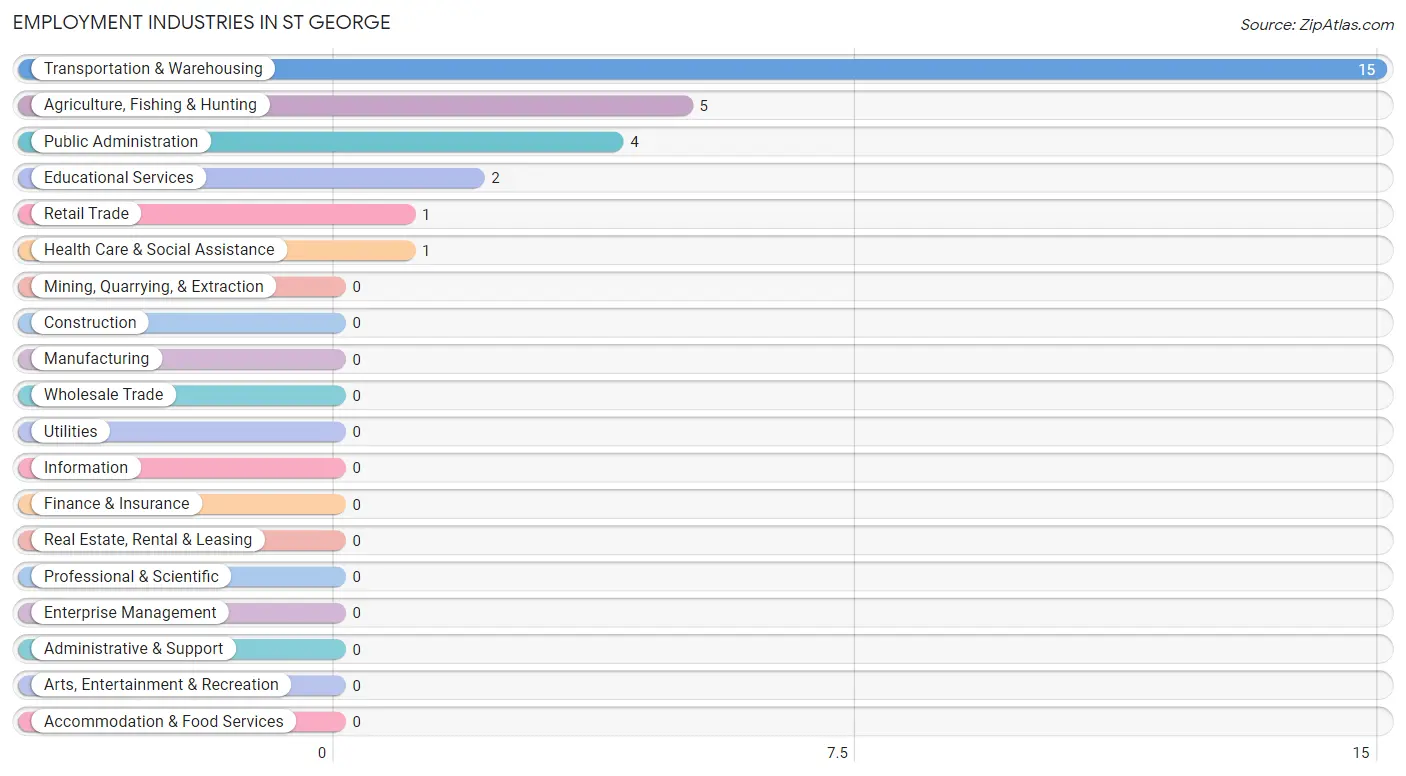
Employment Industries in St George
The major employment industries in St George include Transportation & Warehousing (15 | 53.6%), Agriculture, Fishing & Hunting (5 | 17.9%), Public Administration (4 | 14.3%), Educational Services (2 | 7.1%), and Retail Trade (1 | 3.6%).
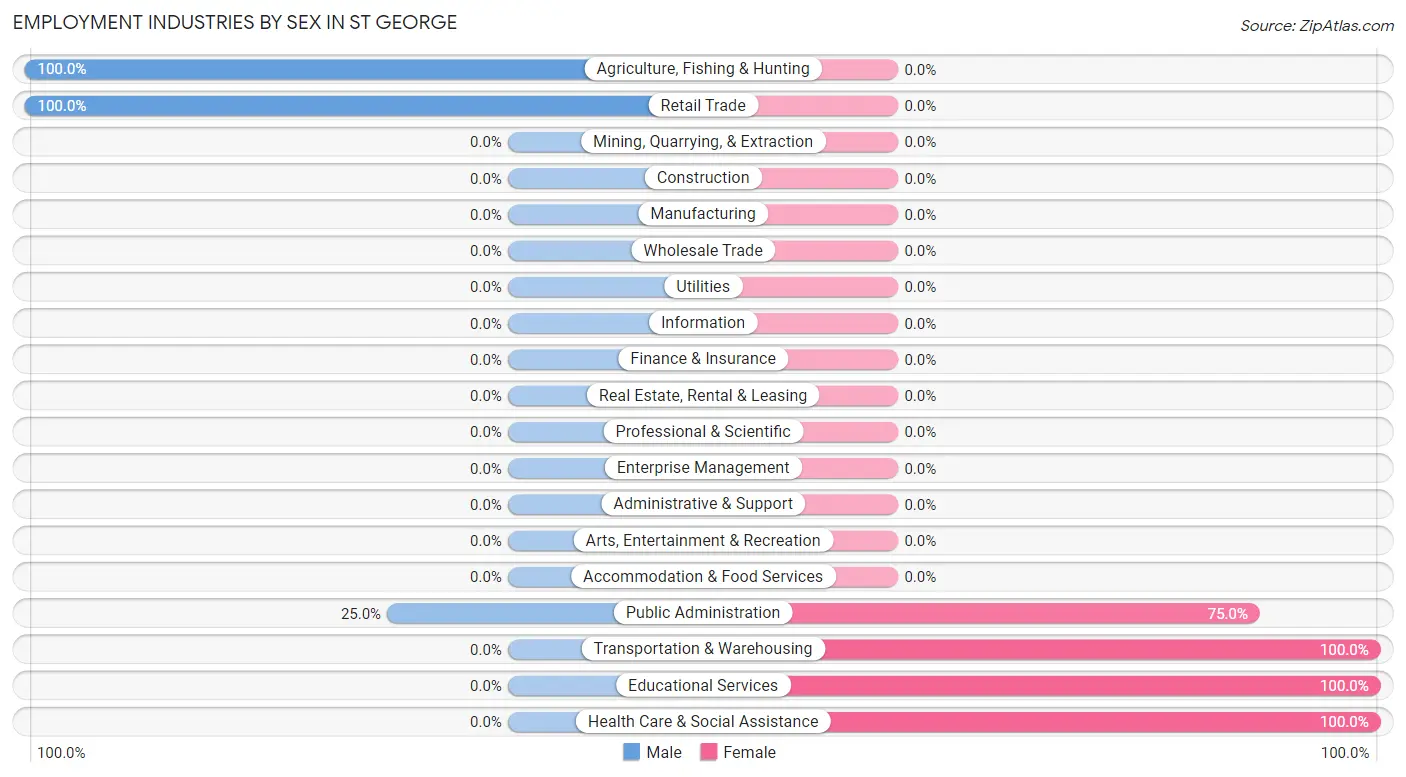
Employment Industries by Sex in St George
The St George industries that see more men than women are Agriculture, Fishing & Hunting (100.0%), Retail Trade (100.0%), and Public Administration (25.0%), whereas the industries that tend to have a higher number of women are Transportation & Warehousing (100.0%), Educational Services (100.0%), and Health Care & Social Assistance (100.0%).
| Industry | Male | Female |
| Agriculture, Fishing & Hunting | 5 (100.0%) | 0 (0.0%) |
| Mining, Quarrying, & Extraction | 0 (0.0%) | 0 (0.0%) |
| Construction | 0 (0.0%) | 0 (0.0%) |
| Manufacturing | 0 (0.0%) | 0 (0.0%) |
| Wholesale Trade | 0 (0.0%) | 0 (0.0%) |
| Retail Trade | 1 (100.0%) | 0 (0.0%) |
| Transportation & Warehousing | 0 (0.0%) | 15 (100.0%) |
| Utilities | 0 (0.0%) | 0 (0.0%) |
| Information | 0 (0.0%) | 0 (0.0%) |
| Finance & Insurance | 0 (0.0%) | 0 (0.0%) |
| Real Estate, Rental & Leasing | 0 (0.0%) | 0 (0.0%) |
| Professional & Scientific | 0 (0.0%) | 0 (0.0%) |
| Enterprise Management | 0 (0.0%) | 0 (0.0%) |
| Administrative & Support | 0 (0.0%) | 0 (0.0%) |
| Educational Services | 0 (0.0%) | 2 (100.0%) |
| Health Care & Social Assistance | 0 (0.0%) | 1 (100.0%) |
| Arts, Entertainment & Recreation | 0 (0.0%) | 0 (0.0%) |
| Accommodation & Food Services | 0 (0.0%) | 0 (0.0%) |
| Public Administration | 1 (25.0%) | 3 (75.0%) |
| Total | 7 (25.0%) | 21 (75.0%) |
Education in St George
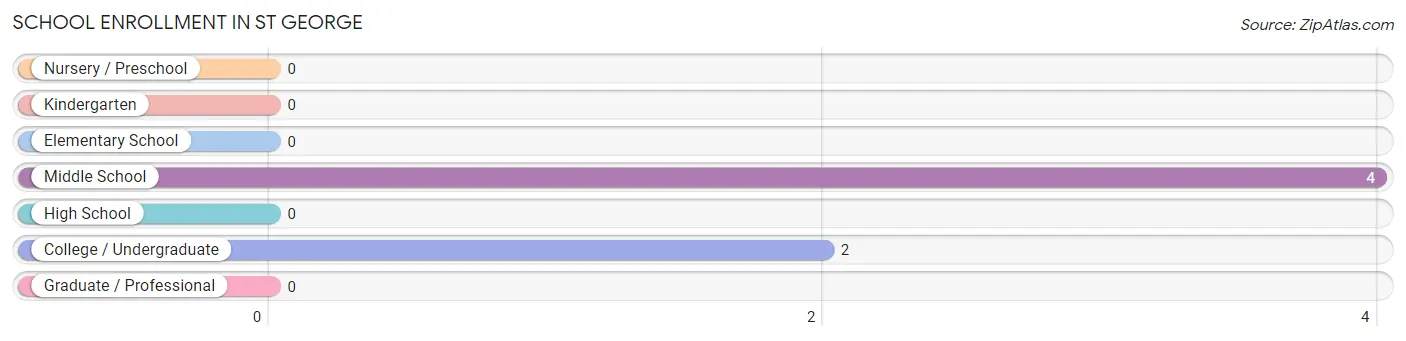
School Enrollment in St George
The most common levels of schooling among the 6 students in St George are middle school (4 | 66.7%), and college / undergraduate (2 | 33.3%).
| School Level | # Students | % Students |
| Nursery / Preschool | 0 | 0.0% |
| Kindergarten | 0 | 0.0% |
| Elementary School | 0 | 0.0% |
| Middle School | 4 | 66.7% |
| High School | 0 | 0.0% |
| College / Undergraduate | 2 | 33.3% |
| Graduate / Professional | 0 | 0.0% |
| Total | 6 | 100.0% |
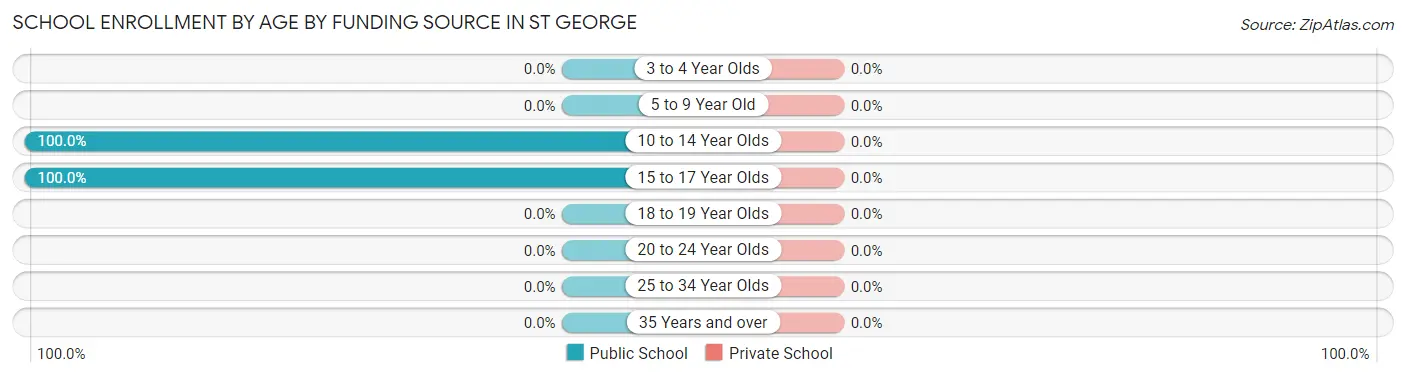
School Enrollment by Age by Funding Source in St George
| Age Bracket | Public School | Private School |
| 3 to 4 Year Olds | 0 (0.0%) | 0 (0.0%) |
| 5 to 9 Year Old | 0 (0.0%) | 0 (0.0%) |
| 10 to 14 Year Olds | 4 (100.0%) | 0 (0.0%) |
| 15 to 17 Year Olds | 2 (100.0%) | 0 (0.0%) |
| 18 to 19 Year Olds | 0 (0.0%) | 0 (0.0%) |
| 20 to 24 Year Olds | 0 (0.0%) | 0 (0.0%) |
| 25 to 34 Year Olds | 0 (0.0%) | 0 (0.0%) |
| 35 Years and over | 0 (0.0%) | 0 (0.0%) |
| Total | 6 (100.0%) | 0 (0.0%) |
Educational Attainment by Field of Study in St George
Psychology (4 | 66.7%), and education (2 | 33.3%) are the most common fields of study among 6 individuals in St George who have obtained a bachelor's degree or higher.
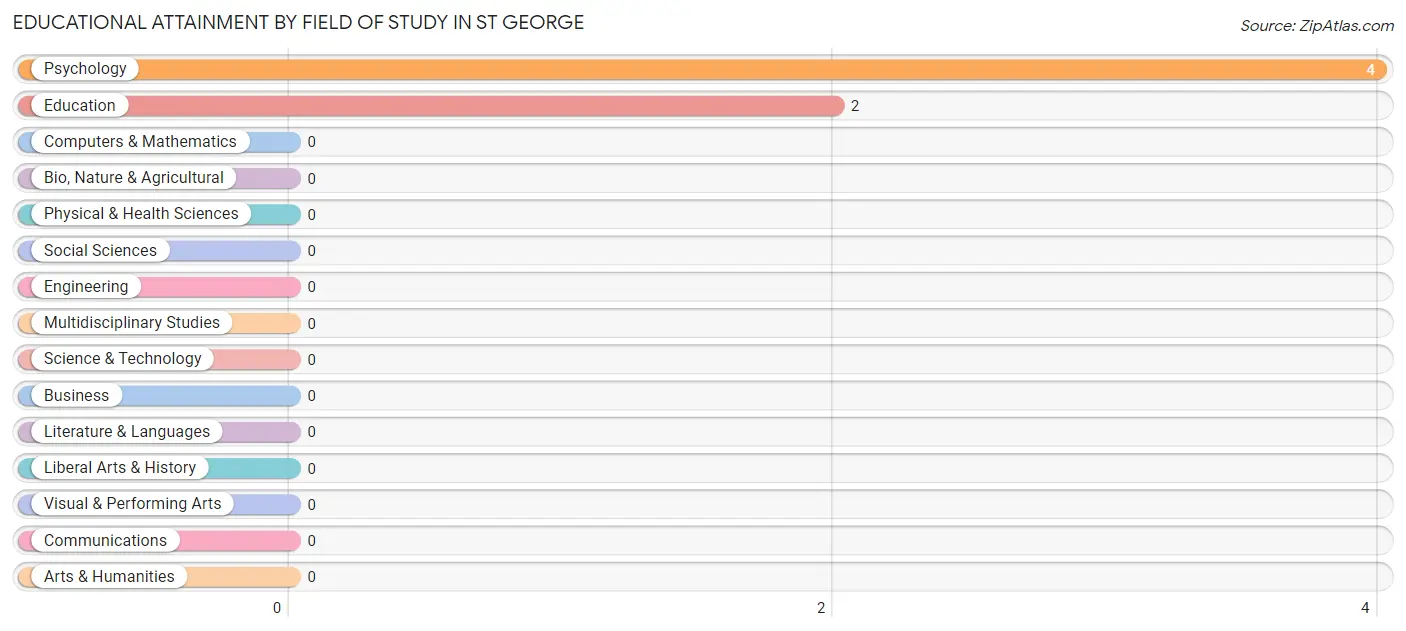
| Field of Study | # Graduates | % Graduates |
| Computers & Mathematics | 0 | 0.0% |
| Bio, Nature & Agricultural | 0 | 0.0% |
| Physical & Health Sciences | 0 | 0.0% |
| Psychology | 4 | 66.7% |
| Social Sciences | 0 | 0.0% |
| Engineering | 0 | 0.0% |
| Multidisciplinary Studies | 0 | 0.0% |
| Science & Technology | 0 | 0.0% |
| Business | 0 | 0.0% |
| Education | 2 | 33.3% |
| Literature & Languages | 0 | 0.0% |
| Liberal Arts & History | 0 | 0.0% |
| Visual & Performing Arts | 0 | 0.0% |
| Communications | 0 | 0.0% |
| Arts & Humanities | 0 | 0.0% |
| Total | 6 | 100.0% |
Transportation & Commute in St George
Vehicle Availability by Sex in St George
The most prevalent vehicle ownership categories in St George are males with 1 vehicle (3, accounting for 42.9%) and females with 1 vehicle (0, making up 14.3%).
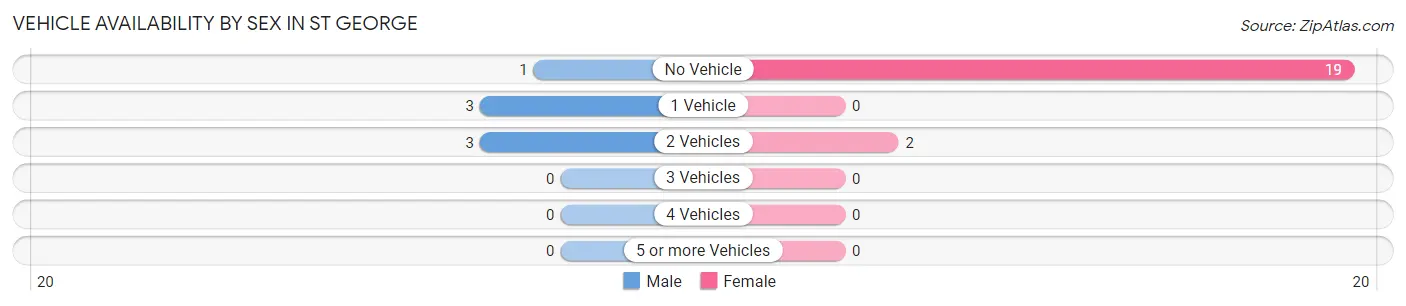
| Vehicles Available | Male | Female |
| No Vehicle | 1 (14.3%) | 19 (90.5%) |
| 1 Vehicle | 3 (42.9%) | 0 (0.0%) |
| 2 Vehicles | 3 (42.9%) | 2 (9.5%) |
| 3 Vehicles | 0 (0.0%) | 0 (0.0%) |
| 4 Vehicles | 0 (0.0%) | 0 (0.0%) |
| 5 or more Vehicles | 0 (0.0%) | 0 (0.0%) |
| Total | 7 (100.0%) | 21 (100.0%) |
Commute Time in St George
The most frequently occuring commute durations in St George are less than 5 minutes (18 commuters, 75.0%), 15 to 19 minutes (4 commuters, 16.7%), and 5 to 9 minutes (2 commuters, 8.3%).
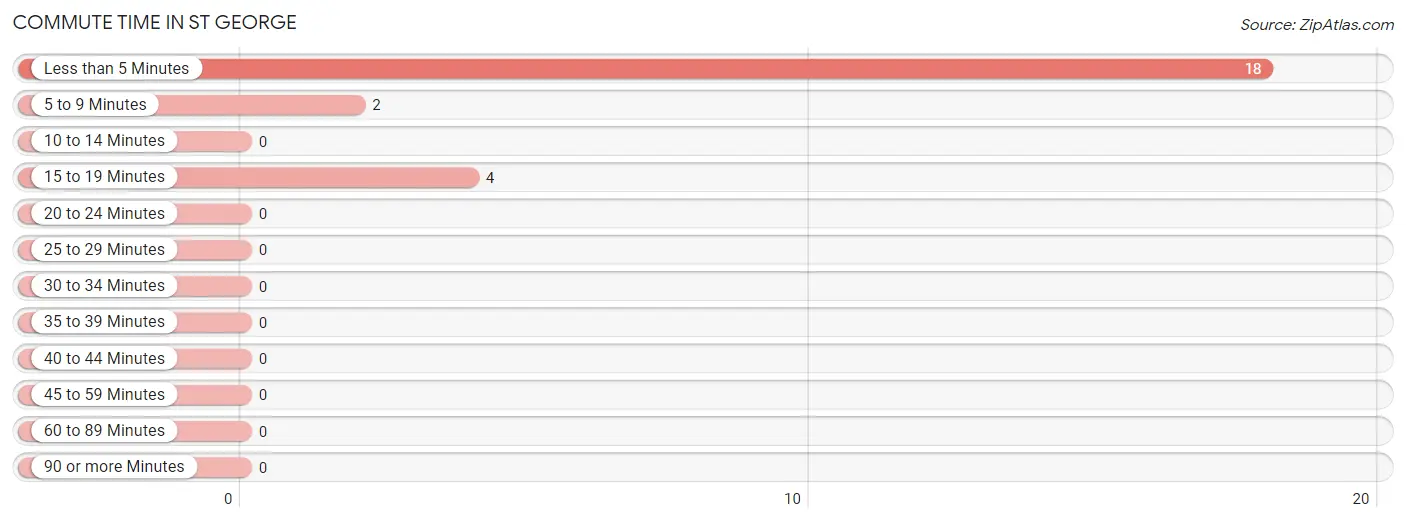
| Commute Time | # Commuters | % Commuters |
| Less than 5 Minutes | 18 | 75.0% |
| 5 to 9 Minutes | 2 | 8.3% |
| 10 to 14 Minutes | 0 | 0.0% |
| 15 to 19 Minutes | 4 | 16.7% |
| 20 to 24 Minutes | 0 | 0.0% |
| 25 to 29 Minutes | 0 | 0.0% |
| 30 to 34 Minutes | 0 | 0.0% |
| 35 to 39 Minutes | 0 | 0.0% |
| 40 to 44 Minutes | 0 | 0.0% |
| 45 to 59 Minutes | 0 | 0.0% |
| 60 to 89 Minutes | 0 | 0.0% |
| 90 or more Minutes | 0 | 0.0% |
Commute Time by Sex in St George
The most common commute times in St George are 15 to 19 minutes (3 commuters, 75.0%) for males and less than 5 minutes (17 commuters, 85.0%) for females.
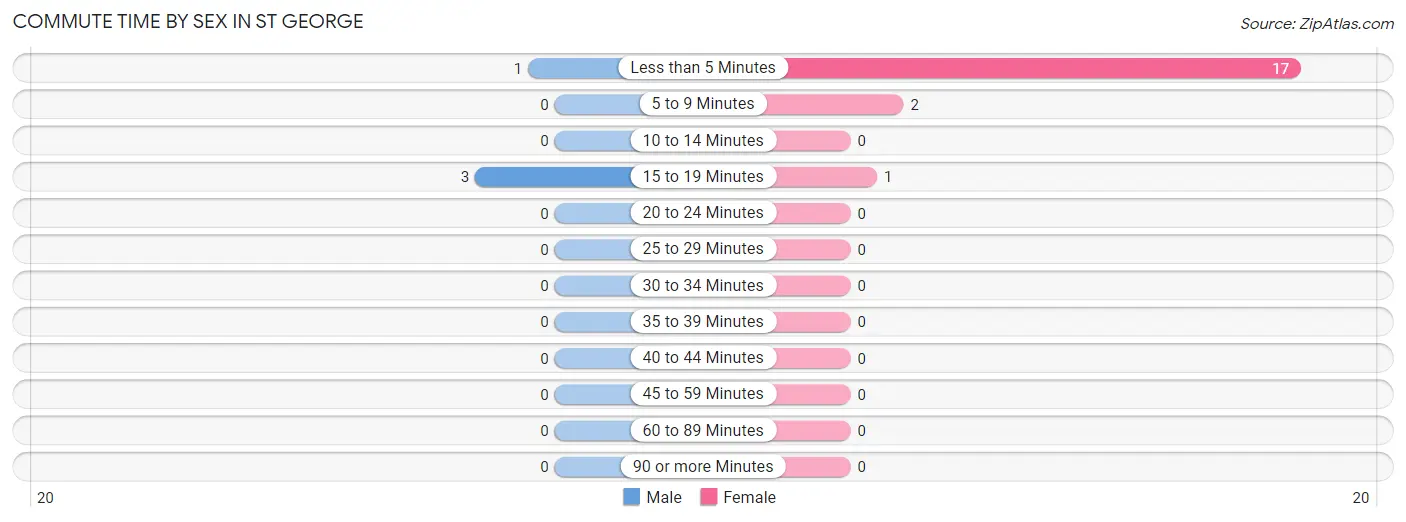
| Commute Time | Male | Female |
| Less than 5 Minutes | 1 (25.0%) | 17 (85.0%) |
| 5 to 9 Minutes | 0 (0.0%) | 2 (10.0%) |
| 10 to 14 Minutes | 0 (0.0%) | 0 (0.0%) |
| 15 to 19 Minutes | 3 (75.0%) | 1 (5.0%) |
| 20 to 24 Minutes | 0 (0.0%) | 0 (0.0%) |
| 25 to 29 Minutes | 0 (0.0%) | 0 (0.0%) |
| 30 to 34 Minutes | 0 (0.0%) | 0 (0.0%) |
| 35 to 39 Minutes | 0 (0.0%) | 0 (0.0%) |
| 40 to 44 Minutes | 0 (0.0%) | 0 (0.0%) |
| 45 to 59 Minutes | 0 (0.0%) | 0 (0.0%) |
| 60 to 89 Minutes | 0 (0.0%) | 0 (0.0%) |
| 90 or more Minutes | 0 (0.0%) | 0 (0.0%) |
Time of Departure to Work by Sex in St George
The most frequent times of departure to work in St George are 9:00 AM to 9:59 AM (3, 75.0%) for males and 9:00 AM to 9:59 AM (14, 70.0%) for females.
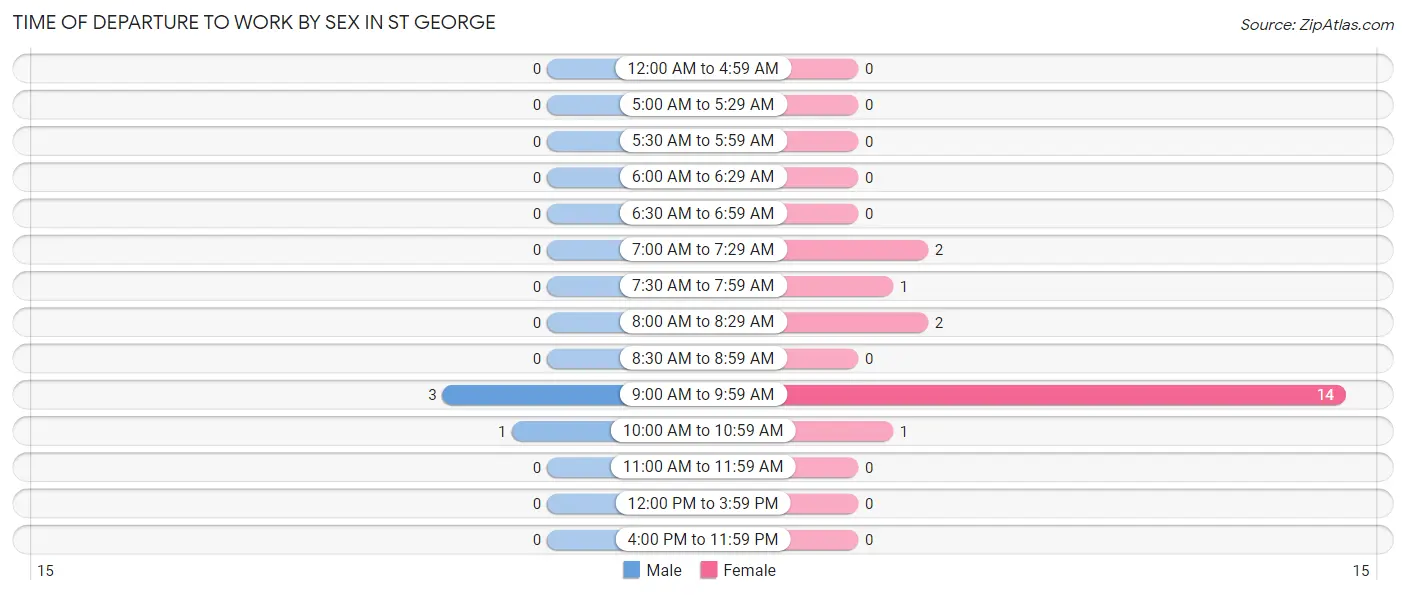
| Time of Departure | Male | Female |
| 12:00 AM to 4:59 AM | 0 (0.0%) | 0 (0.0%) |
| 5:00 AM to 5:29 AM | 0 (0.0%) | 0 (0.0%) |
| 5:30 AM to 5:59 AM | 0 (0.0%) | 0 (0.0%) |
| 6:00 AM to 6:29 AM | 0 (0.0%) | 0 (0.0%) |
| 6:30 AM to 6:59 AM | 0 (0.0%) | 0 (0.0%) |
| 7:00 AM to 7:29 AM | 0 (0.0%) | 2 (10.0%) |
| 7:30 AM to 7:59 AM | 0 (0.0%) | 1 (5.0%) |
| 8:00 AM to 8:29 AM | 0 (0.0%) | 2 (10.0%) |
| 8:30 AM to 8:59 AM | 0 (0.0%) | 0 (0.0%) |
| 9:00 AM to 9:59 AM | 3 (75.0%) | 14 (70.0%) |
| 10:00 AM to 10:59 AM | 1 (25.0%) | 1 (5.0%) |
| 11:00 AM to 11:59 AM | 0 (0.0%) | 0 (0.0%) |
| 12:00 PM to 3:59 PM | 0 (0.0%) | 0 (0.0%) |
| 4:00 PM to 11:59 PM | 0 (0.0%) | 0 (0.0%) |
| Total | 4 (100.0%) | 20 (100.0%) |
Housing Occupancy in St George
Occupancy by Ownership in St George
Of the total 10 dwellings in St George, owner-occupied units account for 9 (90.0%), while renter-occupied units make up 1 (10.0%).
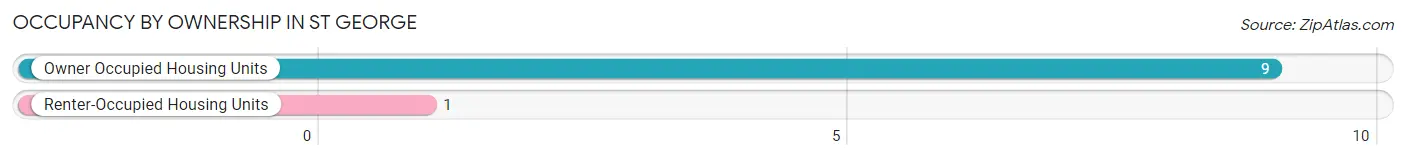
| Occupancy | # Housing Units | % Housing Units |
| Owner Occupied Housing Units | 9 | 90.0% |
| Renter-Occupied Housing Units | 1 | 10.0% |
| Total Occupied Housing Units | 10 | 100.0% |
Occupancy by Household Size in St George
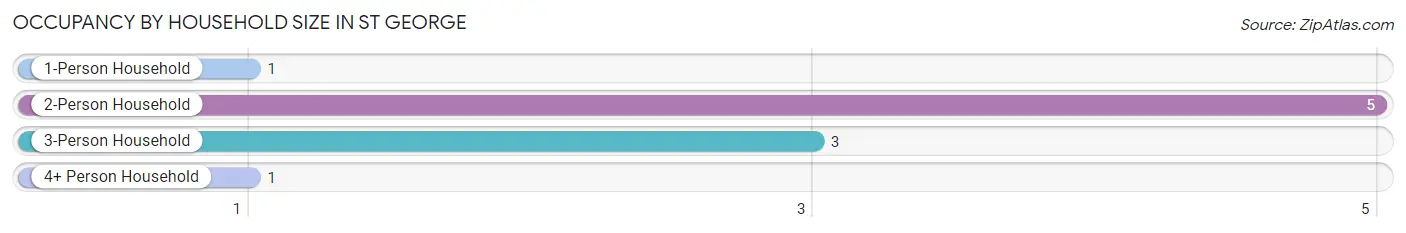
| Household Size | # Housing Units | % Housing Units |
| 1-Person Household | 1 | 10.0% |
| 2-Person Household | 5 | 50.0% |
| 3-Person Household | 3 | 30.0% |
| 4+ Person Household | 1 | 10.0% |
| Total Housing Units | 10 | 100.0% |
Occupancy by Ownership by Household Size in St George
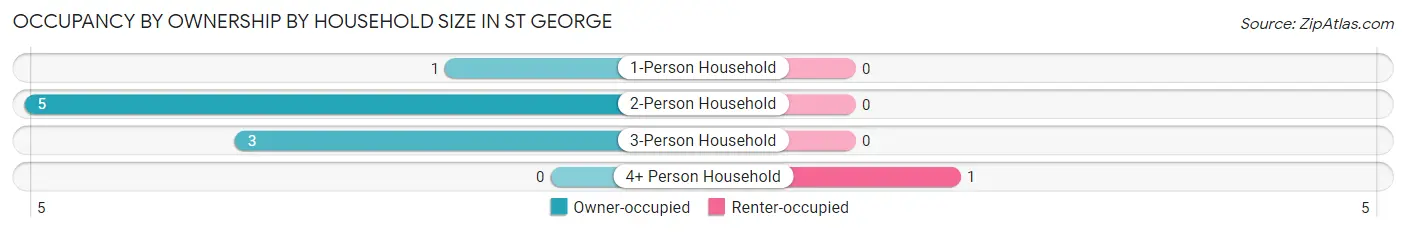
| Household Size | Owner-occupied | Renter-occupied |
| 1-Person Household | 1 (100.0%) | 0 (0.0%) |
| 2-Person Household | 5 (100.0%) | 0 (0.0%) |
| 3-Person Household | 3 (100.0%) | 0 (0.0%) |
| 4+ Person Household | 0 (0.0%) | 1 (100.0%) |
| Total Housing Units | 9 (90.0%) | 1 (10.0%) |
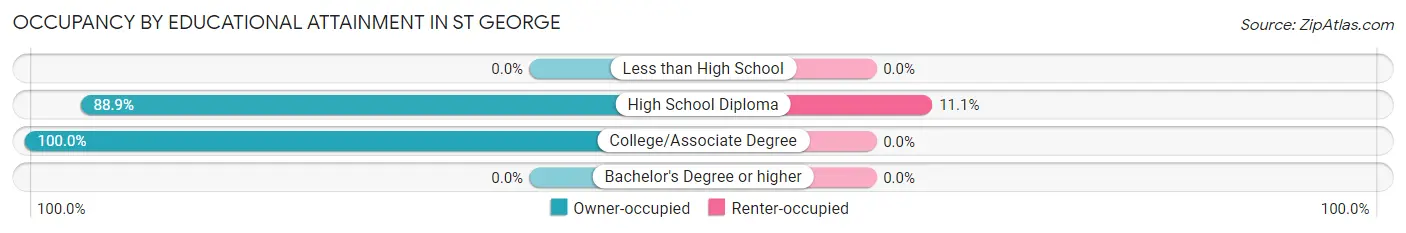
Occupancy by Educational Attainment in St George
| Household Size | Owner-occupied | Renter-occupied |
| Less than High School | 0 (0.0%) | 0 (0.0%) |
| High School Diploma | 8 (88.9%) | 1 (11.1%) |
| College/Associate Degree | 1 (100.0%) | 0 (0.0%) |
| Bachelor's Degree or higher | 0 (0.0%) | 0 (0.0%) |
Occupancy by Age of Householder in St George
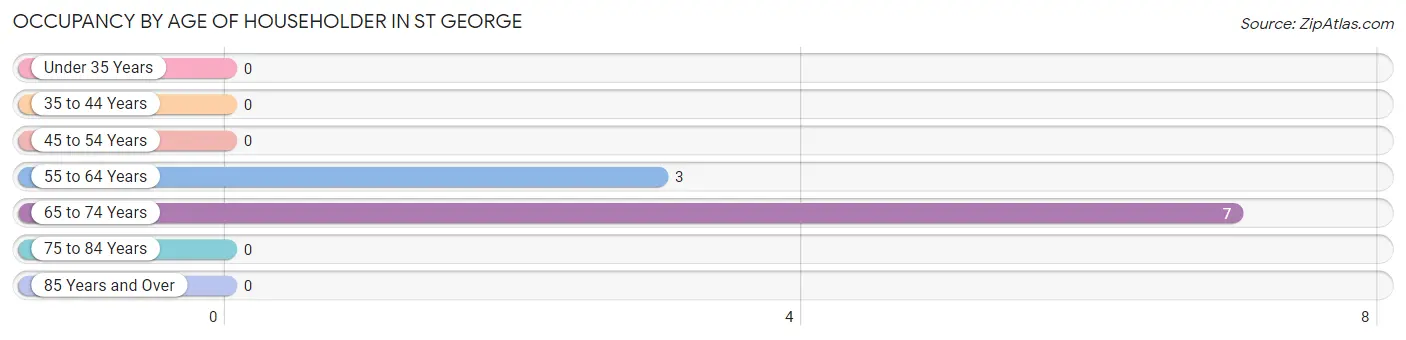
| Age Bracket | # Households | % Households |
| Under 35 Years | 0 | 0.0% |
| 35 to 44 Years | 0 | 0.0% |
| 45 to 54 Years | 0 | 0.0% |
| 55 to 64 Years | 3 | 30.0% |
| 65 to 74 Years | 7 | 70.0% |
| 75 to 84 Years | 0 | 0.0% |
| 85 Years and Over | 0 | 0.0% |
| Total | 10 | 100.0% |
Housing Finances in St George
Median Income by Occupancy in St George
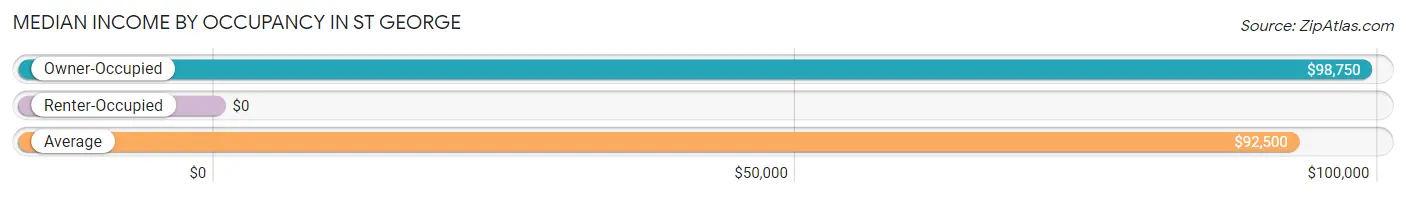
| Occupancy Type | # Households | Median Income |
| Owner-Occupied | 9 (90.0%) | $98,750 |
| Renter-Occupied | 1 (10.0%) | $0 |
| Average | 10 (100.0%) | $92,500 |
Occupancy by Householder Income Bracket in St George
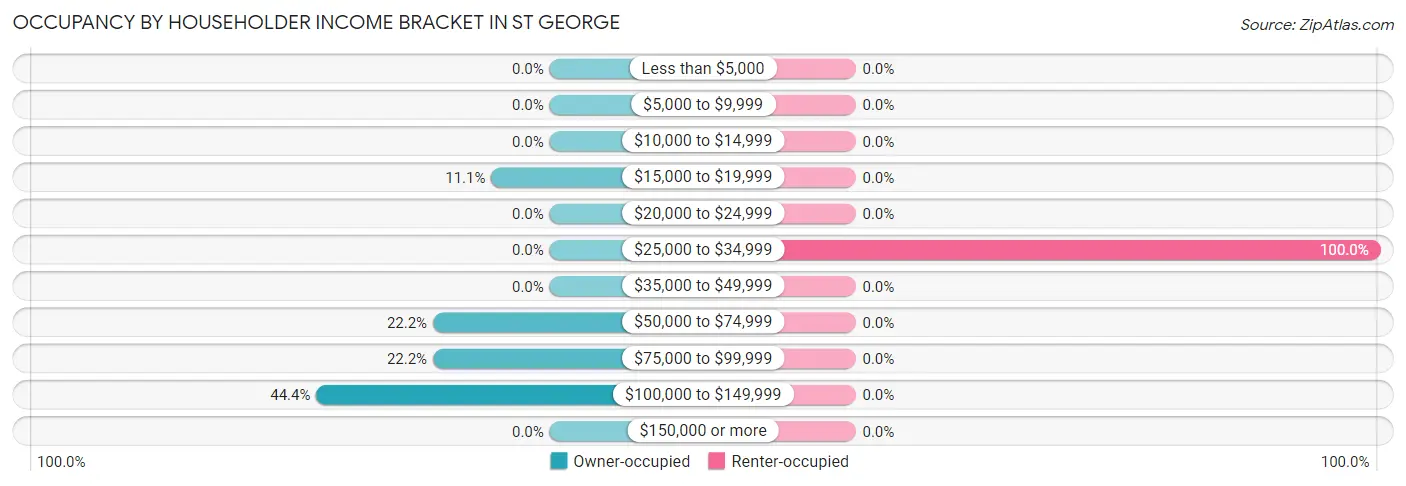
| Income Bracket | Owner-occupied | Renter-occupied |
| Less than $5,000 | 0 (0.0%) | 0 (0.0%) |
| $5,000 to $9,999 | 0 (0.0%) | 0 (0.0%) |
| $10,000 to $14,999 | 0 (0.0%) | 0 (0.0%) |
| $15,000 to $19,999 | 1 (11.1%) | 0 (0.0%) |
| $20,000 to $24,999 | 0 (0.0%) | 0 (0.0%) |
| $25,000 to $34,999 | 0 (0.0%) | 1 (100.0%) |
| $35,000 to $49,999 | 0 (0.0%) | 0 (0.0%) |
| $50,000 to $74,999 | 2 (22.2%) | 0 (0.0%) |
| $75,000 to $99,999 | 2 (22.2%) | 0 (0.0%) |
| $100,000 to $149,999 | 4 (44.4%) | 0 (0.0%) |
| $150,000 or more | 0 (0.0%) | 0 (0.0%) |
| Total | 9 (100.0%) | 1 (100.0%) |
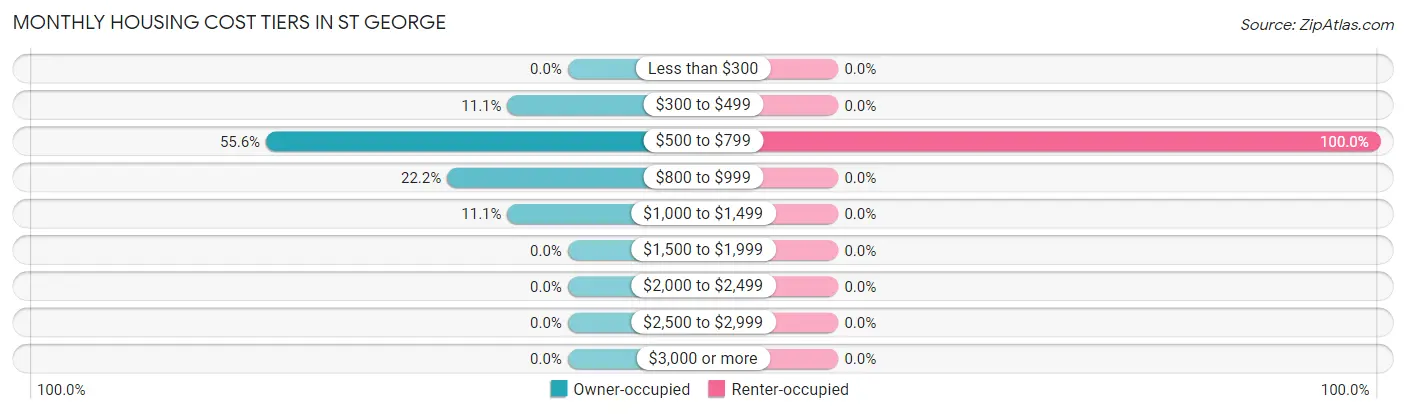
Monthly Housing Cost Tiers in St George
| Monthly Cost | Owner-occupied | Renter-occupied |
| Less than $300 | 0 (0.0%) | 0 (0.0%) |
| $300 to $499 | 1 (11.1%) | 0 (0.0%) |
| $500 to $799 | 5 (55.6%) | 1 (100.0%) |
| $800 to $999 | 2 (22.2%) | 0 (0.0%) |
| $1,000 to $1,499 | 1 (11.1%) | 0 (0.0%) |
| $1,500 to $1,999 | 0 (0.0%) | 0 (0.0%) |
| $2,000 to $2,499 | 0 (0.0%) | 0 (0.0%) |
| $2,500 to $2,999 | 0 (0.0%) | 0 (0.0%) |
| $3,000 or more | 0 (0.0%) | 0 (0.0%) |
| Total | 9 (100.0%) | 1 (100.0%) |
Physical Housing Characteristics in St George
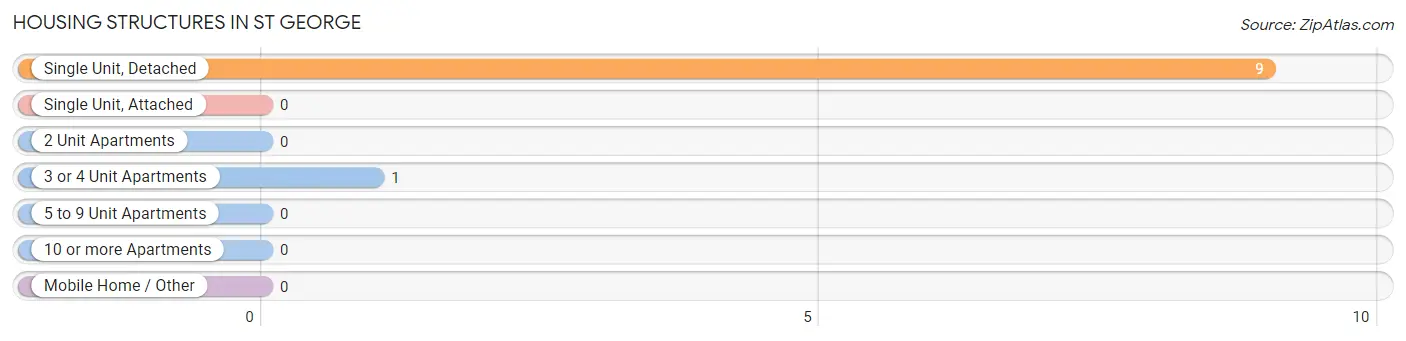
Housing Structures in St George
| Structure Type | # Housing Units | % Housing Units |
| Single Unit, Detached | 9 | 90.0% |
| Single Unit, Attached | 0 | 0.0% |
| 2 Unit Apartments | 0 | 0.0% |
| 3 or 4 Unit Apartments | 1 | 10.0% |
| 5 to 9 Unit Apartments | 0 | 0.0% |
| 10 or more Apartments | 0 | 0.0% |
| Mobile Home / Other | 0 | 0.0% |
| Total | 10 | 100.0% |
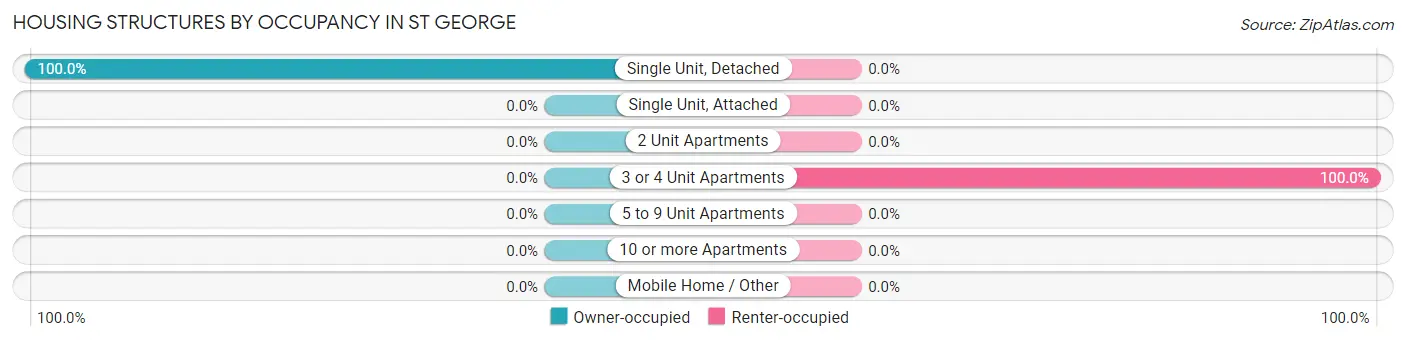
Housing Structures by Occupancy in St George
| Structure Type | Owner-occupied | Renter-occupied |
| Single Unit, Detached | 9 (100.0%) | 0 (0.0%) |
| Single Unit, Attached | 0 (0.0%) | 0 (0.0%) |
| 2 Unit Apartments | 0 (0.0%) | 0 (0.0%) |
| 3 or 4 Unit Apartments | 0 (0.0%) | 1 (100.0%) |
| 5 to 9 Unit Apartments | 0 (0.0%) | 0 (0.0%) |
| 10 or more Apartments | 0 (0.0%) | 0 (0.0%) |
| Mobile Home / Other | 0 (0.0%) | 0 (0.0%) |
| Total | 9 (90.0%) | 1 (10.0%) |
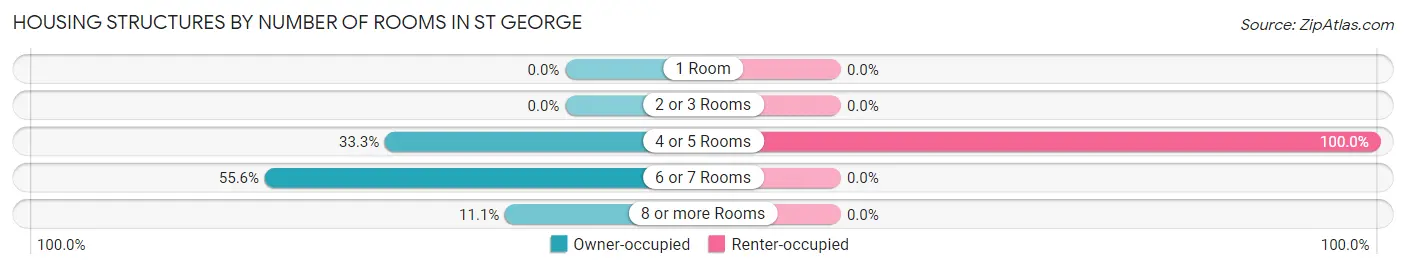
Housing Structures by Number of Rooms in St George
| Number of Rooms | Owner-occupied | Renter-occupied |
| 1 Room | 0 (0.0%) | 0 (0.0%) |
| 2 or 3 Rooms | 0 (0.0%) | 0 (0.0%) |
| 4 or 5 Rooms | 3 (33.3%) | 1 (100.0%) |
| 6 or 7 Rooms | 5 (55.6%) | 0 (0.0%) |
| 8 or more Rooms | 1 (11.1%) | 0 (0.0%) |
| Total | 9 (100.0%) | 1 (100.0%) |
Housing Structure by Heating Type in St George
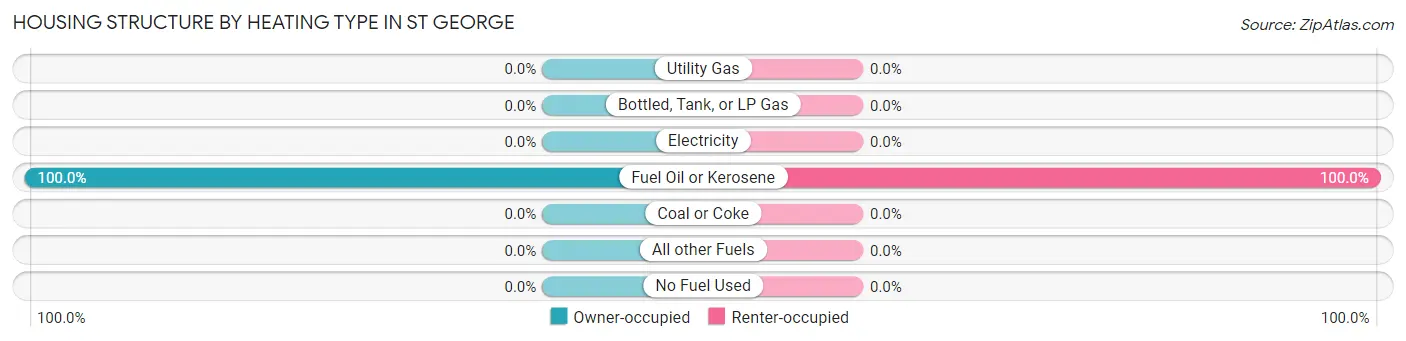
| Heating Type | Owner-occupied | Renter-occupied |
| Utility Gas | 0 (0.0%) | 0 (0.0%) |
| Bottled, Tank, or LP Gas | 0 (0.0%) | 0 (0.0%) |
| Electricity | 0 (0.0%) | 0 (0.0%) |
| Fuel Oil or Kerosene | 9 (100.0%) | 1 (100.0%) |
| Coal or Coke | 0 (0.0%) | 0 (0.0%) |
| All other Fuels | 0 (0.0%) | 0 (0.0%) |
| No Fuel Used | 0 (0.0%) | 0 (0.0%) |
| Total | 9 (100.0%) | 1 (100.0%) |
Household Vehicle Usage in St George
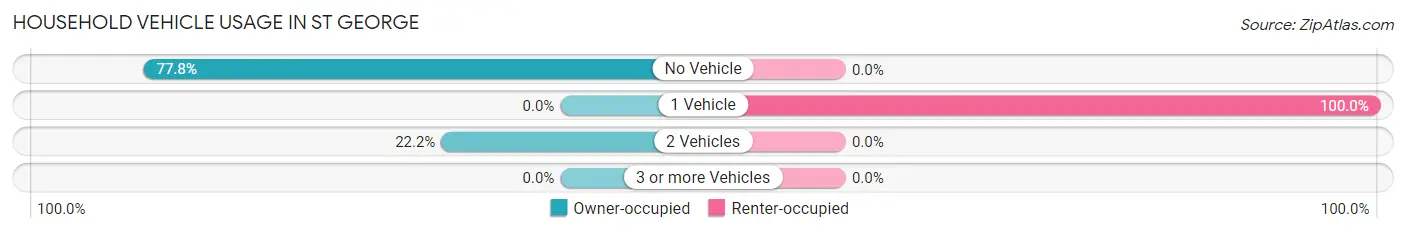
| Vehicles per Household | Owner-occupied | Renter-occupied |
| No Vehicle | 7 (77.8%) | 0 (0.0%) |
| 1 Vehicle | 0 (0.0%) | 1 (100.0%) |
| 2 Vehicles | 2 (22.2%) | 0 (0.0%) |
| 3 or more Vehicles | 0 (0.0%) | 0 (0.0%) |
| Total | 9 (100.0%) | 1 (100.0%) |
Real Estate & Mortgages in St George
Real Estate and Mortgage Overview in St George
| Characteristic | Without Mortgage | With Mortgage |
| Housing Units | 6 | 3 |
| Median Property Value | - | - |
| Median Household Income | $91,250 | $0 |
| Monthly Housing Costs | $567 | $0 |
| Real Estate Taxes | - | - |
Property Value by Mortgage Status in St George
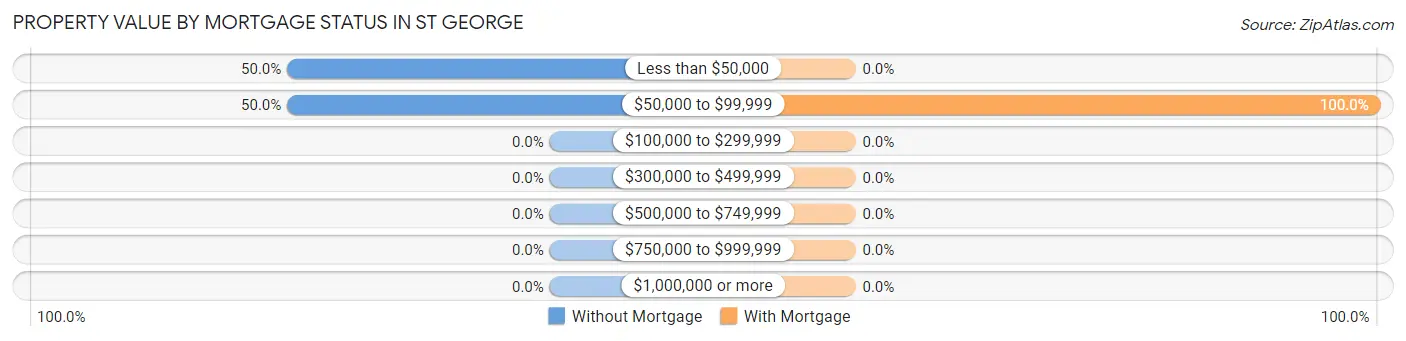
| Property Value | Without Mortgage | With Mortgage |
| Less than $50,000 | 3 (50.0%) | 0 (0.0%) |
| $50,000 to $99,999 | 3 (50.0%) | 3 (100.0%) |
| $100,000 to $299,999 | 0 (0.0%) | 0 (0.0%) |
| $300,000 to $499,999 | 0 (0.0%) | 0 (0.0%) |
| $500,000 to $749,999 | 0 (0.0%) | 0 (0.0%) |
| $750,000 to $999,999 | 0 (0.0%) | 0 (0.0%) |
| $1,000,000 or more | 0 (0.0%) | 0 (0.0%) |
| Total | 6 (100.0%) | 3 (100.0%) |
Household Income by Mortgage Status in St George
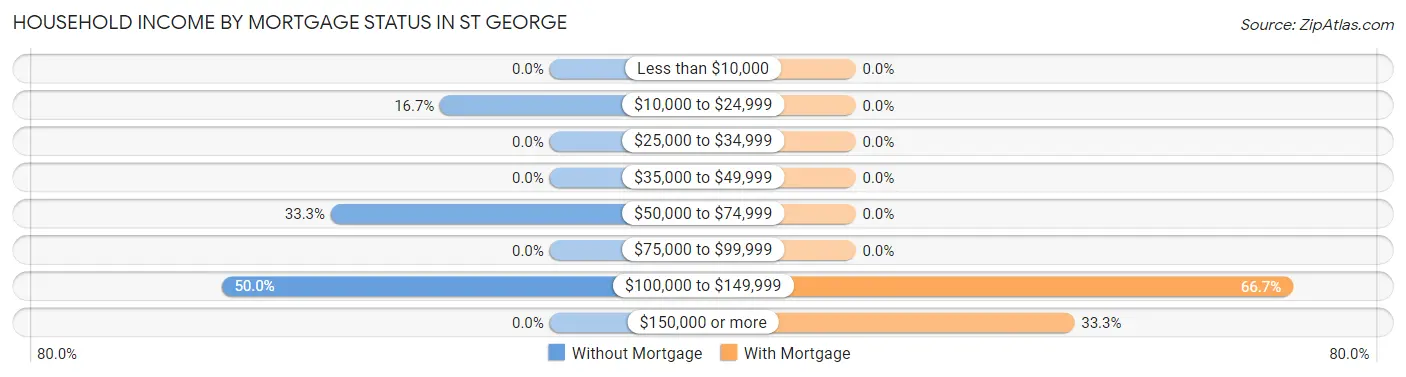
| Household Income | Without Mortgage | With Mortgage |
| Less than $10,000 | 0 (0.0%) | 0 (0.0%) |
| $10,000 to $24,999 | 1 (16.7%) | 0 (0.0%) |
| $25,000 to $34,999 | 0 (0.0%) | 0 (0.0%) |
| $35,000 to $49,999 | 0 (0.0%) | 0 (0.0%) |
| $50,000 to $74,999 | 2 (33.3%) | 0 (0.0%) |
| $75,000 to $99,999 | 0 (0.0%) | 0 (0.0%) |
| $100,000 to $149,999 | 3 (50.0%) | 2 (66.7%) |
| $150,000 or more | 0 (0.0%) | 1 (33.3%) |
| Total | 6 (100.0%) | 3 (100.0%) |
Property Value to Household Income Ratio in St George
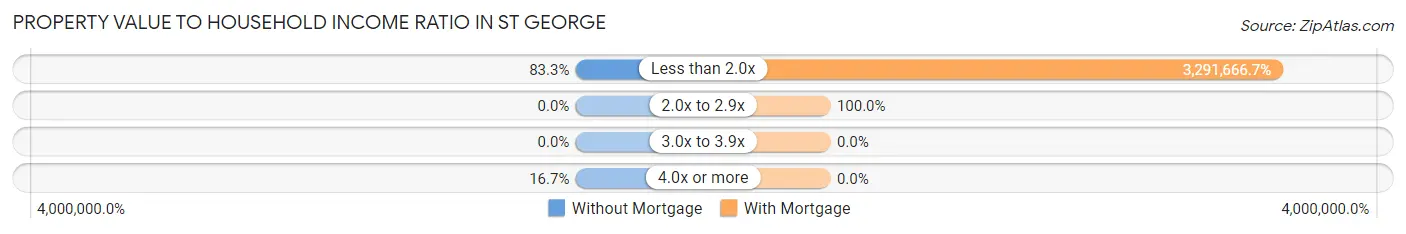
| Value-to-Income Ratio | Without Mortgage | With Mortgage |
| Less than 2.0x | 5 (83.3%) | 98,750 (3,291,666.7%) |
| 2.0x to 2.9x | 0 (0.0%) | 3 (100.0%) |
| 3.0x to 3.9x | 0 (0.0%) | 0 (0.0%) |
| 4.0x or more | 1 (16.7%) | 0 (0.0%) |
| Total | 6 (100.0%) | 3 (100.0%) |
Real Estate Taxes by Mortgage Status in St George
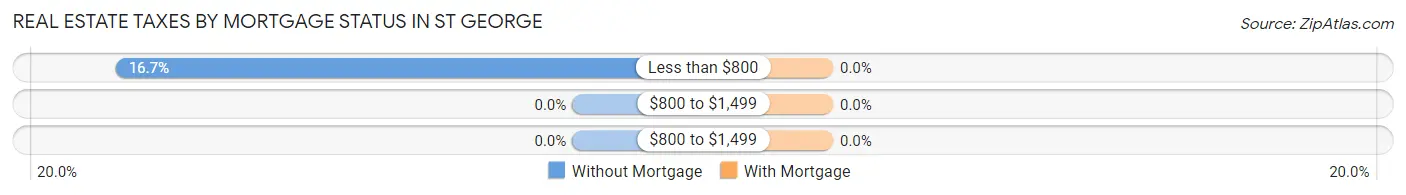
| Property Taxes | Without Mortgage | With Mortgage |
| Less than $800 | 1 (16.7%) | 0 (0.0%) |
| $800 to $1,499 | 0 (0.0%) | 0 (0.0%) |
| $800 to $1,499 | 0 (0.0%) | 0 (0.0%) |
| Total | 6 (100.0%) | 3 (100.0%) |
Health & Disability in St George
Health Insurance Coverage by Age in St George
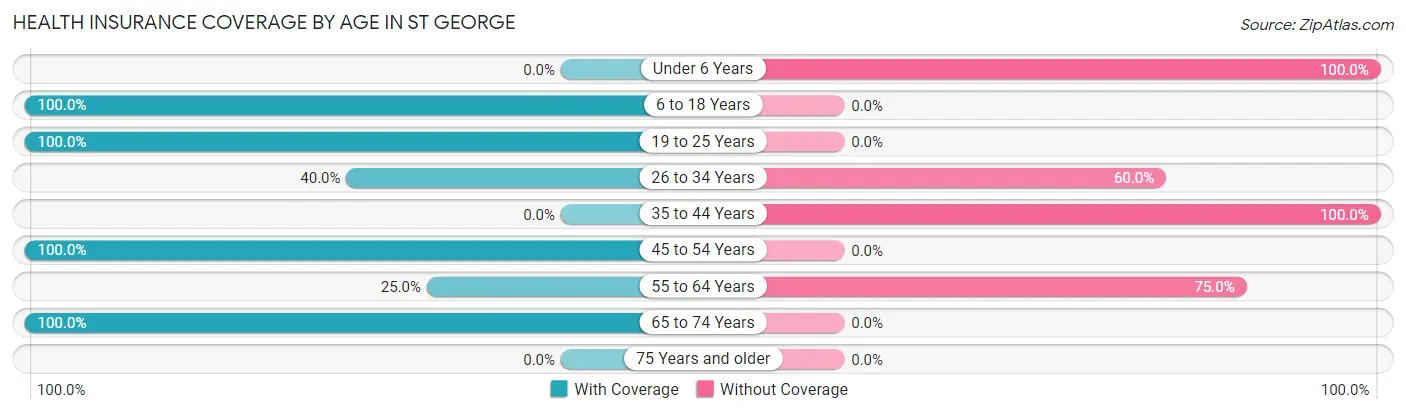
| Age Bracket | With Coverage | Without Coverage |
| Under 6 Years | 0 (0.0%) | 3 (100.0%) |
| 6 to 18 Years | 6 (100.0%) | 0 (0.0%) |
| 19 to 25 Years | 2 (100.0%) | 0 (0.0%) |
| 26 to 34 Years | 6 (40.0%) | 9 (60.0%) |
| 35 to 44 Years | 0 (0.0%) | 14 (100.0%) |
| 45 to 54 Years | 1 (100.0%) | 0 (0.0%) |
| 55 to 64 Years | 1 (25.0%) | 3 (75.0%) |
| 65 to 74 Years | 12 (100.0%) | 0 (0.0%) |
| 75 Years and older | 0 (0.0%) | 0 (0.0%) |
| Total | 28 (49.1%) | 29 (50.9%) |
Health Insurance Coverage by Citizenship Status in St George
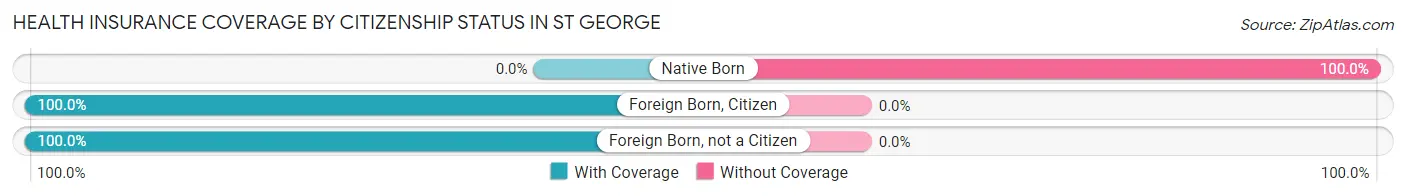
| Citizenship Status | With Coverage | Without Coverage |
| Native Born | 0 (0.0%) | 3 (100.0%) |
| Foreign Born, Citizen | 6 (100.0%) | 0 (0.0%) |
| Foreign Born, not a Citizen | 2 (100.0%) | 0 (0.0%) |
Health Insurance Coverage by Household Income in St George
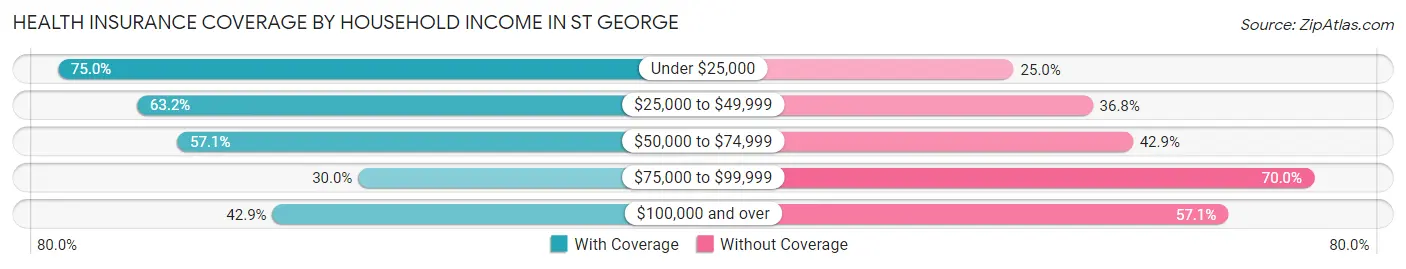
| Household Income | With Coverage | Without Coverage |
| Under $25,000 | 3 (75.0%) | 1 (25.0%) |
| $25,000 to $49,999 | 12 (63.2%) | 7 (36.8%) |
| $50,000 to $74,999 | 4 (57.1%) | 3 (42.9%) |
| $75,000 to $99,999 | 6 (30.0%) | 14 (70.0%) |
| $100,000 and over | 3 (42.9%) | 4 (57.1%) |
Public vs Private Health Insurance Coverage by Age in St George
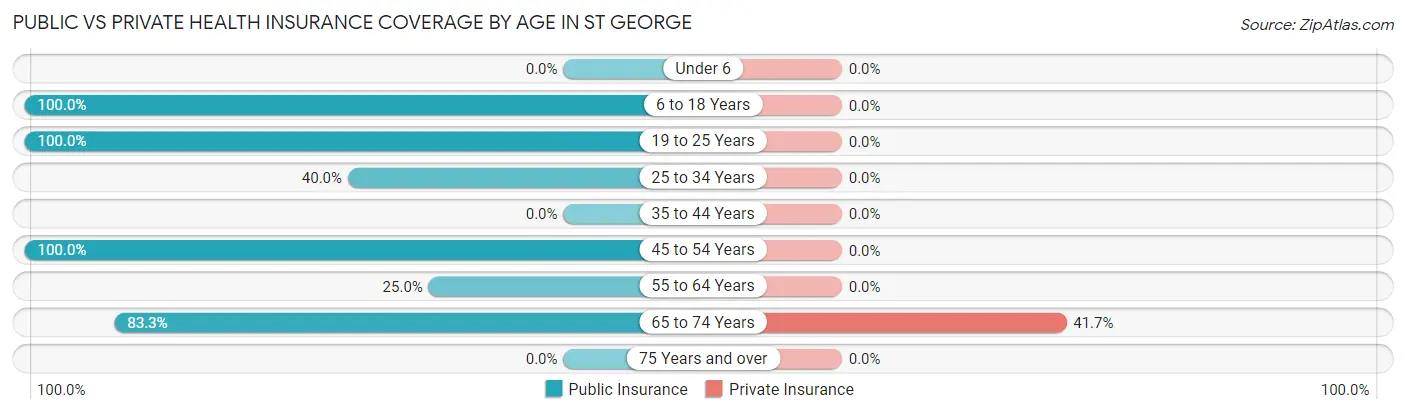
| Age Bracket | Public Insurance | Private Insurance |
| Under 6 | 0 (0.0%) | 0 (0.0%) |
| 6 to 18 Years | 6 (100.0%) | 0 (0.0%) |
| 19 to 25 Years | 2 (100.0%) | 0 (0.0%) |
| 25 to 34 Years | 6 (40.0%) | 0 (0.0%) |
| 35 to 44 Years | 0 (0.0%) | 0 (0.0%) |
| 45 to 54 Years | 1 (100.0%) | 0 (0.0%) |
| 55 to 64 Years | 1 (25.0%) | 0 (0.0%) |
| 65 to 74 Years | 10 (83.3%) | 5 (41.7%) |
| 75 Years and over | 0 (0.0%) | 0 (0.0%) |
| Total | 26 (45.6%) | 5 (8.8%) |
Disability Status by Sex by Age in St George
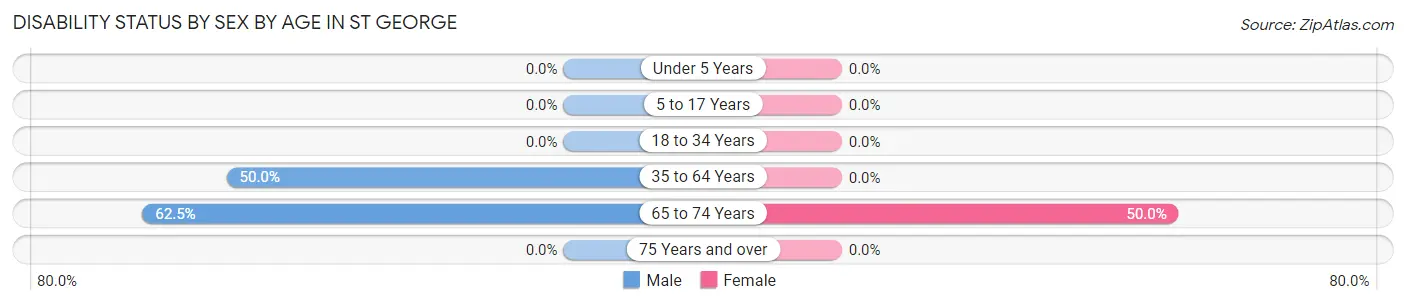
| Age Bracket | Male | Female |
| Under 5 Years | 0 (0.0%) | 0 (0.0%) |
| 5 to 17 Years | 0 (0.0%) | 0 (0.0%) |
| 18 to 34 Years | 0 (0.0%) | 0 (0.0%) |
| 35 to 64 Years | 1 (50.0%) | 0 (0.0%) |
| 65 to 74 Years | 5 (62.5%) | 2 (50.0%) |
| 75 Years and over | 0 (0.0%) | 0 (0.0%) |
Disability Class by Sex by Age in St George
Disability Class: Hearing Difficulty
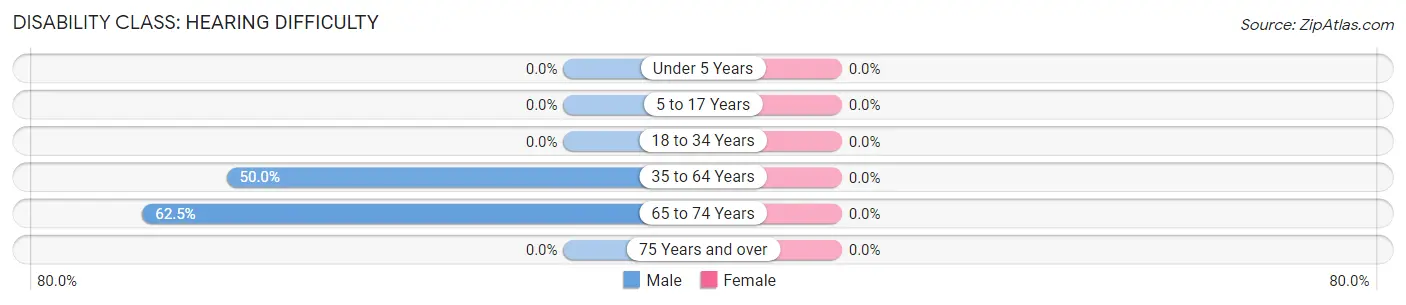
| Age Bracket | Male | Female |
| Under 5 Years | 0 (0.0%) | 0 (0.0%) |
| 5 to 17 Years | 0 (0.0%) | 0 (0.0%) |
| 18 to 34 Years | 0 (0.0%) | 0 (0.0%) |
| 35 to 64 Years | 1 (50.0%) | 0 (0.0%) |
| 65 to 74 Years | 5 (62.5%) | 0 (0.0%) |
| 75 Years and over | 0 (0.0%) | 0 (0.0%) |
Disability Class: Vision Difficulty
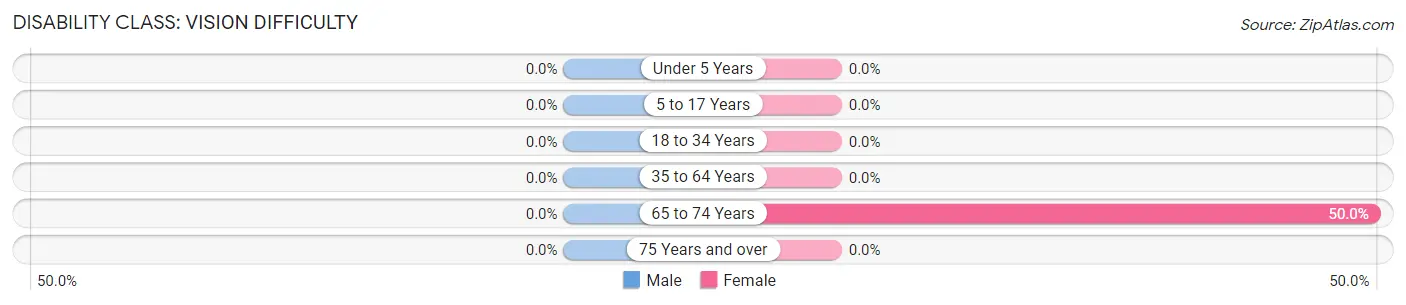
| Age Bracket | Male | Female |
| Under 5 Years | 0 (0.0%) | 0 (0.0%) |
| 5 to 17 Years | 0 (0.0%) | 0 (0.0%) |
| 18 to 34 Years | 0 (0.0%) | 0 (0.0%) |
| 35 to 64 Years | 0 (0.0%) | 0 (0.0%) |
| 65 to 74 Years | 0 (0.0%) | 2 (50.0%) |
| 75 Years and over | 0 (0.0%) | 0 (0.0%) |
Disability Class: Cognitive Difficulty

| Age Bracket | Male | Female |
| 5 to 17 Years | 0 (0.0%) | 0 (0.0%) |
| 18 to 34 Years | 0 (0.0%) | 0 (0.0%) |
| 35 to 64 Years | 0 (0.0%) | 0 (0.0%) |
| 65 to 74 Years | 0 (0.0%) | 0 (0.0%) |
| 75 Years and over | 0 (0.0%) | 0 (0.0%) |
Disability Class: Ambulatory Difficulty
| Age Bracket | Male | Female |
| 5 to 17 Years | 0 (0.0%) | 0 (0.0%) |
| 18 to 34 Years | 0 (0.0%) | 0 (0.0%) |
| 35 to 64 Years | 0 (0.0%) | 0 (0.0%) |
| 65 to 74 Years | 0 (0.0%) | 0 (0.0%) |
| 75 Years and over | 0 (0.0%) | 0 (0.0%) |
Disability Class: Self-Care Difficulty
| Age Bracket | Male | Female |
| 5 to 17 Years | 0 (0.0%) | 0 (0.0%) |
| 18 to 34 Years | 0 (0.0%) | 0 (0.0%) |
| 35 to 64 Years | 0 (0.0%) | 0 (0.0%) |
| 65 to 74 Years | 0 (0.0%) | 0 (0.0%) |
| 75 Years and over | 0 (0.0%) | 0 (0.0%) |
Technology Access in St George
Computing Device Access in St George
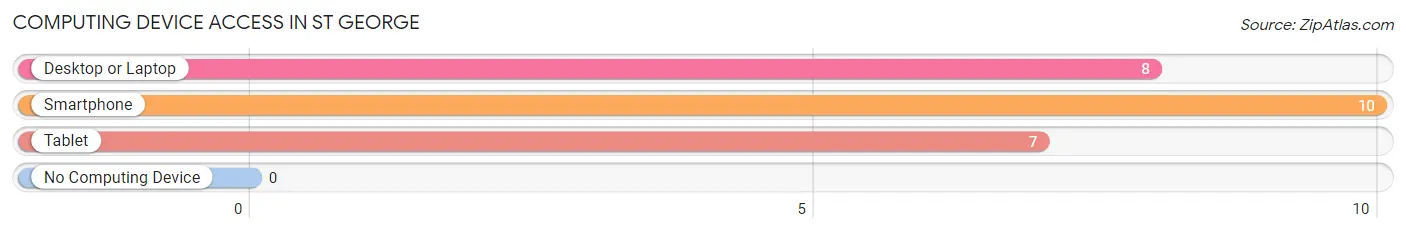
| Device Type | # Households | % Households |
| Desktop or Laptop | 8 | 80.0% |
| Smartphone | 10 | 100.0% |
| Tablet | 7 | 70.0% |
| No Computing Device | 0 | 0.0% |
| Total | 10 | 100.0% |
Internet Access in St George
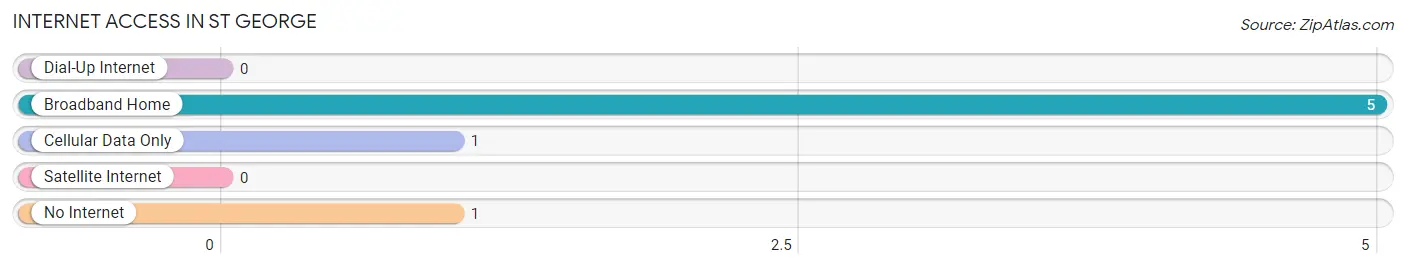
| Internet Type | # Households | % Households |
| Dial-Up Internet | 0 | 0.0% |
| Broadband Home | 5 | 50.0% |
| Cellular Data Only | 1 | 10.0% |
| Satellite Internet | 0 | 0.0% |
| No Internet | 1 | 10.0% |
| Total | 10 | 100.0% |
St George Summary
St George is a small city located in the southwestern corner of Alaska, in the Aleutian Islands. It is the only city in the Aleutian Islands and is the most populous city in the region. The city is located on St. George Island, which is the largest of the Aleutian Islands. The city has a population of approximately 1,000 people and is the only incorporated city in the Aleutian Islands.
History
The first inhabitants of St. George were the Unangan people, who lived on the island for thousands of years before the arrival of Europeans. The Unangan people were hunter-gatherers and relied on the sea for their sustenance. The first Europeans to visit the island were Russian fur traders in the late 1700s. The Russians established a trading post on the island and began trading with the Unangan people.
In 1867, the United States purchased Alaska from Russia and the island became part of the United States. In 1884, the United States government established a military post on the island and named it Fort St. George. The fort was used to protect the United States from potential Russian aggression. In the early 1900s, the fort was abandoned and the island was used as a fishing and hunting base by the Unangan people.
In the 1950s, the United States government began to develop the island for military purposes. The island was used as a base for the United States Air Force and Navy during the Cold War. In the 1960s, the island was developed for commercial purposes and the city of St. George was incorporated in 1967.
Geography
St. George is located on St. George Island, which is the largest of the Aleutian Islands. The island is located in the Bering Sea and is approximately 1,000 miles from Anchorage. The island is approximately 40 miles long and 10 miles wide. The island is mostly mountainous and is covered in tundra and grasslands. The island is home to a variety of wildlife, including bald eagles, sea lions, and whales.
The climate of St. George is subarctic and is characterized by cold winters and mild summers. The average temperature in the summer is around 50 degrees Fahrenheit and the average temperature in the winter is around 20 degrees Fahrenheit. The island receives an average of 40 inches of precipitation per year.
Economy
The economy of St. George is largely based on fishing and tourism. The island is home to a variety of fish, including salmon, halibut, and cod. The fishing industry is the primary source of employment for the island’s residents. The island is also a popular tourist destination, with visitors coming to experience the unique wildlife and scenery of the island.
The island is also home to a variety of businesses, including restaurants, hotels, and retail stores. The island is home to a small airport, which provides transportation to and from the island.
Demographics
As of the 2010 census, the population of St. George was 1,000 people. The population is primarily of Unangan descent, with a small number of other ethnicities. The median age of the population is 35 years old and the median household income is $50,000. The majority of the population is employed in the fishing and tourism industries.
Common Questions
What is the Total Population of St George?
Total Population of St George is 57.
What is the Total Male Population of St George?
Total Male Population of St George is 27.
What is the Total Female Population of St George?
Total Female Population of St George is 30.
What is the Ratio of Males per 100 Females in St George?
There are 90.00 Males per 100 Females in St George.
What is the Ratio of Females per 100 Males in St George?
There are 111.11 Females per 100 Males in St George.
What is the Median Population Age in St George?
Median Population Age in St George is 39.2 Years.
What is the Average Family Size in St George
Average Family Size in St George is 6.2 People.
What is the Average Household Size in St George
Average Household Size in St George is 5.7 People.
What is Per Capita Income in St George?
Per Capita income in St George is $18,540.
What is the Median Family Income in St George?
Median Family Income in St George is $103,750.
What is the Median Household income in St George?
Median Household Income in St George is $92,500.
What is Inequality or Gini Index in St George?
Inequality or Gini Index in St George is 0.21.
How Large is the Labor Force in St George?
There are 28 People in the Labor Forcein in St George.
What is the Percentage of People in the Labor Force in St George?
56.0% of People are in the Labor Force in St George.