Seldovia Village, AK
Seldovia Village Map
Seldovia Village Overview
209
TOTAL POPULATION
103
MALE POPULATION
106
FEMALE POPULATION
97.17
MALES / 100 FEMALES
102.91
FEMALES / 100 MALES
53.2
MEDIAN AGE
2.9
AVG FAMILY SIZE
2.3
AVG HOUSEHOLD SIZE
$36,154
PER CAPITA INCOME
$101,250
AVG FAMILY INCOME
$48,571
AVG HOUSEHOLD INCOME
0.47
INEQUALITY / GINI INDEX
81
LABOR FORCE [ PEOPLE ]
44.0%
PERCENT IN LABOR FORCE
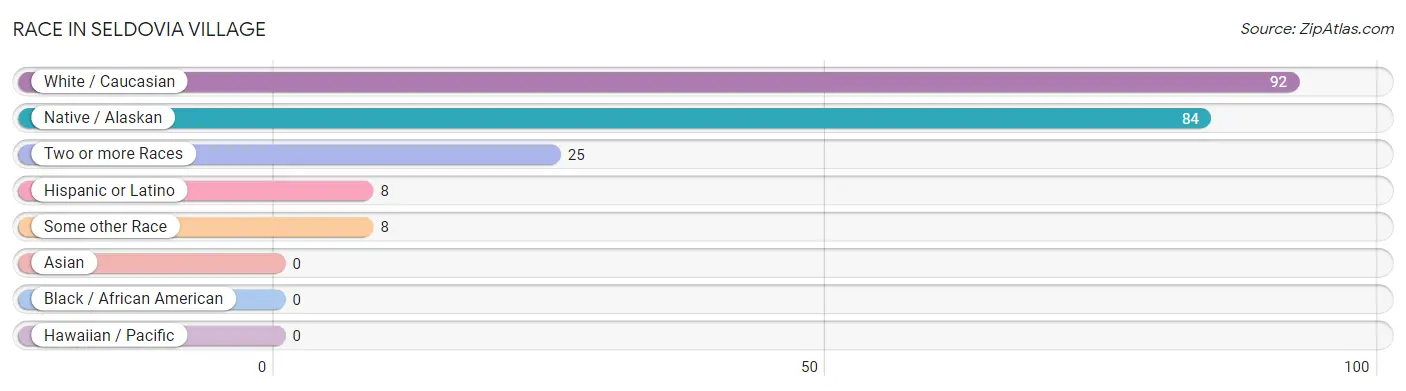
Race in Seldovia Village
The most populous races in Seldovia Village are White / Caucasian (92 | 44.0%), Native / Alaskan (84 | 40.2%), and Two or more Races (25 | 12.0%).
| Race | # Population | % Population |
| Asian | 0 | 0.0% |
| Black / African American | 0 | 0.0% |
| Hawaiian / Pacific | 0 | 0.0% |
| Hispanic or Latino | 8 | 3.8% |
| Native / Alaskan | 84 | 40.2% |
| White / Caucasian | 92 | 44.0% |
| Two or more Races | 25 | 12.0% |
| Some other Race | 8 | 3.8% |
| Total | 209 | 100.0% |
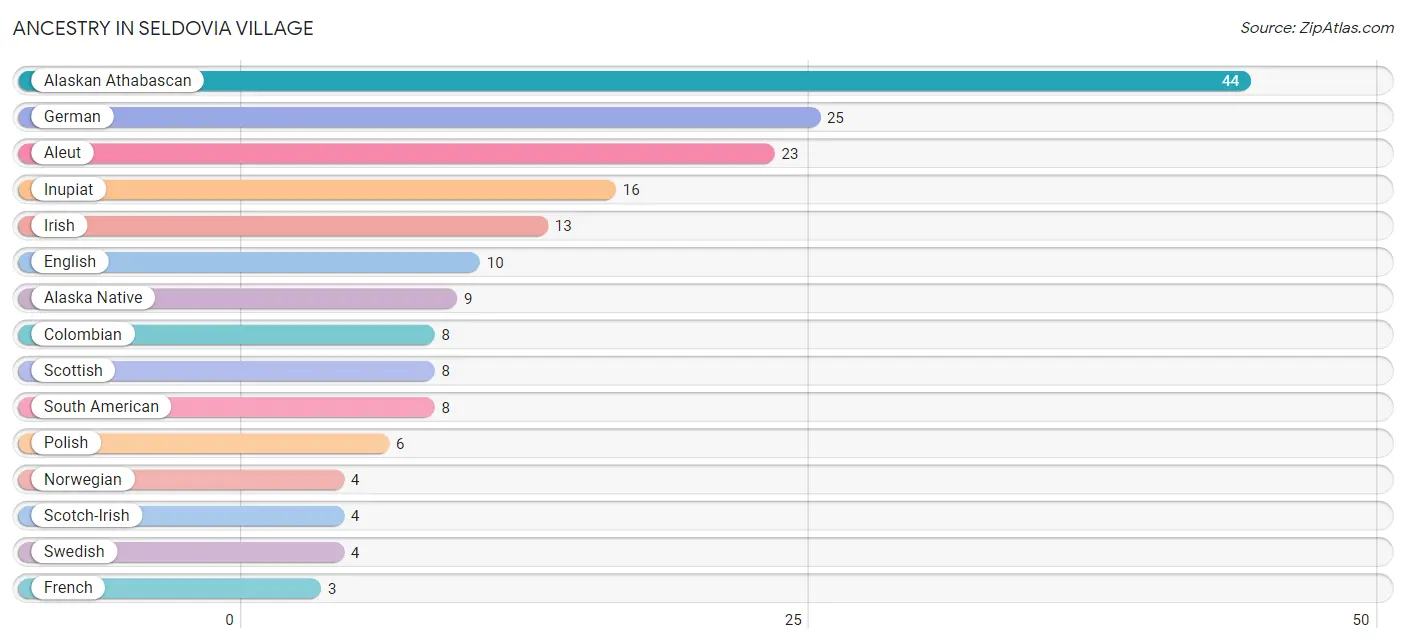
Ancestry in Seldovia Village
The most populous ancestries reported in Seldovia Village are Alaskan Athabascan (44 | 21.0%), German (25 | 12.0%), Aleut (23 | 11.0%), Inupiat (16 | 7.7%), and Irish (13 | 6.2%), together accounting for 57.9% of all Seldovia Village residents.
| Ancestry | # Population | % Population |
| Alaska Native | 9 | 4.3% |
| Alaskan Athabascan | 44 | 21.0% |
| Aleut | 23 | 11.0% |
| Colombian | 8 | 3.8% |
| English | 10 | 4.8% |
| French | 3 | 1.4% |
| German | 25 | 12.0% |
| Inupiat | 16 | 7.7% |
| Irish | 13 | 6.2% |
| Norwegian | 4 | 1.9% |
| Polish | 6 | 2.9% |
| Scotch-Irish | 4 | 1.9% |
| Scottish | 8 | 3.8% |
| South American | 8 | 3.8% |
| Swedish | 4 | 1.9% | View All 15 Rows |
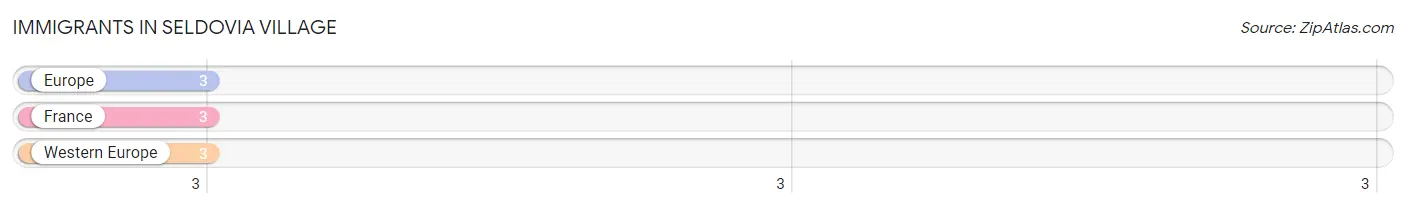
Immigrants in Seldovia Village
The most numerous immigrant groups reported in Seldovia Village came from Europe (3 | 1.4%), France (3 | 1.4%), and Western Europe (3 | 1.4%), together accounting for 4.3% of all Seldovia Village residents.
| Immigration Origin | # Population | % Population |
| Europe | 3 | 1.4% |
| France | 3 | 1.4% |
| Western Europe | 3 | 1.4% | View All 3 Rows |
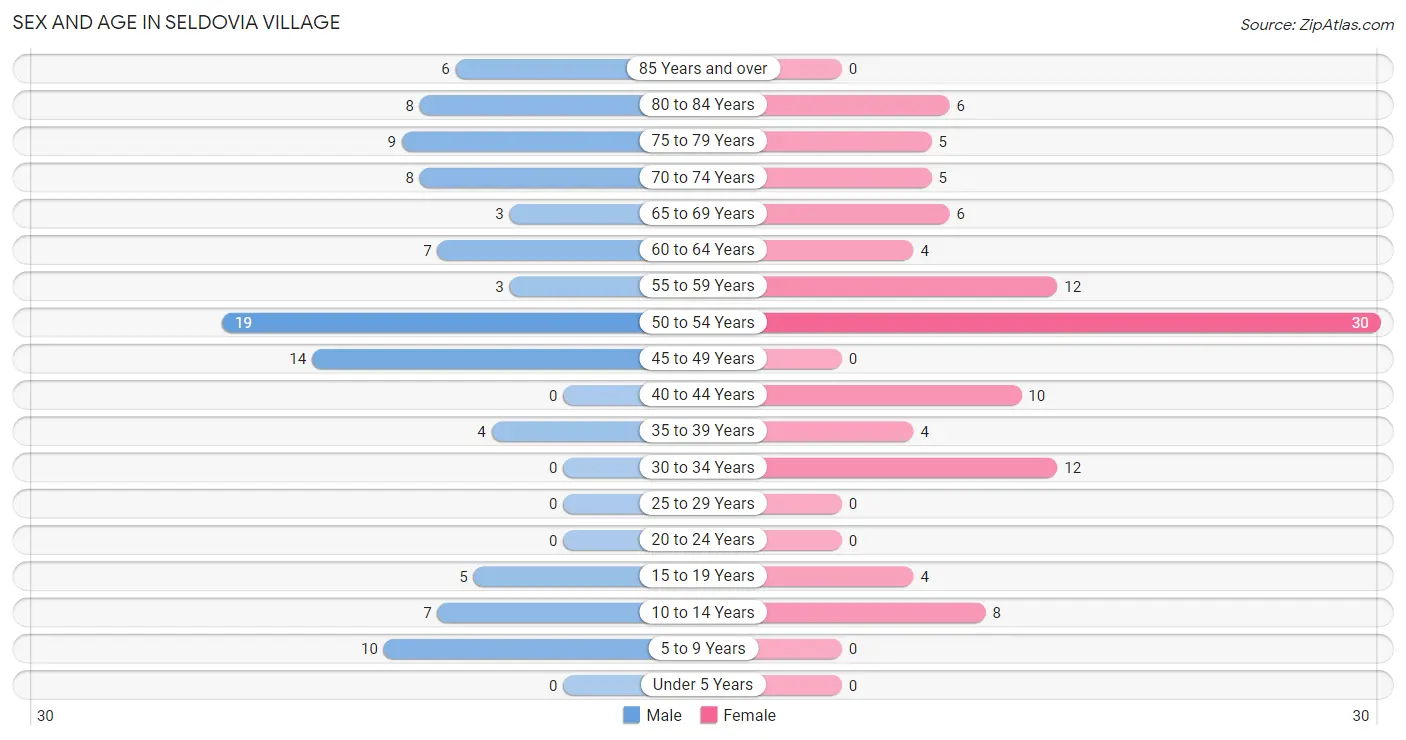
Sex and Age in Seldovia Village
Sex and Age in Seldovia Village
The most populous age groups in Seldovia Village are 50 to 54 Years (19 | 18.4%) for men and 50 to 54 Years (30 | 28.3%) for women.
| Age Bracket | Male | Female |
| Under 5 Years | 0 (0.0%) | 0 (0.0%) |
| 5 to 9 Years | 10 (9.7%) | 0 (0.0%) |
| 10 to 14 Years | 7 (6.8%) | 8 (7.5%) |
| 15 to 19 Years | 5 (4.9%) | 4 (3.8%) |
| 20 to 24 Years | 0 (0.0%) | 0 (0.0%) |
| 25 to 29 Years | 0 (0.0%) | 0 (0.0%) |
| 30 to 34 Years | 0 (0.0%) | 12 (11.3%) |
| 35 to 39 Years | 4 (3.9%) | 4 (3.8%) |
| 40 to 44 Years | 0 (0.0%) | 10 (9.4%) |
| 45 to 49 Years | 14 (13.6%) | 0 (0.0%) |
| 50 to 54 Years | 19 (18.4%) | 30 (28.3%) |
| 55 to 59 Years | 3 (2.9%) | 12 (11.3%) |
| 60 to 64 Years | 7 (6.8%) | 4 (3.8%) |
| 65 to 69 Years | 3 (2.9%) | 6 (5.7%) |
| 70 to 74 Years | 8 (7.8%) | 5 (4.7%) |
| 75 to 79 Years | 9 (8.7%) | 5 (4.7%) |
| 80 to 84 Years | 8 (7.8%) | 6 (5.7%) |
| 85 Years and over | 6 (5.8%) | 0 (0.0%) |
| Total | 103 (100.0%) | 106 (100.0%) |
Families and Households in Seldovia Village
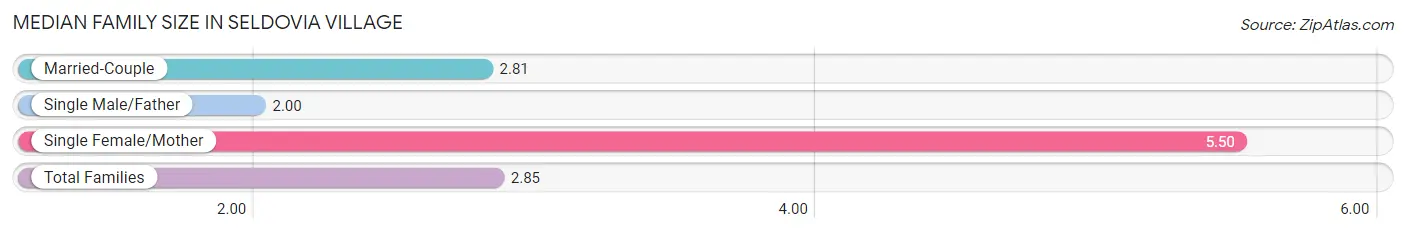
Median Family Size in Seldovia Village
The median family size in Seldovia Village is 2.85 persons per family, with single female/mother families (2 | 3.7%) accounting for the largest median family size of 5.5 persons per family. On the other hand, single male/father families (4 | 7.4%) represent the smallest median family size with 2.00 persons per family.
| Family Type | # Families | Family Size |
| Married-Couple | 48 (88.9%) | 2.81 |
| Single Male/Father | 4 (7.4%) | 2.00 |
| Single Female/Mother | 2 (3.7%) | 5.50 |
| Total Families | 54 (100.0%) | 2.85 |
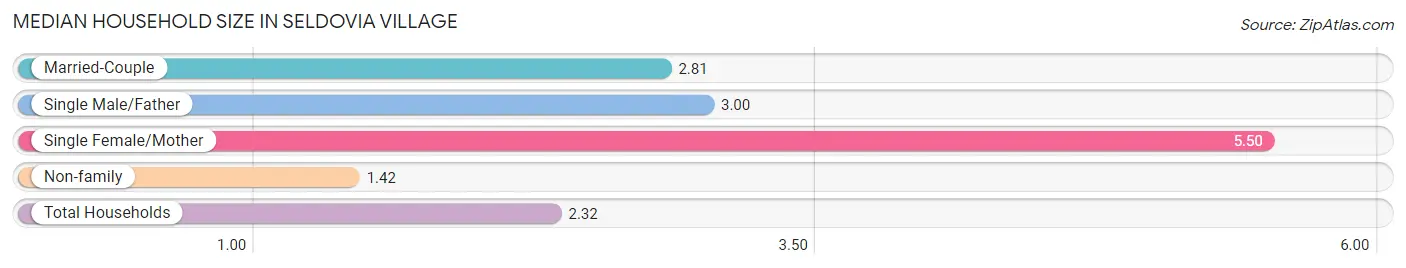
Median Household Size in Seldovia Village
The median household size in Seldovia Village is 2.32 persons per household, with single female/mother households (2 | 2.2%) accounting for the largest median household size of 5.5 persons per household. non-family households (36 | 40.0%) represent the smallest median household size with 1.42 persons per household.
| Household Type | # Households | Household Size |
| Married-Couple | 48 (53.3%) | 2.81 |
| Single Male/Father | 4 (4.4%) | 3.00 |
| Single Female/Mother | 2 (2.2%) | 5.50 |
| Non-family | 36 (40.0%) | 1.42 |
| Total Households | 90 (100.0%) | 2.32 |
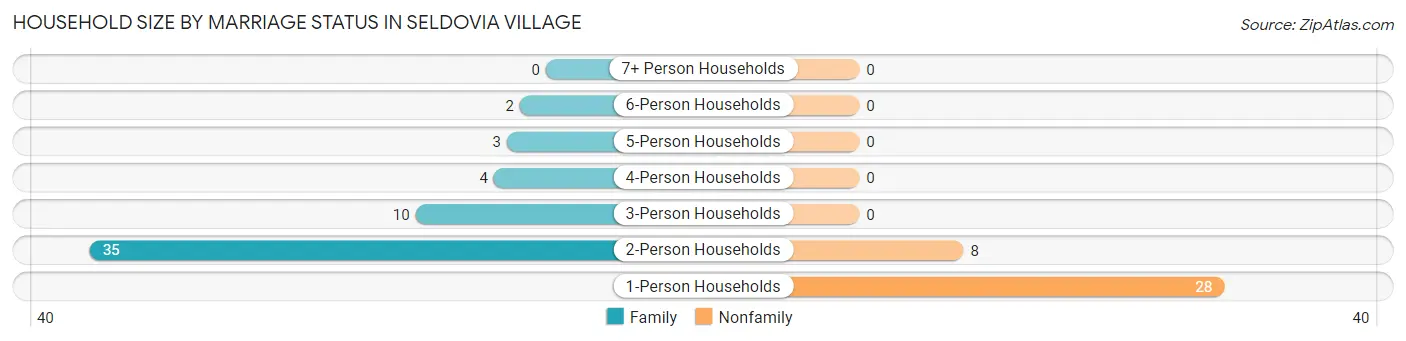
Household Size by Marriage Status in Seldovia Village
Out of a total of 90 households in Seldovia Village, 54 (60.0%) are family households, while 36 (40.0%) are nonfamily households. The most numerous type of family households are 2-person households, comprising 35, and the most common type of nonfamily households are 1-person households, comprising 28.
| Household Size | Family Households | Nonfamily Households |
| 1-Person Households | - | 28 (31.1%) |
| 2-Person Households | 35 (38.9%) | 8 (8.9%) |
| 3-Person Households | 10 (11.1%) | 0 (0.0%) |
| 4-Person Households | 4 (4.4%) | 0 (0.0%) |
| 5-Person Households | 3 (3.3%) | 0 (0.0%) |
| 6-Person Households | 2 (2.2%) | 0 (0.0%) |
| 7+ Person Households | 0 (0.0%) | 0 (0.0%) |
| Total | 54 (60.0%) | 36 (40.0%) |
Female Fertility in Seldovia Village
Fertility by Age in Seldovia Village
| Age Bracket | Women with Births | Births / 1,000 Women |
| 15 to 19 years | 0 (0.0%) | 0.0 |
| 20 to 34 years | 0 (0.0%) | 0.0 |
| 35 to 50 years | 0 (0.0%) | 0.0 |
| Total | 0 (0.0%) | 0.0 |
Fertility by Age by Marriage Status in Seldovia Village
| Age Bracket | Married | Unmarried |
| 15 to 19 years | 0 (0.0%) | 0 (0.0%) |
| 20 to 34 years | 0 (0.0%) | 0 (0.0%) |
| 35 to 50 years | 0 (0.0%) | 0 (0.0%) |
| Total | 0 (0.0%) | 0 (0.0%) |
Fertility by Education in Seldovia Village
| Educational Attainment | Women with Births | Births / 1,000 Women |
| Less than High School | 0 (0.0%) | 0.0 |
| High School Diploma | 0 (0.0%) | 0.0 |
| College or Associate's Degree | 0 (0.0%) | 0.0 |
| Bachelor's Degree | 0 (0.0%) | 0.0 |
| Graduate Degree | 0 (0.0%) | 0.0 |
| Total | 0 (0.0%) | 0.0 |
Fertility by Education by Marriage Status in Seldovia Village
| Educational Attainment | Married | Unmarried |
| Less than High School | 0 (0.0%) | 0 (0.0%) |
| High School Diploma | 0 (0.0%) | 0 (0.0%) |
| College or Associate's Degree | 0 (0.0%) | 0 (0.0%) |
| Bachelor's Degree | 0 (0.0%) | 0 (0.0%) |
| Graduate Degree | 0 (0.0%) | 0 (0.0%) |
| Total | 0 (0.0%) | 0 (0.0%) |
Income in Seldovia Village
Income Overview in Seldovia Village
Per Capita Income in Seldovia Village is $36,154, while median incomes of families and households are $101,250 and $48,571 respectively.
| Characteristic | Number | Measure |
| Per Capita Income | 209 | $36,154 |
| Median Family Income | 54 | $101,250 |
| Mean Family Income | 54 | $105,330 |
| Median Household Income | 90 | $48,571 |
| Mean Household Income | 90 | $79,459 |
| Income Deficit | 54 | $0 |
| Wage / Income Gap (%) | 209 | 0.00% |
| Wage / Income Gap ($) | 209 | 100.00¢ per $1 |
| Gini / Inequality Index | 209 | 0.47 |
Earnings by Sex in Seldovia Village
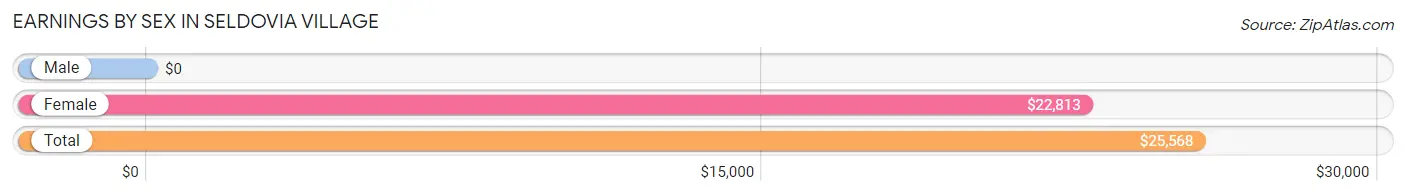
| Sex | Number | Average Earnings |
| Male | 42 (40.8%) | $0 |
| Female | 61 (59.2%) | $22,813 |
| Total | 103 (100.0%) | $25,568 |
Earnings by Sex by Income Bracket in Seldovia Village
The most common earnings brackets in Seldovia Village are $100,000+ for men (10 | 23.8%) and $20,000 to $22,499 for women (8 | 13.1%).
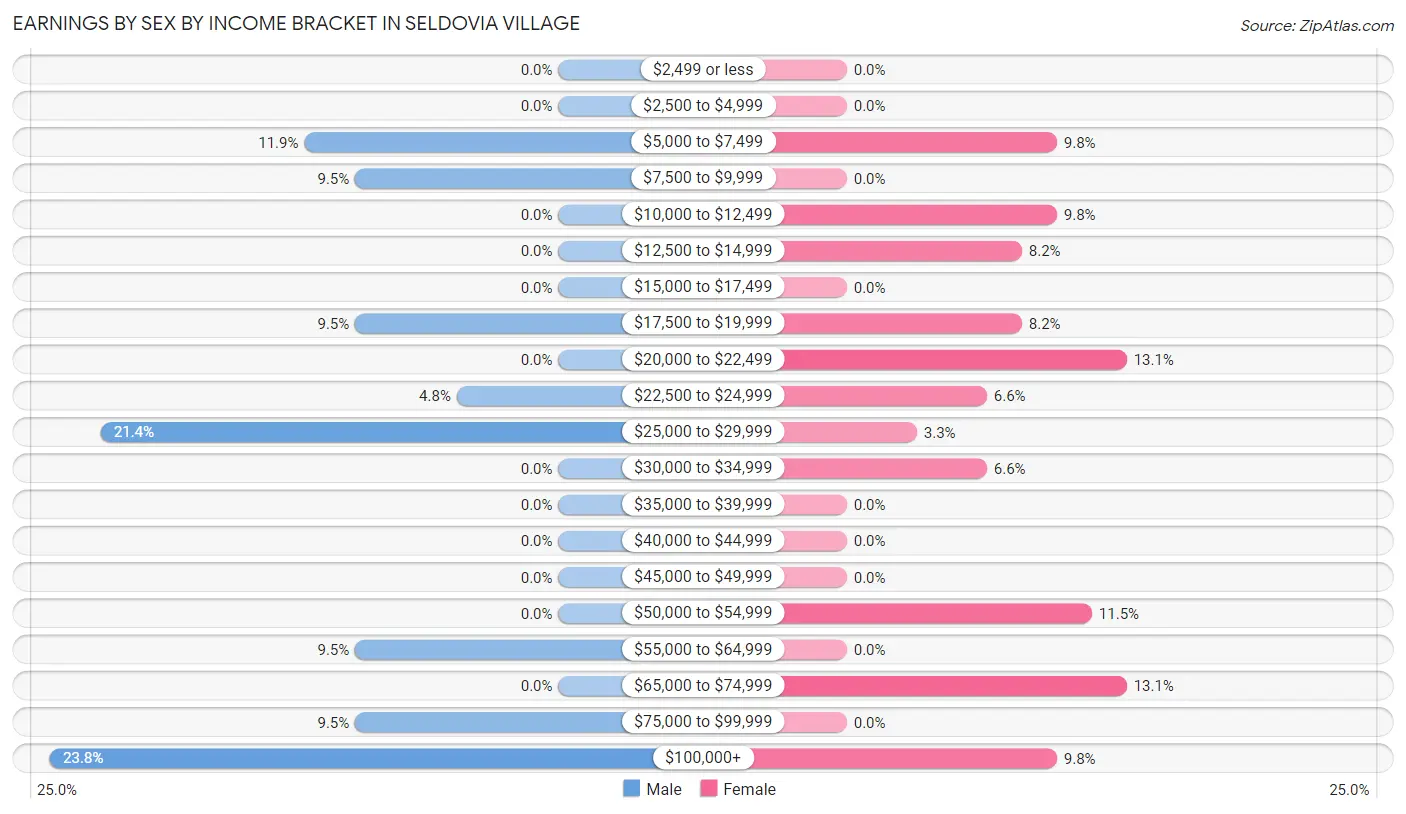
| Income | Male | Female |
| $2,499 or less | 0 (0.0%) | 0 (0.0%) |
| $2,500 to $4,999 | 0 (0.0%) | 0 (0.0%) |
| $5,000 to $7,499 | 5 (11.9%) | 6 (9.8%) |
| $7,500 to $9,999 | 4 (9.5%) | 0 (0.0%) |
| $10,000 to $12,499 | 0 (0.0%) | 6 (9.8%) |
| $12,500 to $14,999 | 0 (0.0%) | 5 (8.2%) |
| $15,000 to $17,499 | 0 (0.0%) | 0 (0.0%) |
| $17,500 to $19,999 | 4 (9.5%) | 5 (8.2%) |
| $20,000 to $22,499 | 0 (0.0%) | 8 (13.1%) |
| $22,500 to $24,999 | 2 (4.8%) | 4 (6.6%) |
| $25,000 to $29,999 | 9 (21.4%) | 2 (3.3%) |
| $30,000 to $34,999 | 0 (0.0%) | 4 (6.6%) |
| $35,000 to $39,999 | 0 (0.0%) | 0 (0.0%) |
| $40,000 to $44,999 | 0 (0.0%) | 0 (0.0%) |
| $45,000 to $49,999 | 0 (0.0%) | 0 (0.0%) |
| $50,000 to $54,999 | 0 (0.0%) | 7 (11.5%) |
| $55,000 to $64,999 | 4 (9.5%) | 0 (0.0%) |
| $65,000 to $74,999 | 0 (0.0%) | 8 (13.1%) |
| $75,000 to $99,999 | 4 (9.5%) | 0 (0.0%) |
| $100,000+ | 10 (23.8%) | 6 (9.8%) |
| Total | 42 (100.0%) | 61 (100.0%) |
Earnings by Sex by Educational Attainment in Seldovia Village
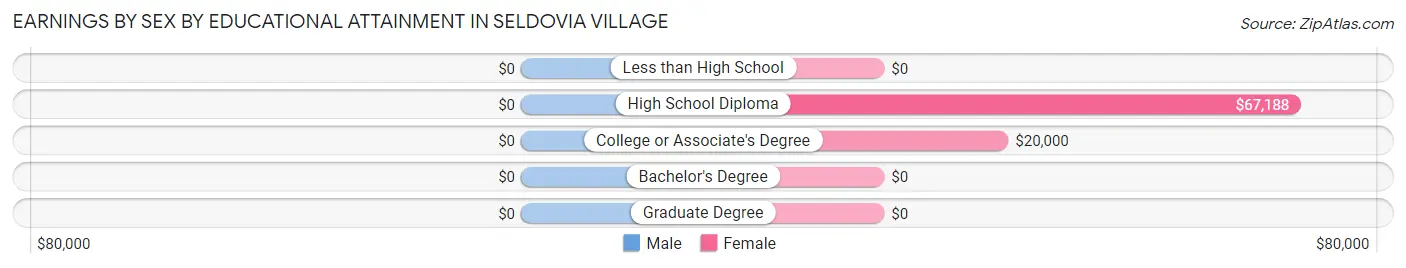
| Educational Attainment | Male Income | Female Income |
| Less than High School | - | - |
| High School Diploma | - | - |
| College or Associate's Degree | - | - |
| Bachelor's Degree | - | - |
| Graduate Degree | - | - |
| Total | - | - |
Family Income in Seldovia Village
Family Income Brackets in Seldovia Village
According to the Seldovia Village family income data, there are 13 families falling into the $100,000 to $149,999 income range, which is the most common income bracket and makes up 24.1% of all families.
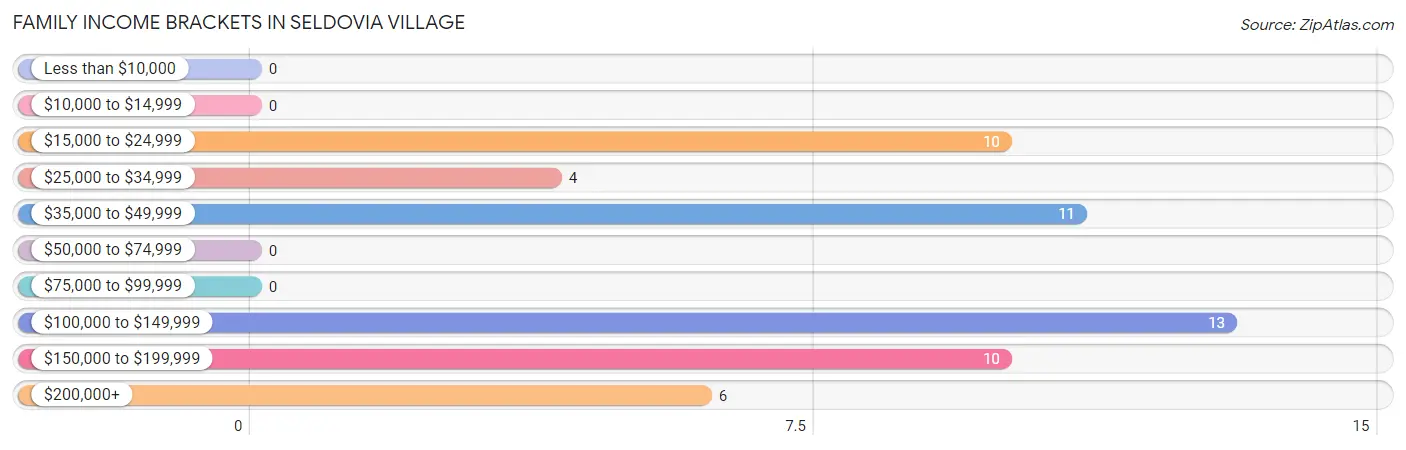
| Income Bracket | # Families | % Families |
| Less than $10,000 | 0 | 0.0% |
| $10,000 to $14,999 | 0 | 0.0% |
| $15,000 to $24,999 | 10 | 18.5% |
| $25,000 to $34,999 | 4 | 7.4% |
| $35,000 to $49,999 | 11 | 20.4% |
| $50,000 to $74,999 | 0 | 0.0% |
| $75,000 to $99,999 | 0 | 0.0% |
| $100,000 to $149,999 | 13 | 24.1% |
| $150,000 to $199,999 | 10 | 18.5% |
| $200,000+ | 6 | 11.1% |
Family Income by Famaliy Size in Seldovia Village
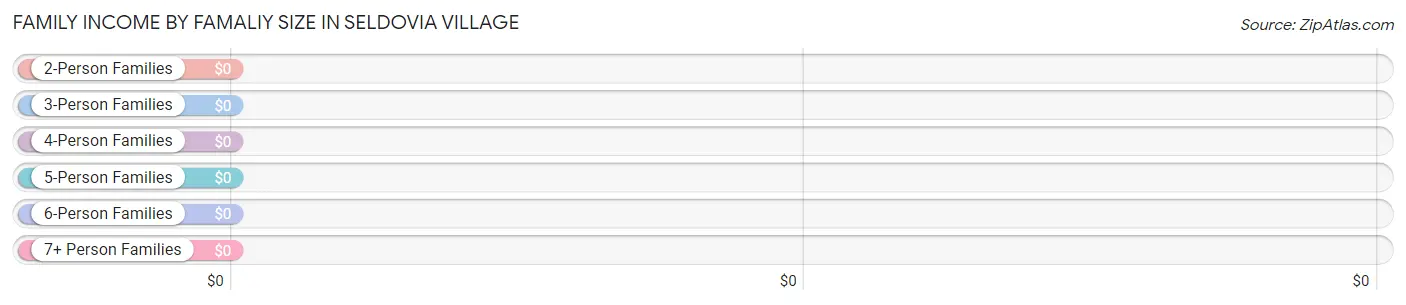
| Income Bracket | # Families | Median Income |
| 2-Person Families | 39 (72.2%) | $0 |
| 3-Person Families | 6 (11.1%) | $0 |
| 4-Person Families | 4 (7.4%) | $0 |
| 5-Person Families | 3 (5.6%) | $0 |
| 6-Person Families | 2 (3.7%) | $0 |
| 7+ Person Families | 0 (0.0%) | $0 |
| Total | 54 (100.0%) | $101,250 |
Family Income by Number of Earners in Seldovia Village
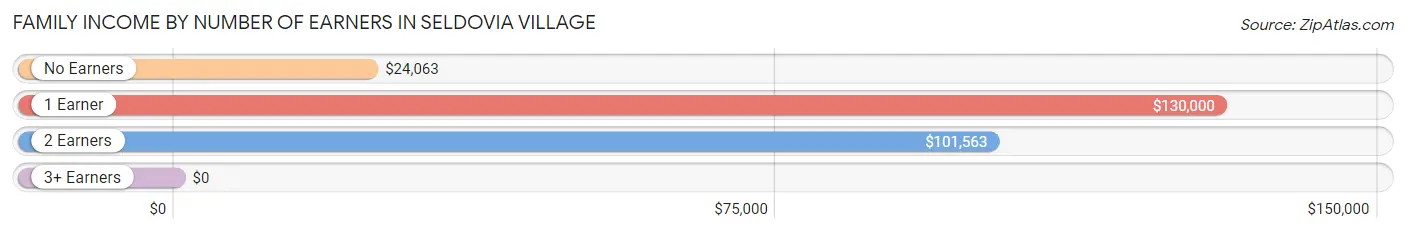
| Number of Earners | # Families | Median Income |
| No Earners | 17 (31.5%) | $24,063 |
| 1 Earner | 22 (40.7%) | $130,000 |
| 2 Earners | 13 (24.1%) | $101,563 |
| 3+ Earners | 2 (3.7%) | $0 |
| Total | 54 (100.0%) | $101,250 |
Household Income in Seldovia Village
Household Income Brackets in Seldovia Village
With 17 households falling in the category, the $15,000 to $24,999 income range is the most frequent in Seldovia Village, accounting for 18.9% of all households.
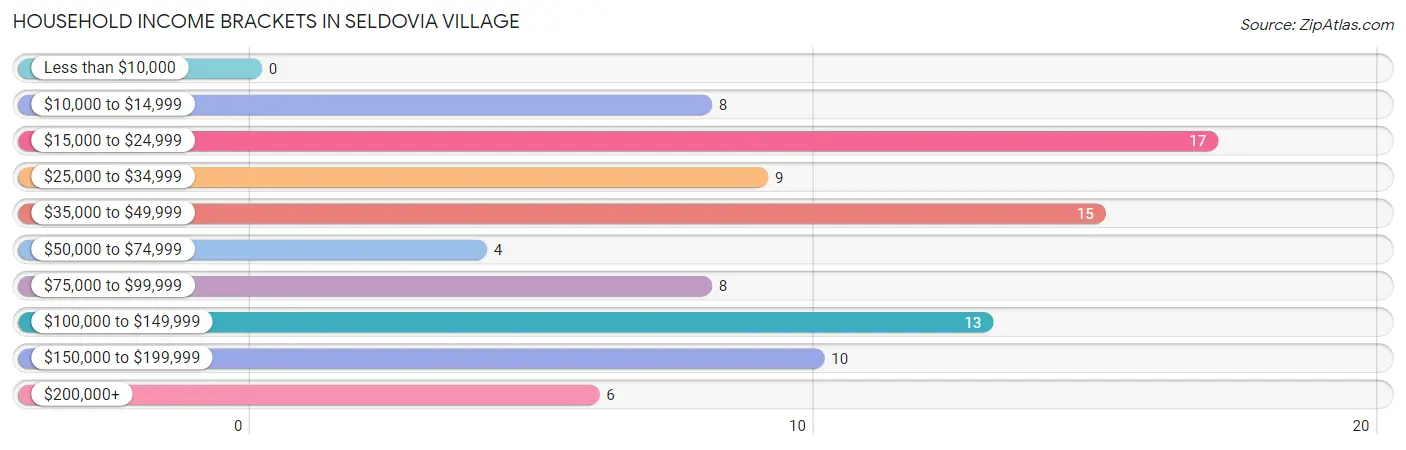
| Income Bracket | # Households | % Households |
| Less than $10,000 | 0 | 0.0% |
| $10,000 to $14,999 | 8 | 8.9% |
| $15,000 to $24,999 | 17 | 18.9% |
| $25,000 to $34,999 | 9 | 10.0% |
| $35,000 to $49,999 | 15 | 16.7% |
| $50,000 to $74,999 | 4 | 4.4% |
| $75,000 to $99,999 | 8 | 8.9% |
| $100,000 to $149,999 | 13 | 14.4% |
| $150,000 to $199,999 | 10 | 11.1% |
| $200,000+ | 6 | 6.7% |
Household Income by Householder Age in Seldovia Village
The median household income in Seldovia Village is $48,571, with the highest median household income of $78,281 found in the 45 to 64 years age bracket for the primary householder. A total of 51 households (56.7%) fall into this category.
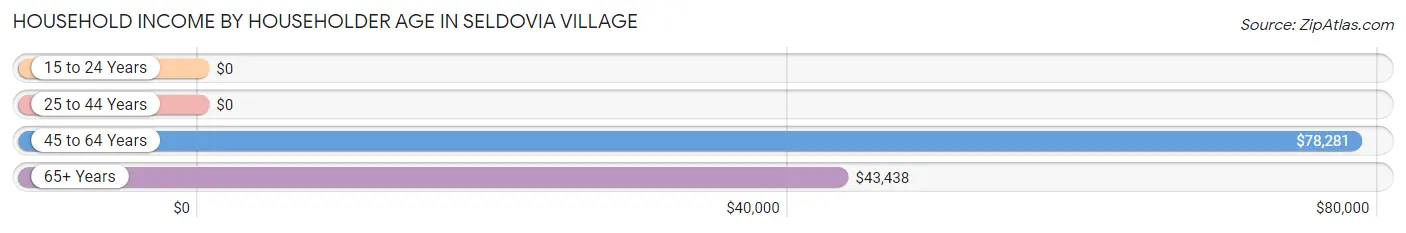
| Income Bracket | # Households | Median Income |
| 15 to 24 Years | 0 (0.0%) | $0 |
| 25 to 44 Years | 6 (6.7%) | $0 |
| 45 to 64 Years | 51 (56.7%) | $78,281 |
| 65+ Years | 33 (36.7%) | $43,438 |
| Total | 90 (100.0%) | $48,571 |
Poverty in Seldovia Village
Income Below Poverty by Sex and Age in Seldovia Village
With 16.5% poverty level for males and 7.5% for females among the residents of Seldovia Village, 35 to 44 year old males and 55 to 64 year old females are the most vulnerable to poverty, with 4 males (100.0%) and 8 females (50.0%) in their respective age groups living below the poverty level.
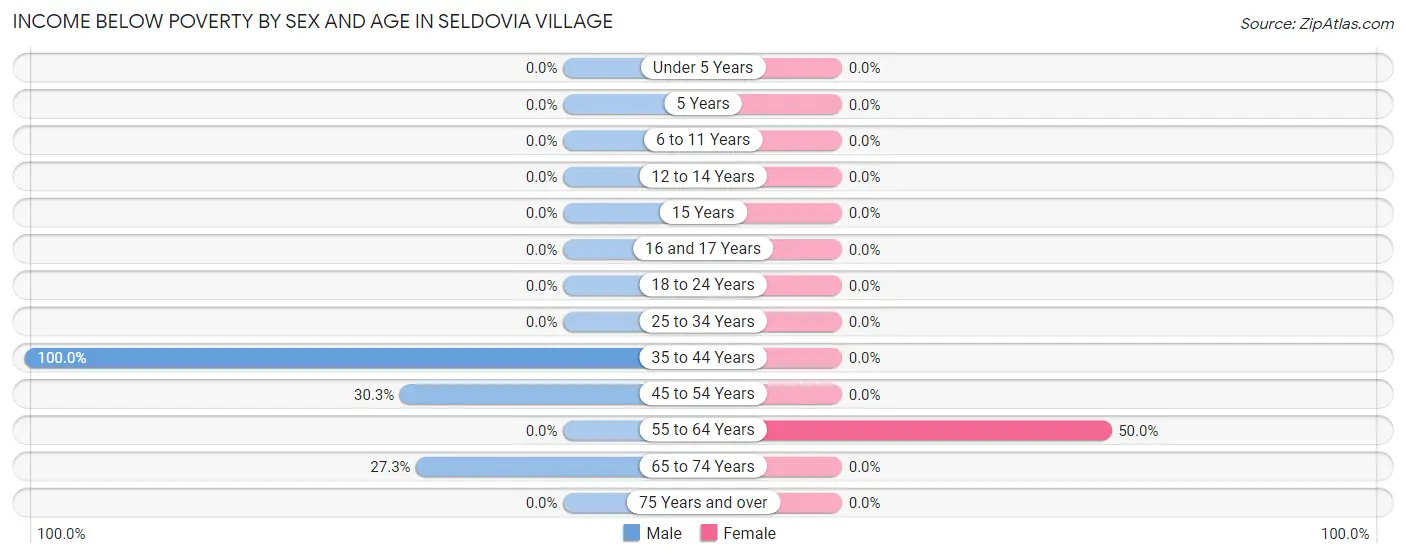
| Age Bracket | Male | Female |
| Under 5 Years | 0 (0.0%) | 0 (0.0%) |
| 5 Years | 0 (0.0%) | 0 (0.0%) |
| 6 to 11 Years | 0 (0.0%) | 0 (0.0%) |
| 12 to 14 Years | 0 (0.0%) | 0 (0.0%) |
| 15 Years | 0 (0.0%) | 0 (0.0%) |
| 16 and 17 Years | 0 (0.0%) | 0 (0.0%) |
| 18 to 24 Years | 0 (0.0%) | 0 (0.0%) |
| 25 to 34 Years | 0 (0.0%) | 0 (0.0%) |
| 35 to 44 Years | 4 (100.0%) | 0 (0.0%) |
| 45 to 54 Years | 10 (30.3%) | 0 (0.0%) |
| 55 to 64 Years | 0 (0.0%) | 8 (50.0%) |
| 65 to 74 Years | 3 (27.3%) | 0 (0.0%) |
| 75 Years and over | 0 (0.0%) | 0 (0.0%) |
| Total | 17 (16.5%) | 8 (7.5%) |
Income Above Poverty by Sex and Age in Seldovia Village
According to the poverty statistics in Seldovia Village, males aged 6 to 11 years and females aged 6 to 11 years are the age groups that are most secure financially, with 100.0% of males and 100.0% of females in these age groups living above the poverty line.
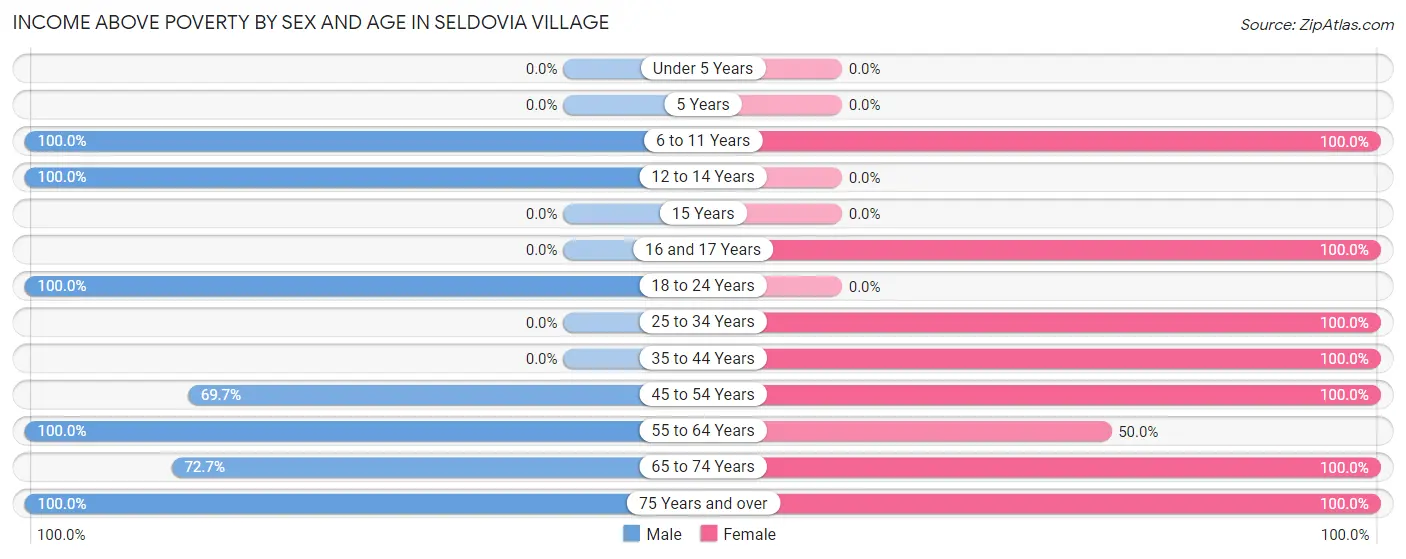
| Age Bracket | Male | Female |
| Under 5 Years | 0 (0.0%) | 0 (0.0%) |
| 5 Years | 0 (0.0%) | 0 (0.0%) |
| 6 to 11 Years | 10 (100.0%) | 8 (100.0%) |
| 12 to 14 Years | 7 (100.0%) | 0 (0.0%) |
| 15 Years | 0 (0.0%) | 0 (0.0%) |
| 16 and 17 Years | 0 (0.0%) | 4 (100.0%) |
| 18 to 24 Years | 5 (100.0%) | 0 (0.0%) |
| 25 to 34 Years | 0 (0.0%) | 12 (100.0%) |
| 35 to 44 Years | 0 (0.0%) | 14 (100.0%) |
| 45 to 54 Years | 23 (69.7%) | 30 (100.0%) |
| 55 to 64 Years | 10 (100.0%) | 8 (50.0%) |
| 65 to 74 Years | 8 (72.7%) | 11 (100.0%) |
| 75 Years and over | 23 (100.0%) | 11 (100.0%) |
| Total | 86 (83.5%) | 98 (92.4%) |
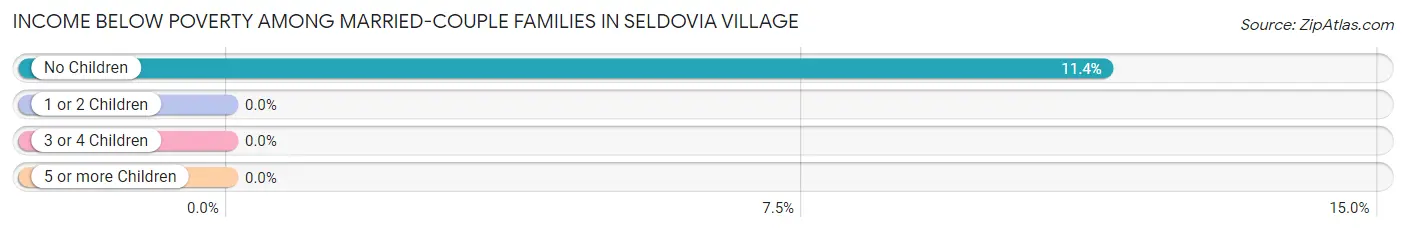
Income Below Poverty Among Married-Couple Families in Seldovia Village
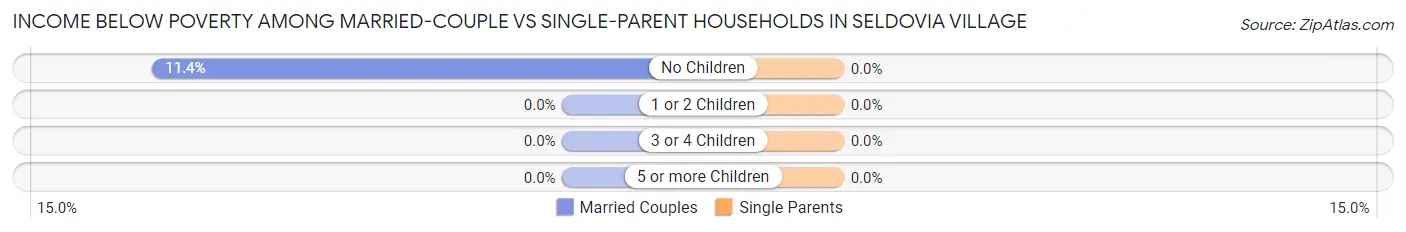
The poverty statistics for married-couple families in Seldovia Village show that 8.3% or 4 of the total 48 families live below the poverty line. Families with no children have the highest poverty rate of 11.4%, comprising of 4 families. On the other hand, families with 1 or 2 children have the lowest poverty rate of 0.0%, which includes 0 families.
| Children | Above Poverty | Below Poverty |
| No Children | 31 (88.6%) | 4 (11.4%) |
| 1 or 2 Children | 13 (100.0%) | 0 (0.0%) |
| 3 or 4 Children | 0 (0.0%) | 0 (0.0%) |
| 5 or more Children | 0 (0.0%) | 0 (0.0%) |
| Total | 44 (91.7%) | 4 (8.3%) |
Income Below Poverty Among Single-Parent Households in Seldovia Village
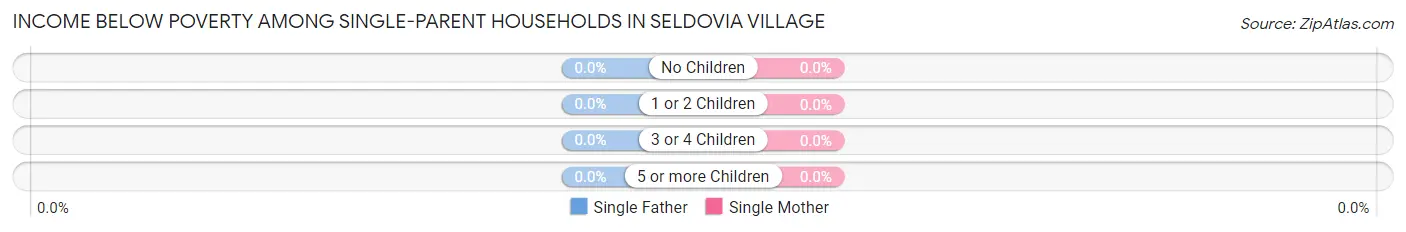
| Children | Single Father | Single Mother |
| No Children | 0 (0.0%) | 0 (0.0%) |
| 1 or 2 Children | 0 (0.0%) | 0 (0.0%) |
| 3 or 4 Children | 0 (0.0%) | 0 (0.0%) |
| 5 or more Children | 0 (0.0%) | 0 (0.0%) |
| Total | 0 (0.0%) | 0 (0.0%) |
Income Below Poverty Among Married-Couple vs Single-Parent Households in Seldovia Village
| Children | Married-Couple Families | Single-Parent Households |
| No Children | 4 (11.4%) | 0 (0.0%) |
| 1 or 2 Children | 0 (0.0%) | 0 (0.0%) |
| 3 or 4 Children | 0 (0.0%) | 0 (0.0%) |
| 5 or more Children | 0 (0.0%) | 0 (0.0%) |
| Total | 4 (8.3%) | 0 (0.0%) |
Employment Characteristics in Seldovia Village
Employment by Class of Employer in Seldovia Village
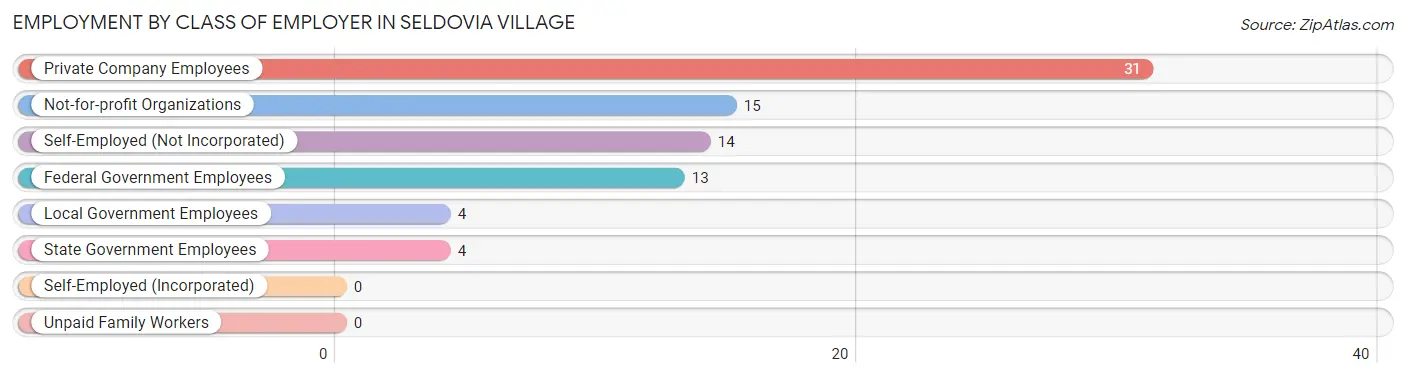
Among the 81 employed individuals in Seldovia Village, private company employees (31 | 38.3%), not-for-profit organizations (15 | 18.5%), and self-employed (not incorporated) (14 | 17.3%) make up the most common classes of employment.
| Employer Class | # Employees | % Employees |
| Private Company Employees | 31 | 38.3% |
| Self-Employed (Incorporated) | 0 | 0.0% |
| Self-Employed (Not Incorporated) | 14 | 17.3% |
| Not-for-profit Organizations | 15 | 18.5% |
| Local Government Employees | 4 | 4.9% |
| State Government Employees | 4 | 4.9% |
| Federal Government Employees | 13 | 16.1% |
| Unpaid Family Workers | 0 | 0.0% |
| Total | 81 | 100.0% |
Employment Status by Age in Seldovia Village
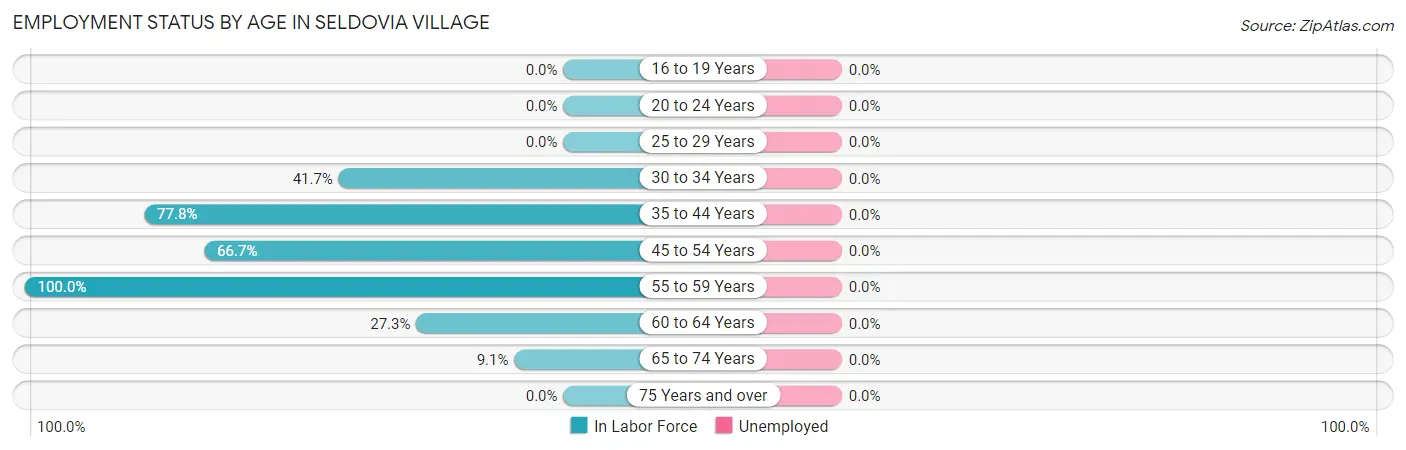
| Age Bracket | In Labor Force | Unemployed |
| 16 to 19 Years | 0 (0.0%) | 0 (0.0%) |
| 20 to 24 Years | 0 (0.0%) | 0 (0.0%) |
| 25 to 29 Years | 0 (0.0%) | 0 (0.0%) |
| 30 to 34 Years | 5 (41.7%) | 0 (0.0%) |
| 35 to 44 Years | 14 (77.8%) | 0 (0.0%) |
| 45 to 54 Years | 42 (66.7%) | 0 (0.0%) |
| 55 to 59 Years | 15 (100.0%) | 0 (0.0%) |
| 60 to 64 Years | 3 (27.3%) | 0 (0.0%) |
| 65 to 74 Years | 2 (9.1%) | 0 (0.0%) |
| 75 Years and over | 0 (0.0%) | 0 (0.0%) |
| Total | 81 (44.0%) | 0 (0.0%) |
Employment Status by Educational Attainment in Seldovia Village
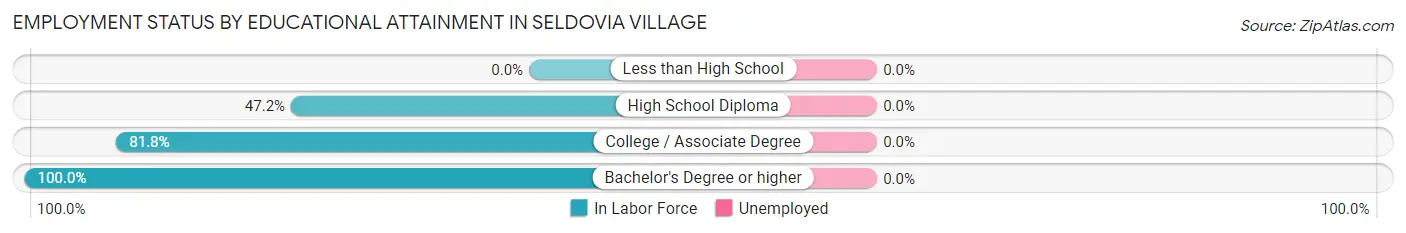
| Educational Attainment | In Labor Force | Unemployed |
| Less than High School | 0 (0.0%) | 0 (0.0%) |
| High School Diploma | 25 (47.2%) | 0 (0.0%) |
| College / Associate Degree | 36 (81.8%) | 0 (0.0%) |
| Bachelor's Degree or higher | 18 (100.0%) | 0 (0.0%) |
| Total | 79 (66.4%) | 0 (0.0%) |
Employment Occupations by Sex in Seldovia Village
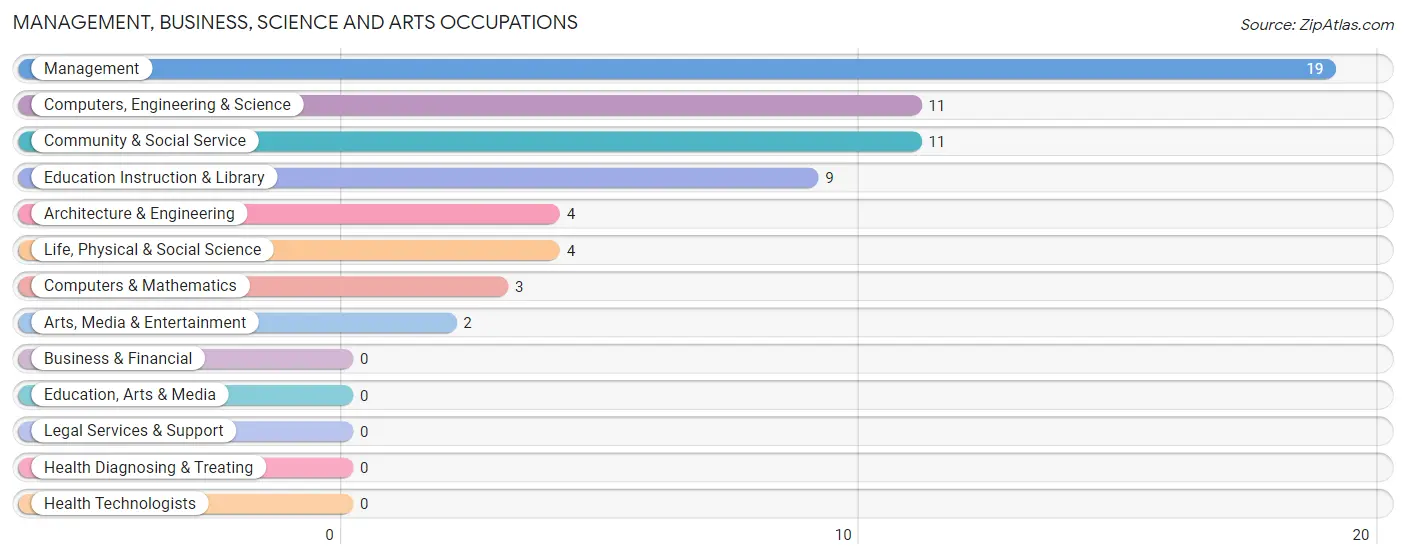
Management, Business, Science and Arts Occupations
The most common Management, Business, Science and Arts occupations in Seldovia Village are Management (19 | 23.5%), Computers, Engineering & Science (11 | 13.6%), Community & Social Service (11 | 13.6%), Education Instruction & Library (9 | 11.1%), and Architecture & Engineering (4 | 4.9%).
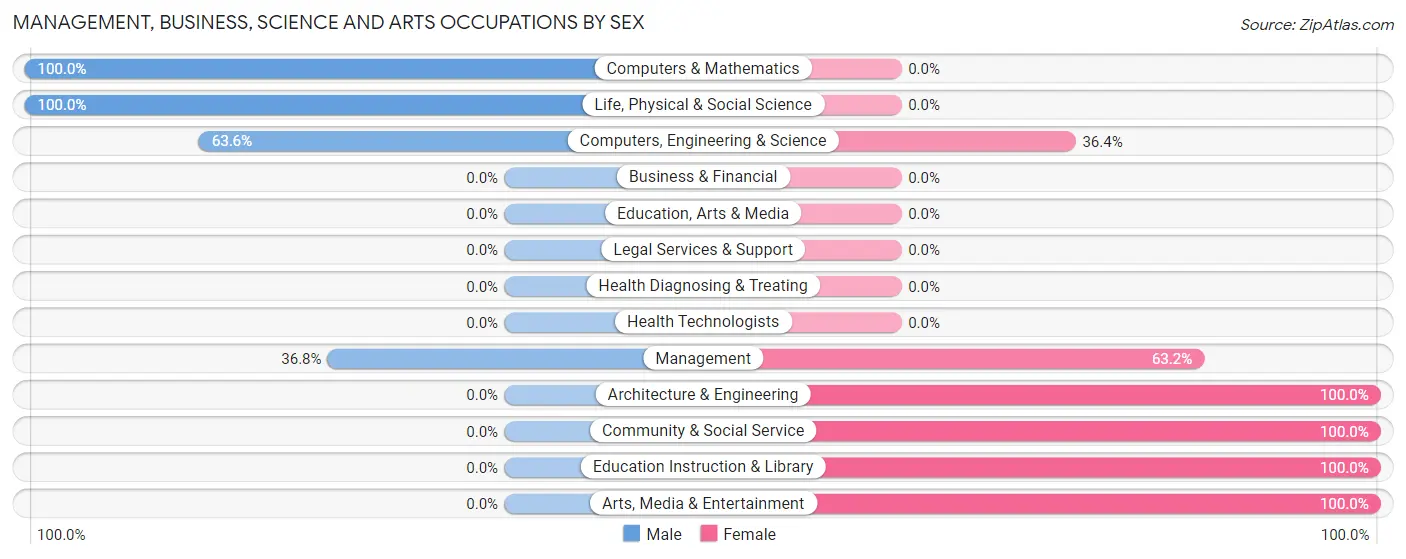
Management, Business, Science and Arts Occupations by Sex
Within the Management, Business, Science and Arts occupations in Seldovia Village, the most male-oriented occupations are Computers & Mathematics (100.0%), Life, Physical & Social Science (100.0%), and Computers, Engineering & Science (63.6%), while the most female-oriented occupations are Architecture & Engineering (100.0%), Community & Social Service (100.0%), and Education Instruction & Library (100.0%).
| Occupation | Male | Female |
| Management | 7 (36.8%) | 12 (63.2%) |
| Business & Financial | 0 (0.0%) | 0 (0.0%) |
| Computers, Engineering & Science | 7 (63.6%) | 4 (36.4%) |
| Computers & Mathematics | 3 (100.0%) | 0 (0.0%) |
| Architecture & Engineering | 0 (0.0%) | 4 (100.0%) |
| Life, Physical & Social Science | 4 (100.0%) | 0 (0.0%) |
| Community & Social Service | 0 (0.0%) | 11 (100.0%) |
| Education, Arts & Media | 0 (0.0%) | 0 (0.0%) |
| Legal Services & Support | 0 (0.0%) | 0 (0.0%) |
| Education Instruction & Library | 0 (0.0%) | 9 (100.0%) |
| Arts, Media & Entertainment | 0 (0.0%) | 2 (100.0%) |
| Health Diagnosing & Treating | 0 (0.0%) | 0 (0.0%) |
| Health Technologists | 0 (0.0%) | 0 (0.0%) |
| Total (Category) | 14 (34.2%) | 27 (65.8%) |
| Total (Overall) | 24 (29.6%) | 57 (70.4%) |
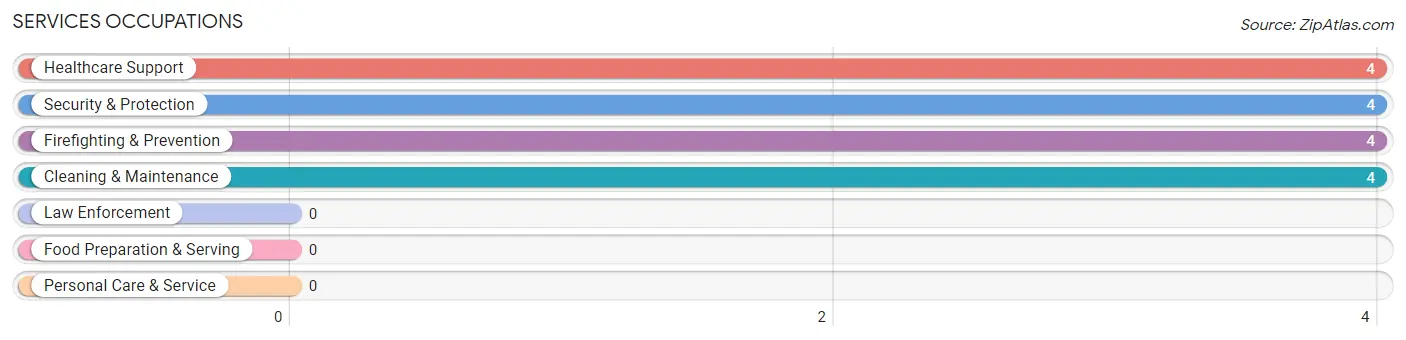
Services Occupations
The most common Services occupations in Seldovia Village are Healthcare Support (4 | 4.9%), Security & Protection (4 | 4.9%), Firefighting & Prevention (4 | 4.9%), and Cleaning & Maintenance (4 | 4.9%).
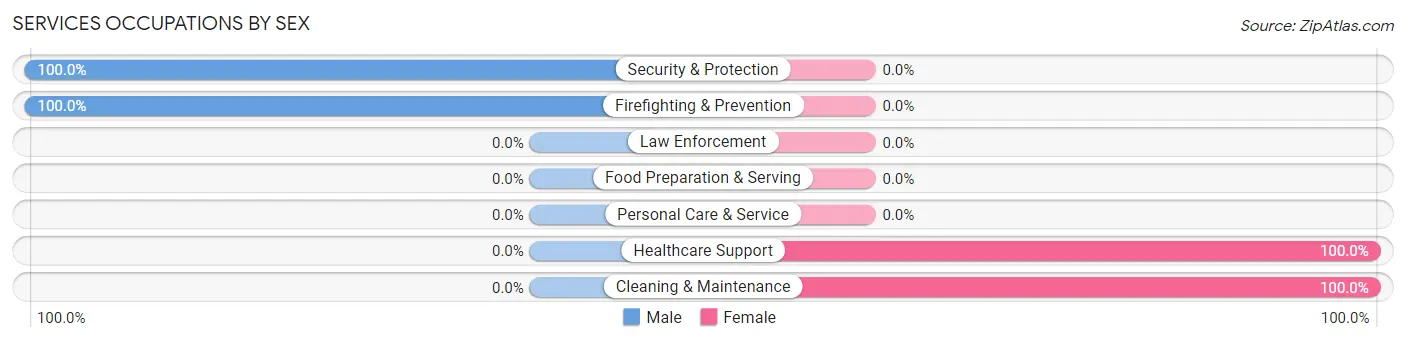
Services Occupations by Sex
Within the Services occupations in Seldovia Village, the most male-oriented occupations are Security & Protection (100.0%), and Firefighting & Prevention (100.0%), while the most female-oriented occupations are Healthcare Support (100.0%), and Cleaning & Maintenance (100.0%).
| Occupation | Male | Female |
| Healthcare Support | 0 (0.0%) | 4 (100.0%) |
| Security & Protection | 4 (100.0%) | 0 (0.0%) |
| Firefighting & Prevention | 4 (100.0%) | 0 (0.0%) |
| Law Enforcement | 0 (0.0%) | 0 (0.0%) |
| Food Preparation & Serving | 0 (0.0%) | 0 (0.0%) |
| Cleaning & Maintenance | 0 (0.0%) | 4 (100.0%) |
| Personal Care & Service | 0 (0.0%) | 0 (0.0%) |
| Total (Category) | 4 (33.3%) | 8 (66.7%) |
| Total (Overall) | 24 (29.6%) | 57 (70.4%) |
Sales and Office Occupations
The most common Sales and Office occupations in Seldovia Village are Office & Administration (15 | 18.5%), and Sales & Related (3 | 3.7%).
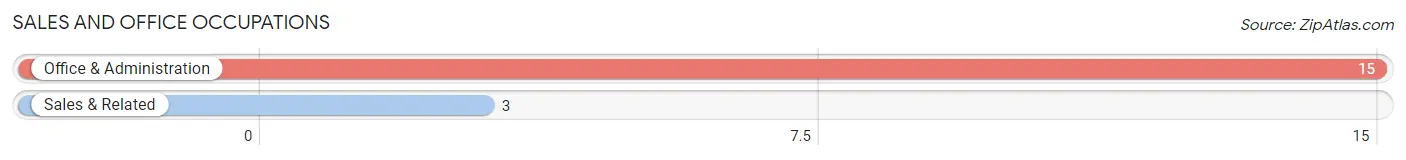
Sales and Office Occupations by Sex
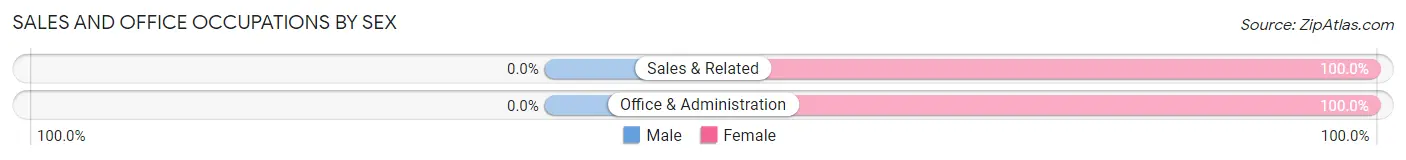
| Occupation | Male | Female |
| Sales & Related | 0 (0.0%) | 3 (100.0%) |
| Office & Administration | 0 (0.0%) | 15 (100.0%) |
| Total (Category) | 0 (0.0%) | 18 (100.0%) |
| Total (Overall) | 24 (29.6%) | 57 (70.4%) |
Natural Resources, Construction and Maintenance Occupations
The most common Natural Resources, Construction and Maintenance occupations in Seldovia Village are Farming, Fishing & Forestry (4 | 4.9%), and Installation, Maintenance & Repair (2 | 2.5%).
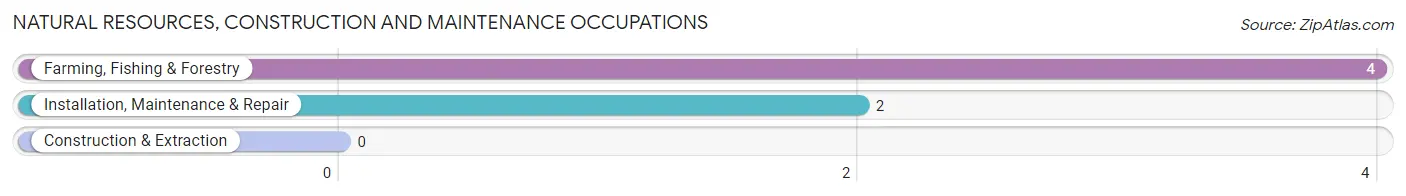
Natural Resources, Construction and Maintenance Occupations by Sex
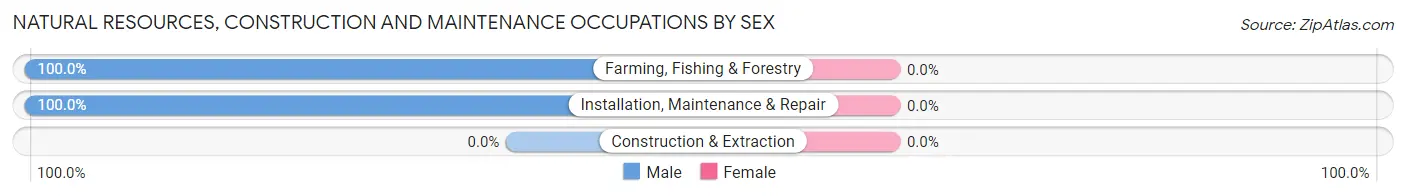
| Occupation | Male | Female |
| Farming, Fishing & Forestry | 4 (100.0%) | 0 (0.0%) |
| Construction & Extraction | 0 (0.0%) | 0 (0.0%) |
| Installation, Maintenance & Repair | 2 (100.0%) | 0 (0.0%) |
| Total (Category) | 6 (100.0%) | 0 (0.0%) |
| Total (Overall) | 24 (29.6%) | 57 (70.4%) |
Production, Transportation and Moving Occupations
The most common Production, Transportation and Moving occupations in Seldovia Village are , and Material Moving (4 | 4.9%).
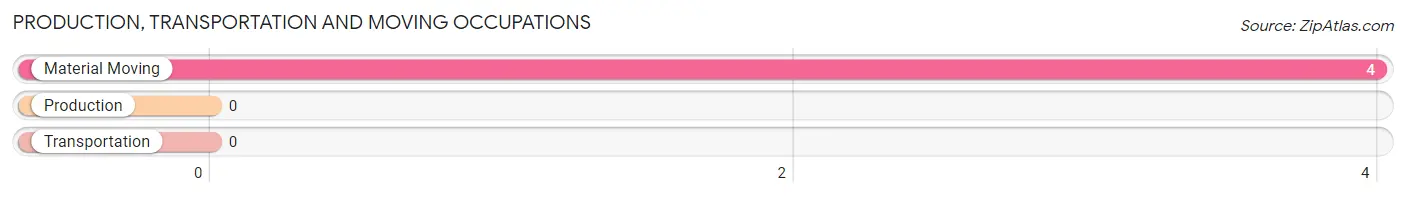
Production, Transportation and Moving Occupations by Sex
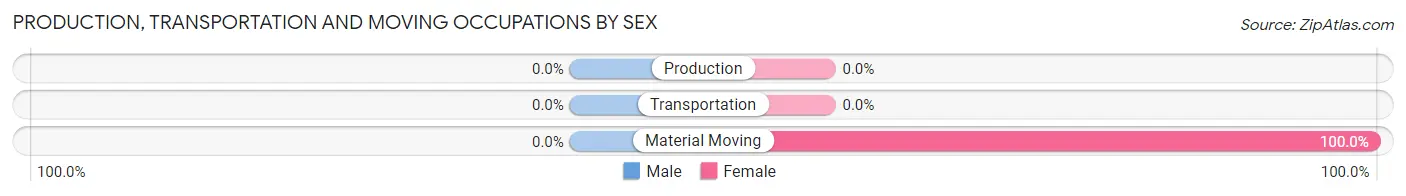
| Occupation | Male | Female |
| Production | 0 (0.0%) | 0 (0.0%) |
| Transportation | 0 (0.0%) | 0 (0.0%) |
| Material Moving | 0 (0.0%) | 4 (100.0%) |
| Total (Category) | 0 (0.0%) | 4 (100.0%) |
| Total (Overall) | 24 (29.6%) | 57 (70.4%) |
Employment Industries by Sex in Seldovia Village
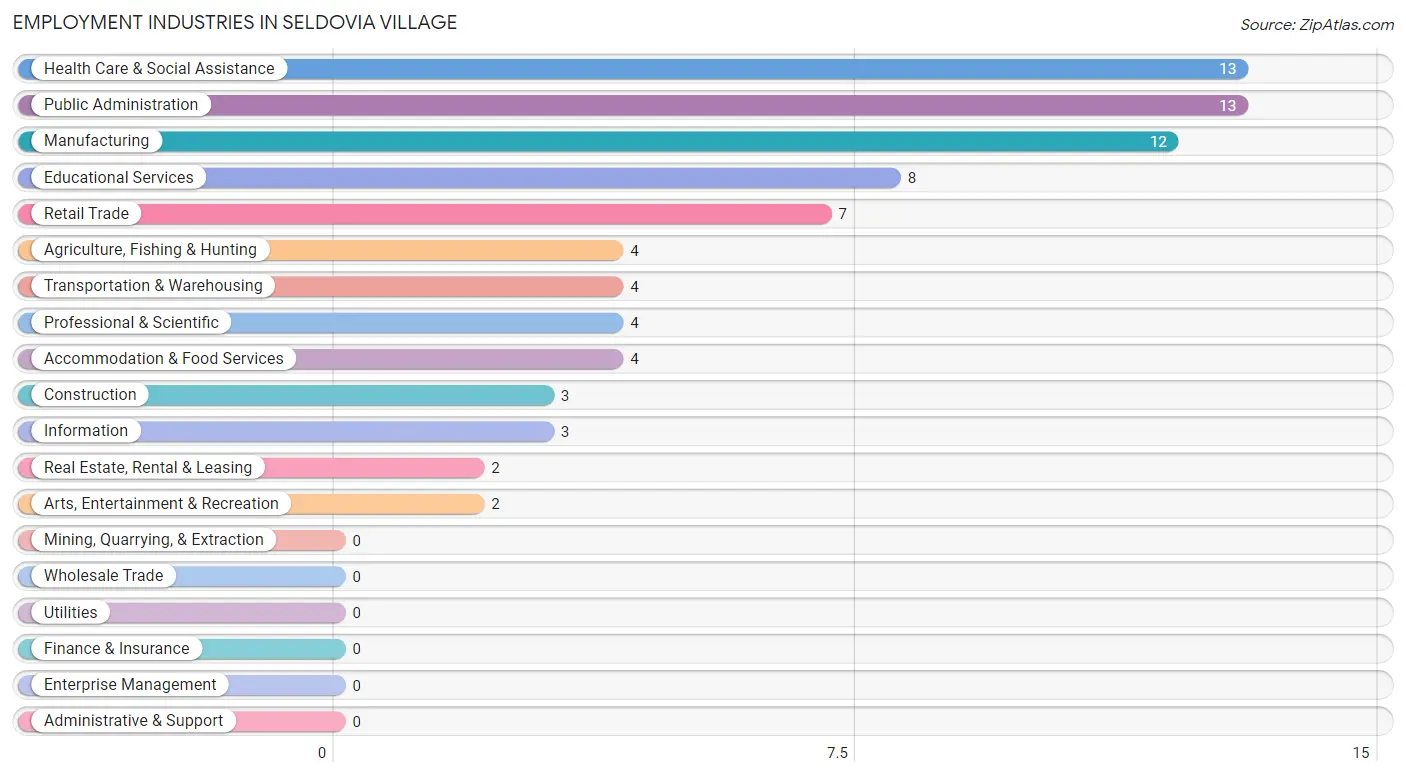
Employment Industries in Seldovia Village
The major employment industries in Seldovia Village include Health Care & Social Assistance (13 | 16.1%), Public Administration (13 | 16.1%), Manufacturing (12 | 14.8%), Educational Services (8 | 9.9%), and Retail Trade (7 | 8.6%).
Employment Industries by Sex in Seldovia Village
The Seldovia Village industries that see more men than women are Agriculture, Fishing & Hunting (100.0%), Construction (100.0%), and Information (100.0%), whereas the industries that tend to have a higher number of women are Retail Trade (100.0%), Transportation & Warehousing (100.0%), and Professional & Scientific (100.0%).
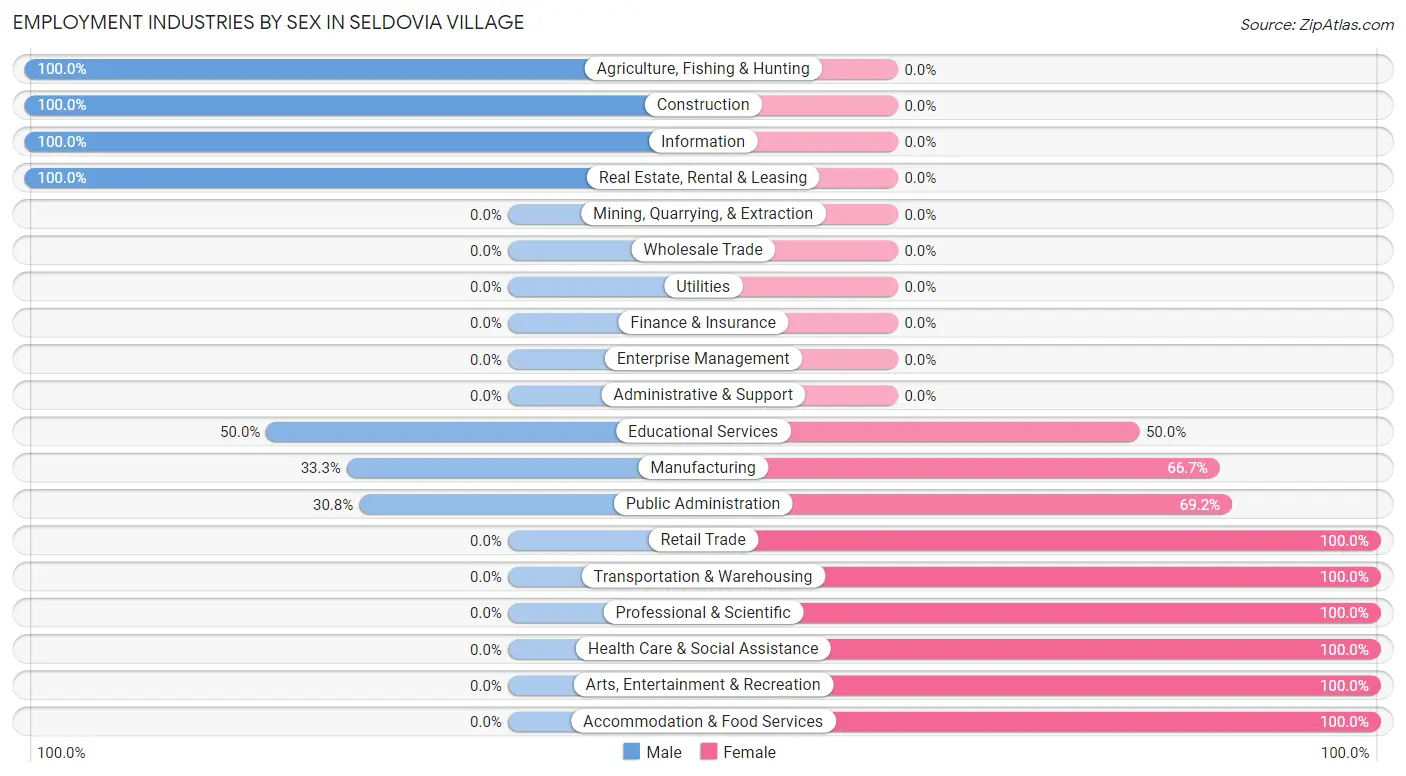
| Industry | Male | Female |
| Agriculture, Fishing & Hunting | 4 (100.0%) | 0 (0.0%) |
| Mining, Quarrying, & Extraction | 0 (0.0%) | 0 (0.0%) |
| Construction | 3 (100.0%) | 0 (0.0%) |
| Manufacturing | 4 (33.3%) | 8 (66.7%) |
| Wholesale Trade | 0 (0.0%) | 0 (0.0%) |
| Retail Trade | 0 (0.0%) | 7 (100.0%) |
| Transportation & Warehousing | 0 (0.0%) | 4 (100.0%) |
| Utilities | 0 (0.0%) | 0 (0.0%) |
| Information | 3 (100.0%) | 0 (0.0%) |
| Finance & Insurance | 0 (0.0%) | 0 (0.0%) |
| Real Estate, Rental & Leasing | 2 (100.0%) | 0 (0.0%) |
| Professional & Scientific | 0 (0.0%) | 4 (100.0%) |
| Enterprise Management | 0 (0.0%) | 0 (0.0%) |
| Administrative & Support | 0 (0.0%) | 0 (0.0%) |
| Educational Services | 4 (50.0%) | 4 (50.0%) |
| Health Care & Social Assistance | 0 (0.0%) | 13 (100.0%) |
| Arts, Entertainment & Recreation | 0 (0.0%) | 2 (100.0%) |
| Accommodation & Food Services | 0 (0.0%) | 4 (100.0%) |
| Public Administration | 4 (30.8%) | 9 (69.2%) |
| Total | 24 (29.6%) | 57 (70.4%) |
Education in Seldovia Village
School Enrollment in Seldovia Village
The most common levels of schooling among the 34 students in Seldovia Village are middle school (12 | 35.3%), kindergarten (10 | 29.4%), and high school (9 | 26.5%).
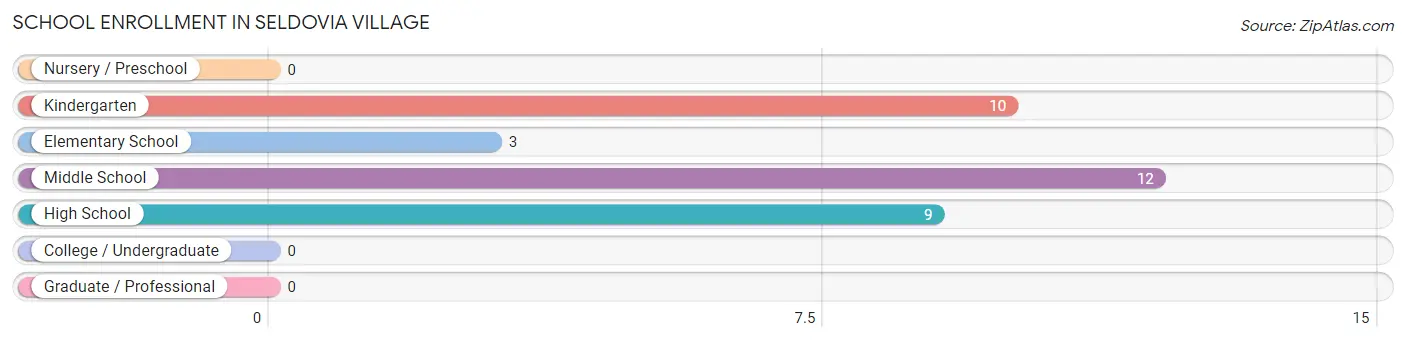
| School Level | # Students | % Students |
| Nursery / Preschool | 0 | 0.0% |
| Kindergarten | 10 | 29.4% |
| Elementary School | 3 | 8.8% |
| Middle School | 12 | 35.3% |
| High School | 9 | 26.5% |
| College / Undergraduate | 0 | 0.0% |
| Graduate / Professional | 0 | 0.0% |
| Total | 34 | 100.0% |
School Enrollment by Age by Funding Source in Seldovia Village
Out of a total of 34 students who are enrolled in schools in Seldovia Village, 4 (11.8%) attend a private institution, while the remaining 30 (88.2%) are enrolled in public schools. The age group of 10 to 14 year olds has the highest likelihood of being enrolled in private schools, with 4 (26.7% in the age bracket) enrolled. Conversely, the age group of 5 to 9 year old has the lowest likelihood of being enrolled in a private school, with 10 (100.0% in the age bracket) attending a public institution.
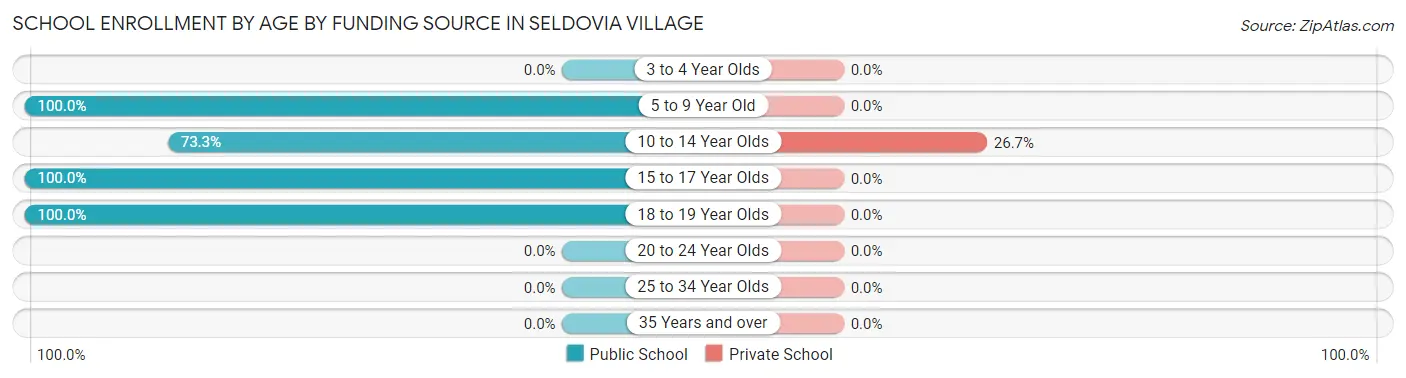
| Age Bracket | Public School | Private School |
| 3 to 4 Year Olds | 0 (0.0%) | 0 (0.0%) |
| 5 to 9 Year Old | 10 (100.0%) | 0 (0.0%) |
| 10 to 14 Year Olds | 11 (73.3%) | 4 (26.7%) |
| 15 to 17 Year Olds | 4 (100.0%) | 0 (0.0%) |
| 18 to 19 Year Olds | 5 (100.0%) | 0 (0.0%) |
| 20 to 24 Year Olds | 0 (0.0%) | 0 (0.0%) |
| 25 to 34 Year Olds | 0 (0.0%) | 0 (0.0%) |
| 35 Years and over | 0 (0.0%) | 0 (0.0%) |
| Total | 30 (88.2%) | 4 (11.8%) |
Educational Attainment by Field of Study in Seldovia Village
Bio, nature & agricultural (10 | 27.0%), physical & health sciences (8 | 21.6%), education (6 | 16.2%), business (4 | 10.8%), and multidisciplinary studies (3 | 8.1%) are the most common fields of study among 37 individuals in Seldovia Village who have obtained a bachelor's degree or higher.
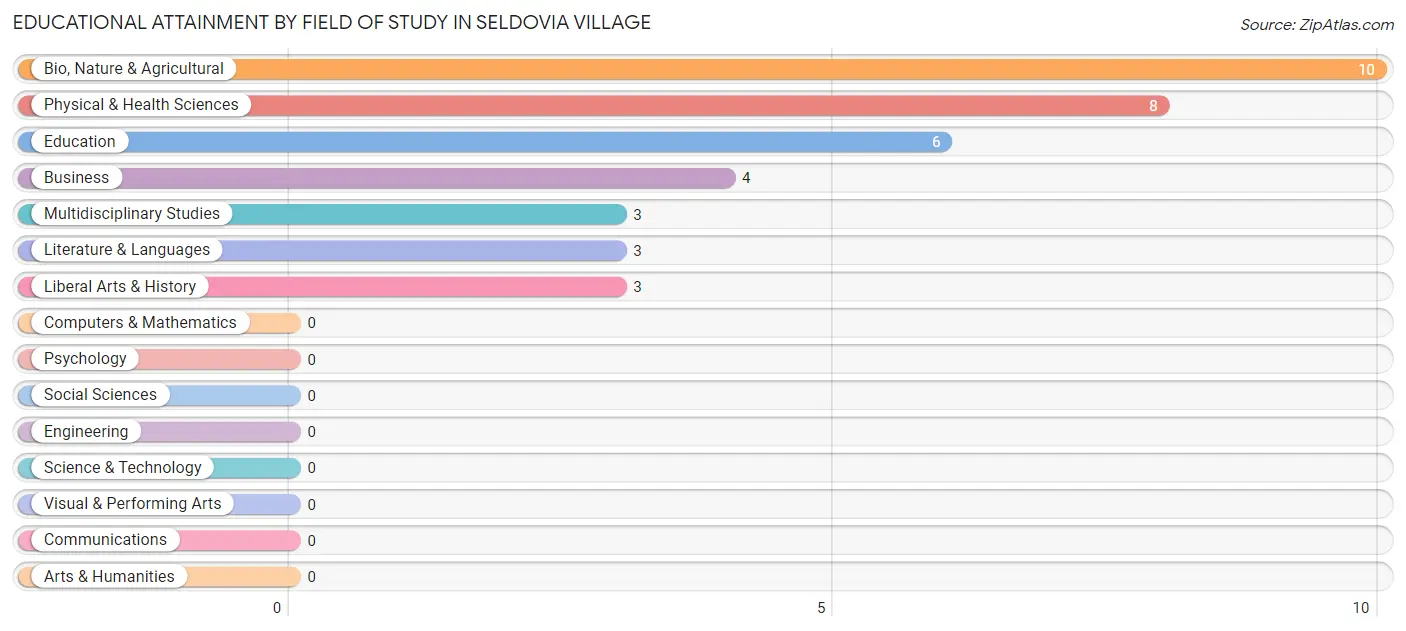
| Field of Study | # Graduates | % Graduates |
| Computers & Mathematics | 0 | 0.0% |
| Bio, Nature & Agricultural | 10 | 27.0% |
| Physical & Health Sciences | 8 | 21.6% |
| Psychology | 0 | 0.0% |
| Social Sciences | 0 | 0.0% |
| Engineering | 0 | 0.0% |
| Multidisciplinary Studies | 3 | 8.1% |
| Science & Technology | 0 | 0.0% |
| Business | 4 | 10.8% |
| Education | 6 | 16.2% |
| Literature & Languages | 3 | 8.1% |
| Liberal Arts & History | 3 | 8.1% |
| Visual & Performing Arts | 0 | 0.0% |
| Communications | 0 | 0.0% |
| Arts & Humanities | 0 | 0.0% |
| Total | 37 | 100.0% |
Transportation & Commute in Seldovia Village
Vehicle Availability by Sex in Seldovia Village
The most prevalent vehicle ownership categories in Seldovia Village are males with 2 vehicles (9, accounting for 37.5%) and females with 2 vehicles (34, making up 15.8%).
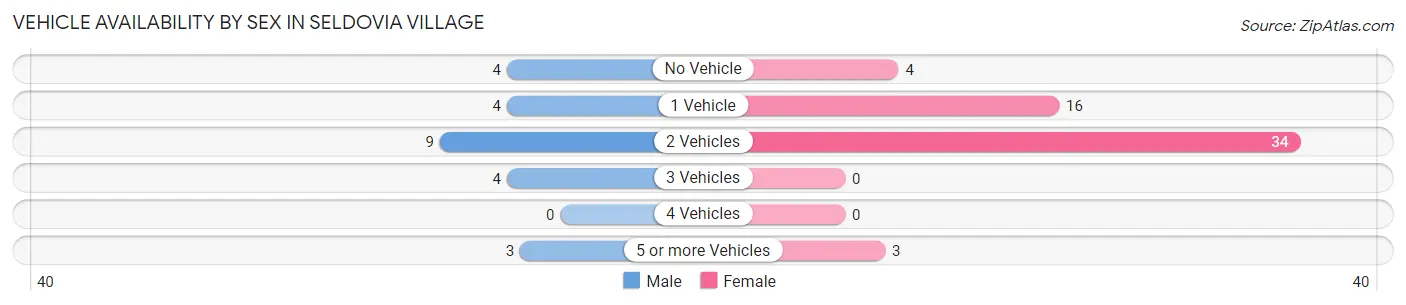
| Vehicles Available | Male | Female |
| No Vehicle | 4 (16.7%) | 4 (7.0%) |
| 1 Vehicle | 4 (16.7%) | 16 (28.1%) |
| 2 Vehicles | 9 (37.5%) | 34 (59.7%) |
| 3 Vehicles | 4 (16.7%) | 0 (0.0%) |
| 4 Vehicles | 0 (0.0%) | 0 (0.0%) |
| 5 or more Vehicles | 3 (12.5%) | 3 (5.3%) |
| Total | 24 (100.0%) | 57 (100.0%) |
Commute Time in Seldovia Village
The most frequently occuring commute durations in Seldovia Village are 10 to 14 minutes (23 commuters, 37.7%), 15 to 19 minutes (16 commuters, 26.2%), and 5 to 9 minutes (15 commuters, 24.6%).
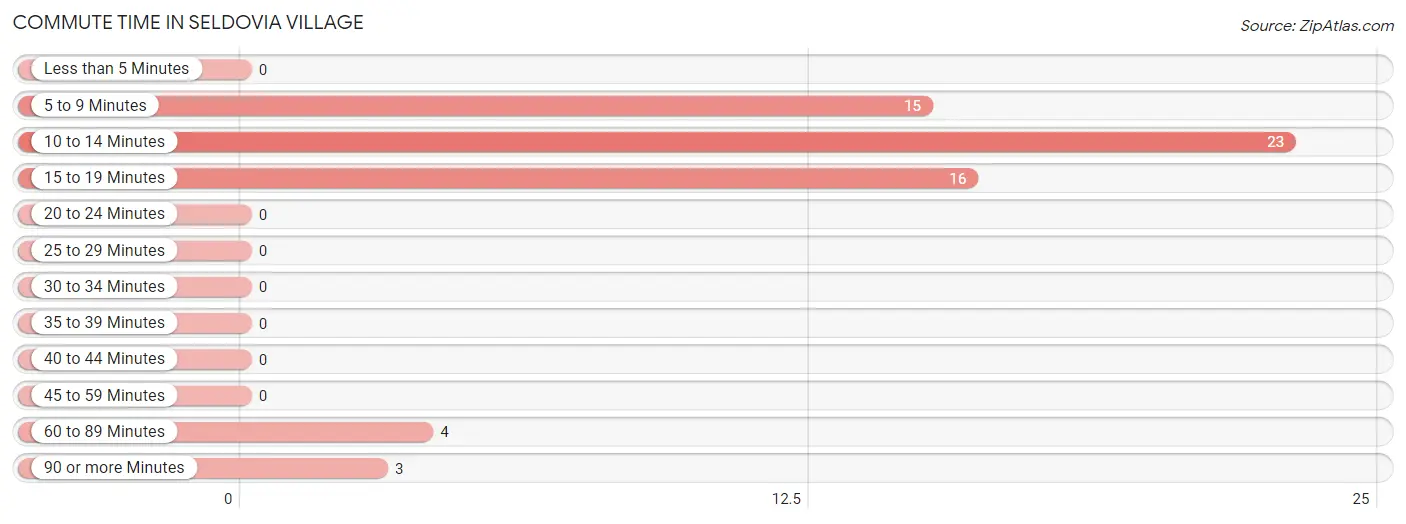
| Commute Time | # Commuters | % Commuters |
| Less than 5 Minutes | 0 | 0.0% |
| 5 to 9 Minutes | 15 | 24.6% |
| 10 to 14 Minutes | 23 | 37.7% |
| 15 to 19 Minutes | 16 | 26.2% |
| 20 to 24 Minutes | 0 | 0.0% |
| 25 to 29 Minutes | 0 | 0.0% |
| 30 to 34 Minutes | 0 | 0.0% |
| 35 to 39 Minutes | 0 | 0.0% |
| 40 to 44 Minutes | 0 | 0.0% |
| 45 to 59 Minutes | 0 | 0.0% |
| 60 to 89 Minutes | 4 | 6.6% |
| 90 or more Minutes | 3 | 4.9% |
Commute Time by Sex in Seldovia Village
The most common commute times in Seldovia Village are 10 to 14 minutes (4 commuters, 28.6%) for males and 10 to 14 minutes (19 commuters, 40.4%) for females.
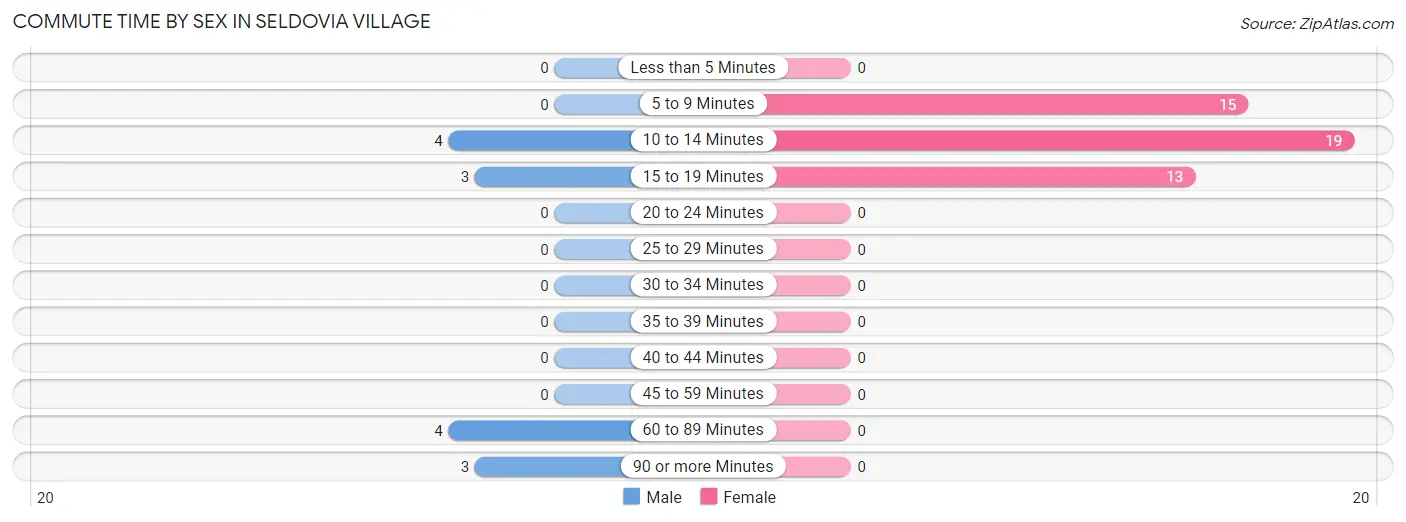
| Commute Time | Male | Female |
| Less than 5 Minutes | 0 (0.0%) | 0 (0.0%) |
| 5 to 9 Minutes | 0 (0.0%) | 15 (31.9%) |
| 10 to 14 Minutes | 4 (28.6%) | 19 (40.4%) |
| 15 to 19 Minutes | 3 (21.4%) | 13 (27.7%) |
| 20 to 24 Minutes | 0 (0.0%) | 0 (0.0%) |
| 25 to 29 Minutes | 0 (0.0%) | 0 (0.0%) |
| 30 to 34 Minutes | 0 (0.0%) | 0 (0.0%) |
| 35 to 39 Minutes | 0 (0.0%) | 0 (0.0%) |
| 40 to 44 Minutes | 0 (0.0%) | 0 (0.0%) |
| 45 to 59 Minutes | 0 (0.0%) | 0 (0.0%) |
| 60 to 89 Minutes | 4 (28.6%) | 0 (0.0%) |
| 90 or more Minutes | 3 (21.4%) | 0 (0.0%) |
Time of Departure to Work by Sex in Seldovia Village
The most frequent times of departure to work in Seldovia Village are 9:00 AM to 9:59 AM (8, 57.1%) for males and 8:00 AM to 8:29 AM (12, 25.5%) for females.
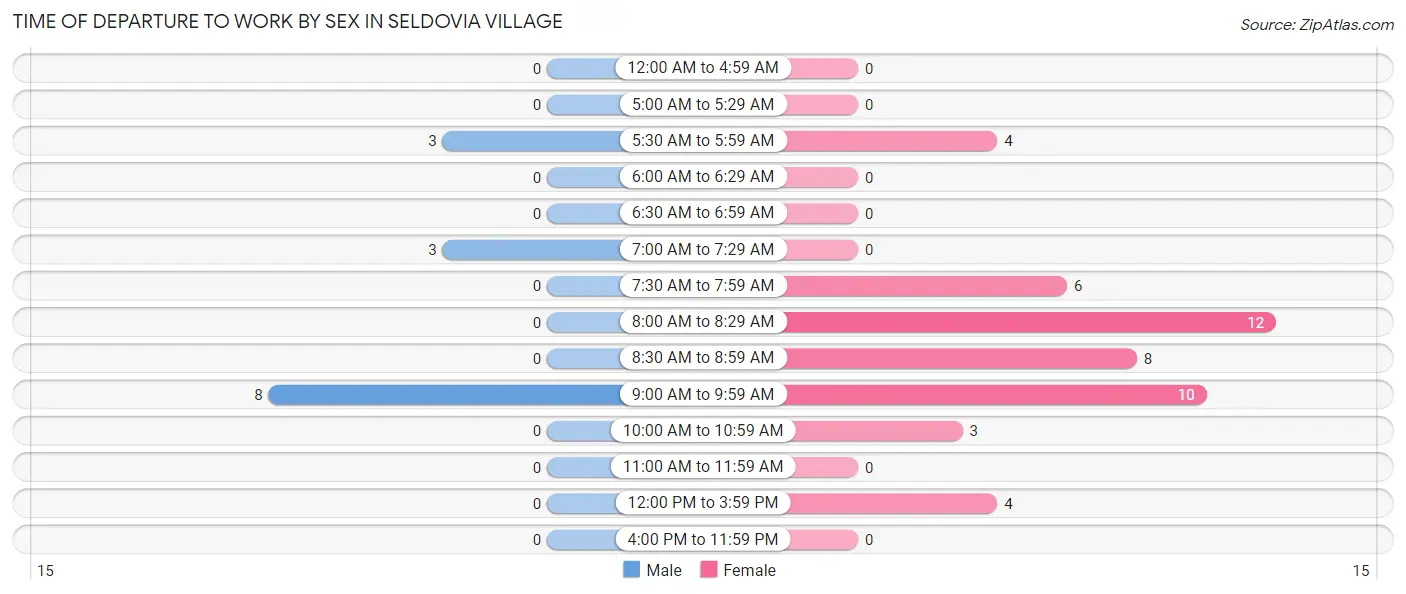
| Time of Departure | Male | Female |
| 12:00 AM to 4:59 AM | 0 (0.0%) | 0 (0.0%) |
| 5:00 AM to 5:29 AM | 0 (0.0%) | 0 (0.0%) |
| 5:30 AM to 5:59 AM | 3 (21.4%) | 4 (8.5%) |
| 6:00 AM to 6:29 AM | 0 (0.0%) | 0 (0.0%) |
| 6:30 AM to 6:59 AM | 0 (0.0%) | 0 (0.0%) |
| 7:00 AM to 7:29 AM | 3 (21.4%) | 0 (0.0%) |
| 7:30 AM to 7:59 AM | 0 (0.0%) | 6 (12.8%) |
| 8:00 AM to 8:29 AM | 0 (0.0%) | 12 (25.5%) |
| 8:30 AM to 8:59 AM | 0 (0.0%) | 8 (17.0%) |
| 9:00 AM to 9:59 AM | 8 (57.1%) | 10 (21.3%) |
| 10:00 AM to 10:59 AM | 0 (0.0%) | 3 (6.4%) |
| 11:00 AM to 11:59 AM | 0 (0.0%) | 0 (0.0%) |
| 12:00 PM to 3:59 PM | 0 (0.0%) | 4 (8.5%) |
| 4:00 PM to 11:59 PM | 0 (0.0%) | 0 (0.0%) |
| Total | 14 (100.0%) | 47 (100.0%) |
Housing Occupancy in Seldovia Village
Occupancy by Ownership in Seldovia Village
Of the total 90 dwellings in Seldovia Village, owner-occupied units account for 82 (91.1%), while renter-occupied units make up 8 (8.9%).
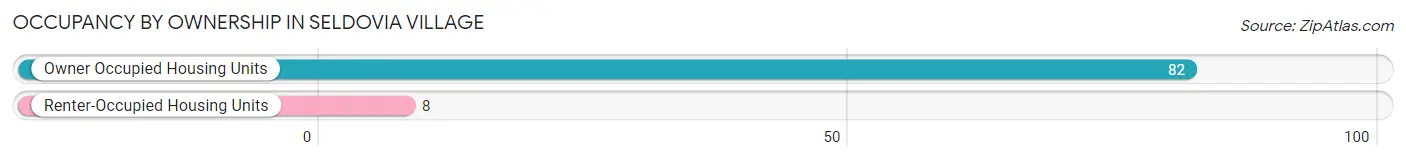
| Occupancy | # Housing Units | % Housing Units |
| Owner Occupied Housing Units | 82 | 91.1% |
| Renter-Occupied Housing Units | 8 | 8.9% |
| Total Occupied Housing Units | 90 | 100.0% |
Occupancy by Household Size in Seldovia Village
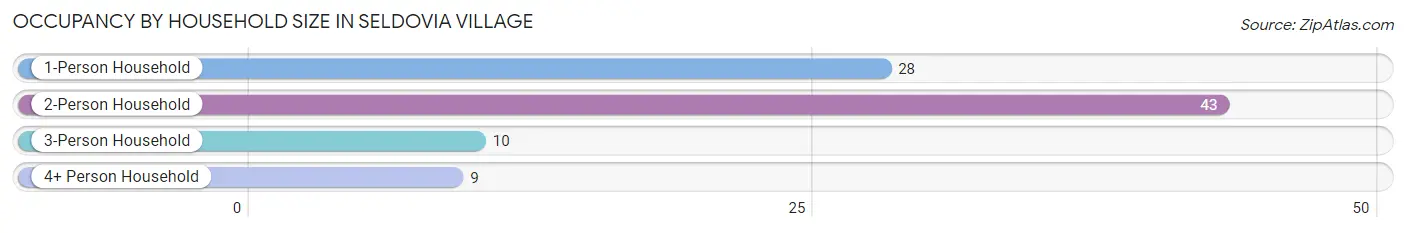
| Household Size | # Housing Units | % Housing Units |
| 1-Person Household | 28 | 31.1% |
| 2-Person Household | 43 | 47.8% |
| 3-Person Household | 10 | 11.1% |
| 4+ Person Household | 9 | 10.0% |
| Total Housing Units | 90 | 100.0% |
Occupancy by Ownership by Household Size in Seldovia Village
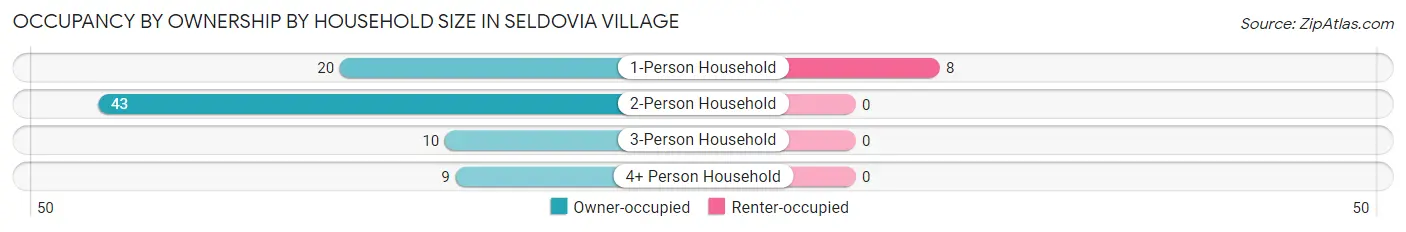
| Household Size | Owner-occupied | Renter-occupied |
| 1-Person Household | 20 (71.4%) | 8 (28.6%) |
| 2-Person Household | 43 (100.0%) | 0 (0.0%) |
| 3-Person Household | 10 (100.0%) | 0 (0.0%) |
| 4+ Person Household | 9 (100.0%) | 0 (0.0%) |
| Total Housing Units | 82 (91.1%) | 8 (8.9%) |
Occupancy by Educational Attainment in Seldovia Village
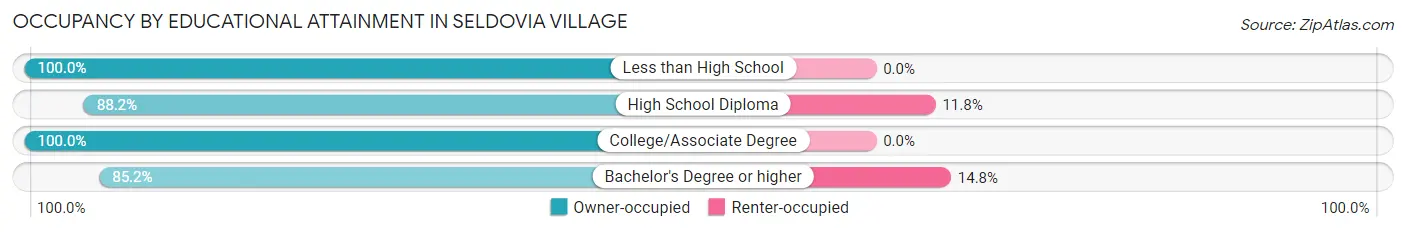
| Household Size | Owner-occupied | Renter-occupied |
| Less than High School | 2 (100.0%) | 0 (0.0%) |
| High School Diploma | 30 (88.2%) | 4 (11.8%) |
| College/Associate Degree | 27 (100.0%) | 0 (0.0%) |
| Bachelor's Degree or higher | 23 (85.2%) | 4 (14.8%) |
Occupancy by Age of Householder in Seldovia Village
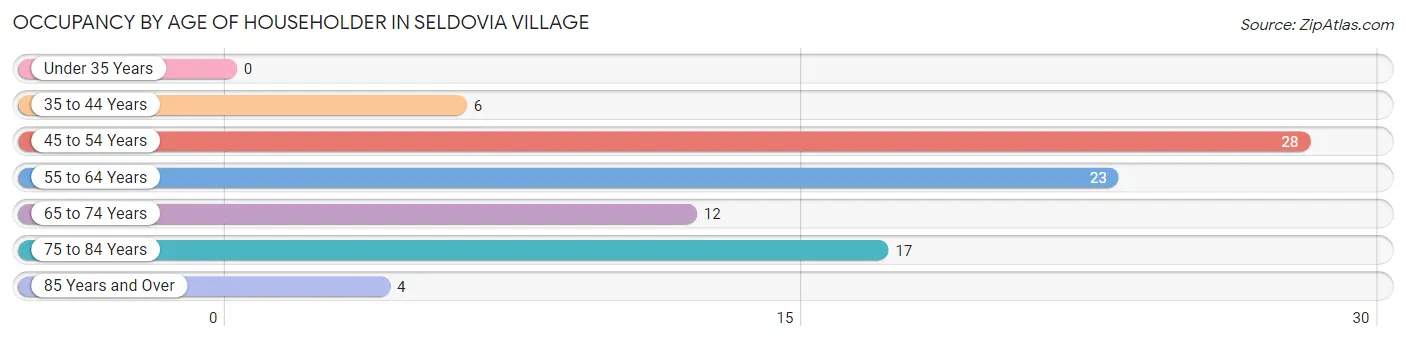
| Age Bracket | # Households | % Households |
| Under 35 Years | 0 | 0.0% |
| 35 to 44 Years | 6 | 6.7% |
| 45 to 54 Years | 28 | 31.1% |
| 55 to 64 Years | 23 | 25.6% |
| 65 to 74 Years | 12 | 13.3% |
| 75 to 84 Years | 17 | 18.9% |
| 85 Years and Over | 4 | 4.4% |
| Total | 90 | 100.0% |
Housing Finances in Seldovia Village
Median Income by Occupancy in Seldovia Village
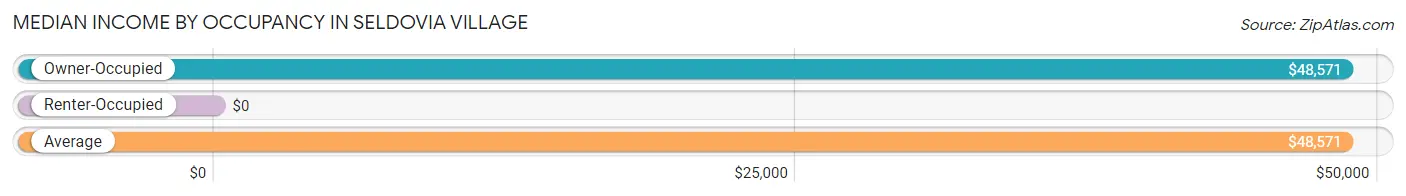
| Occupancy Type | # Households | Median Income |
| Owner-Occupied | 82 (91.1%) | $48,571 |
| Renter-Occupied | 8 (8.9%) | $0 |
| Average | 90 (100.0%) | $48,571 |
Occupancy by Householder Income Bracket in Seldovia Village
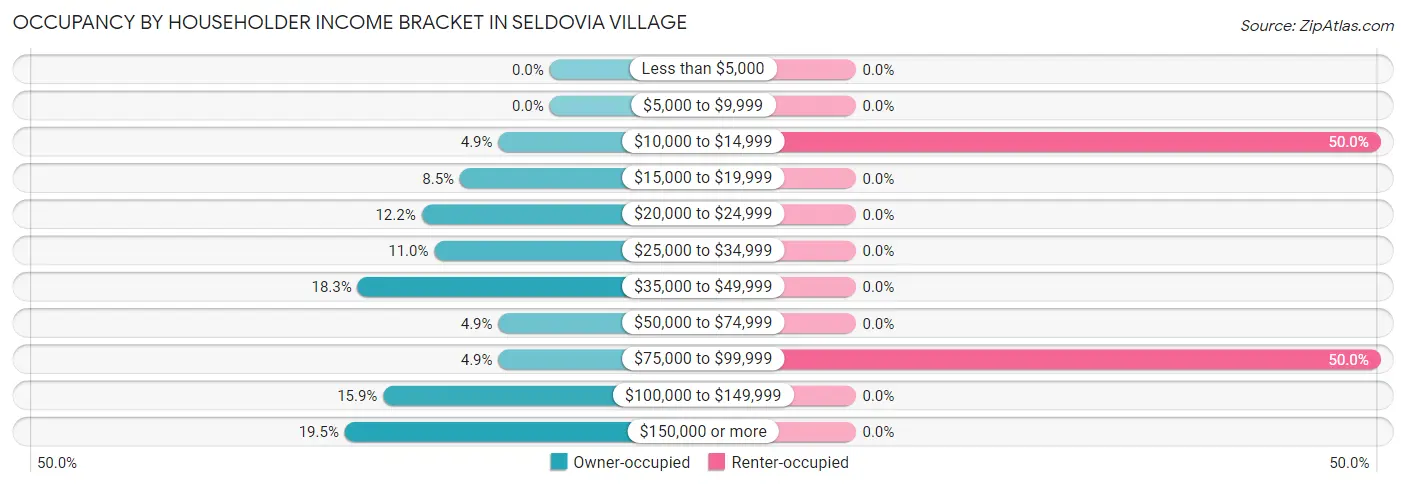
| Income Bracket | Owner-occupied | Renter-occupied |
| Less than $5,000 | 0 (0.0%) | 0 (0.0%) |
| $5,000 to $9,999 | 0 (0.0%) | 0 (0.0%) |
| $10,000 to $14,999 | 4 (4.9%) | 4 (50.0%) |
| $15,000 to $19,999 | 7 (8.5%) | 0 (0.0%) |
| $20,000 to $24,999 | 10 (12.2%) | 0 (0.0%) |
| $25,000 to $34,999 | 9 (11.0%) | 0 (0.0%) |
| $35,000 to $49,999 | 15 (18.3%) | 0 (0.0%) |
| $50,000 to $74,999 | 4 (4.9%) | 0 (0.0%) |
| $75,000 to $99,999 | 4 (4.9%) | 4 (50.0%) |
| $100,000 to $149,999 | 13 (15.9%) | 0 (0.0%) |
| $150,000 or more | 16 (19.5%) | 0 (0.0%) |
| Total | 82 (100.0%) | 8 (100.0%) |
Monthly Housing Cost Tiers in Seldovia Village
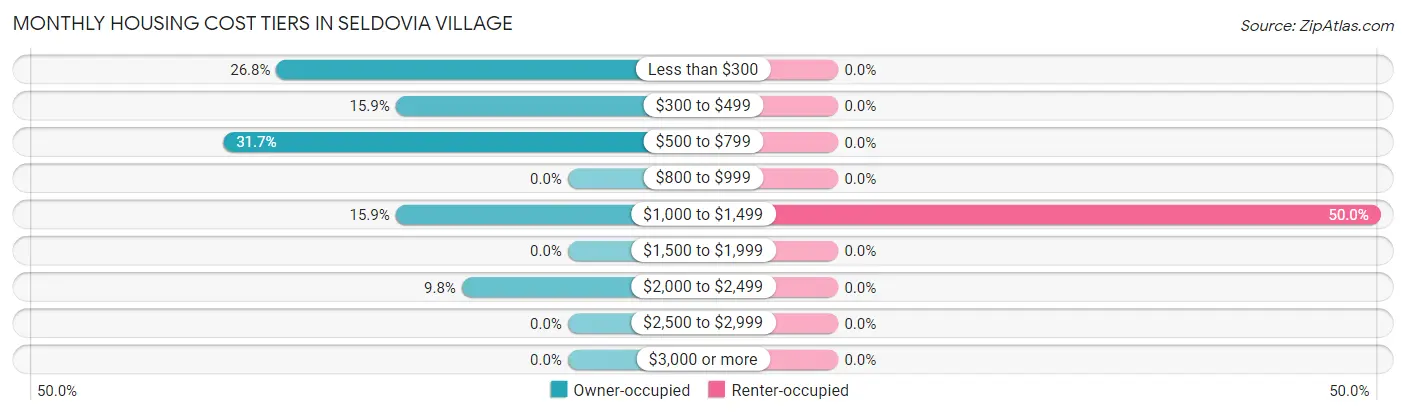
| Monthly Cost | Owner-occupied | Renter-occupied |
| Less than $300 | 22 (26.8%) | 0 (0.0%) |
| $300 to $499 | 13 (15.9%) | 0 (0.0%) |
| $500 to $799 | 26 (31.7%) | 0 (0.0%) |
| $800 to $999 | 0 (0.0%) | 0 (0.0%) |
| $1,000 to $1,499 | 13 (15.9%) | 4 (50.0%) |
| $1,500 to $1,999 | 0 (0.0%) | 0 (0.0%) |
| $2,000 to $2,499 | 8 (9.8%) | 0 (0.0%) |
| $2,500 to $2,999 | 0 (0.0%) | 0 (0.0%) |
| $3,000 or more | 0 (0.0%) | 0 (0.0%) |
| Total | 82 (100.0%) | 8 (100.0%) |
Physical Housing Characteristics in Seldovia Village
Housing Structures in Seldovia Village
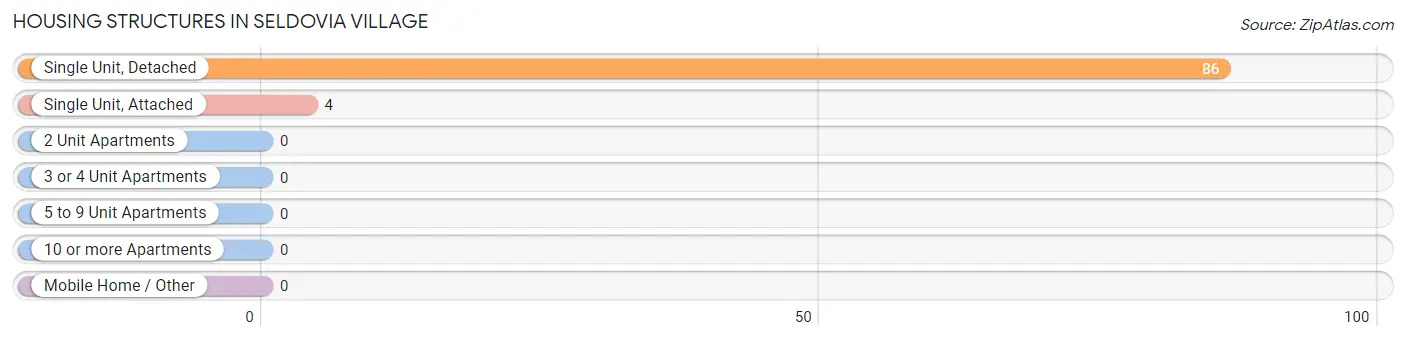
| Structure Type | # Housing Units | % Housing Units |
| Single Unit, Detached | 86 | 95.6% |
| Single Unit, Attached | 4 | 4.4% |
| 2 Unit Apartments | 0 | 0.0% |
| 3 or 4 Unit Apartments | 0 | 0.0% |
| 5 to 9 Unit Apartments | 0 | 0.0% |
| 10 or more Apartments | 0 | 0.0% |
| Mobile Home / Other | 0 | 0.0% |
| Total | 90 | 100.0% |
Housing Structures by Occupancy in Seldovia Village
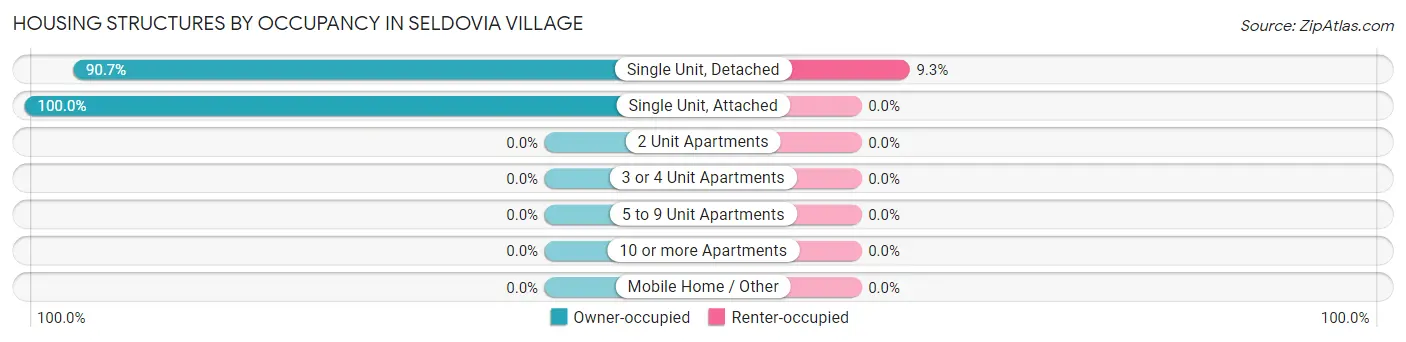
| Structure Type | Owner-occupied | Renter-occupied |
| Single Unit, Detached | 78 (90.7%) | 8 (9.3%) |
| Single Unit, Attached | 4 (100.0%) | 0 (0.0%) |
| 2 Unit Apartments | 0 (0.0%) | 0 (0.0%) |
| 3 or 4 Unit Apartments | 0 (0.0%) | 0 (0.0%) |
| 5 to 9 Unit Apartments | 0 (0.0%) | 0 (0.0%) |
| 10 or more Apartments | 0 (0.0%) | 0 (0.0%) |
| Mobile Home / Other | 0 (0.0%) | 0 (0.0%) |
| Total | 82 (91.1%) | 8 (8.9%) |
Housing Structures by Number of Rooms in Seldovia Village
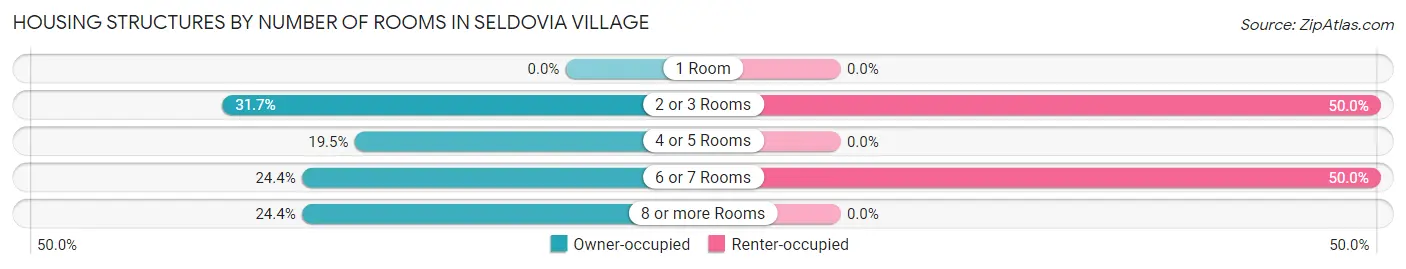
| Number of Rooms | Owner-occupied | Renter-occupied |
| 1 Room | 0 (0.0%) | 0 (0.0%) |
| 2 or 3 Rooms | 26 (31.7%) | 4 (50.0%) |
| 4 or 5 Rooms | 16 (19.5%) | 0 (0.0%) |
| 6 or 7 Rooms | 20 (24.4%) | 4 (50.0%) |
| 8 or more Rooms | 20 (24.4%) | 0 (0.0%) |
| Total | 82 (100.0%) | 8 (100.0%) |
Housing Structure by Heating Type in Seldovia Village
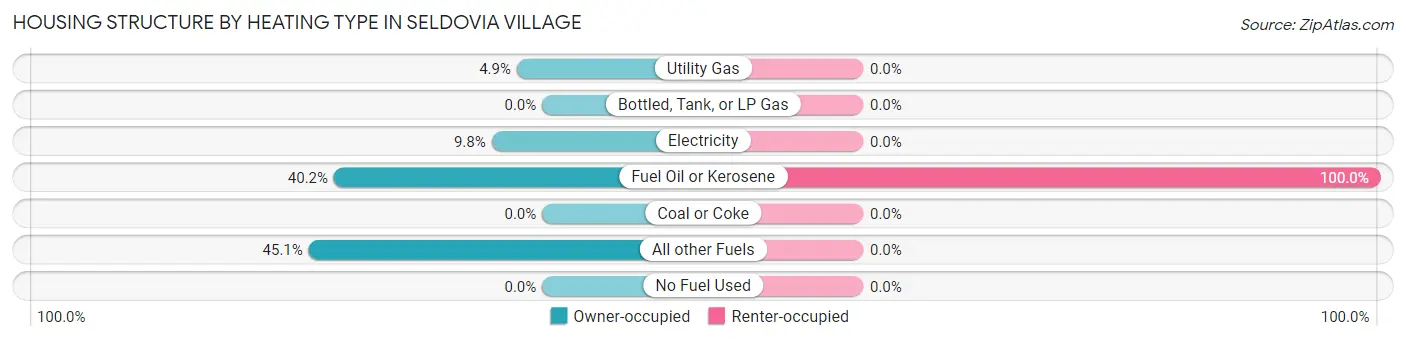
| Heating Type | Owner-occupied | Renter-occupied |
| Utility Gas | 4 (4.9%) | 0 (0.0%) |
| Bottled, Tank, or LP Gas | 0 (0.0%) | 0 (0.0%) |
| Electricity | 8 (9.8%) | 0 (0.0%) |
| Fuel Oil or Kerosene | 33 (40.2%) | 8 (100.0%) |
| Coal or Coke | 0 (0.0%) | 0 (0.0%) |
| All other Fuels | 37 (45.1%) | 0 (0.0%) |
| No Fuel Used | 0 (0.0%) | 0 (0.0%) |
| Total | 82 (100.0%) | 8 (100.0%) |
Household Vehicle Usage in Seldovia Village
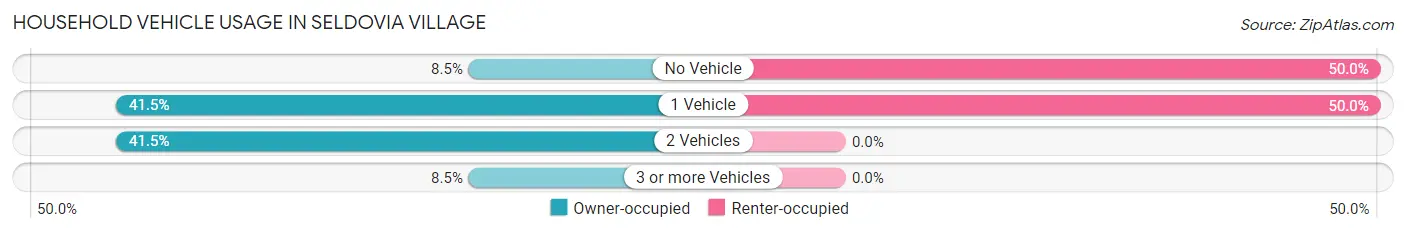
| Vehicles per Household | Owner-occupied | Renter-occupied |
| No Vehicle | 7 (8.5%) | 4 (50.0%) |
| 1 Vehicle | 34 (41.5%) | 4 (50.0%) |
| 2 Vehicles | 34 (41.5%) | 0 (0.0%) |
| 3 or more Vehicles | 7 (8.5%) | 0 (0.0%) |
| Total | 82 (100.0%) | 8 (100.0%) |
Real Estate & Mortgages in Seldovia Village
Real Estate and Mortgage Overview in Seldovia Village
| Characteristic | Without Mortgage | With Mortgage |
| Housing Units | 68 | 14 |
| Median Property Value | $181,300 | $237,500 |
| Median Household Income | $46,250 | $0 |
| Monthly Housing Costs | $483 | $0 |
| Real Estate Taxes | $1,136 | $2 |
Property Value by Mortgage Status in Seldovia Village
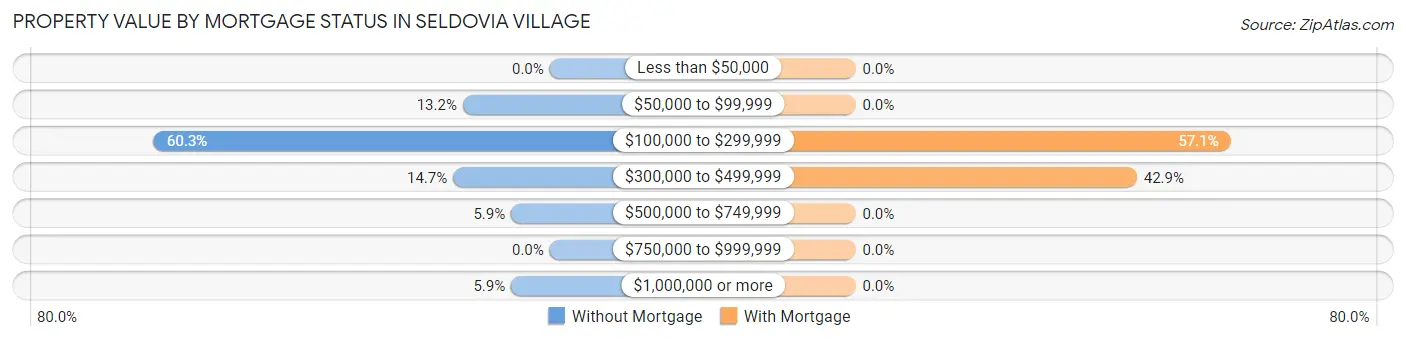
| Property Value | Without Mortgage | With Mortgage |
| Less than $50,000 | 0 (0.0%) | 0 (0.0%) |
| $50,000 to $99,999 | 9 (13.2%) | 0 (0.0%) |
| $100,000 to $299,999 | 41 (60.3%) | 8 (57.1%) |
| $300,000 to $499,999 | 10 (14.7%) | 6 (42.9%) |
| $500,000 to $749,999 | 4 (5.9%) | 0 (0.0%) |
| $750,000 to $999,999 | 0 (0.0%) | 0 (0.0%) |
| $1,000,000 or more | 4 (5.9%) | 0 (0.0%) |
| Total | 68 (100.0%) | 14 (100.0%) |
Household Income by Mortgage Status in Seldovia Village
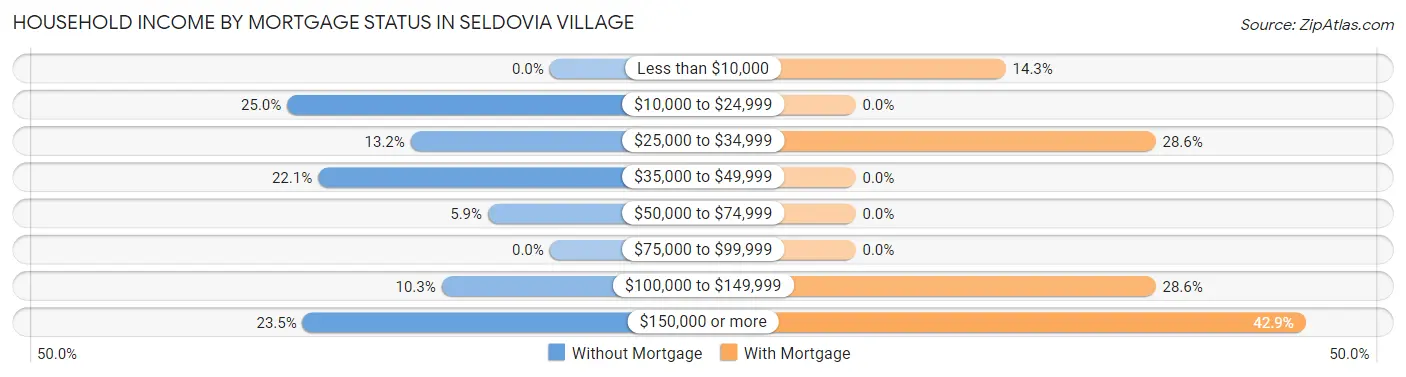
| Household Income | Without Mortgage | With Mortgage |
| Less than $10,000 | 0 (0.0%) | 2 (14.3%) |
| $10,000 to $24,999 | 17 (25.0%) | 0 (0.0%) |
| $25,000 to $34,999 | 9 (13.2%) | 4 (28.6%) |
| $35,000 to $49,999 | 15 (22.1%) | 0 (0.0%) |
| $50,000 to $74,999 | 4 (5.9%) | 0 (0.0%) |
| $75,000 to $99,999 | 0 (0.0%) | 0 (0.0%) |
| $100,000 to $149,999 | 7 (10.3%) | 4 (28.6%) |
| $150,000 or more | 16 (23.5%) | 6 (42.9%) |
| Total | 68 (100.0%) | 14 (100.0%) |
Property Value to Household Income Ratio in Seldovia Village
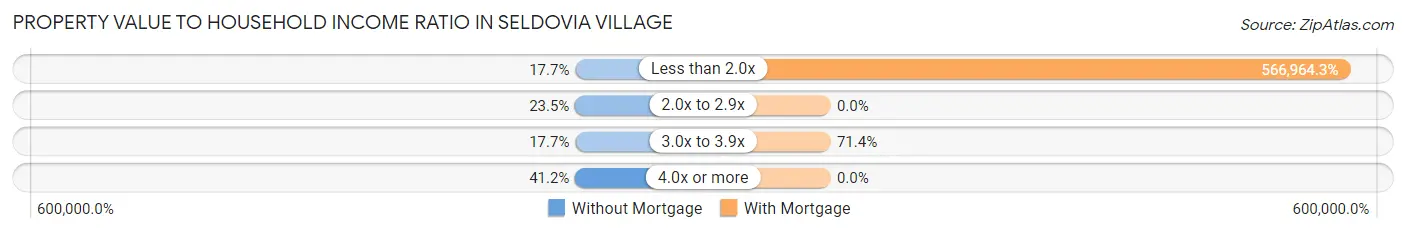
| Value-to-Income Ratio | Without Mortgage | With Mortgage |
| Less than 2.0x | 12 (17.6%) | 79,375 (566,964.3%) |
| 2.0x to 2.9x | 16 (23.5%) | 0 (0.0%) |
| 3.0x to 3.9x | 12 (17.6%) | 10 (71.4%) |
| 4.0x or more | 28 (41.2%) | 0 (0.0%) |
| Total | 68 (100.0%) | 14 (100.0%) |
Real Estate Taxes by Mortgage Status in Seldovia Village
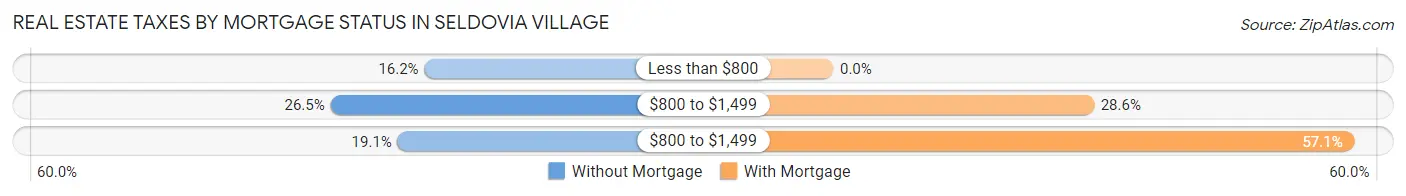
| Property Taxes | Without Mortgage | With Mortgage |
| Less than $800 | 11 (16.2%) | 0 (0.0%) |
| $800 to $1,499 | 18 (26.5%) | 4 (28.6%) |
| $800 to $1,499 | 13 (19.1%) | 8 (57.1%) |
| Total | 68 (100.0%) | 14 (100.0%) |
Health & Disability in Seldovia Village
Health Insurance Coverage by Age in Seldovia Village
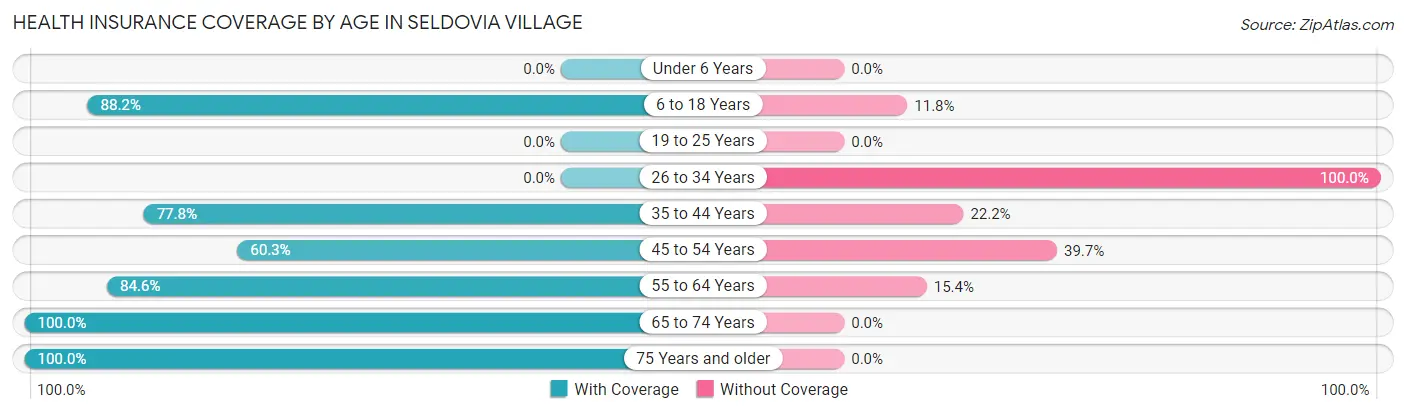
| Age Bracket | With Coverage | Without Coverage |
| Under 6 Years | 0 (0.0%) | 0 (0.0%) |
| 6 to 18 Years | 30 (88.2%) | 4 (11.8%) |
| 19 to 25 Years | 0 (0.0%) | 0 (0.0%) |
| 26 to 34 Years | 0 (0.0%) | 12 (100.0%) |
| 35 to 44 Years | 14 (77.8%) | 4 (22.2%) |
| 45 to 54 Years | 38 (60.3%) | 25 (39.7%) |
| 55 to 64 Years | 22 (84.6%) | 4 (15.4%) |
| 65 to 74 Years | 22 (100.0%) | 0 (0.0%) |
| 75 Years and older | 34 (100.0%) | 0 (0.0%) |
| Total | 160 (76.6%) | 49 (23.4%) |
Health Insurance Coverage by Citizenship Status in Seldovia Village
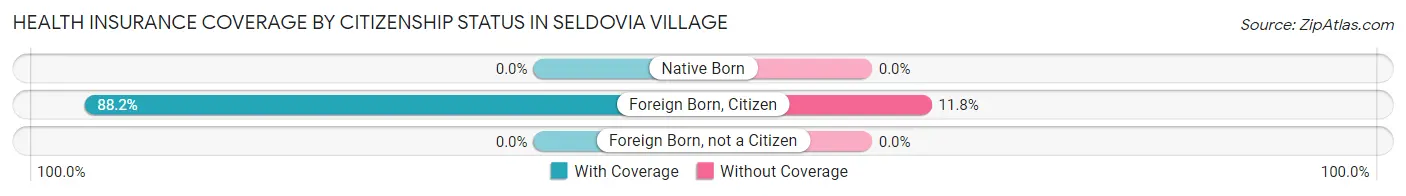
| Citizenship Status | With Coverage | Without Coverage |
| Native Born | 0 (0.0%) | 0 (0.0%) |
| Foreign Born, Citizen | 30 (88.2%) | 4 (11.8%) |
| Foreign Born, not a Citizen | 0 (0.0%) | 0 (0.0%) |
Health Insurance Coverage by Household Income in Seldovia Village
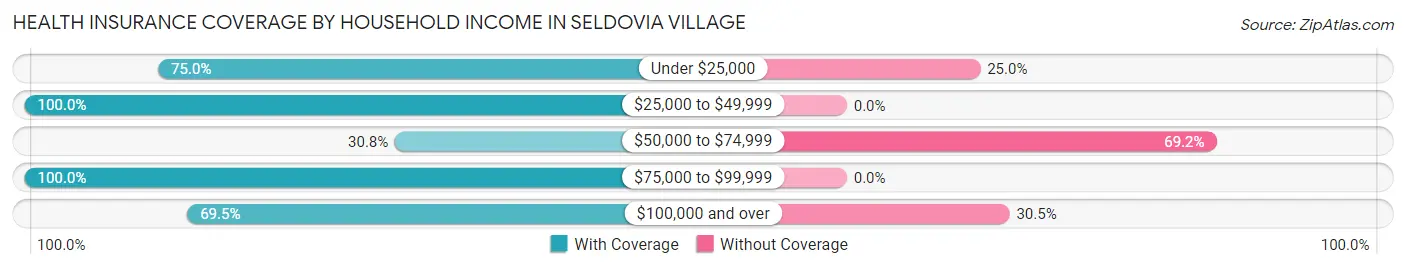
| Household Income | With Coverage | Without Coverage |
| Under $25,000 | 24 (75.0%) | 8 (25.0%) |
| $25,000 to $49,999 | 45 (100.0%) | 0 (0.0%) |
| $50,000 to $74,999 | 4 (30.8%) | 9 (69.2%) |
| $75,000 to $99,999 | 14 (100.0%) | 0 (0.0%) |
| $100,000 and over | 73 (69.5%) | 32 (30.5%) |
Public vs Private Health Insurance Coverage by Age in Seldovia Village
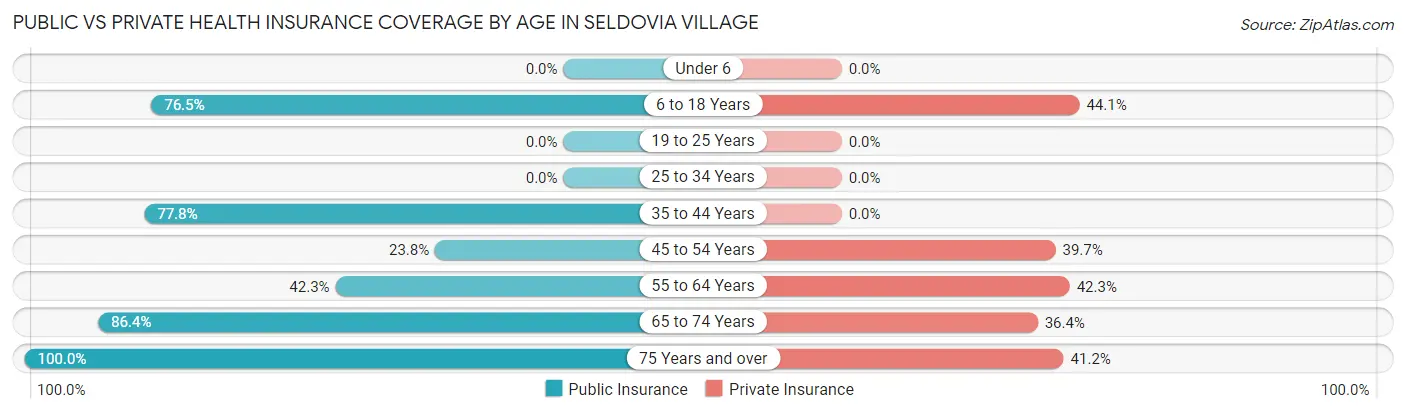
| Age Bracket | Public Insurance | Private Insurance |
| Under 6 | 0 (0.0%) | 0 (0.0%) |
| 6 to 18 Years | 26 (76.5%) | 15 (44.1%) |
| 19 to 25 Years | 0 (0.0%) | 0 (0.0%) |
| 25 to 34 Years | 0 (0.0%) | 0 (0.0%) |
| 35 to 44 Years | 14 (77.8%) | 0 (0.0%) |
| 45 to 54 Years | 15 (23.8%) | 25 (39.7%) |
| 55 to 64 Years | 11 (42.3%) | 11 (42.3%) |
| 65 to 74 Years | 19 (86.4%) | 8 (36.4%) |
| 75 Years and over | 34 (100.0%) | 14 (41.2%) |
| Total | 119 (56.9%) | 73 (34.9%) |
Disability Status by Sex by Age in Seldovia Village
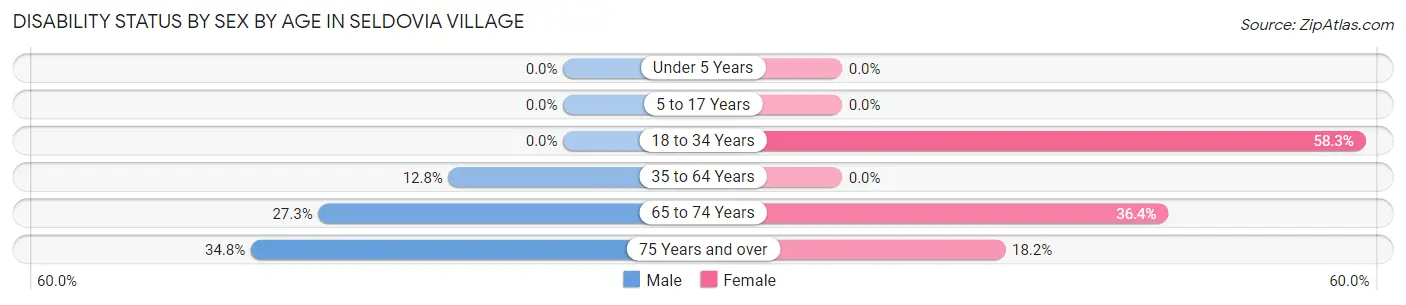
| Age Bracket | Male | Female |
| Under 5 Years | 0 (0.0%) | 0 (0.0%) |
| 5 to 17 Years | 0 (0.0%) | 0 (0.0%) |
| 18 to 34 Years | 0 (0.0%) | 7 (58.3%) |
| 35 to 64 Years | 6 (12.8%) | 0 (0.0%) |
| 65 to 74 Years | 3 (27.3%) | 4 (36.4%) |
| 75 Years and over | 8 (34.8%) | 2 (18.2%) |
Disability Class by Sex by Age in Seldovia Village
Disability Class: Hearing Difficulty
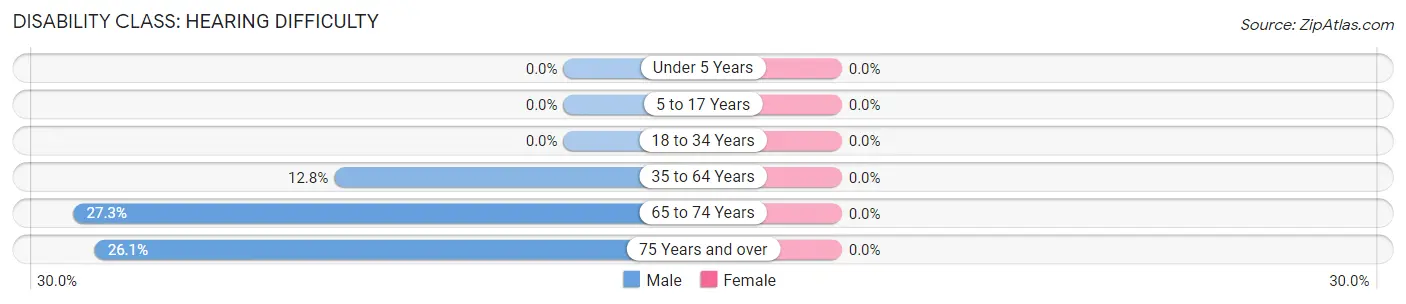
| Age Bracket | Male | Female |
| Under 5 Years | 0 (0.0%) | 0 (0.0%) |
| 5 to 17 Years | 0 (0.0%) | 0 (0.0%) |
| 18 to 34 Years | 0 (0.0%) | 0 (0.0%) |
| 35 to 64 Years | 6 (12.8%) | 0 (0.0%) |
| 65 to 74 Years | 3 (27.3%) | 0 (0.0%) |
| 75 Years and over | 6 (26.1%) | 0 (0.0%) |
Disability Class: Vision Difficulty
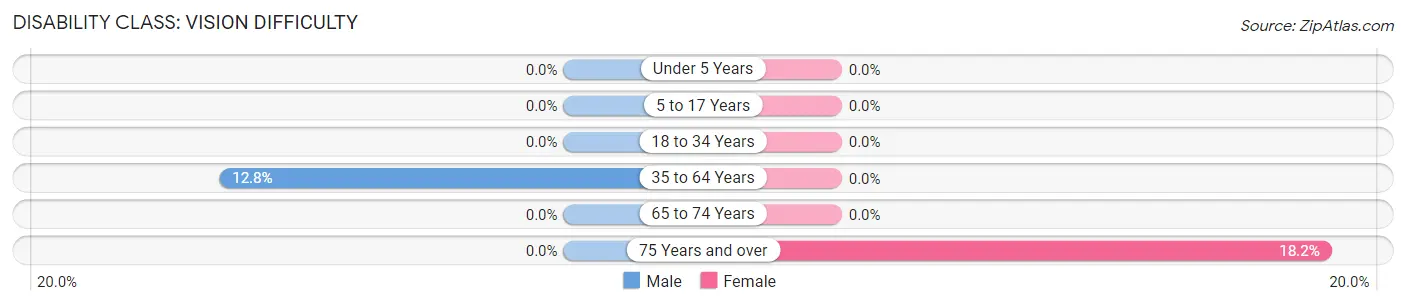
| Age Bracket | Male | Female |
| Under 5 Years | 0 (0.0%) | 0 (0.0%) |
| 5 to 17 Years | 0 (0.0%) | 0 (0.0%) |
| 18 to 34 Years | 0 (0.0%) | 0 (0.0%) |
| 35 to 64 Years | 6 (12.8%) | 0 (0.0%) |
| 65 to 74 Years | 0 (0.0%) | 0 (0.0%) |
| 75 Years and over | 0 (0.0%) | 2 (18.2%) |
Disability Class: Cognitive Difficulty
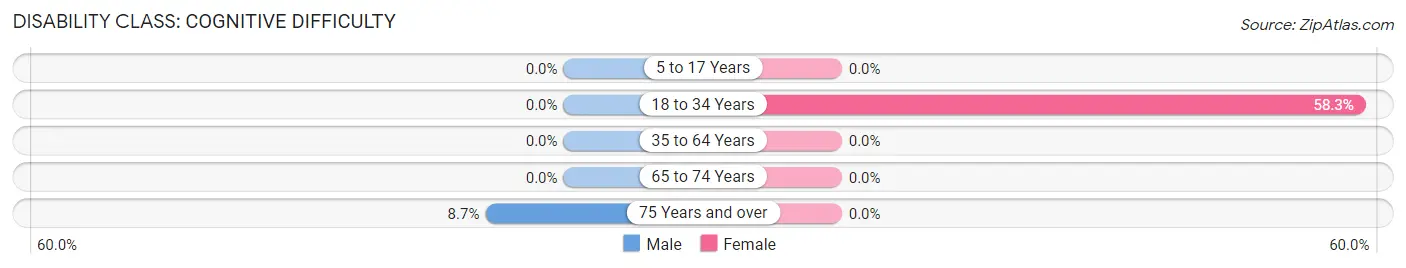
| Age Bracket | Male | Female |
| 5 to 17 Years | 0 (0.0%) | 0 (0.0%) |
| 18 to 34 Years | 0 (0.0%) | 7 (58.3%) |
| 35 to 64 Years | 0 (0.0%) | 0 (0.0%) |
| 65 to 74 Years | 0 (0.0%) | 0 (0.0%) |
| 75 Years and over | 2 (8.7%) | 0 (0.0%) |
Disability Class: Ambulatory Difficulty
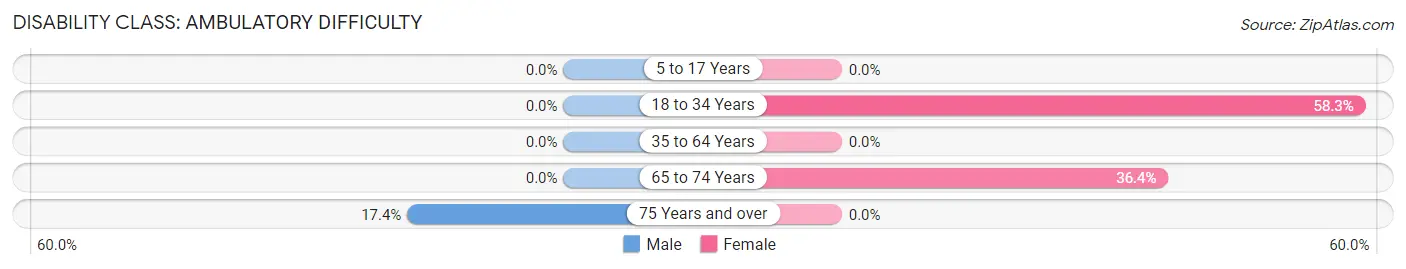
| Age Bracket | Male | Female |
| 5 to 17 Years | 0 (0.0%) | 0 (0.0%) |
| 18 to 34 Years | 0 (0.0%) | 7 (58.3%) |
| 35 to 64 Years | 0 (0.0%) | 0 (0.0%) |
| 65 to 74 Years | 0 (0.0%) | 4 (36.4%) |
| 75 Years and over | 4 (17.4%) | 0 (0.0%) |
Disability Class: Self-Care Difficulty
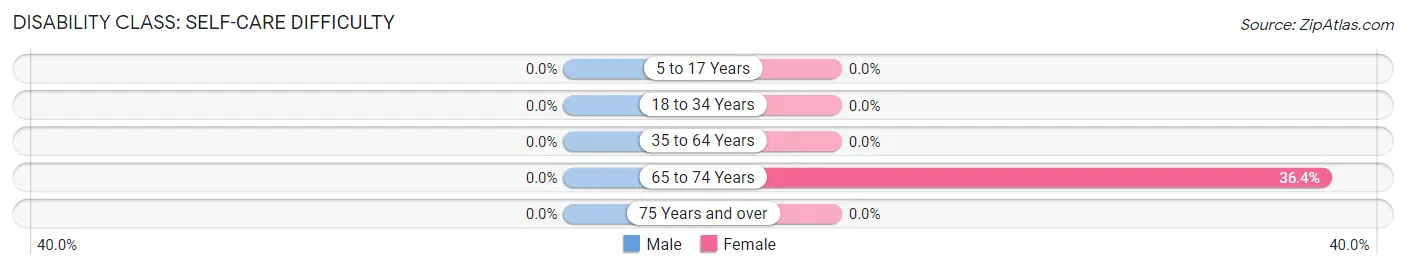
| Age Bracket | Male | Female |
| 5 to 17 Years | 0 (0.0%) | 0 (0.0%) |
| 18 to 34 Years | 0 (0.0%) | 0 (0.0%) |
| 35 to 64 Years | 0 (0.0%) | 0 (0.0%) |
| 65 to 74 Years | 0 (0.0%) | 4 (36.4%) |
| 75 Years and over | 0 (0.0%) | 0 (0.0%) |
Technology Access in Seldovia Village
Computing Device Access in Seldovia Village
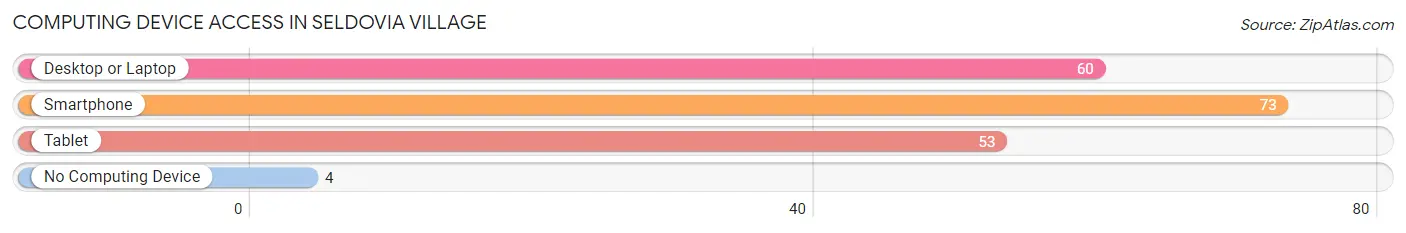
| Device Type | # Households | % Households |
| Desktop or Laptop | 60 | 66.7% |
| Smartphone | 73 | 81.1% |
| Tablet | 53 | 58.9% |
| No Computing Device | 4 | 4.4% |
| Total | 90 | 100.0% |
Internet Access in Seldovia Village
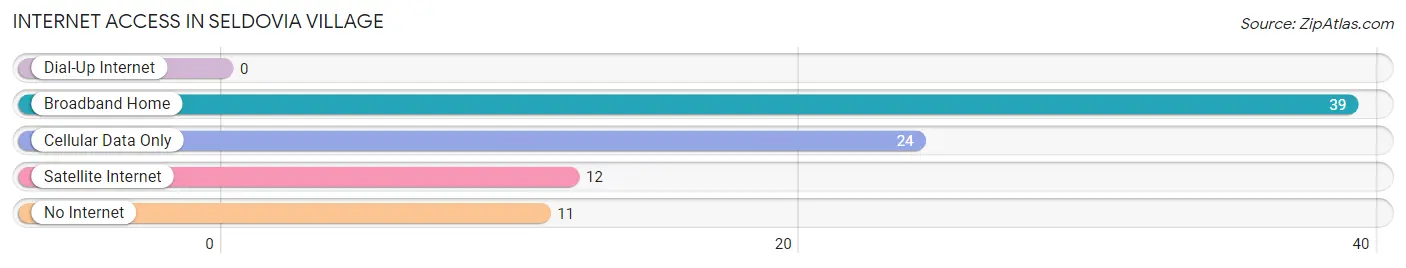
| Internet Type | # Households | % Households |
| Dial-Up Internet | 0 | 0.0% |
| Broadband Home | 39 | 43.3% |
| Cellular Data Only | 24 | 26.7% |
| Satellite Internet | 12 | 13.3% |
| No Internet | 11 | 12.2% |
| Total | 90 | 100.0% |
Seldovia Village Summary
Seldovia Village is a small community located on the western side of the Kenai Peninsula in Alaska. It is situated on the shores of Kachemak Bay, about 30 miles south of Homer. The village has a population of about 300 people and is home to the Seldovia Native Tribe.
History
The Seldovia Native Tribe has lived in the area for thousands of years. The first recorded contact with Europeans was in 1786 when the Russian explorer, Grigory Shelikhov, arrived in the area. He established a trading post in the area and the Seldovia Native Tribe began trading with the Russians. In 1867, the United States purchased Alaska from Russia and the Seldovia Native Tribe continued to trade with the Americans.
In the late 1800s, the Seldovia Native Tribe began to experience a decline in population due to disease and other factors. In the early 1900s, the population had dropped to only a few hundred people. In the 1920s, the Seldovia Native Tribe began to experience a resurgence in population as more people moved to the area to take advantage of the fishing and logging opportunities.
In the 1950s, the Seldovia Native Tribe was granted federal recognition and the Seldovia Village was established. The village was incorporated in 1959 and has since become a popular tourist destination.
Geography
Seldovia Village is located on the western side of the Kenai Peninsula in Alaska. It is situated on the shores of Kachemak Bay, about 30 miles south of Homer. The village is surrounded by mountains and is located on a narrow strip of land between the bay and the mountains. The climate in the area is mild and the average temperature in the summer is around 60 degrees Fahrenheit.
The village is accessible by boat or plane and is a popular destination for tourists. There are several charter boats that offer fishing trips and sightseeing tours of the area.
Economy
The economy of Seldovia Village is largely based on fishing and tourism. The village is home to several commercial fishing operations and the Seldovia Native Tribe operates a fish processing plant. The village also has several restaurants, gift shops, and other tourist-related businesses.
The Seldovia Native Tribe also operates a casino and a bingo hall. The casino and bingo hall are popular attractions for tourists and locals alike.
Demographics
As of the 2010 census, the population of Seldovia Village was 300 people. The racial makeup of the village was 95.3% Native American, 2.7% White, 0.3% Asian, and 1.7% from other races. The median age of the population was 37.7 years.
The median household income in Seldovia Village was $41,250 and the median family income was $45,000. The per capita income was $19,000. About 11.7% of the population was below the poverty line.
Conclusion
Seldovia Village is a small community located on the western side of the Kenai Peninsula in Alaska. It is home to the Seldovia Native Tribe and has a population of about 300 people. The economy of the village is largely based on fishing and tourism and the Seldovia Native Tribe operates a fish processing plant and a casino. The population of the village is mostly Native American and the median household income is $41,250.
Common Questions
What is the Total Population of Seldovia Village?
Total Population of Seldovia Village is 209.
What is the Total Male Population of Seldovia Village?
Total Male Population of Seldovia Village is 103.
What is the Total Female Population of Seldovia Village?
Total Female Population of Seldovia Village is 106.
What is the Ratio of Males per 100 Females in Seldovia Village?
There are 97.17 Males per 100 Females in Seldovia Village.
What is the Ratio of Females per 100 Males in Seldovia Village?
There are 102.91 Females per 100 Males in Seldovia Village.
What is the Median Population Age in Seldovia Village?
Median Population Age in Seldovia Village is 53.2 Years.
What is the Average Family Size in Seldovia Village
Average Family Size in Seldovia Village is 2.9 People.
What is the Average Household Size in Seldovia Village
Average Household Size in Seldovia Village is 2.3 People.
What is Per Capita Income in Seldovia Village?
Per Capita income in Seldovia Village is $36,154.
What is the Median Family Income in Seldovia Village?
Median Family Income in Seldovia Village is $101,250.
What is the Median Household income in Seldovia Village?
Median Household Income in Seldovia Village is $48,571.
What is Inequality or Gini Index in Seldovia Village?
Inequality or Gini Index in Seldovia Village is 0.47.
How Large is the Labor Force in Seldovia Village?
There are 81 People in the Labor Forcein in Seldovia Village.
What is the Percentage of People in the Labor Force in Seldovia Village?
44.0% of People are in the Labor Force in Seldovia Village.