Selawik, AK
Selawik Map
Selawik Overview
557
TOTAL POPULATION
316
MALE POPULATION
241
FEMALE POPULATION
131.12
MALES / 100 FEMALES
76.27
FEMALES / 100 MALES
21.9
MEDIAN AGE
4.8
AVG FAMILY SIZE
4.6
AVG HOUSEHOLD SIZE
$14,015
PER CAPITA INCOME
$54,583
AVG FAMILY INCOME
$52,917
AVG HOUSEHOLD INCOME
43.9%
WAGE / INCOME GAP [ % ]
56.1¢/ $1
WAGE / INCOME GAP [ $ ]
0.41
INEQUALITY / GINI INDEX
136
LABOR FORCE [ PEOPLE ]
42.1%
PERCENT IN LABOR FORCE
33.1%
UNEMPLOYMENT RATE
Selawik Zip Codes
Selawik Area Codes
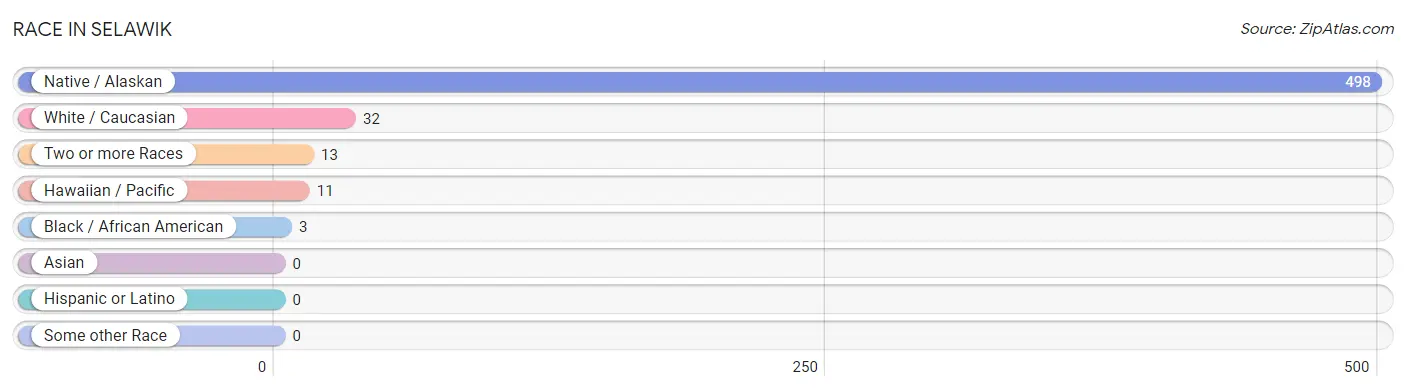
Race in Selawik
The most populous races in Selawik are Native / Alaskan (498 | 89.4%), White / Caucasian (32 | 5.8%), and Two or more Races (13 | 2.3%).
| Race | # Population | % Population |
| Asian | 0 | 0.0% |
| Black / African American | 3 | 0.5% |
| Hawaiian / Pacific | 11 | 2.0% |
| Hispanic or Latino | 0 | 0.0% |
| Native / Alaskan | 498 | 89.4% |
| White / Caucasian | 32 | 5.8% |
| Two or more Races | 13 | 2.3% |
| Some other Race | 0 | 0.0% |
| Total | 557 | 100.0% |
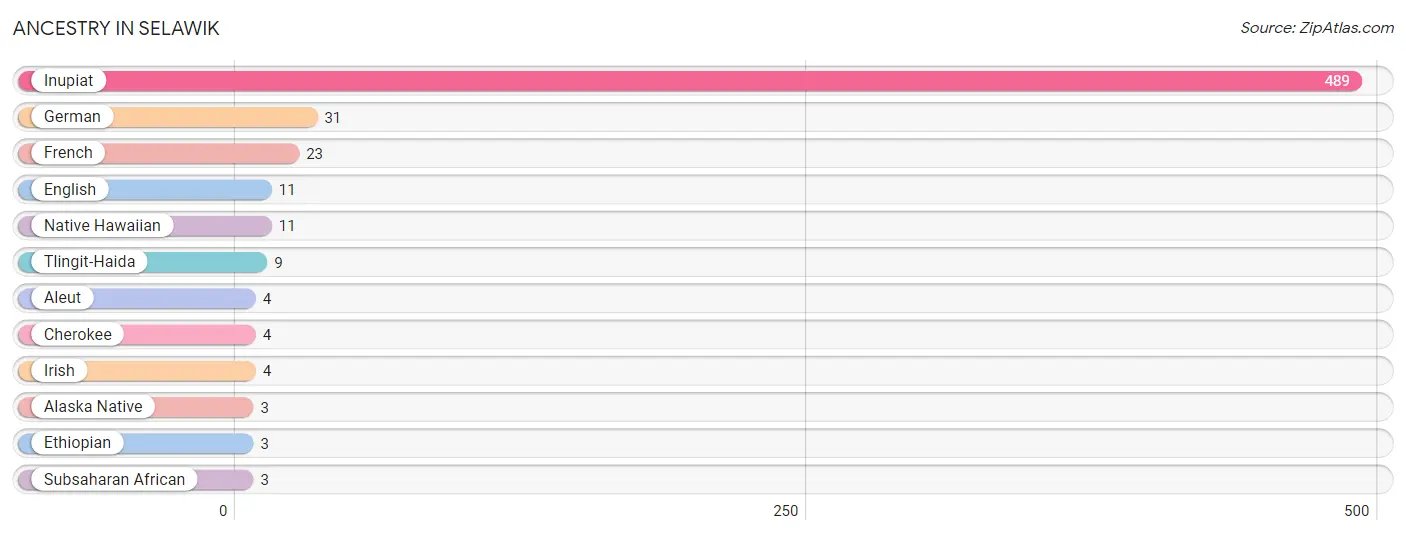
Ancestry in Selawik
The most populous ancestries reported in Selawik are Inupiat (489 | 87.8%), German (31 | 5.6%), French (23 | 4.1%), English (11 | 2.0%), and Native Hawaiian (11 | 2.0%), together accounting for 101.4% of all Selawik residents.
| Ancestry | # Population | % Population |
| Alaska Native | 3 | 0.5% |
| Aleut | 4 | 0.7% |
| Cherokee | 4 | 0.7% |
| English | 11 | 2.0% |
| Ethiopian | 3 | 0.5% |
| French | 23 | 4.1% |
| German | 31 | 5.6% |
| Inupiat | 489 | 87.8% |
| Irish | 4 | 0.7% |
| Native Hawaiian | 11 | 2.0% |
| Subsaharan African | 3 | 0.5% |
| Tlingit-Haida | 9 | 1.6% | View All 12 Rows |
Immigrants in Selawik

| Immigration Origin | # Population | % Population | View All 0 Rows |
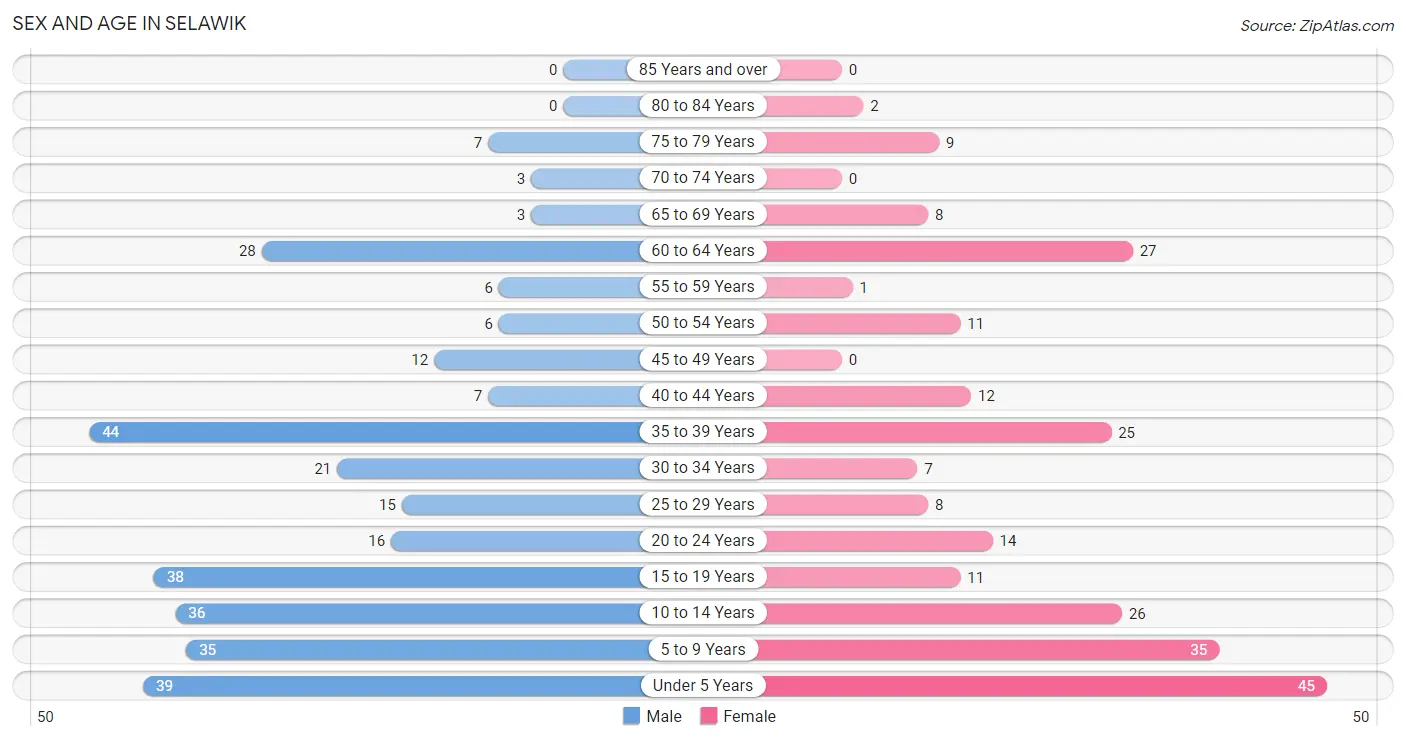
Sex and Age in Selawik
Sex and Age in Selawik
The most populous age groups in Selawik are 35 to 39 Years (44 | 13.9%) for men and Under 5 Years (45 | 18.7%) for women.
| Age Bracket | Male | Female |
| Under 5 Years | 39 (12.3%) | 45 (18.7%) |
| 5 to 9 Years | 35 (11.1%) | 35 (14.5%) |
| 10 to 14 Years | 36 (11.4%) | 26 (10.8%) |
| 15 to 19 Years | 38 (12.0%) | 11 (4.6%) |
| 20 to 24 Years | 16 (5.1%) | 14 (5.8%) |
| 25 to 29 Years | 15 (4.8%) | 8 (3.3%) |
| 30 to 34 Years | 21 (6.7%) | 7 (2.9%) |
| 35 to 39 Years | 44 (13.9%) | 25 (10.4%) |
| 40 to 44 Years | 7 (2.2%) | 12 (5.0%) |
| 45 to 49 Years | 12 (3.8%) | 0 (0.0%) |
| 50 to 54 Years | 6 (1.9%) | 11 (4.6%) |
| 55 to 59 Years | 6 (1.9%) | 1 (0.4%) |
| 60 to 64 Years | 28 (8.9%) | 27 (11.2%) |
| 65 to 69 Years | 3 (0.9%) | 8 (3.3%) |
| 70 to 74 Years | 3 (0.9%) | 0 (0.0%) |
| 75 to 79 Years | 7 (2.2%) | 9 (3.7%) |
| 80 to 84 Years | 0 (0.0%) | 2 (0.8%) |
| 85 Years and over | 0 (0.0%) | 0 (0.0%) |
| Total | 316 (100.0%) | 241 (100.0%) |
Families and Households in Selawik
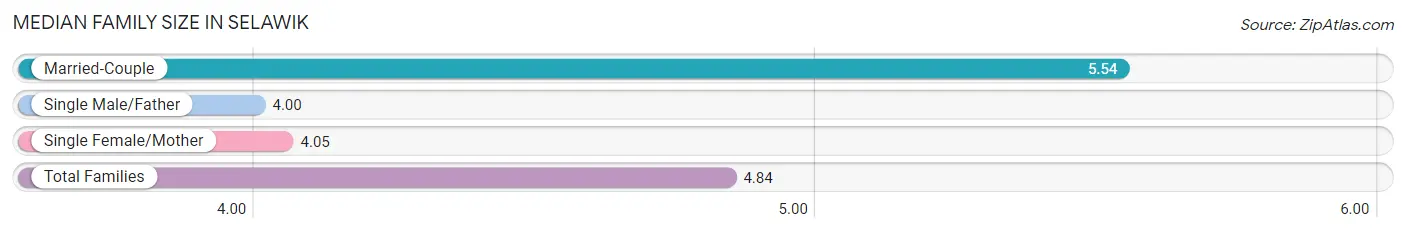
Median Family Size in Selawik
The median family size in Selawik is 4.84 persons per family, with married-couple families (57 | 53.3%) accounting for the largest median family size of 5.54 persons per family. On the other hand, single male/father families (9 | 8.4%) represent the smallest median family size with 4.00 persons per family.
| Family Type | # Families | Family Size |
| Married-Couple | 57 (53.3%) | 5.54 |
| Single Male/Father | 9 (8.4%) | 4.00 |
| Single Female/Mother | 41 (38.3%) | 4.05 |
| Total Families | 107 (100.0%) | 4.84 |
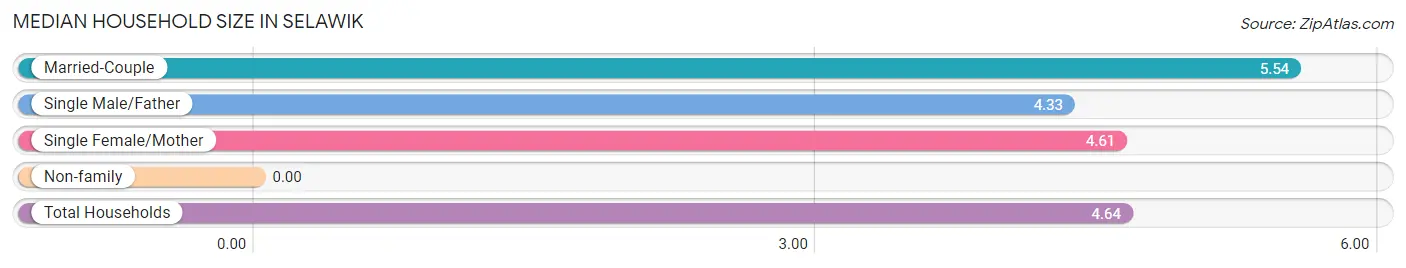
Median Household Size in Selawik
| Household Type | # Households | Household Size |
| Married-Couple | 57 (47.5%) | 5.54 |
| Single Male/Father | 9 (7.5%) | 4.33 |
| Single Female/Mother | 41 (34.2%) | 4.61 |
| Non-family | 13 (10.8%) | - |
| Total Households | 120 (100.0%) | 4.64 |
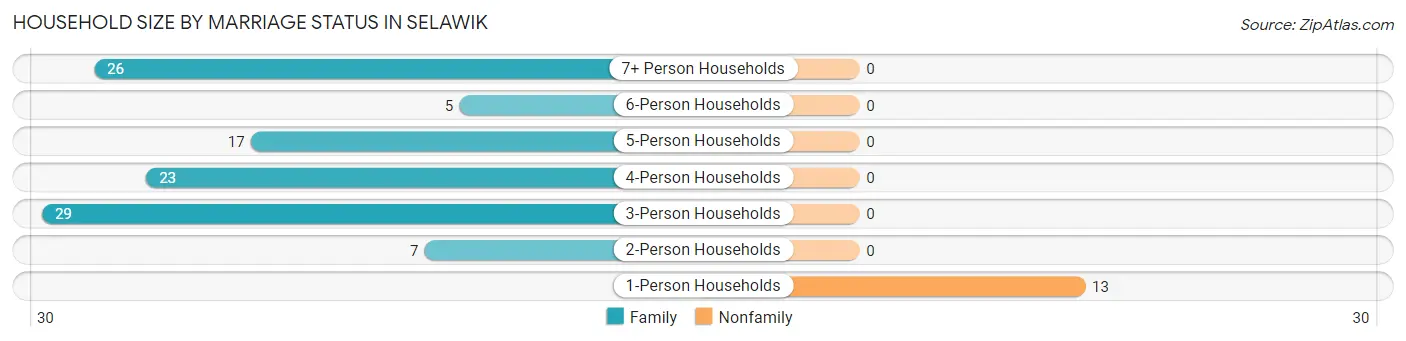
Household Size by Marriage Status in Selawik
Out of a total of 120 households in Selawik, 107 (89.2%) are family households, while 13 (10.8%) are nonfamily households. The most numerous type of family households are 3-person households, comprising 29, and the most common type of nonfamily households are 1-person households, comprising 13.
| Household Size | Family Households | Nonfamily Households |
| 1-Person Households | - | 13 (10.8%) |
| 2-Person Households | 7 (5.8%) | 0 (0.0%) |
| 3-Person Households | 29 (24.2%) | 0 (0.0%) |
| 4-Person Households | 23 (19.2%) | 0 (0.0%) |
| 5-Person Households | 17 (14.2%) | 0 (0.0%) |
| 6-Person Households | 5 (4.2%) | 0 (0.0%) |
| 7+ Person Households | 26 (21.7%) | 0 (0.0%) |
| Total | 107 (89.2%) | 13 (10.8%) |
Female Fertility in Selawik
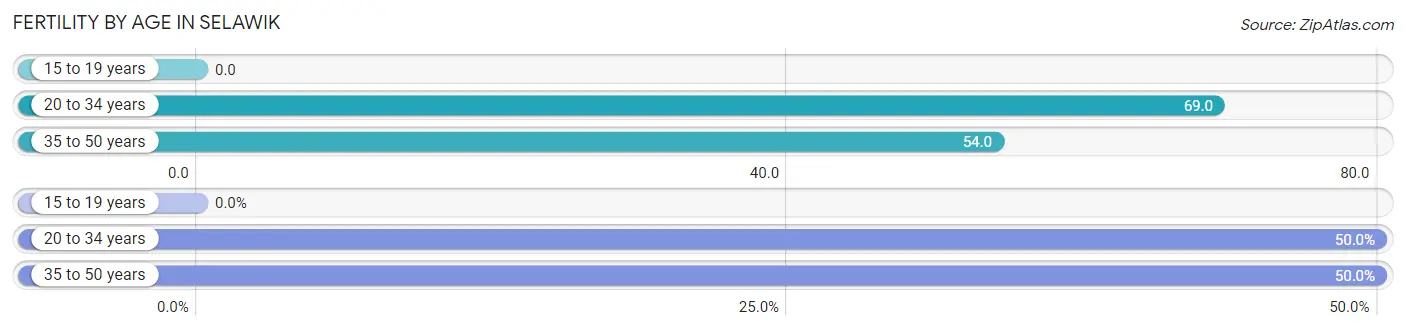
Fertility by Age in Selawik
Average fertility rate in Selawik is 52.0 births per 1,000 women. Women in the age bracket of 20 to 34 years have the highest fertility rate with 69.0 births per 1,000 women. Women in the age bracket of 20 to 34 years acount for 50.0% of all women with births.
| Age Bracket | Women with Births | Births / 1,000 Women |
| 15 to 19 years | 0 (0.0%) | 0.0 |
| 20 to 34 years | 2 (50.0%) | 69.0 |
| 35 to 50 years | 2 (50.0%) | 54.0 |
| Total | 4 (100.0%) | 52.0 |
Fertility by Age by Marriage Status in Selawik
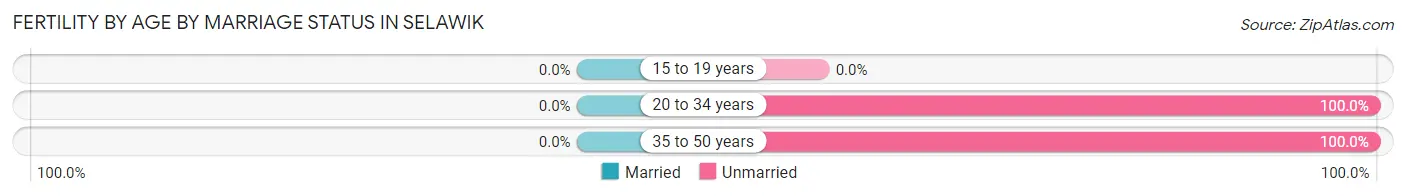
| Age Bracket | Married | Unmarried |
| 15 to 19 years | 0 (0.0%) | 0 (0.0%) |
| 20 to 34 years | 0 (0.0%) | 2 (100.0%) |
| 35 to 50 years | 0 (0.0%) | 2 (100.0%) |
| Total | 0 (0.0%) | 4 (100.0%) |
Fertility by Education in Selawik
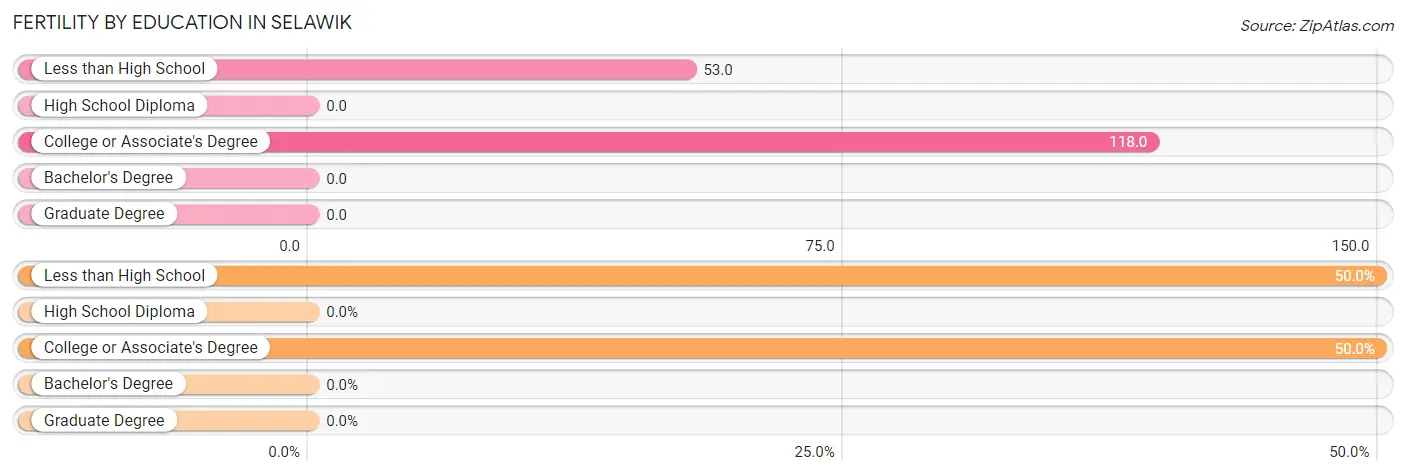
| Educational Attainment | Women with Births | Births / 1,000 Women |
| Less than High School | 2 (50.0%) | 53.0 |
| High School Diploma | 0 (0.0%) | 0.0 |
| College or Associate's Degree | 2 (50.0%) | 118.0 |
| Bachelor's Degree | 0 (0.0%) | 0.0 |
| Graduate Degree | 0 (0.0%) | 0.0 |
| Total | 4 (100.0%) | 52.0 |
Fertility by Education by Marriage Status in Selawik
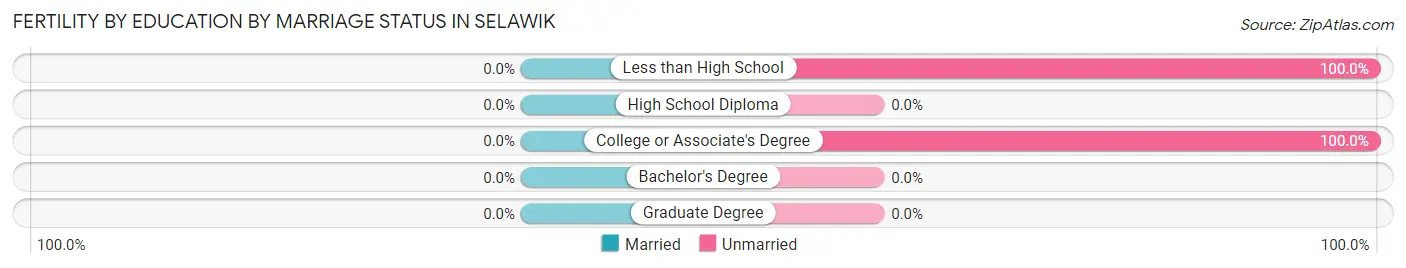
| Educational Attainment | Married | Unmarried |
| Less than High School | 0 (0.0%) | 2 (100.0%) |
| High School Diploma | 0 (0.0%) | 0 (0.0%) |
| College or Associate's Degree | 0 (0.0%) | 2 (100.0%) |
| Bachelor's Degree | 0 (0.0%) | 0 (0.0%) |
| Graduate Degree | 0 (0.0%) | 0 (0.0%) |
| Total | 0 (0.0%) | 4 (100.0%) |
Income in Selawik
Income Overview in Selawik
Per Capita Income in Selawik is $14,015, while median incomes of families and households are $54,583 and $52,917 respectively.
| Characteristic | Number | Measure |
| Per Capita Income | 557 | $14,015 |
| Median Family Income | 107 | $54,583 |
| Mean Family Income | 107 | $66,557 |
| Median Household Income | 120 | $52,917 |
| Mean Household Income | 120 | $66,219 |
| Income Deficit | 107 | $0 |
| Wage / Income Gap (%) | 557 | 43.92% |
| Wage / Income Gap ($) | 557 | 56.08¢ per $1 |
| Gini / Inequality Index | 557 | 0.41 |
Earnings by Sex in Selawik
Average Earnings in Selawik are $28,068, $25,938 for men and $46,250 for women, a difference of 43.9%.
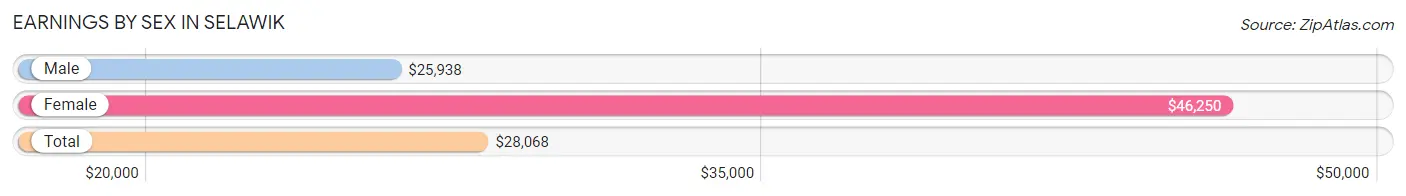
| Sex | Number | Average Earnings |
| Male | 107 (72.8%) | $25,938 |
| Female | 40 (27.2%) | $46,250 |
| Total | 147 (100.0%) | $28,068 |
Earnings by Sex by Income Bracket in Selawik
The most common earnings brackets in Selawik are $2,499 or less for men (22 | 20.6%) and $65,000 to $74,999 for women (8 | 20.0%).
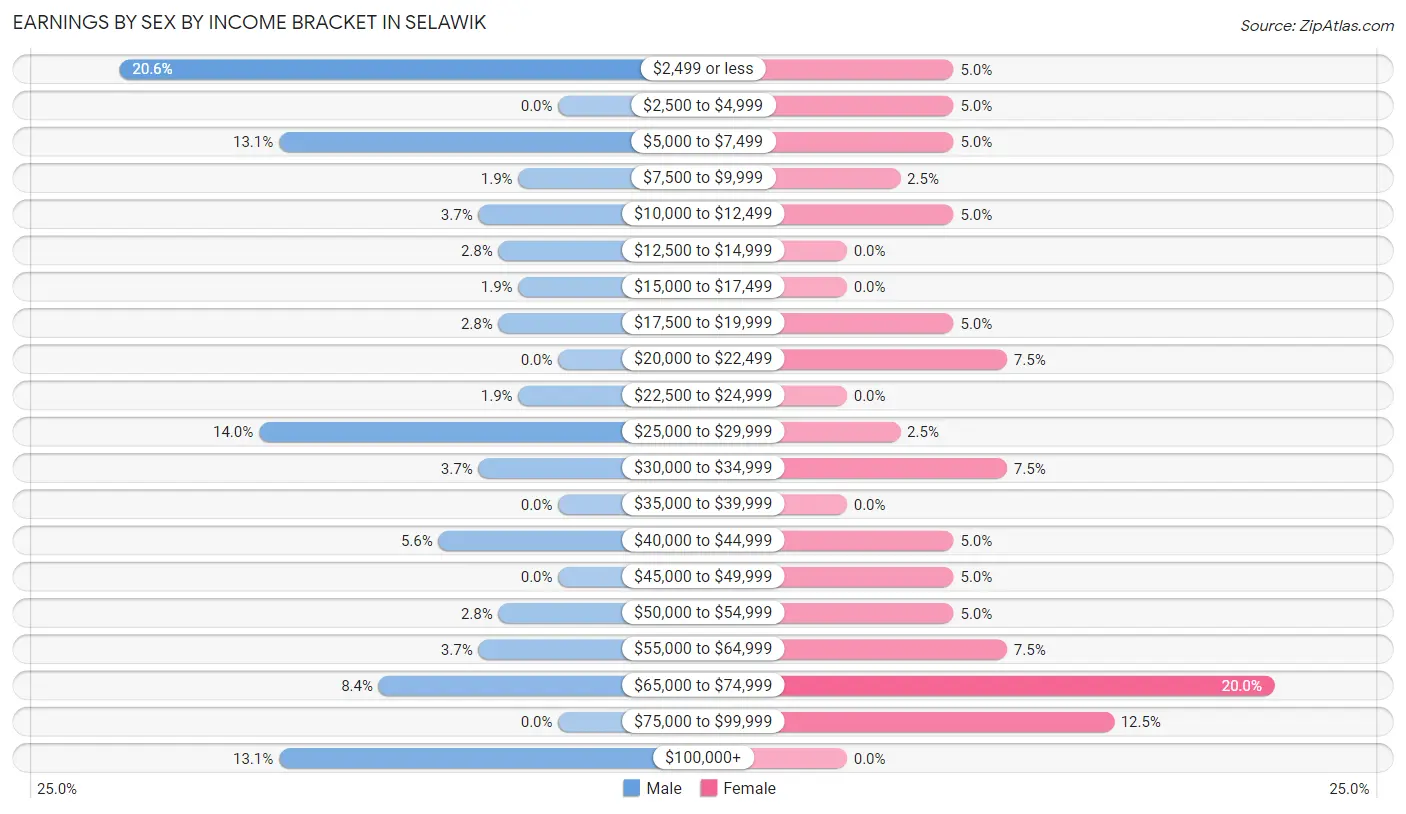
| Income | Male | Female |
| $2,499 or less | 22 (20.6%) | 2 (5.0%) |
| $2,500 to $4,999 | 0 (0.0%) | 2 (5.0%) |
| $5,000 to $7,499 | 14 (13.1%) | 2 (5.0%) |
| $7,500 to $9,999 | 2 (1.9%) | 1 (2.5%) |
| $10,000 to $12,499 | 4 (3.7%) | 2 (5.0%) |
| $12,500 to $14,999 | 3 (2.8%) | 0 (0.0%) |
| $15,000 to $17,499 | 2 (1.9%) | 0 (0.0%) |
| $17,500 to $19,999 | 3 (2.8%) | 2 (5.0%) |
| $20,000 to $22,499 | 0 (0.0%) | 3 (7.5%) |
| $22,500 to $24,999 | 2 (1.9%) | 0 (0.0%) |
| $25,000 to $29,999 | 15 (14.0%) | 1 (2.5%) |
| $30,000 to $34,999 | 4 (3.7%) | 3 (7.5%) |
| $35,000 to $39,999 | 0 (0.0%) | 0 (0.0%) |
| $40,000 to $44,999 | 6 (5.6%) | 2 (5.0%) |
| $45,000 to $49,999 | 0 (0.0%) | 2 (5.0%) |
| $50,000 to $54,999 | 3 (2.8%) | 2 (5.0%) |
| $55,000 to $64,999 | 4 (3.7%) | 3 (7.5%) |
| $65,000 to $74,999 | 9 (8.4%) | 8 (20.0%) |
| $75,000 to $99,999 | 0 (0.0%) | 5 (12.5%) |
| $100,000+ | 14 (13.1%) | 0 (0.0%) |
| Total | 107 (100.0%) | 40 (100.0%) |
Earnings by Sex by Educational Attainment in Selawik
Average earnings in Selawik are $28,409 for men and $43,750 for women, a difference of 35.1%. Men with an educational attainment of high school diploma enjoy the highest average annual earnings of $25,313, while those with less than high school education earn the least with $15,000. Women with an educational attainment of high school diploma earn the most with the average annual earnings of $33,333, while those with high school diploma education have the smallest earnings of $33,333.
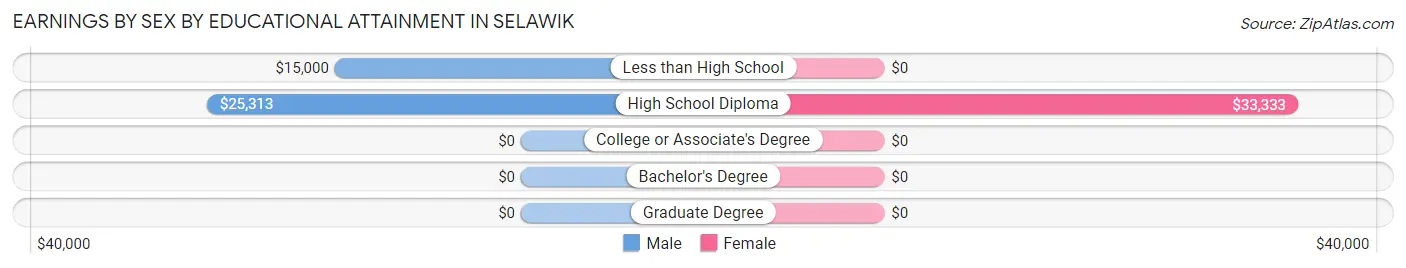
| Educational Attainment | Male Income | Female Income |
| Less than High School | $15,000 | $0 |
| High School Diploma | $25,313 | $33,333 |
| College or Associate's Degree | - | - |
| Bachelor's Degree | - | - |
| Graduate Degree | - | - |
| Total | $28,409 | $43,750 |
Family Income in Selawik
Family Income Brackets in Selawik
According to the Selawik family income data, there are 20 families falling into the $35,000 to $49,999 income range, which is the most common income bracket and makes up 18.7% of all families.
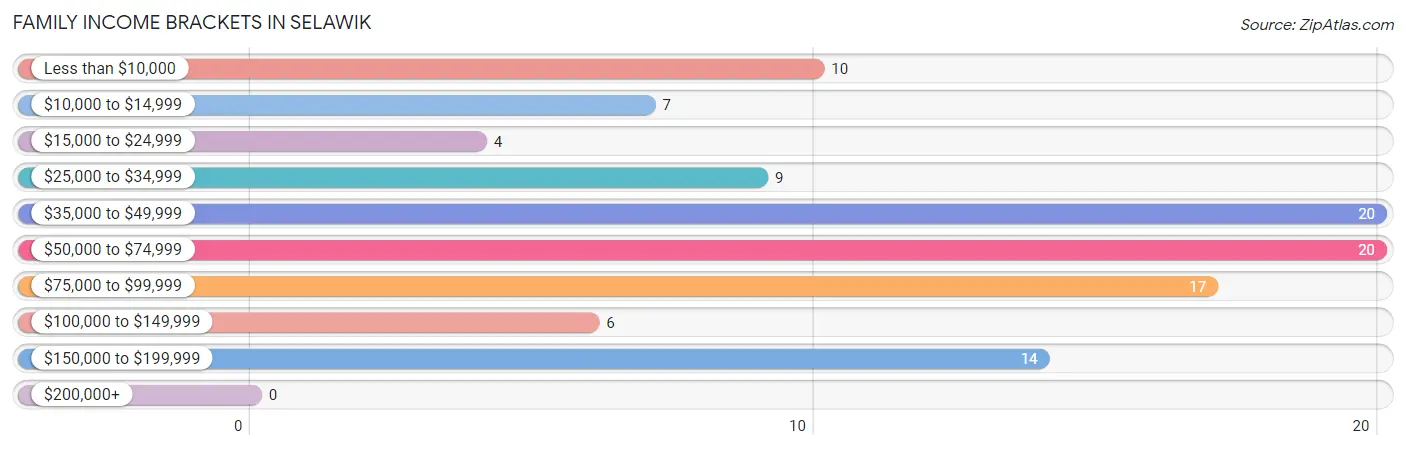
| Income Bracket | # Families | % Families |
| Less than $10,000 | 10 | 9.3% |
| $10,000 to $14,999 | 7 | 6.5% |
| $15,000 to $24,999 | 4 | 3.7% |
| $25,000 to $34,999 | 9 | 8.4% |
| $35,000 to $49,999 | 20 | 18.7% |
| $50,000 to $74,999 | 20 | 18.7% |
| $75,000 to $99,999 | 17 | 15.9% |
| $100,000 to $149,999 | 6 | 5.6% |
| $150,000 to $199,999 | 14 | 13.1% |
| $200,000+ | 0 | 0.0% |
Family Income by Famaliy Size in Selawik
5-person families (7 | 6.5%) account for the highest median family income in Selawik with $65,313 per family, while 2-person families (8 | 7.5%) have the highest median income of $18,750 per family member.
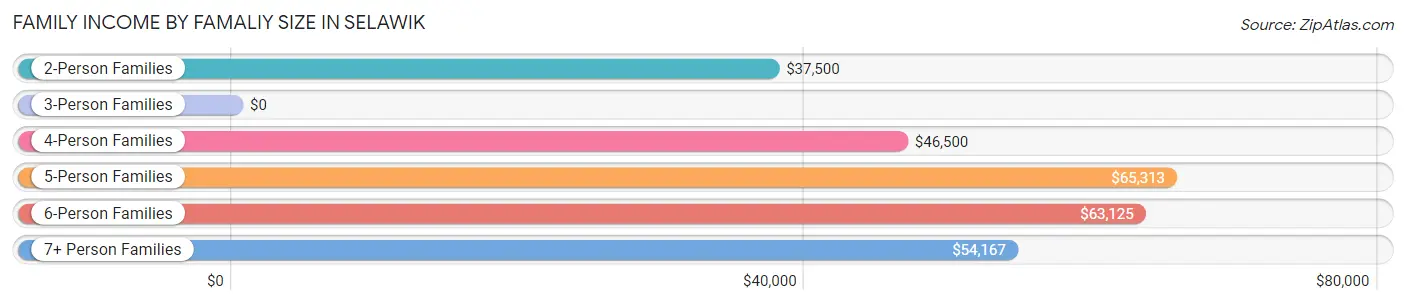
| Income Bracket | # Families | Median Income |
| 2-Person Families | 8 (7.5%) | $37,500 |
| 3-Person Families | 33 (30.8%) | $0 |
| 4-Person Families | 28 (26.2%) | $46,500 |
| 5-Person Families | 7 (6.5%) | $65,313 |
| 6-Person Families | 7 (6.5%) | $63,125 |
| 7+ Person Families | 24 (22.4%) | $54,167 |
| Total | 107 (100.0%) | $54,583 |
Family Income by Number of Earners in Selawik
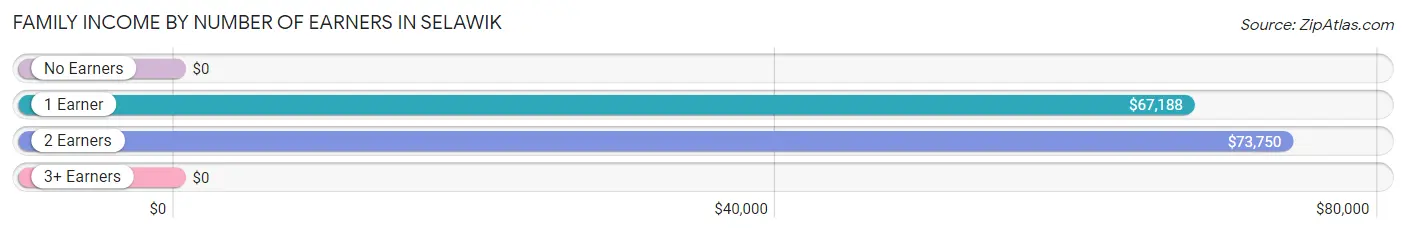
| Number of Earners | # Families | Median Income |
| No Earners | 25 (23.4%) | $0 |
| 1 Earner | 53 (49.5%) | $67,188 |
| 2 Earners | 22 (20.6%) | $73,750 |
| 3+ Earners | 7 (6.5%) | $0 |
| Total | 107 (100.0%) | $54,583 |
Household Income in Selawik
Household Income Brackets in Selawik
With 20 households falling in the category, the $35,000 to $49,999 income range is the most frequent in Selawik, accounting for 16.7% of all households.
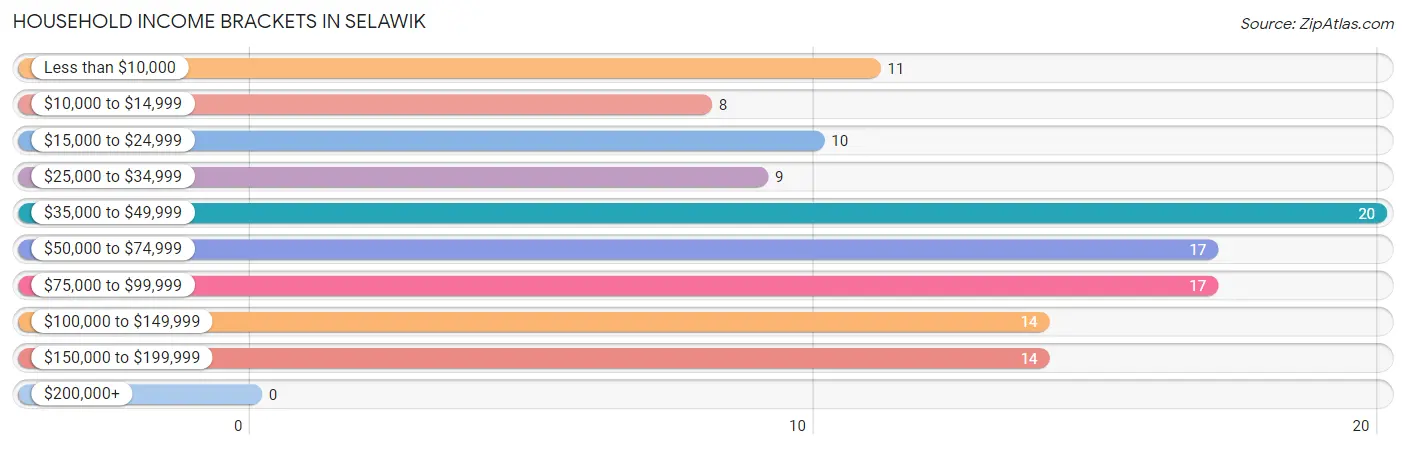
| Income Bracket | # Households | % Households |
| Less than $10,000 | 11 | 9.2% |
| $10,000 to $14,999 | 8 | 6.7% |
| $15,000 to $24,999 | 10 | 8.3% |
| $25,000 to $34,999 | 9 | 7.5% |
| $35,000 to $49,999 | 20 | 16.7% |
| $50,000 to $74,999 | 17 | 14.2% |
| $75,000 to $99,999 | 17 | 14.2% |
| $100,000 to $149,999 | 14 | 11.7% |
| $150,000 to $199,999 | 14 | 11.7% |
| $200,000+ | 0 | 0.0% |
Household Income by Householder Age in Selawik
The median household income in Selawik is $52,917, with the highest median household income of $65,313 found in the 25 to 44 years age bracket for the primary householder. A total of 45 households (37.5%) fall into this category. Meanwhile, the 15 to 24 years age bracket for the primary householder has the lowest median household income of $33,750, with 4 households (3.3%) in this group.
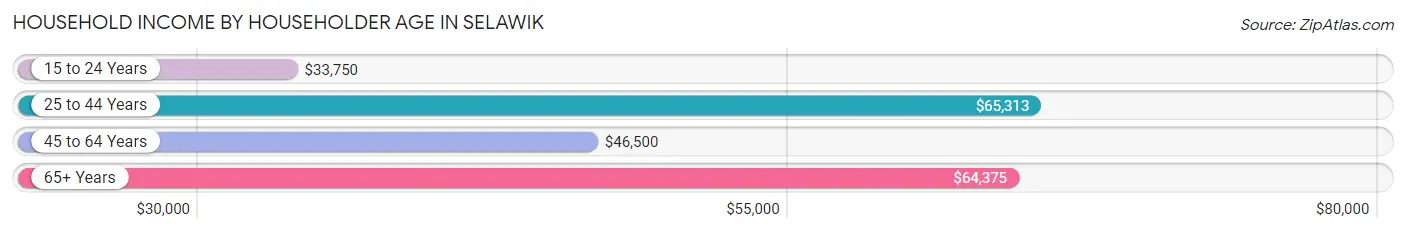
| Income Bracket | # Households | Median Income |
| 15 to 24 Years | 4 (3.3%) | $33,750 |
| 25 to 44 Years | 45 (37.5%) | $65,313 |
| 45 to 64 Years | 48 (40.0%) | $46,500 |
| 65+ Years | 23 (19.2%) | $64,375 |
| Total | 120 (100.0%) | $52,917 |
Poverty in Selawik
Income Below Poverty by Sex and Age in Selawik
With 37.0% poverty level for males and 48.1% for females among the residents of Selawik, 25 to 34 year old males and 5 year old females are the most vulnerable to poverty, with 22 males (61.1%) and 3 females (100.0%) in their respective age groups living below the poverty level.
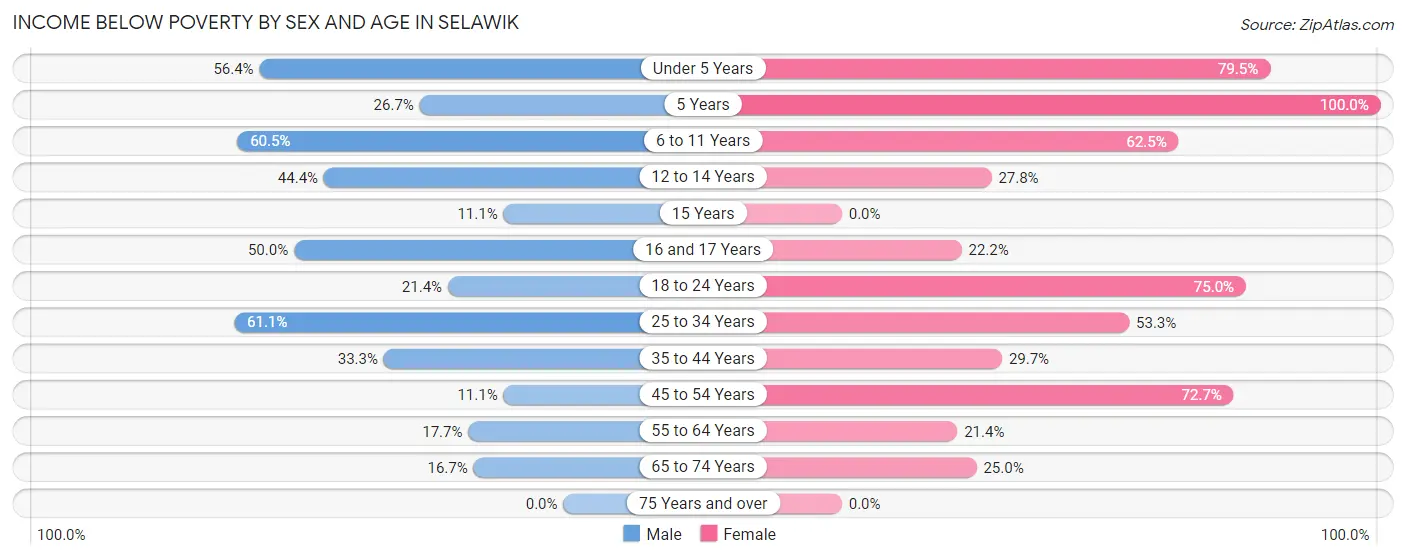
| Age Bracket | Male | Female |
| Under 5 Years | 22 (56.4%) | 31 (79.5%) |
| 5 Years | 4 (26.7%) | 3 (100.0%) |
| 6 to 11 Years | 23 (60.5%) | 25 (62.5%) |
| 12 to 14 Years | 8 (44.4%) | 5 (27.8%) |
| 15 Years | 2 (11.1%) | 0 (0.0%) |
| 16 and 17 Years | 4 (50.0%) | 2 (22.2%) |
| 18 to 24 Years | 6 (21.4%) | 12 (75.0%) |
| 25 to 34 Years | 22 (61.1%) | 8 (53.3%) |
| 35 to 44 Years | 17 (33.3%) | 11 (29.7%) |
| 45 to 54 Years | 2 (11.1%) | 8 (72.7%) |
| 55 to 64 Years | 6 (17.6%) | 6 (21.4%) |
| 65 to 74 Years | 1 (16.7%) | 2 (25.0%) |
| 75 Years and over | 0 (0.0%) | 0 (0.0%) |
| Total | 117 (37.0%) | 113 (48.1%) |
Income Above Poverty by Sex and Age in Selawik
According to the poverty statistics in Selawik, males aged 75 years and over and females aged 75 years and over are the age groups that are most secure financially, with 100.0% of males and 100.0% of females in these age groups living above the poverty line.
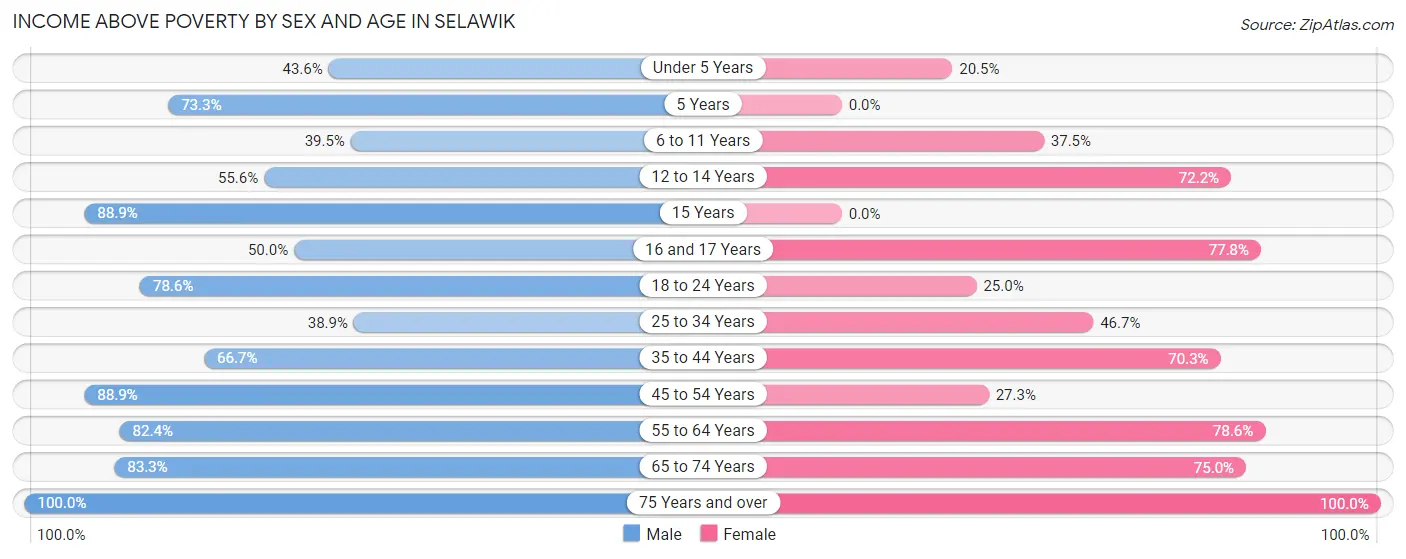
| Age Bracket | Male | Female |
| Under 5 Years | 17 (43.6%) | 8 (20.5%) |
| 5 Years | 11 (73.3%) | 0 (0.0%) |
| 6 to 11 Years | 15 (39.5%) | 15 (37.5%) |
| 12 to 14 Years | 10 (55.6%) | 13 (72.2%) |
| 15 Years | 16 (88.9%) | 0 (0.0%) |
| 16 and 17 Years | 4 (50.0%) | 7 (77.8%) |
| 18 to 24 Years | 22 (78.6%) | 4 (25.0%) |
| 25 to 34 Years | 14 (38.9%) | 7 (46.7%) |
| 35 to 44 Years | 34 (66.7%) | 26 (70.3%) |
| 45 to 54 Years | 16 (88.9%) | 3 (27.3%) |
| 55 to 64 Years | 28 (82.4%) | 22 (78.6%) |
| 65 to 74 Years | 5 (83.3%) | 6 (75.0%) |
| 75 Years and over | 7 (100.0%) | 11 (100.0%) |
| Total | 199 (63.0%) | 122 (51.9%) |
Income Below Poverty Among Married-Couple Families in Selawik
The poverty statistics for married-couple families in Selawik show that 22.8% or 13 of the total 57 families live below the poverty line. Families with 5 or more children have the highest poverty rate of 75.0%, comprising of 6 families. On the other hand, families with no children have the lowest poverty rate of 0.0%, which includes 0 families.
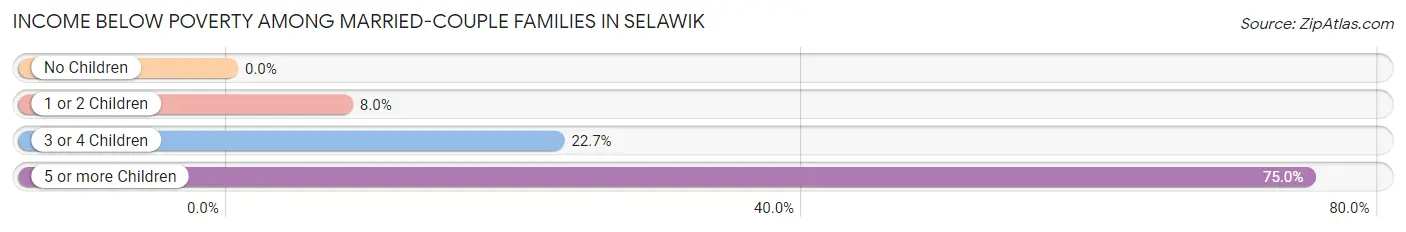
| Children | Above Poverty | Below Poverty |
| No Children | 2 (100.0%) | 0 (0.0%) |
| 1 or 2 Children | 23 (92.0%) | 2 (8.0%) |
| 3 or 4 Children | 17 (77.3%) | 5 (22.7%) |
| 5 or more Children | 2 (25.0%) | 6 (75.0%) |
| Total | 44 (77.2%) | 13 (22.8%) |
Income Below Poverty Among Single-Parent Households in Selawik
According to the poverty data in Selawik, 55.6% or 5 single-father households and 36.6% or 15 single-mother households are living below the poverty line. Among single-father households, those with 3 or 4 children have the highest poverty rate, with 5 households (71.4%) experiencing poverty. Likewise, among single-mother households, those with 5 or more children have the highest poverty rate, with 2 households (100.0%) falling below the poverty line.
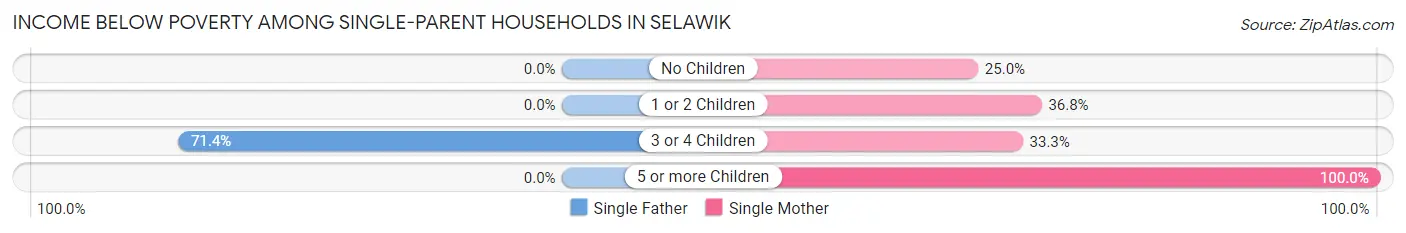
| Children | Single Father | Single Mother |
| No Children | 0 (0.0%) | 2 (25.0%) |
| 1 or 2 Children | 0 (0.0%) | 7 (36.8%) |
| 3 or 4 Children | 5 (71.4%) | 4 (33.3%) |
| 5 or more Children | 0 (0.0%) | 2 (100.0%) |
| Total | 5 (55.6%) | 15 (36.6%) |
Income Below Poverty Among Married-Couple vs Single-Parent Households in Selawik
The poverty data for Selawik shows that 13 of the married-couple family households (22.8%) and 20 of the single-parent households (40.0%) are living below the poverty level. Within the married-couple family households, those with 5 or more children have the highest poverty rate, with 6 households (75.0%) falling below the poverty line. Among the single-parent households, those with 5 or more children have the highest poverty rate, with 2 household (100.0%) living below poverty.
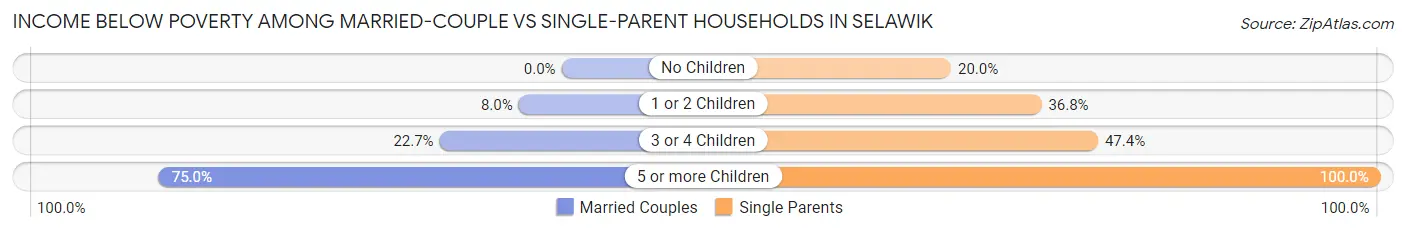
| Children | Married-Couple Families | Single-Parent Households |
| No Children | 0 (0.0%) | 2 (20.0%) |
| 1 or 2 Children | 2 (8.0%) | 7 (36.8%) |
| 3 or 4 Children | 5 (22.7%) | 9 (47.4%) |
| 5 or more Children | 6 (75.0%) | 2 (100.0%) |
| Total | 13 (22.8%) | 20 (40.0%) |
Employment Characteristics in Selawik
Employment by Class of Employer in Selawik
Among the 79 employed individuals in Selawik, not-for-profit organizations (35 | 44.3%), local government employees (18 | 22.8%), and private company employees (16 | 20.3%) make up the most common classes of employment.
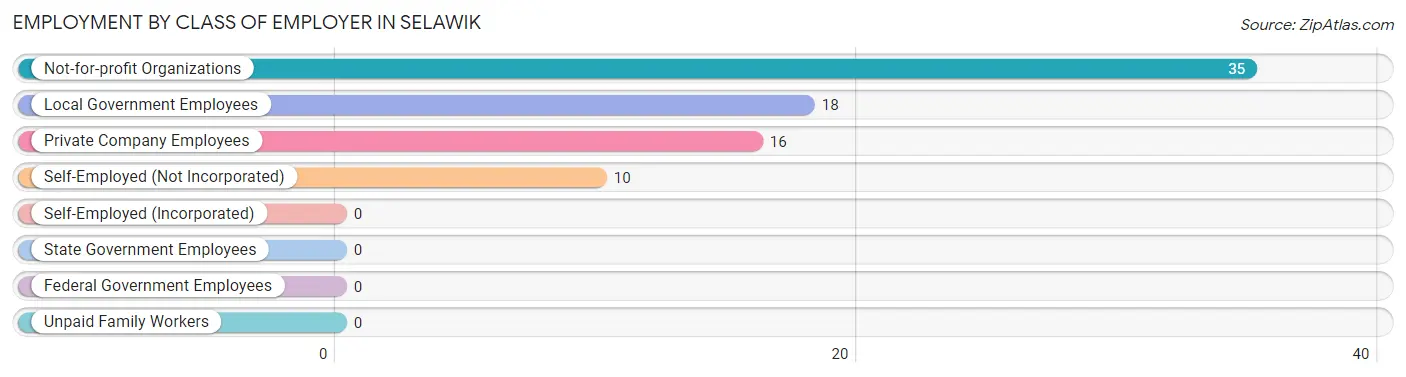
| Employer Class | # Employees | % Employees |
| Private Company Employees | 16 | 20.3% |
| Self-Employed (Incorporated) | 0 | 0.0% |
| Self-Employed (Not Incorporated) | 10 | 12.7% |
| Not-for-profit Organizations | 35 | 44.3% |
| Local Government Employees | 18 | 22.8% |
| State Government Employees | 0 | 0.0% |
| Federal Government Employees | 0 | 0.0% |
| Unpaid Family Workers | 0 | 0.0% |
| Total | 79 | 100.0% |
Employment Status by Age in Selawik
According to the labor force statistics for Selawik, out of the total population over 16 years of age (323), 42.1% or 136 individuals are in the labor force, with 33.1% or 45 of them unemployed. The age group with the highest labor force participation rate is 55 to 59 years, with 71.4% or 5 individuals in the labor force. Within the labor force, the 16 to 19 years age range has the highest percentage of unemployed individuals, with 100.0% or 6 of them being unemployed.
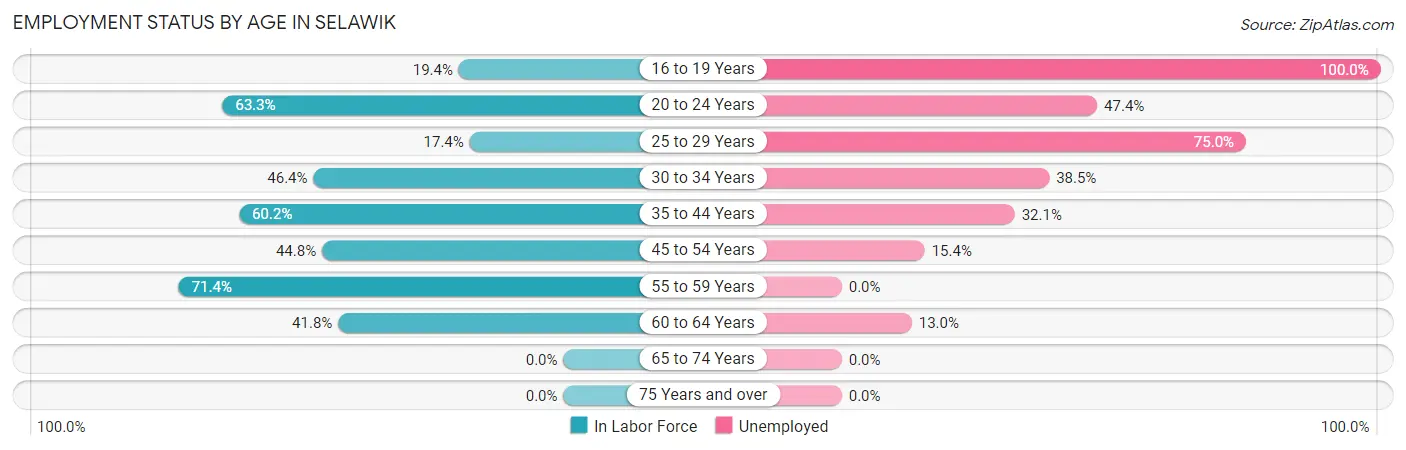
| Age Bracket | In Labor Force | Unemployed |
| 16 to 19 Years | 6 (19.4%) | 6 (100.0%) |
| 20 to 24 Years | 19 (63.3%) | 9 (47.4%) |
| 25 to 29 Years | 4 (17.4%) | 3 (75.0%) |
| 30 to 34 Years | 13 (46.4%) | 5 (38.5%) |
| 35 to 44 Years | 53 (60.2%) | 17 (32.1%) |
| 45 to 54 Years | 13 (44.8%) | 2 (15.4%) |
| 55 to 59 Years | 5 (71.4%) | 0 (0.0%) |
| 60 to 64 Years | 23 (41.8%) | 3 (13.0%) |
| 65 to 74 Years | 0 (0.0%) | 0 (0.0%) |
| 75 Years and over | 0 (0.0%) | 0 (0.0%) |
| Total | 136 (42.1%) | 45 (33.1%) |
Employment Status by Educational Attainment in Selawik
According to labor force statistics for Selawik, 48.3% of individuals (111) out of the total population between 25 and 64 years of age (230) are in the labor force, with 27.0% or 30 of them being unemployed. The group with the highest labor force participation rate are those with the educational attainment of bachelor's degree or higher, with 100.0% or 21 individuals in the labor force. Within the labor force, individuals with less than high school education have the highest percentage of unemployment, with 38.5% or 10 of them being unemployed.
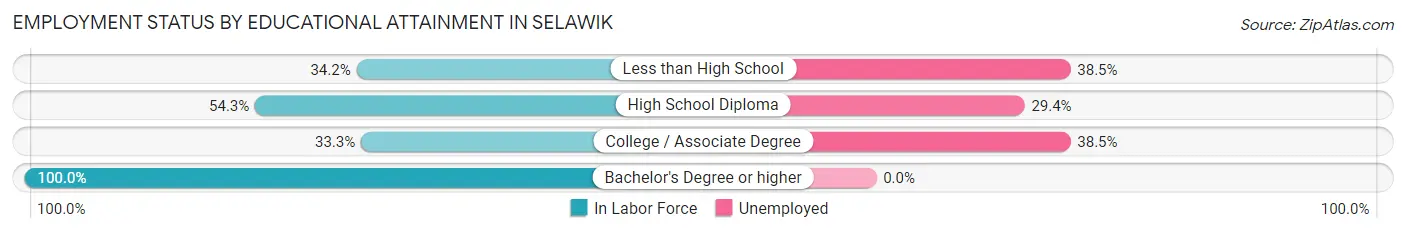
| Educational Attainment | In Labor Force | Unemployed |
| Less than High School | 26 (34.2%) | 29 (38.5%) |
| High School Diploma | 51 (54.3%) | 28 (29.4%) |
| College / Associate Degree | 13 (33.3%) | 15 (38.5%) |
| Bachelor's Degree or higher | 21 (100.0%) | 0 (0.0%) |
| Total | 111 (48.3%) | 62 (27.0%) |
Employment Occupations by Sex in Selawik
Management, Business, Science and Arts Occupations
The most common Management, Business, Science and Arts occupations in Selawik are Health Diagnosing & Treating (16 | 17.6%), Health Technologists (16 | 17.6%), Community & Social Service (10 | 11.0%), Education, Arts & Media (6 | 6.6%), and Management (5 | 5.5%).
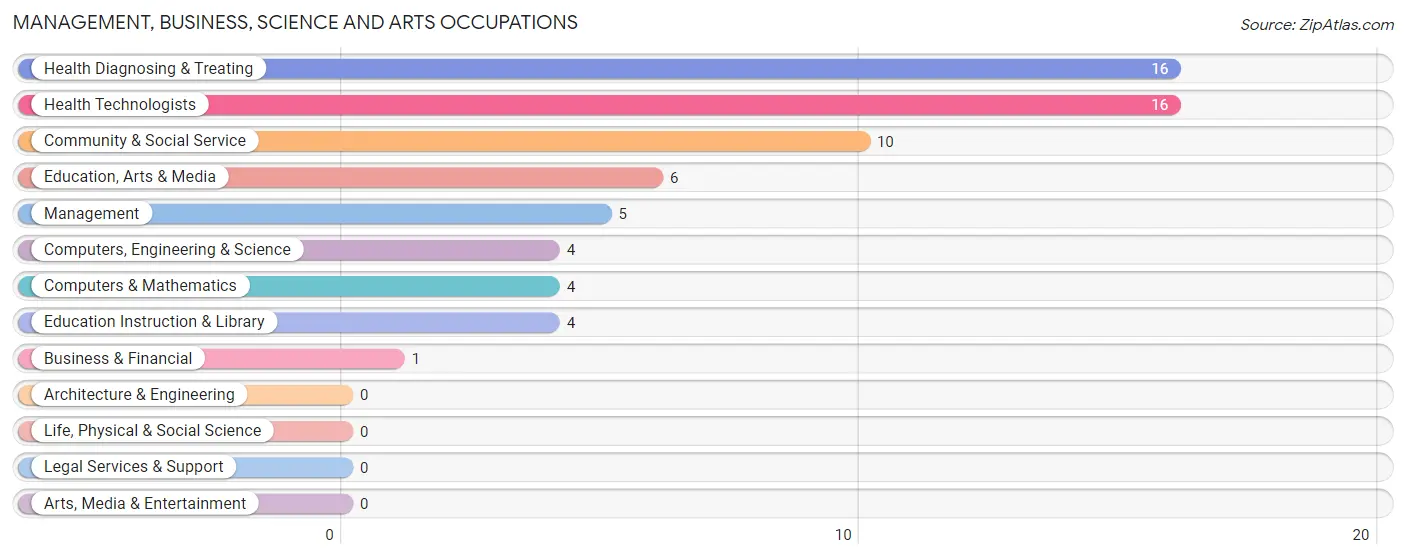
Management, Business, Science and Arts Occupations by Sex
Within the Management, Business, Science and Arts occupations in Selawik, the most male-oriented occupations are Computers, Engineering & Science (100.0%), Computers & Mathematics (100.0%), and Health Diagnosing & Treating (100.0%), while the most female-oriented occupations are Business & Financial (100.0%), Education Instruction & Library (100.0%), and Community & Social Service (70.0%).
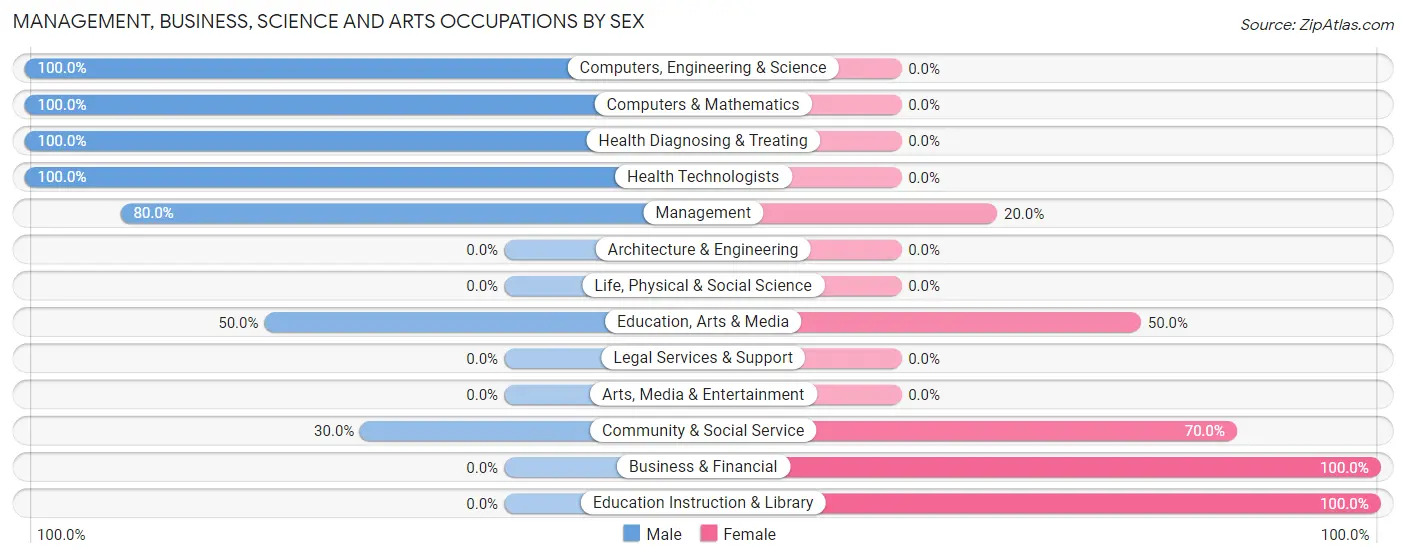
| Occupation | Male | Female |
| Management | 4 (80.0%) | 1 (20.0%) |
| Business & Financial | 0 (0.0%) | 1 (100.0%) |
| Computers, Engineering & Science | 4 (100.0%) | 0 (0.0%) |
| Computers & Mathematics | 4 (100.0%) | 0 (0.0%) |
| Architecture & Engineering | 0 (0.0%) | 0 (0.0%) |
| Life, Physical & Social Science | 0 (0.0%) | 0 (0.0%) |
| Community & Social Service | 3 (30.0%) | 7 (70.0%) |
| Education, Arts & Media | 3 (50.0%) | 3 (50.0%) |
| Legal Services & Support | 0 (0.0%) | 0 (0.0%) |
| Education Instruction & Library | 0 (0.0%) | 4 (100.0%) |
| Arts, Media & Entertainment | 0 (0.0%) | 0 (0.0%) |
| Health Diagnosing & Treating | 16 (100.0%) | 0 (0.0%) |
| Health Technologists | 16 (100.0%) | 0 (0.0%) |
| Total (Category) | 27 (75.0%) | 9 (25.0%) |
| Total (Overall) | 55 (60.4%) | 36 (39.6%) |
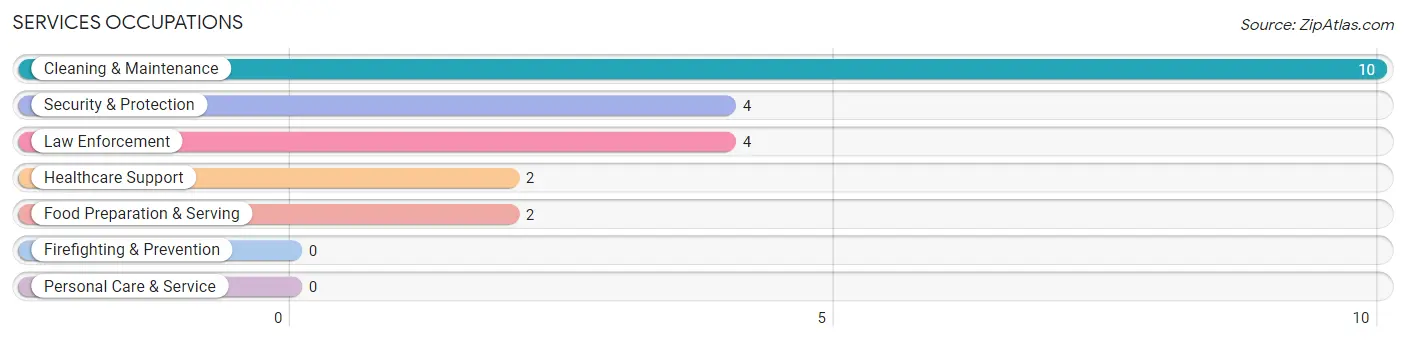
Services Occupations
The most common Services occupations in Selawik are Cleaning & Maintenance (10 | 11.0%), Security & Protection (4 | 4.4%), Law Enforcement (4 | 4.4%), Healthcare Support (2 | 2.2%), and Food Preparation & Serving (2 | 2.2%).
Services Occupations by Sex
Within the Services occupations in Selawik, the most male-oriented occupations are Security & Protection (100.0%), and Law Enforcement (100.0%), while the most female-oriented occupations are Healthcare Support (100.0%), Food Preparation & Serving (100.0%), and Cleaning & Maintenance (100.0%).
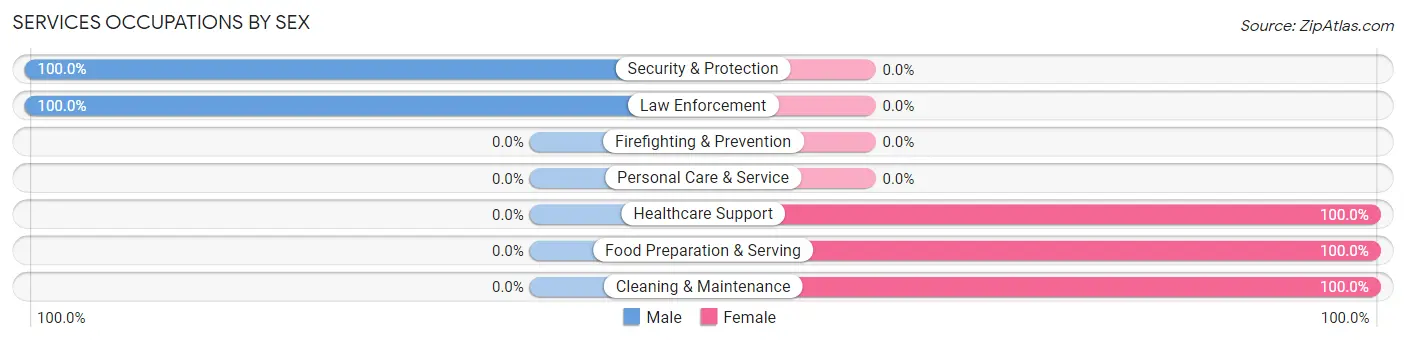
| Occupation | Male | Female |
| Healthcare Support | 0 (0.0%) | 2 (100.0%) |
| Security & Protection | 4 (100.0%) | 0 (0.0%) |
| Firefighting & Prevention | 0 (0.0%) | 0 (0.0%) |
| Law Enforcement | 4 (100.0%) | 0 (0.0%) |
| Food Preparation & Serving | 0 (0.0%) | 2 (100.0%) |
| Cleaning & Maintenance | 0 (0.0%) | 10 (100.0%) |
| Personal Care & Service | 0 (0.0%) | 0 (0.0%) |
| Total (Category) | 4 (22.2%) | 14 (77.8%) |
| Total (Overall) | 55 (60.4%) | 36 (39.6%) |
Sales and Office Occupations
The most common Sales and Office occupations in Selawik are Sales & Related (12 | 13.2%), and Office & Administration (5 | 5.5%).
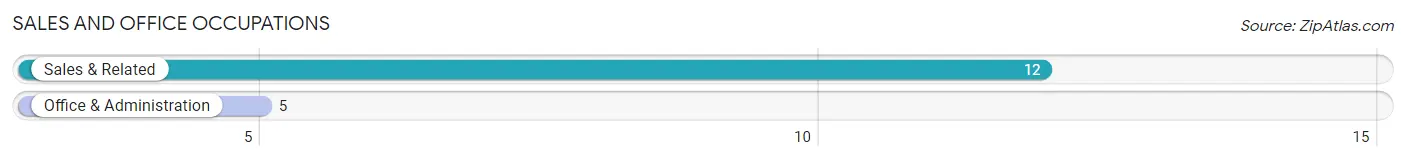
Sales and Office Occupations by Sex
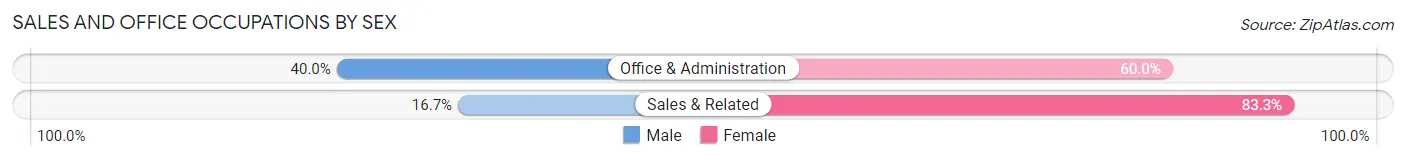
| Occupation | Male | Female |
| Sales & Related | 2 (16.7%) | 10 (83.3%) |
| Office & Administration | 2 (40.0%) | 3 (60.0%) |
| Total (Category) | 4 (23.5%) | 13 (76.5%) |
| Total (Overall) | 55 (60.4%) | 36 (39.6%) |
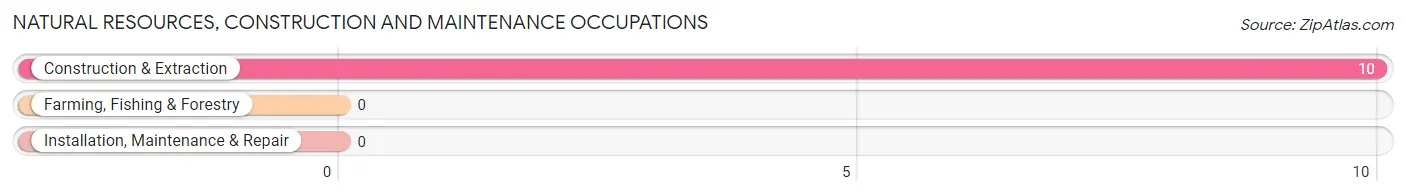
Natural Resources, Construction and Maintenance Occupations
The most common Natural Resources, Construction and Maintenance occupations in Selawik are , and Construction & Extraction (10 | 11.0%).
Natural Resources, Construction and Maintenance Occupations by Sex
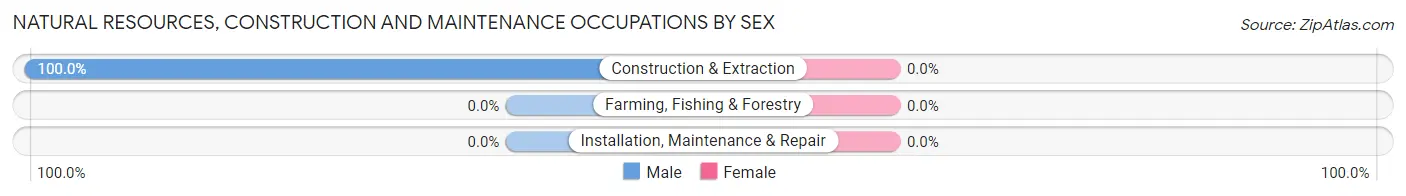
| Occupation | Male | Female |
| Farming, Fishing & Forestry | 0 (0.0%) | 0 (0.0%) |
| Construction & Extraction | 10 (100.0%) | 0 (0.0%) |
| Installation, Maintenance & Repair | 0 (0.0%) | 0 (0.0%) |
| Total (Category) | 10 (100.0%) | 0 (0.0%) |
| Total (Overall) | 55 (60.4%) | 36 (39.6%) |
Production, Transportation and Moving Occupations
The most common Production, Transportation and Moving occupations in Selawik are Material Moving (6 | 6.6%), Transportation (3 | 3.3%), and Production (1 | 1.1%).
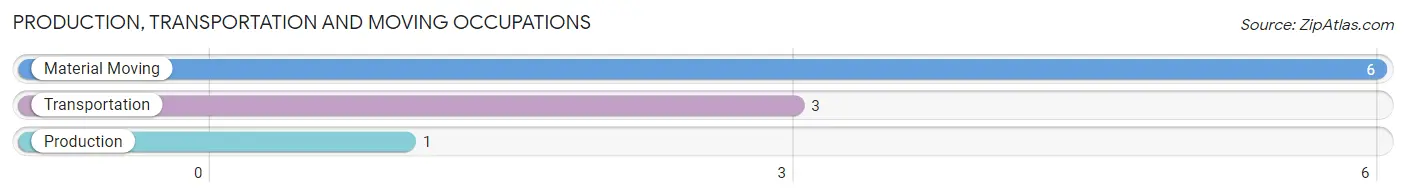
Production, Transportation and Moving Occupations by Sex
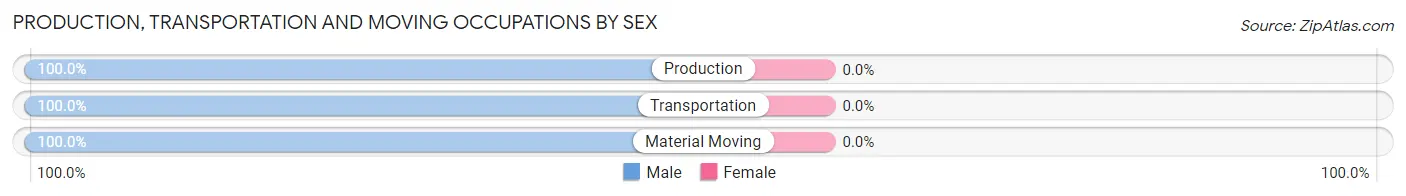
| Occupation | Male | Female |
| Production | 1 (100.0%) | 0 (0.0%) |
| Transportation | 3 (100.0%) | 0 (0.0%) |
| Material Moving | 6 (100.0%) | 0 (0.0%) |
| Total (Category) | 10 (100.0%) | 0 (0.0%) |
| Total (Overall) | 55 (60.4%) | 36 (39.6%) |
Employment Industries by Sex in Selawik
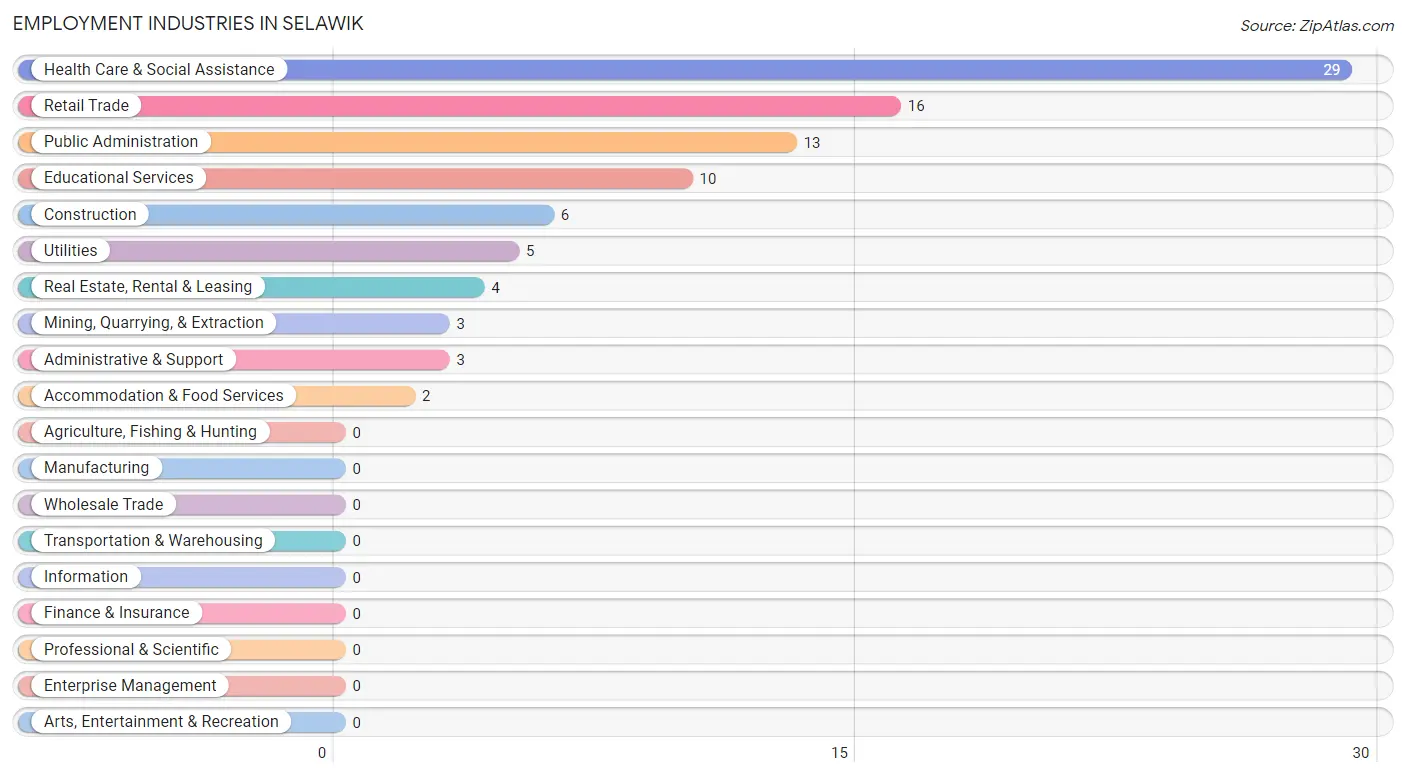
Employment Industries in Selawik
The major employment industries in Selawik include Health Care & Social Assistance (29 | 31.9%), Retail Trade (16 | 17.6%), Public Administration (13 | 14.3%), Educational Services (10 | 11.0%), and Construction (6 | 6.6%).
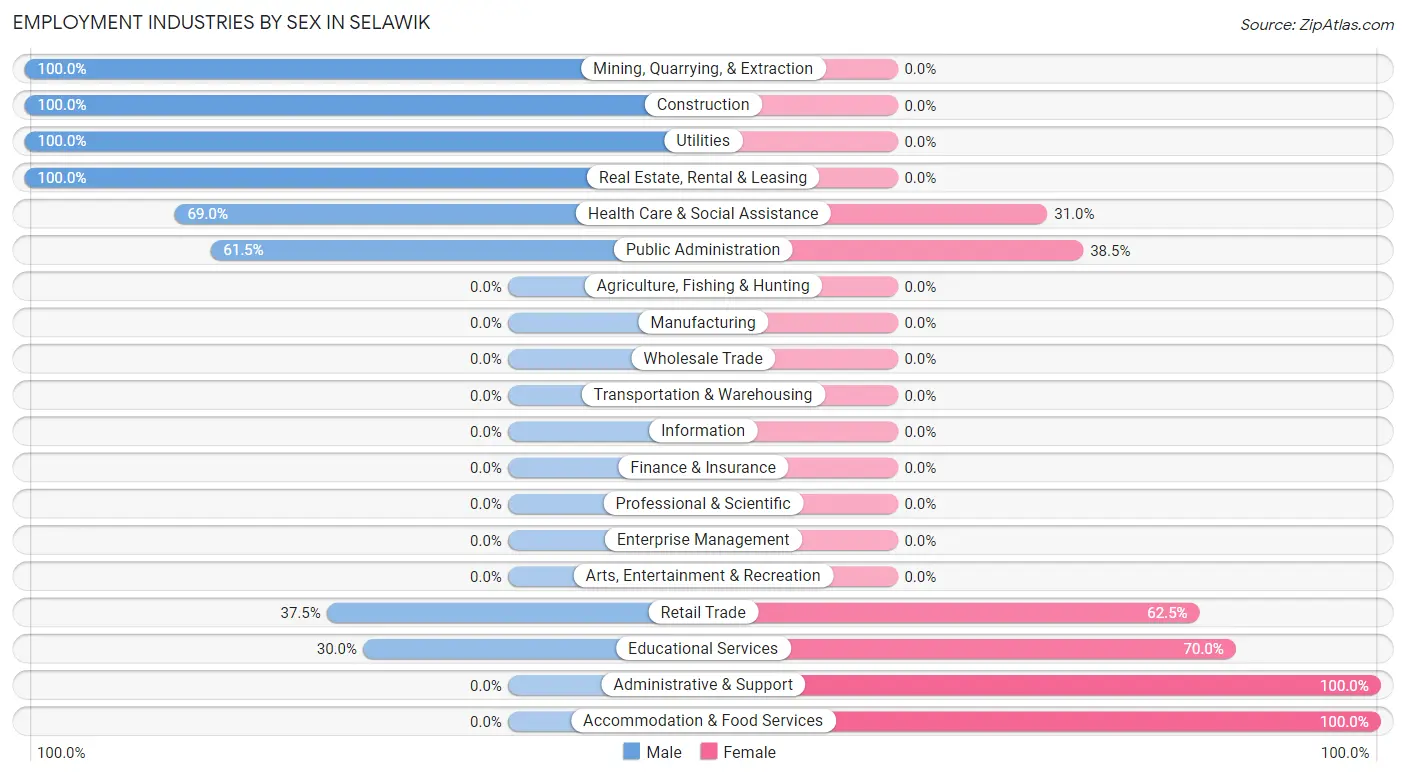
Employment Industries by Sex in Selawik
The Selawik industries that see more men than women are Mining, Quarrying, & Extraction (100.0%), Construction (100.0%), and Utilities (100.0%), whereas the industries that tend to have a higher number of women are Administrative & Support (100.0%), Accommodation & Food Services (100.0%), and Educational Services (70.0%).
| Industry | Male | Female |
| Agriculture, Fishing & Hunting | 0 (0.0%) | 0 (0.0%) |
| Mining, Quarrying, & Extraction | 3 (100.0%) | 0 (0.0%) |
| Construction | 6 (100.0%) | 0 (0.0%) |
| Manufacturing | 0 (0.0%) | 0 (0.0%) |
| Wholesale Trade | 0 (0.0%) | 0 (0.0%) |
| Retail Trade | 6 (37.5%) | 10 (62.5%) |
| Transportation & Warehousing | 0 (0.0%) | 0 (0.0%) |
| Utilities | 5 (100.0%) | 0 (0.0%) |
| Information | 0 (0.0%) | 0 (0.0%) |
| Finance & Insurance | 0 (0.0%) | 0 (0.0%) |
| Real Estate, Rental & Leasing | 4 (100.0%) | 0 (0.0%) |
| Professional & Scientific | 0 (0.0%) | 0 (0.0%) |
| Enterprise Management | 0 (0.0%) | 0 (0.0%) |
| Administrative & Support | 0 (0.0%) | 3 (100.0%) |
| Educational Services | 3 (30.0%) | 7 (70.0%) |
| Health Care & Social Assistance | 20 (69.0%) | 9 (31.0%) |
| Arts, Entertainment & Recreation | 0 (0.0%) | 0 (0.0%) |
| Accommodation & Food Services | 0 (0.0%) | 2 (100.0%) |
| Public Administration | 8 (61.5%) | 5 (38.5%) |
| Total | 55 (60.4%) | 36 (39.6%) |
Education in Selawik
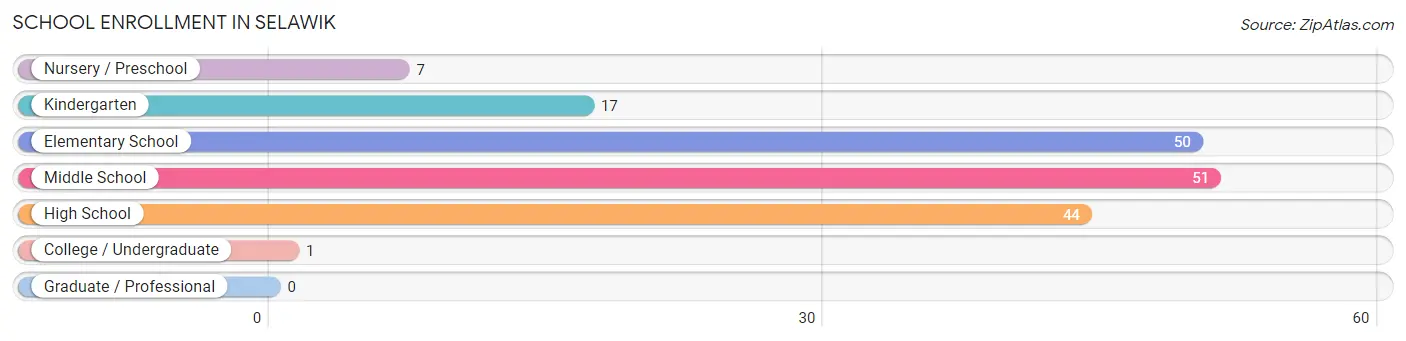
School Enrollment in Selawik
The most common levels of schooling among the 170 students in Selawik are middle school (51 | 30.0%), elementary school (50 | 29.4%), and high school (44 | 25.9%).
| School Level | # Students | % Students |
| Nursery / Preschool | 7 | 4.1% |
| Kindergarten | 17 | 10.0% |
| Elementary School | 50 | 29.4% |
| Middle School | 51 | 30.0% |
| High School | 44 | 25.9% |
| College / Undergraduate | 1 | 0.6% |
| Graduate / Professional | 0 | 0.0% |
| Total | 170 | 100.0% |
School Enrollment by Age by Funding Source in Selawik
Out of a total of 170 students who are enrolled in schools in Selawik, 14 (8.2%) attend a private institution, while the remaining 156 (91.8%) are enrolled in public schools. The age group of 3 to 4 year olds has the highest likelihood of being enrolled in private schools, with 4 (57.1% in the age bracket) enrolled. Conversely, the age group of 5 to 9 year old has the lowest likelihood of being enrolled in a private school, with 67 (100.0% in the age bracket) attending a public institution.
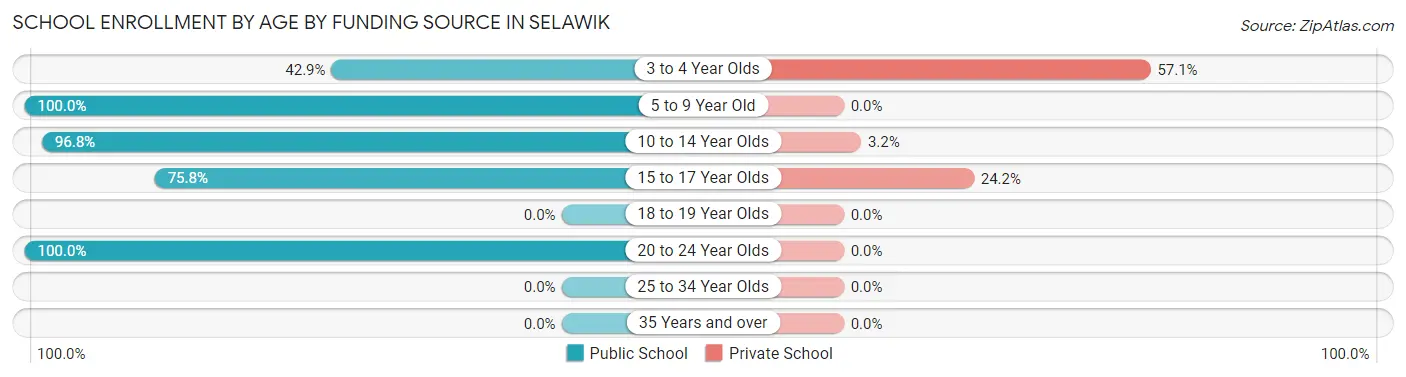
| Age Bracket | Public School | Private School |
| 3 to 4 Year Olds | 3 (42.9%) | 4 (57.1%) |
| 5 to 9 Year Old | 67 (100.0%) | 0 (0.0%) |
| 10 to 14 Year Olds | 60 (96.8%) | 2 (3.2%) |
| 15 to 17 Year Olds | 25 (75.8%) | 8 (24.2%) |
| 18 to 19 Year Olds | 0 (0.0%) | 0 (0.0%) |
| 20 to 24 Year Olds | 1 (100.0%) | 0 (0.0%) |
| 25 to 34 Year Olds | 0 (0.0%) | 0 (0.0%) |
| 35 Years and over | 0 (0.0%) | 0 (0.0%) |
| Total | 156 (91.8%) | 14 (8.2%) |
Educational Attainment by Field of Study in Selawik
Liberal arts & history (16 | 76.2%), literature & languages (3 | 14.3%), and science & technology (2 | 9.5%) are the most common fields of study among 21 individuals in Selawik who have obtained a bachelor's degree or higher.
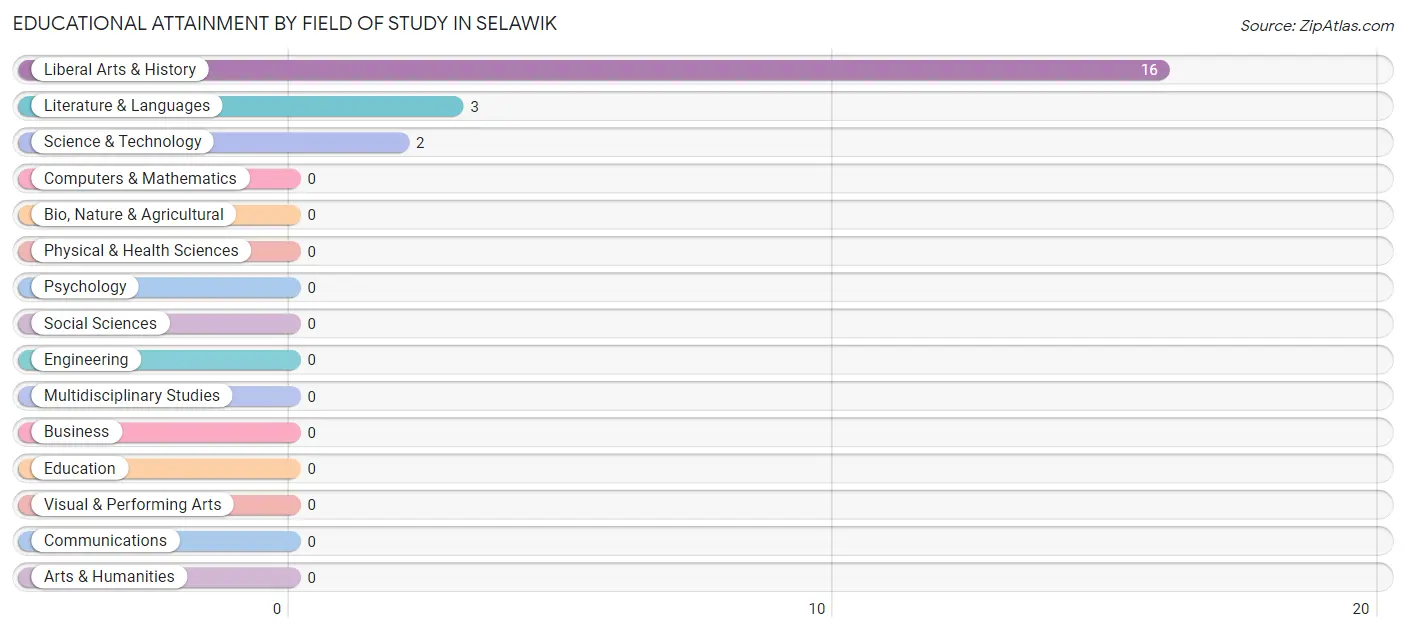
| Field of Study | # Graduates | % Graduates |
| Computers & Mathematics | 0 | 0.0% |
| Bio, Nature & Agricultural | 0 | 0.0% |
| Physical & Health Sciences | 0 | 0.0% |
| Psychology | 0 | 0.0% |
| Social Sciences | 0 | 0.0% |
| Engineering | 0 | 0.0% |
| Multidisciplinary Studies | 0 | 0.0% |
| Science & Technology | 2 | 9.5% |
| Business | 0 | 0.0% |
| Education | 0 | 0.0% |
| Literature & Languages | 3 | 14.3% |
| Liberal Arts & History | 16 | 76.2% |
| Visual & Performing Arts | 0 | 0.0% |
| Communications | 0 | 0.0% |
| Arts & Humanities | 0 | 0.0% |
| Total | 21 | 100.0% |
Transportation & Commute in Selawik
Vehicle Availability by Sex in Selawik
The most prevalent vehicle ownership categories in Selawik are males with no vehicle (52, accounting for 100.0%) and females with no vehicle (25, making up 192.6%).
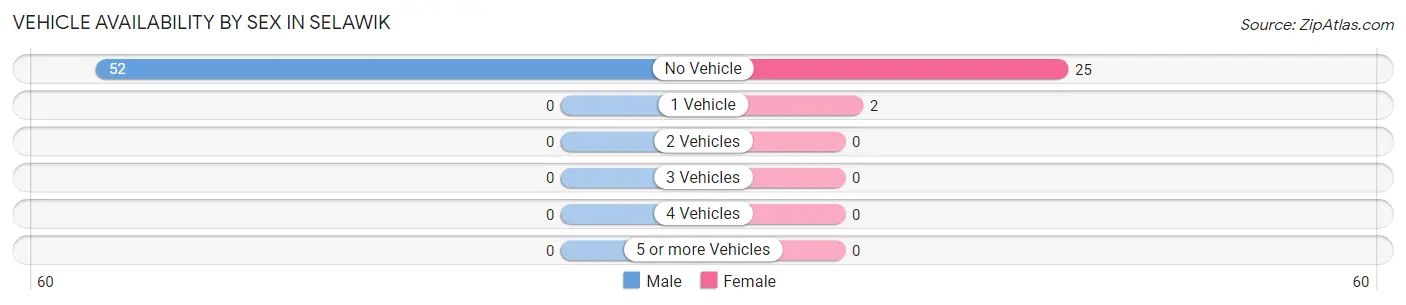
| Vehicles Available | Male | Female |
| No Vehicle | 52 (100.0%) | 25 (92.6%) |
| 1 Vehicle | 0 (0.0%) | 2 (7.4%) |
| 2 Vehicles | 0 (0.0%) | 0 (0.0%) |
| 3 Vehicles | 0 (0.0%) | 0 (0.0%) |
| 4 Vehicles | 0 (0.0%) | 0 (0.0%) |
| 5 or more Vehicles | 0 (0.0%) | 0 (0.0%) |
| Total | 52 (100.0%) | 27 (100.0%) |
Commute Time in Selawik
The most frequently occuring commute durations in Selawik are 5 to 9 minutes (28 commuters, 38.4%), less than 5 minutes (27 commuters, 37.0%), and 10 to 14 minutes (17 commuters, 23.3%).
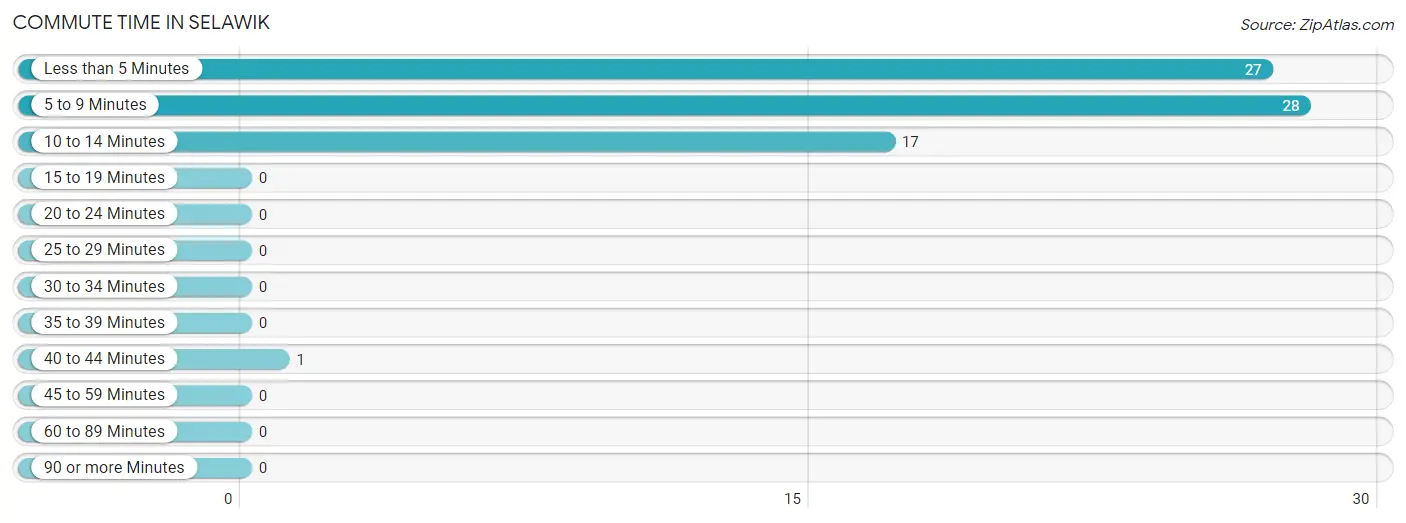
| Commute Time | # Commuters | % Commuters |
| Less than 5 Minutes | 27 | 37.0% |
| 5 to 9 Minutes | 28 | 38.4% |
| 10 to 14 Minutes | 17 | 23.3% |
| 15 to 19 Minutes | 0 | 0.0% |
| 20 to 24 Minutes | 0 | 0.0% |
| 25 to 29 Minutes | 0 | 0.0% |
| 30 to 34 Minutes | 0 | 0.0% |
| 35 to 39 Minutes | 0 | 0.0% |
| 40 to 44 Minutes | 1 | 1.4% |
| 45 to 59 Minutes | 0 | 0.0% |
| 60 to 89 Minutes | 0 | 0.0% |
| 90 or more Minutes | 0 | 0.0% |
Commute Time by Sex in Selawik
The most common commute times in Selawik are 5 to 9 minutes (20 commuters, 41.7%) for males and less than 5 minutes (9 commuters, 36.0%) for females.
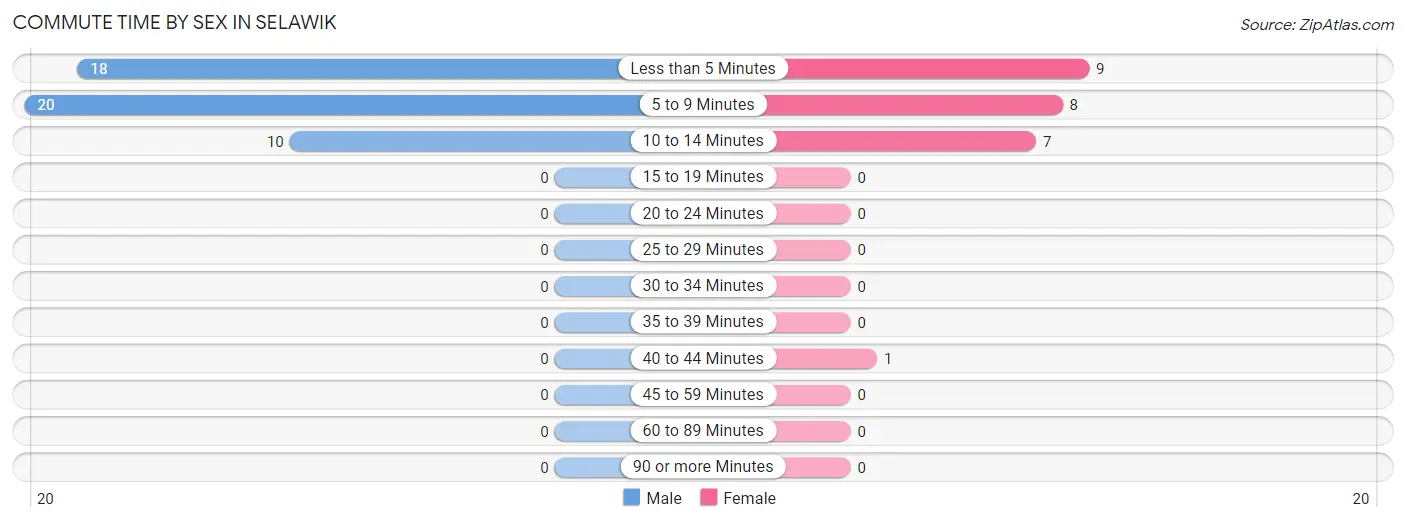
| Commute Time | Male | Female |
| Less than 5 Minutes | 18 (37.5%) | 9 (36.0%) |
| 5 to 9 Minutes | 20 (41.7%) | 8 (32.0%) |
| 10 to 14 Minutes | 10 (20.8%) | 7 (28.0%) |
| 15 to 19 Minutes | 0 (0.0%) | 0 (0.0%) |
| 20 to 24 Minutes | 0 (0.0%) | 0 (0.0%) |
| 25 to 29 Minutes | 0 (0.0%) | 0 (0.0%) |
| 30 to 34 Minutes | 0 (0.0%) | 0 (0.0%) |
| 35 to 39 Minutes | 0 (0.0%) | 0 (0.0%) |
| 40 to 44 Minutes | 0 (0.0%) | 1 (4.0%) |
| 45 to 59 Minutes | 0 (0.0%) | 0 (0.0%) |
| 60 to 89 Minutes | 0 (0.0%) | 0 (0.0%) |
| 90 or more Minutes | 0 (0.0%) | 0 (0.0%) |
Time of Departure to Work by Sex in Selawik
The most frequent times of departure to work in Selawik are 8:30 AM to 8:59 AM (18, 37.5%) for males and 8:30 AM to 8:59 AM (14, 56.0%) for females.
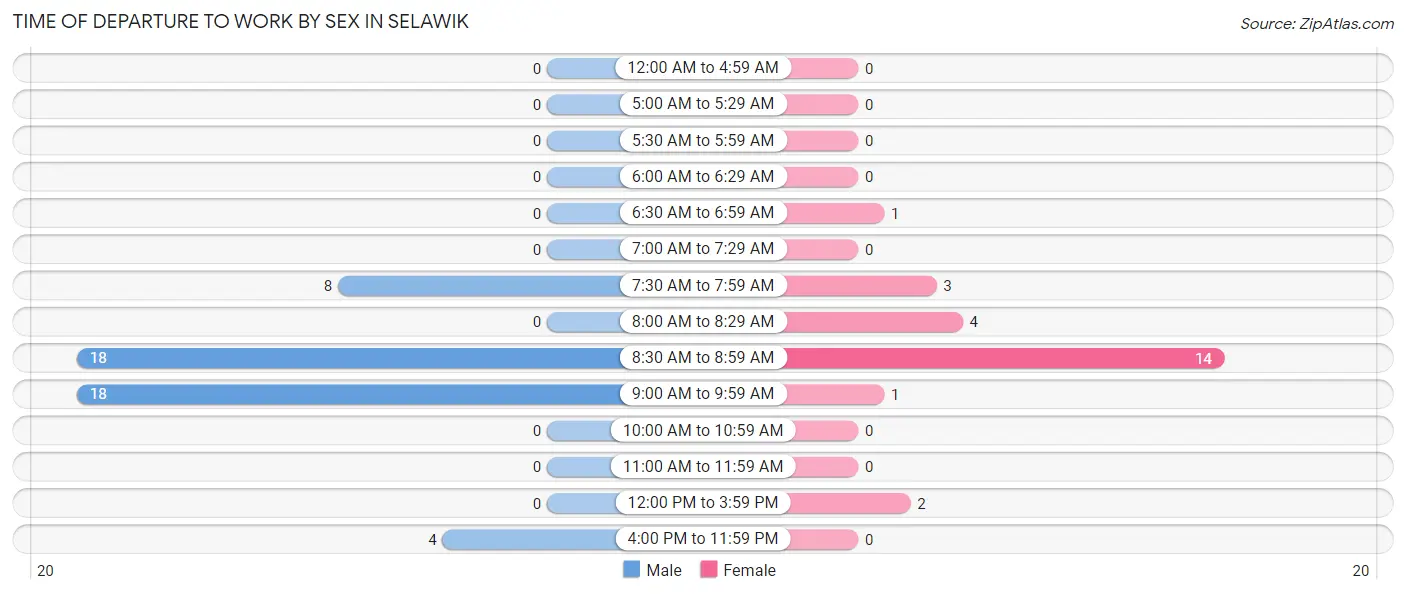
| Time of Departure | Male | Female |
| 12:00 AM to 4:59 AM | 0 (0.0%) | 0 (0.0%) |
| 5:00 AM to 5:29 AM | 0 (0.0%) | 0 (0.0%) |
| 5:30 AM to 5:59 AM | 0 (0.0%) | 0 (0.0%) |
| 6:00 AM to 6:29 AM | 0 (0.0%) | 0 (0.0%) |
| 6:30 AM to 6:59 AM | 0 (0.0%) | 1 (4.0%) |
| 7:00 AM to 7:29 AM | 0 (0.0%) | 0 (0.0%) |
| 7:30 AM to 7:59 AM | 8 (16.7%) | 3 (12.0%) |
| 8:00 AM to 8:29 AM | 0 (0.0%) | 4 (16.0%) |
| 8:30 AM to 8:59 AM | 18 (37.5%) | 14 (56.0%) |
| 9:00 AM to 9:59 AM | 18 (37.5%) | 1 (4.0%) |
| 10:00 AM to 10:59 AM | 0 (0.0%) | 0 (0.0%) |
| 11:00 AM to 11:59 AM | 0 (0.0%) | 0 (0.0%) |
| 12:00 PM to 3:59 PM | 0 (0.0%) | 2 (8.0%) |
| 4:00 PM to 11:59 PM | 4 (8.3%) | 0 (0.0%) |
| Total | 48 (100.0%) | 25 (100.0%) |
Housing Occupancy in Selawik
Occupancy by Ownership in Selawik
Of the total 120 dwellings in Selawik, owner-occupied units account for 75 (62.5%), while renter-occupied units make up 45 (37.5%).
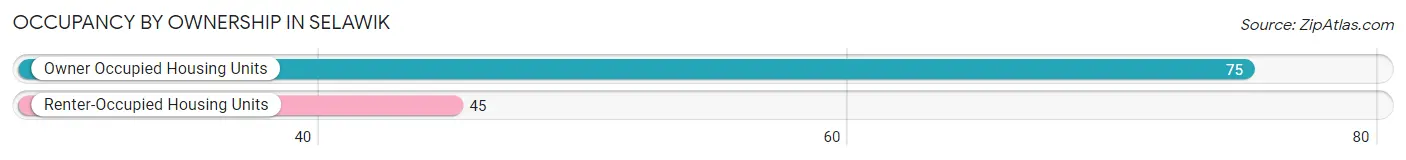
| Occupancy | # Housing Units | % Housing Units |
| Owner Occupied Housing Units | 75 | 62.5% |
| Renter-Occupied Housing Units | 45 | 37.5% |
| Total Occupied Housing Units | 120 | 100.0% |
Occupancy by Household Size in Selawik
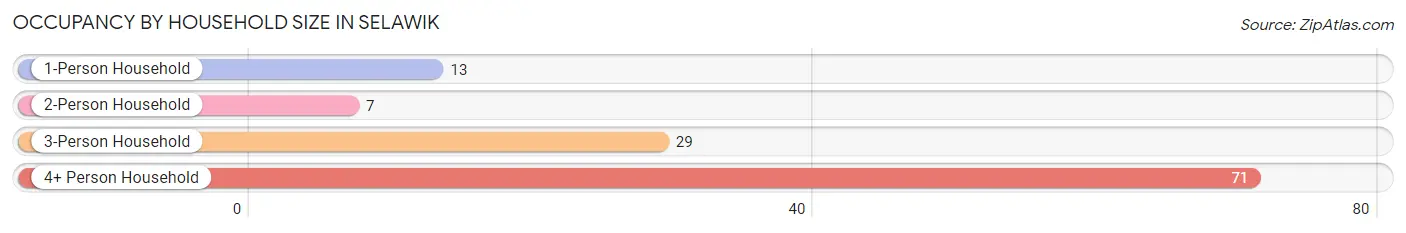
| Household Size | # Housing Units | % Housing Units |
| 1-Person Household | 13 | 10.8% |
| 2-Person Household | 7 | 5.8% |
| 3-Person Household | 29 | 24.2% |
| 4+ Person Household | 71 | 59.2% |
| Total Housing Units | 120 | 100.0% |
Occupancy by Ownership by Household Size in Selawik
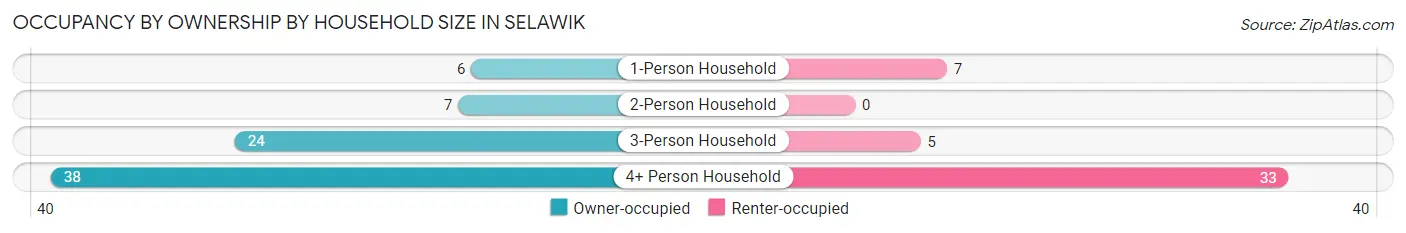
| Household Size | Owner-occupied | Renter-occupied |
| 1-Person Household | 6 (46.2%) | 7 (53.8%) |
| 2-Person Household | 7 (100.0%) | 0 (0.0%) |
| 3-Person Household | 24 (82.8%) | 5 (17.2%) |
| 4+ Person Household | 38 (53.5%) | 33 (46.5%) |
| Total Housing Units | 75 (62.5%) | 45 (37.5%) |
Occupancy by Educational Attainment in Selawik
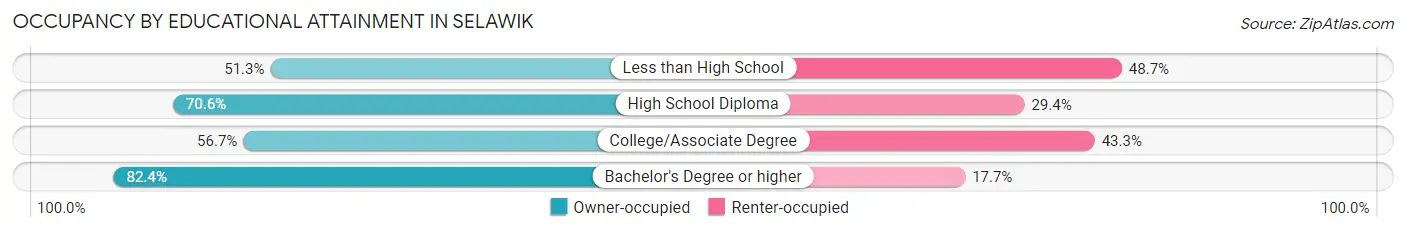
| Household Size | Owner-occupied | Renter-occupied |
| Less than High School | 20 (51.3%) | 19 (48.7%) |
| High School Diploma | 24 (70.6%) | 10 (29.4%) |
| College/Associate Degree | 17 (56.7%) | 13 (43.3%) |
| Bachelor's Degree or higher | 14 (82.4%) | 3 (17.6%) |
Occupancy by Age of Householder in Selawik
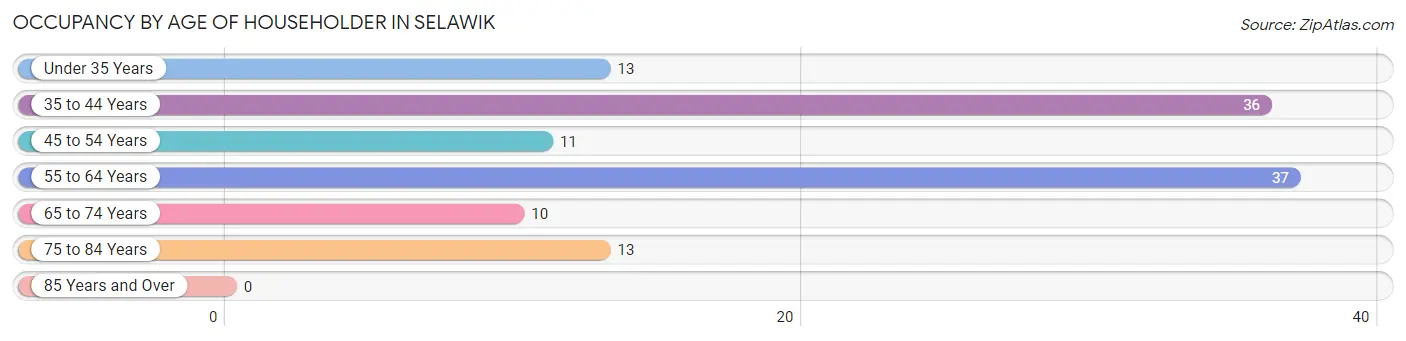
| Age Bracket | # Households | % Households |
| Under 35 Years | 13 | 10.8% |
| 35 to 44 Years | 36 | 30.0% |
| 45 to 54 Years | 11 | 9.2% |
| 55 to 64 Years | 37 | 30.8% |
| 65 to 74 Years | 10 | 8.3% |
| 75 to 84 Years | 13 | 10.8% |
| 85 Years and Over | 0 | 0.0% |
| Total | 120 | 100.0% |
Housing Finances in Selawik
Median Income by Occupancy in Selawik
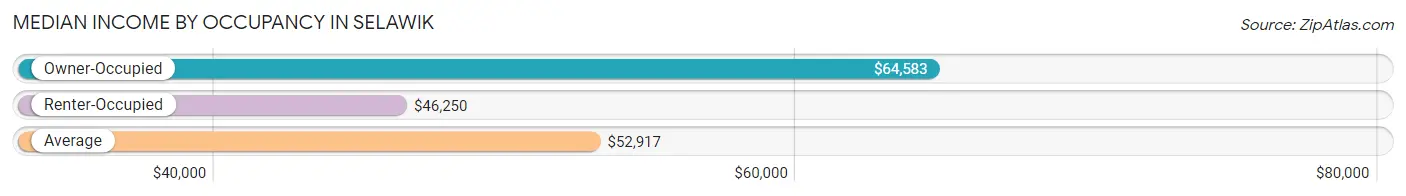
| Occupancy Type | # Households | Median Income |
| Owner-Occupied | 75 (62.5%) | $64,583 |
| Renter-Occupied | 45 (37.5%) | $46,250 |
| Average | 120 (100.0%) | $52,917 |
Occupancy by Householder Income Bracket in Selawik
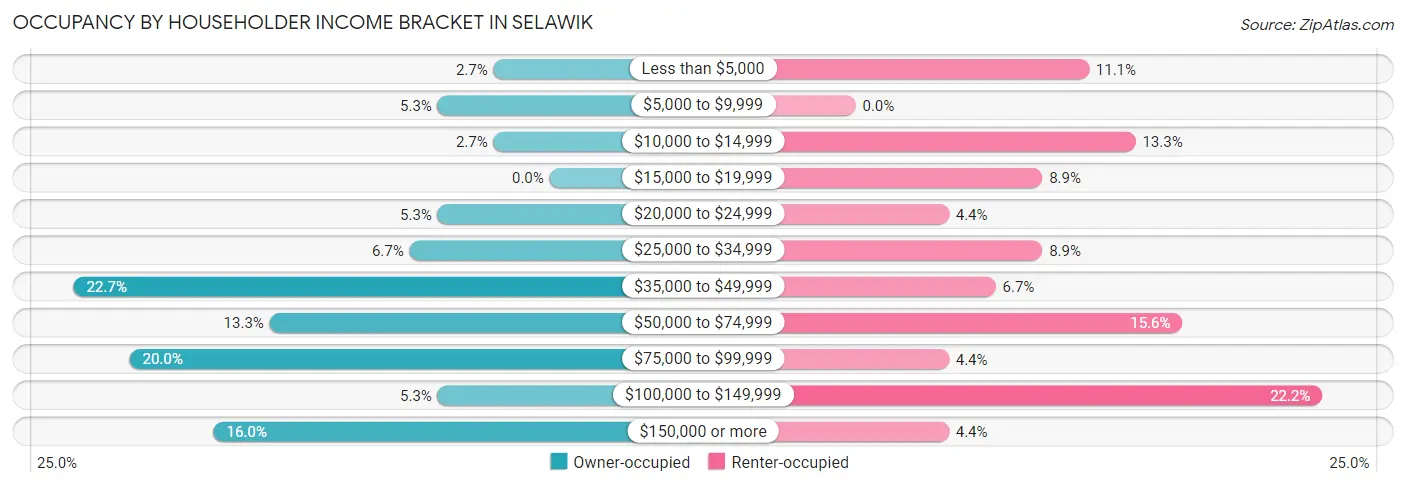
| Income Bracket | Owner-occupied | Renter-occupied |
| Less than $5,000 | 2 (2.7%) | 5 (11.1%) |
| $5,000 to $9,999 | 4 (5.3%) | 0 (0.0%) |
| $10,000 to $14,999 | 2 (2.7%) | 6 (13.3%) |
| $15,000 to $19,999 | 0 (0.0%) | 4 (8.9%) |
| $20,000 to $24,999 | 4 (5.3%) | 2 (4.4%) |
| $25,000 to $34,999 | 5 (6.7%) | 4 (8.9%) |
| $35,000 to $49,999 | 17 (22.7%) | 3 (6.7%) |
| $50,000 to $74,999 | 10 (13.3%) | 7 (15.6%) |
| $75,000 to $99,999 | 15 (20.0%) | 2 (4.4%) |
| $100,000 to $149,999 | 4 (5.3%) | 10 (22.2%) |
| $150,000 or more | 12 (16.0%) | 2 (4.4%) |
| Total | 75 (100.0%) | 45 (100.0%) |
Monthly Housing Cost Tiers in Selawik
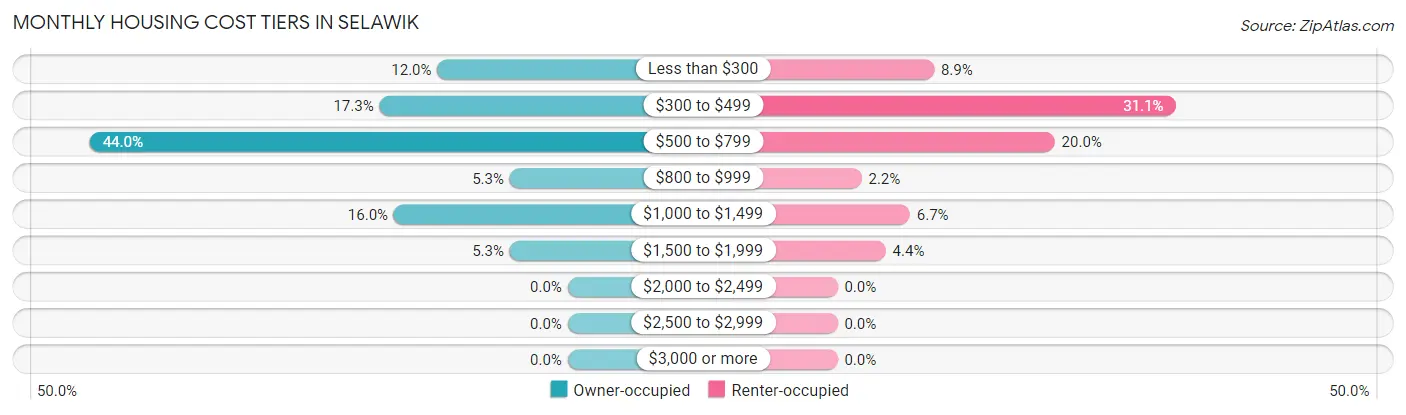
| Monthly Cost | Owner-occupied | Renter-occupied |
| Less than $300 | 9 (12.0%) | 4 (8.9%) |
| $300 to $499 | 13 (17.3%) | 14 (31.1%) |
| $500 to $799 | 33 (44.0%) | 9 (20.0%) |
| $800 to $999 | 4 (5.3%) | 1 (2.2%) |
| $1,000 to $1,499 | 12 (16.0%) | 3 (6.7%) |
| $1,500 to $1,999 | 4 (5.3%) | 2 (4.4%) |
| $2,000 to $2,499 | 0 (0.0%) | 0 (0.0%) |
| $2,500 to $2,999 | 0 (0.0%) | 0 (0.0%) |
| $3,000 or more | 0 (0.0%) | 0 (0.0%) |
| Total | 75 (100.0%) | 45 (100.0%) |
Physical Housing Characteristics in Selawik
Housing Structures in Selawik
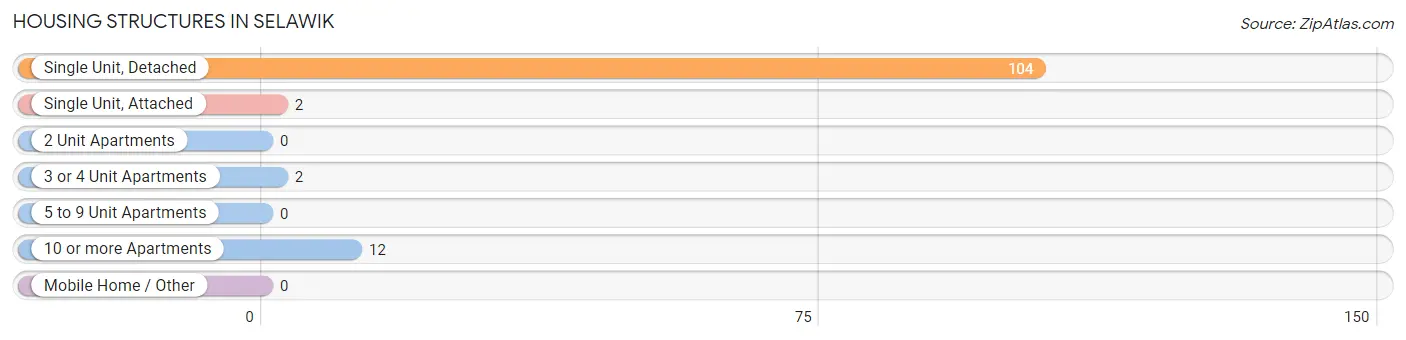
| Structure Type | # Housing Units | % Housing Units |
| Single Unit, Detached | 104 | 86.7% |
| Single Unit, Attached | 2 | 1.7% |
| 2 Unit Apartments | 0 | 0.0% |
| 3 or 4 Unit Apartments | 2 | 1.7% |
| 5 to 9 Unit Apartments | 0 | 0.0% |
| 10 or more Apartments | 12 | 10.0% |
| Mobile Home / Other | 0 | 0.0% |
| Total | 120 | 100.0% |
Housing Structures by Occupancy in Selawik
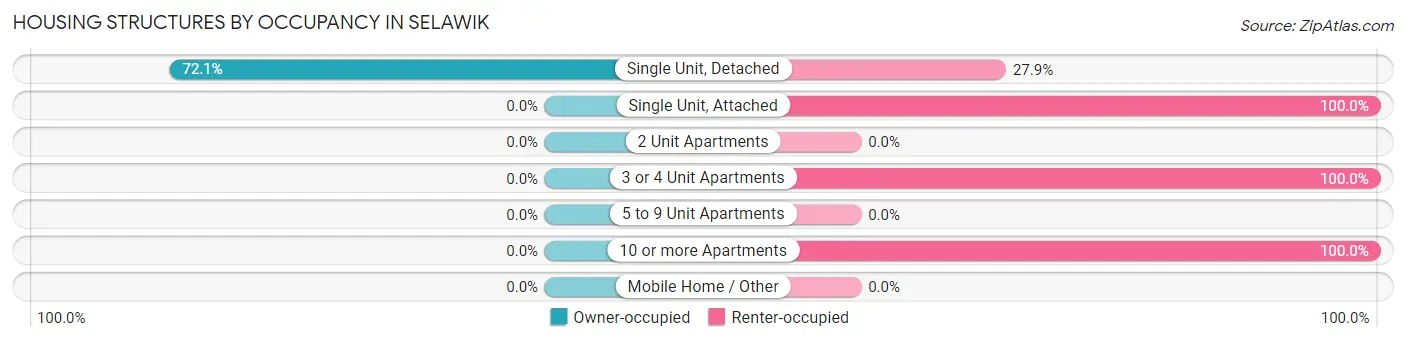
| Structure Type | Owner-occupied | Renter-occupied |
| Single Unit, Detached | 75 (72.1%) | 29 (27.9%) |
| Single Unit, Attached | 0 (0.0%) | 2 (100.0%) |
| 2 Unit Apartments | 0 (0.0%) | 0 (0.0%) |
| 3 or 4 Unit Apartments | 0 (0.0%) | 2 (100.0%) |
| 5 to 9 Unit Apartments | 0 (0.0%) | 0 (0.0%) |
| 10 or more Apartments | 0 (0.0%) | 12 (100.0%) |
| Mobile Home / Other | 0 (0.0%) | 0 (0.0%) |
| Total | 75 (62.5%) | 45 (37.5%) |
Housing Structures by Number of Rooms in Selawik
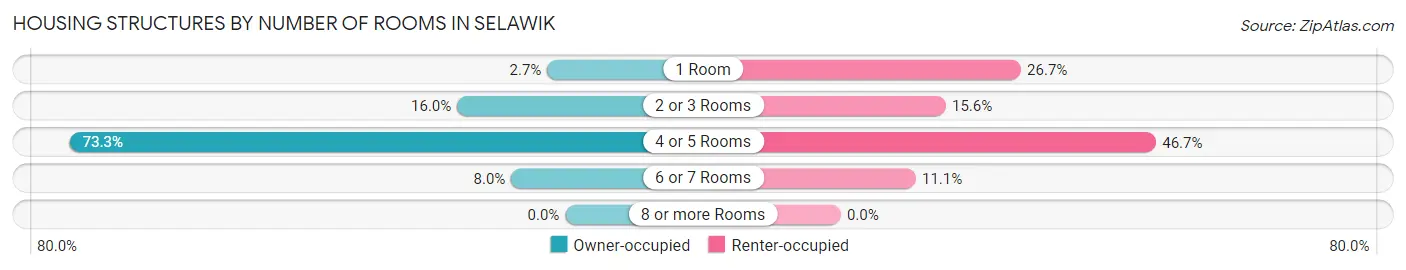
| Number of Rooms | Owner-occupied | Renter-occupied |
| 1 Room | 2 (2.7%) | 12 (26.7%) |
| 2 or 3 Rooms | 12 (16.0%) | 7 (15.6%) |
| 4 or 5 Rooms | 55 (73.3%) | 21 (46.7%) |
| 6 or 7 Rooms | 6 (8.0%) | 5 (11.1%) |
| 8 or more Rooms | 0 (0.0%) | 0 (0.0%) |
| Total | 75 (100.0%) | 45 (100.0%) |
Housing Structure by Heating Type in Selawik
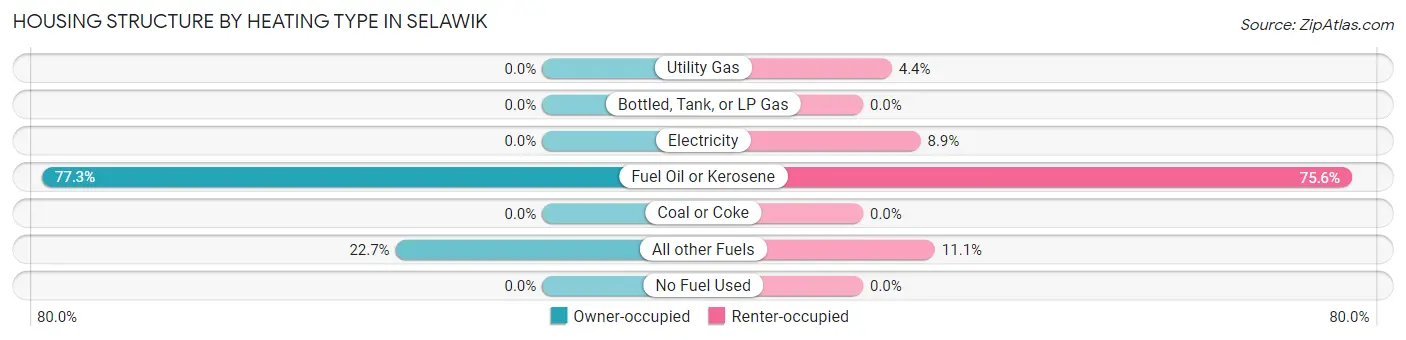
| Heating Type | Owner-occupied | Renter-occupied |
| Utility Gas | 0 (0.0%) | 2 (4.4%) |
| Bottled, Tank, or LP Gas | 0 (0.0%) | 0 (0.0%) |
| Electricity | 0 (0.0%) | 4 (8.9%) |
| Fuel Oil or Kerosene | 58 (77.3%) | 34 (75.6%) |
| Coal or Coke | 0 (0.0%) | 0 (0.0%) |
| All other Fuels | 17 (22.7%) | 5 (11.1%) |
| No Fuel Used | 0 (0.0%) | 0 (0.0%) |
| Total | 75 (100.0%) | 45 (100.0%) |
Household Vehicle Usage in Selawik
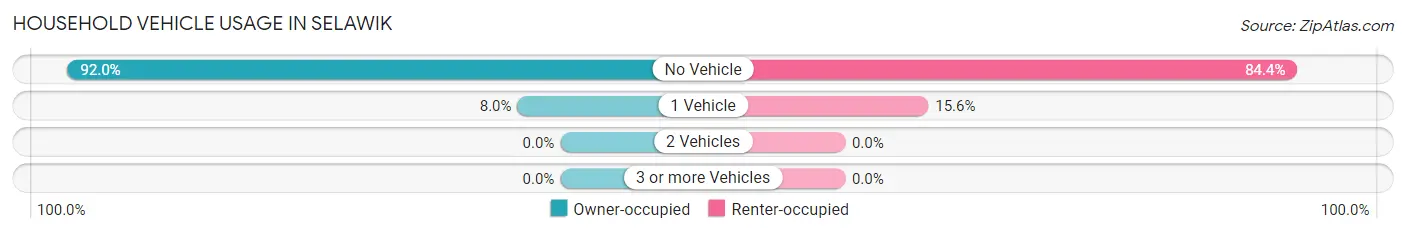
| Vehicles per Household | Owner-occupied | Renter-occupied |
| No Vehicle | 69 (92.0%) | 38 (84.4%) |
| 1 Vehicle | 6 (8.0%) | 7 (15.6%) |
| 2 Vehicles | 0 (0.0%) | 0 (0.0%) |
| 3 or more Vehicles | 0 (0.0%) | 0 (0.0%) |
| Total | 75 (100.0%) | 45 (100.0%) |
Real Estate & Mortgages in Selawik
Real Estate and Mortgage Overview in Selawik
| Characteristic | Without Mortgage | With Mortgage |
| Housing Units | 75 | 0 |
| Median Property Value | $61,000 | $0 |
| Median Household Income | $64,583 | $0 |
| Monthly Housing Costs | $670 | $0 |
| Real Estate Taxes | - | - |
Property Value by Mortgage Status in Selawik
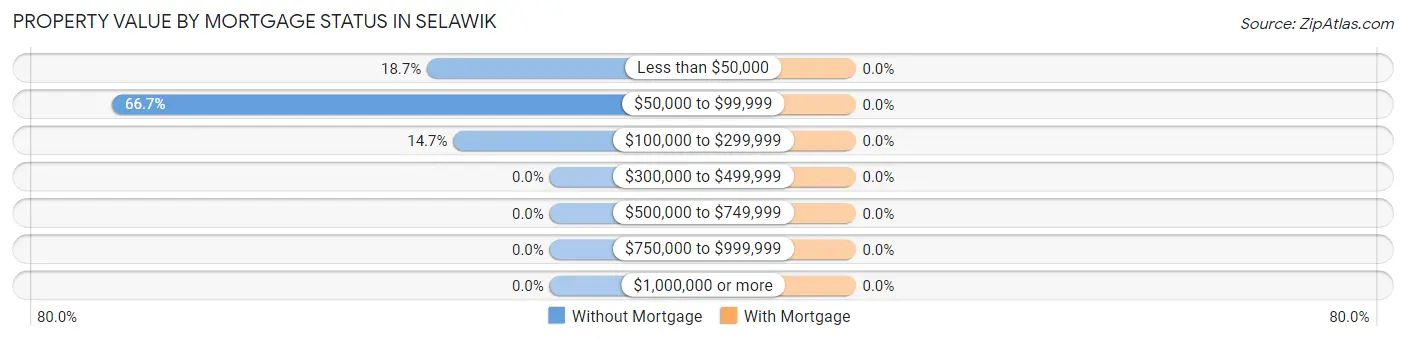
| Property Value | Without Mortgage | With Mortgage |
| Less than $50,000 | 14 (18.7%) | 0 (0.0%) |
| $50,000 to $99,999 | 50 (66.7%) | 0 (0.0%) |
| $100,000 to $299,999 | 11 (14.7%) | 0 (0.0%) |
| $300,000 to $499,999 | 0 (0.0%) | 0 (0.0%) |
| $500,000 to $749,999 | 0 (0.0%) | 0 (0.0%) |
| $750,000 to $999,999 | 0 (0.0%) | 0 (0.0%) |
| $1,000,000 or more | 0 (0.0%) | 0 (0.0%) |
| Total | 75 (100.0%) | 0 (0.0%) |
Household Income by Mortgage Status in Selawik
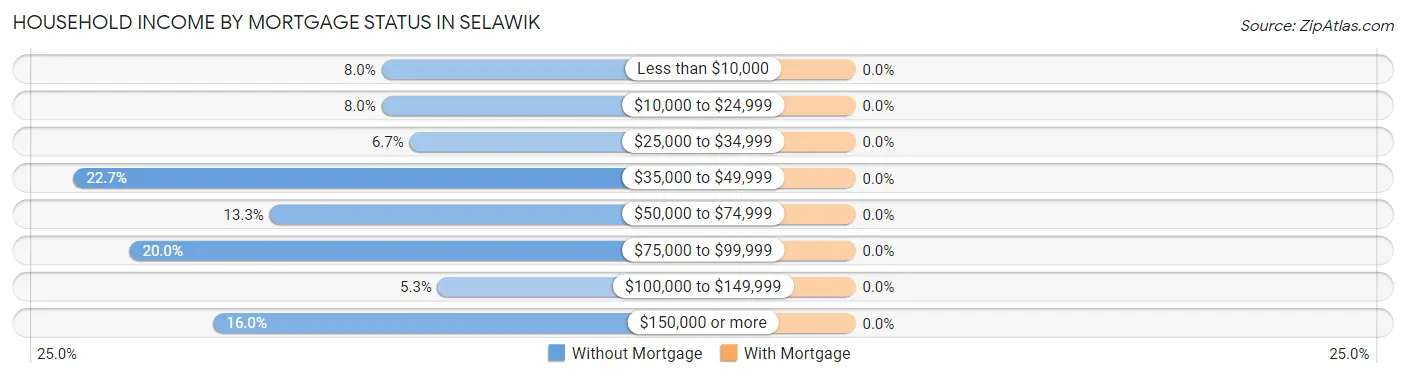
| Household Income | Without Mortgage | With Mortgage |
| Less than $10,000 | 6 (8.0%) | 0 (0.0%) |
| $10,000 to $24,999 | 6 (8.0%) | 0 (0.0%) |
| $25,000 to $34,999 | 5 (6.7%) | 0 (0.0%) |
| $35,000 to $49,999 | 17 (22.7%) | 0 (0.0%) |
| $50,000 to $74,999 | 10 (13.3%) | 0 (0.0%) |
| $75,000 to $99,999 | 15 (20.0%) | 0 (0.0%) |
| $100,000 to $149,999 | 4 (5.3%) | 0 (0.0%) |
| $150,000 or more | 12 (16.0%) | 0 (0.0%) |
| Total | 75 (100.0%) | 0 (0.0%) |
Property Value to Household Income Ratio in Selawik
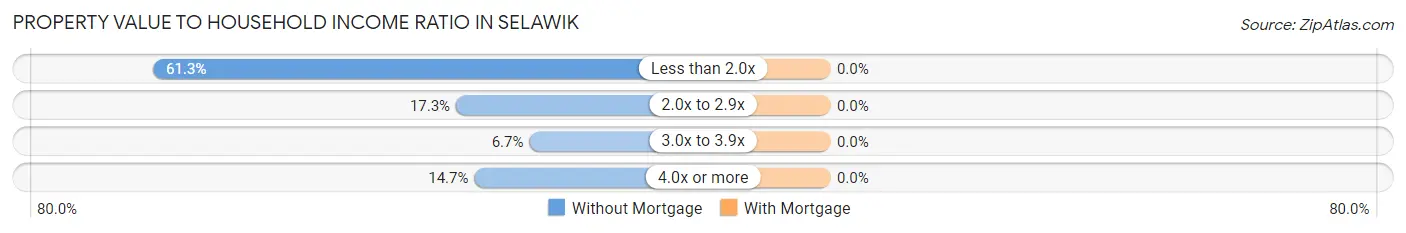
| Value-to-Income Ratio | Without Mortgage | With Mortgage |
| Less than 2.0x | 46 (61.3%) | 0 (0.0%) |
| 2.0x to 2.9x | 13 (17.3%) | 0 (0.0%) |
| 3.0x to 3.9x | 5 (6.7%) | 0 (0.0%) |
| 4.0x or more | 11 (14.7%) | 0 (0.0%) |
| Total | 75 (100.0%) | 0 (0.0%) |
Real Estate Taxes by Mortgage Status in Selawik
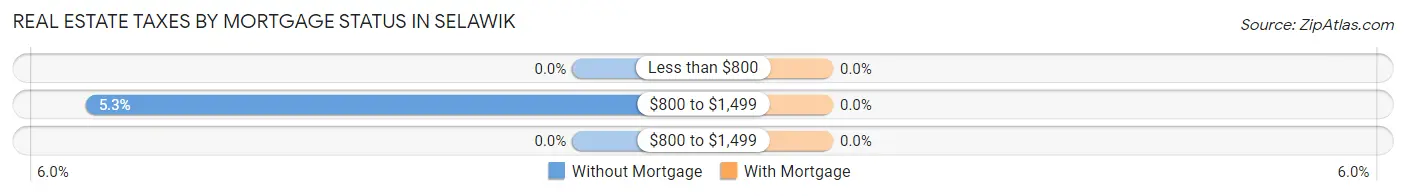
| Property Taxes | Without Mortgage | With Mortgage |
| Less than $800 | 0 (0.0%) | 0 (0.0%) |
| $800 to $1,499 | 4 (5.3%) | 0 (0.0%) |
| $800 to $1,499 | 0 (0.0%) | 0 (0.0%) |
| Total | 75 (100.0%) | 0 (0.0%) |
Health & Disability in Selawik
Health Insurance Coverage by Age in Selawik
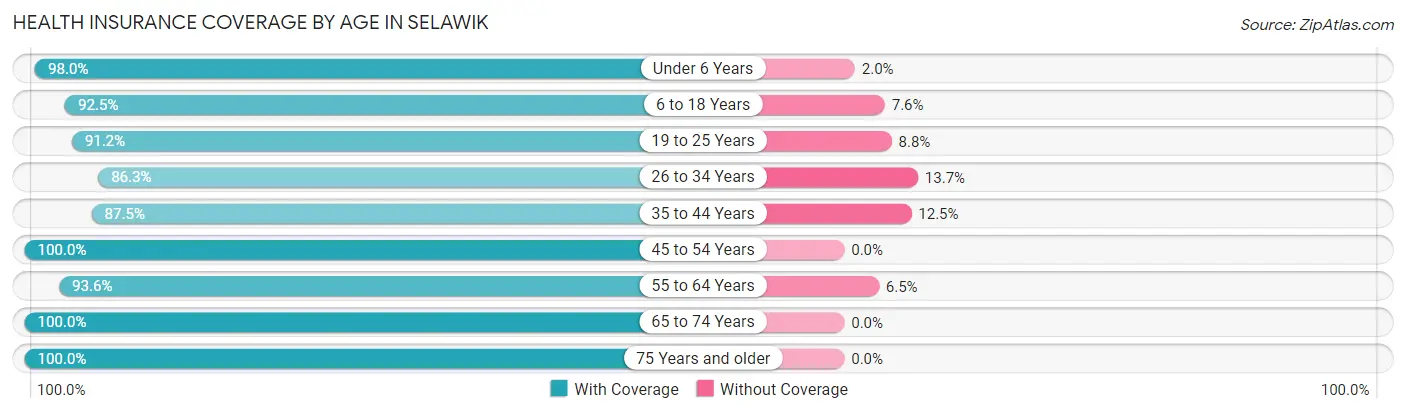
| Age Bracket | With Coverage | Without Coverage |
| Under 6 Years | 100 (98.0%) | 2 (2.0%) |
| 6 to 18 Years | 147 (92.4%) | 12 (7.5%) |
| 19 to 25 Years | 31 (91.2%) | 3 (8.8%) |
| 26 to 34 Years | 44 (86.3%) | 7 (13.7%) |
| 35 to 44 Years | 77 (87.5%) | 11 (12.5%) |
| 45 to 54 Years | 29 (100.0%) | 0 (0.0%) |
| 55 to 64 Years | 58 (93.5%) | 4 (6.5%) |
| 65 to 74 Years | 14 (100.0%) | 0 (0.0%) |
| 75 Years and older | 18 (100.0%) | 0 (0.0%) |
| Total | 518 (93.0%) | 39 (7.0%) |
Health Insurance Coverage by Citizenship Status in Selawik
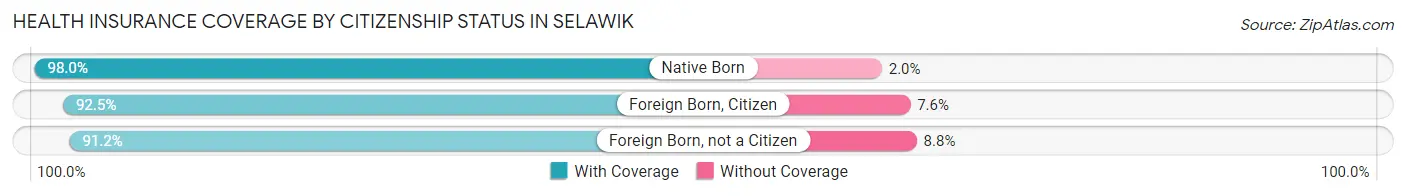
| Citizenship Status | With Coverage | Without Coverage |
| Native Born | 100 (98.0%) | 2 (2.0%) |
| Foreign Born, Citizen | 147 (92.4%) | 12 (7.5%) |
| Foreign Born, not a Citizen | 31 (91.2%) | 3 (8.8%) |
Health Insurance Coverage by Household Income in Selawik
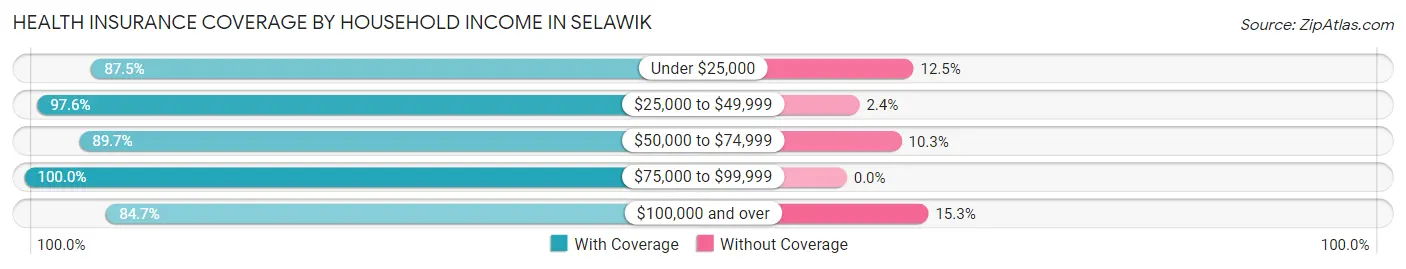
| Household Income | With Coverage | Without Coverage |
| Under $25,000 | 84 (87.5%) | 12 (12.5%) |
| $25,000 to $49,999 | 165 (97.6%) | 4 (2.4%) |
| $50,000 to $74,999 | 70 (89.7%) | 8 (10.3%) |
| $75,000 to $99,999 | 116 (100.0%) | 0 (0.0%) |
| $100,000 and over | 83 (84.7%) | 15 (15.3%) |
Public vs Private Health Insurance Coverage by Age in Selawik
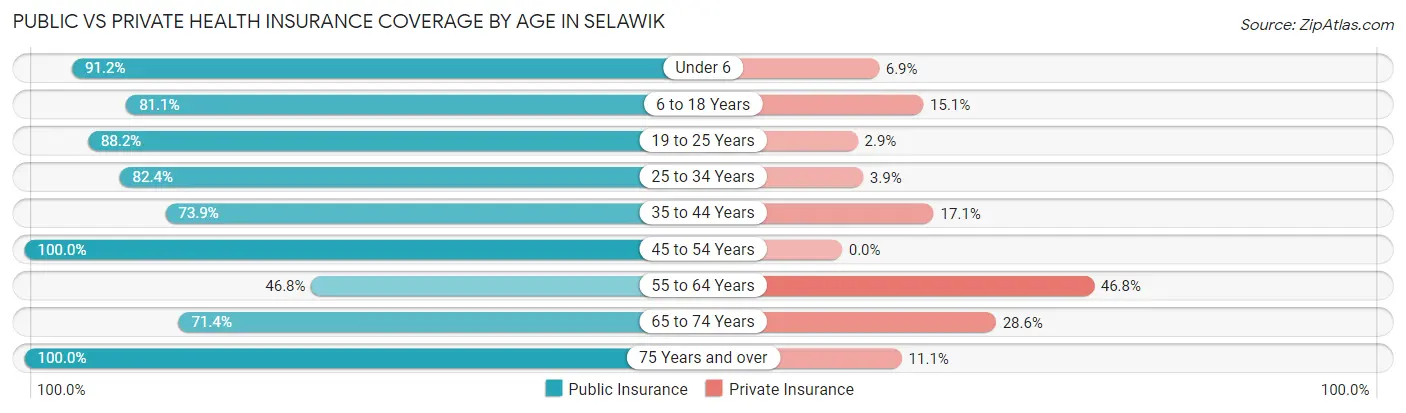
| Age Bracket | Public Insurance | Private Insurance |
| Under 6 | 93 (91.2%) | 7 (6.9%) |
| 6 to 18 Years | 129 (81.1%) | 24 (15.1%) |
| 19 to 25 Years | 30 (88.2%) | 1 (2.9%) |
| 25 to 34 Years | 42 (82.4%) | 2 (3.9%) |
| 35 to 44 Years | 65 (73.9%) | 15 (17.1%) |
| 45 to 54 Years | 29 (100.0%) | 0 (0.0%) |
| 55 to 64 Years | 29 (46.8%) | 29 (46.8%) |
| 65 to 74 Years | 10 (71.4%) | 4 (28.6%) |
| 75 Years and over | 18 (100.0%) | 2 (11.1%) |
| Total | 445 (79.9%) | 84 (15.1%) |
Disability Status by Sex by Age in Selawik
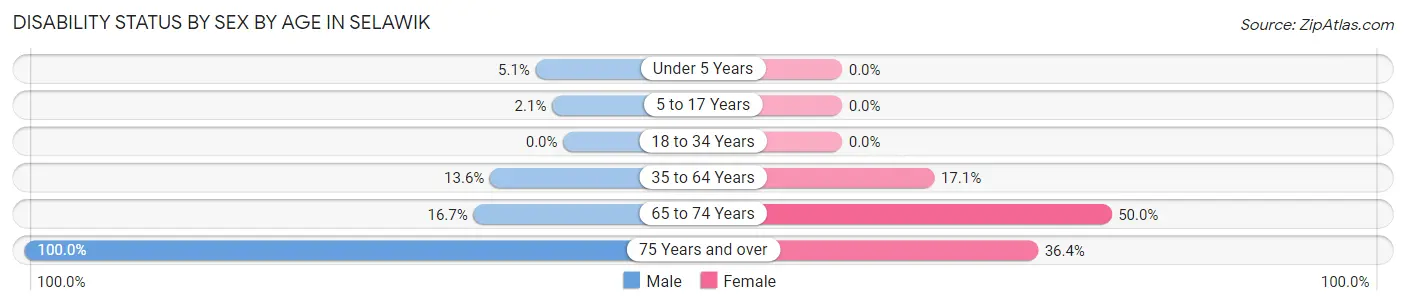
| Age Bracket | Male | Female |
| Under 5 Years | 2 (5.1%) | 0 (0.0%) |
| 5 to 17 Years | 2 (2.1%) | 0 (0.0%) |
| 18 to 34 Years | 0 (0.0%) | 0 (0.0%) |
| 35 to 64 Years | 14 (13.6%) | 13 (17.1%) |
| 65 to 74 Years | 1 (16.7%) | 4 (50.0%) |
| 75 Years and over | 7 (100.0%) | 4 (36.4%) |
Disability Class by Sex by Age in Selawik
Disability Class: Hearing Difficulty
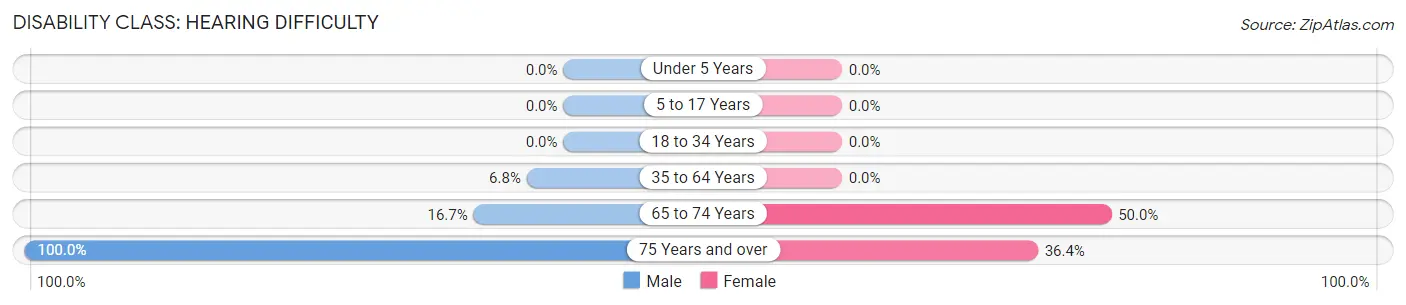
| Age Bracket | Male | Female |
| Under 5 Years | 0 (0.0%) | 0 (0.0%) |
| 5 to 17 Years | 0 (0.0%) | 0 (0.0%) |
| 18 to 34 Years | 0 (0.0%) | 0 (0.0%) |
| 35 to 64 Years | 7 (6.8%) | 0 (0.0%) |
| 65 to 74 Years | 1 (16.7%) | 4 (50.0%) |
| 75 Years and over | 7 (100.0%) | 4 (36.4%) |
Disability Class: Vision Difficulty
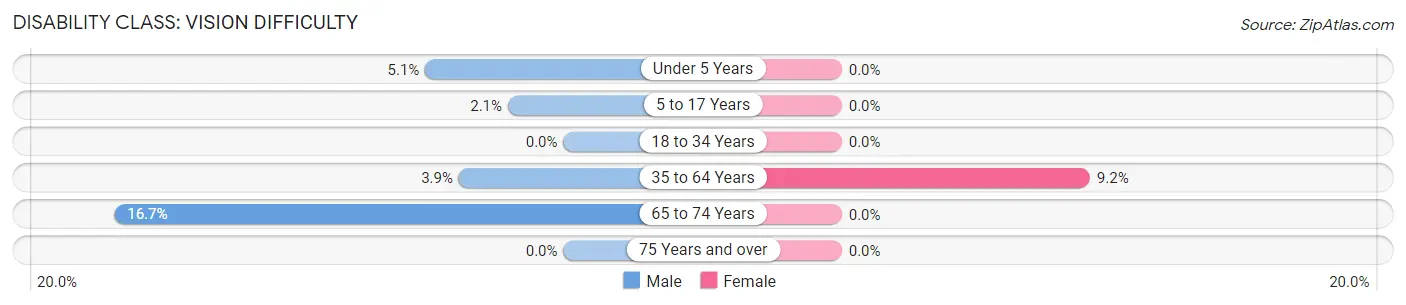
| Age Bracket | Male | Female |
| Under 5 Years | 2 (5.1%) | 0 (0.0%) |
| 5 to 17 Years | 2 (2.1%) | 0 (0.0%) |
| 18 to 34 Years | 0 (0.0%) | 0 (0.0%) |
| 35 to 64 Years | 4 (3.9%) | 7 (9.2%) |
| 65 to 74 Years | 1 (16.7%) | 0 (0.0%) |
| 75 Years and over | 0 (0.0%) | 0 (0.0%) |
Disability Class: Cognitive Difficulty
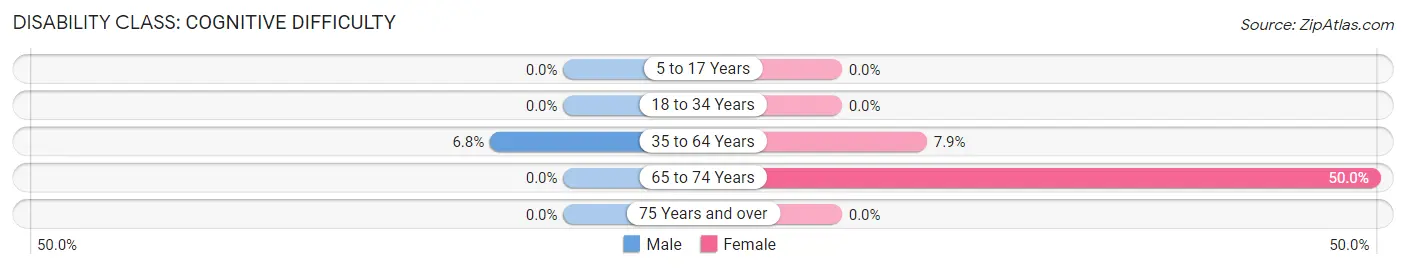
| Age Bracket | Male | Female |
| 5 to 17 Years | 0 (0.0%) | 0 (0.0%) |
| 18 to 34 Years | 0 (0.0%) | 0 (0.0%) |
| 35 to 64 Years | 7 (6.8%) | 6 (7.9%) |
| 65 to 74 Years | 0 (0.0%) | 4 (50.0%) |
| 75 Years and over | 0 (0.0%) | 0 (0.0%) |
Disability Class: Ambulatory Difficulty
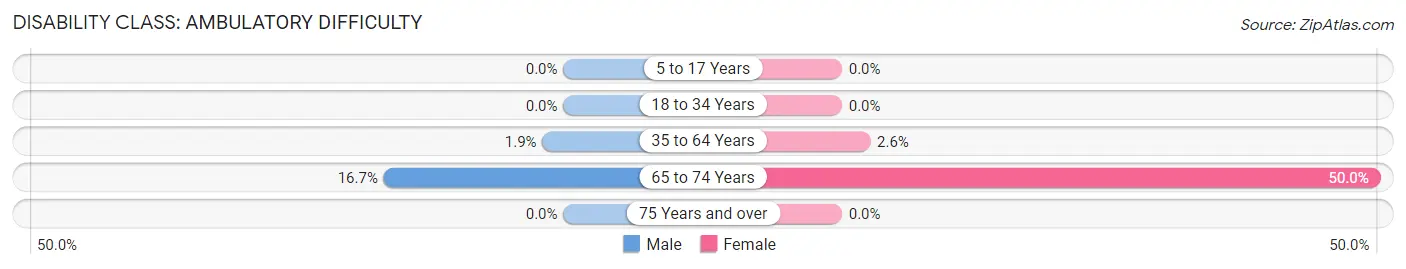
| Age Bracket | Male | Female |
| 5 to 17 Years | 0 (0.0%) | 0 (0.0%) |
| 18 to 34 Years | 0 (0.0%) | 0 (0.0%) |
| 35 to 64 Years | 2 (1.9%) | 2 (2.6%) |
| 65 to 74 Years | 1 (16.7%) | 4 (50.0%) |
| 75 Years and over | 0 (0.0%) | 0 (0.0%) |
Disability Class: Self-Care Difficulty
| Age Bracket | Male | Female |
| 5 to 17 Years | 0 (0.0%) | 0 (0.0%) |
| 18 to 34 Years | 0 (0.0%) | 0 (0.0%) |
| 35 to 64 Years | 0 (0.0%) | 0 (0.0%) |
| 65 to 74 Years | 0 (0.0%) | 0 (0.0%) |
| 75 Years and over | 0 (0.0%) | 0 (0.0%) |
Technology Access in Selawik
Computing Device Access in Selawik
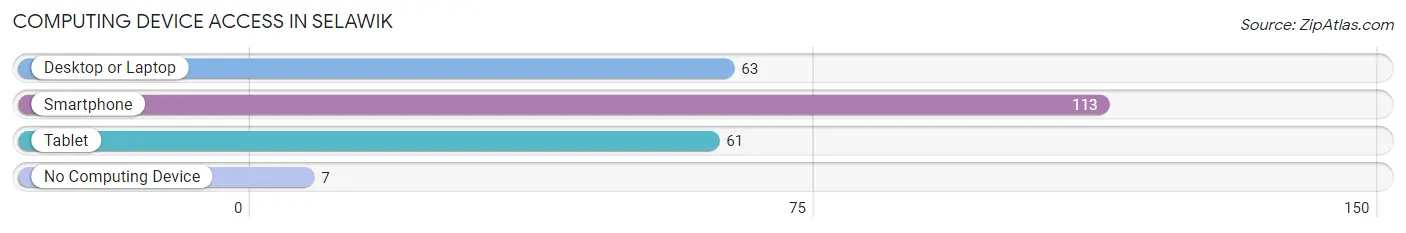
| Device Type | # Households | % Households |
| Desktop or Laptop | 63 | 52.5% |
| Smartphone | 113 | 94.2% |
| Tablet | 61 | 50.8% |
| No Computing Device | 7 | 5.8% |
| Total | 120 | 100.0% |
Internet Access in Selawik
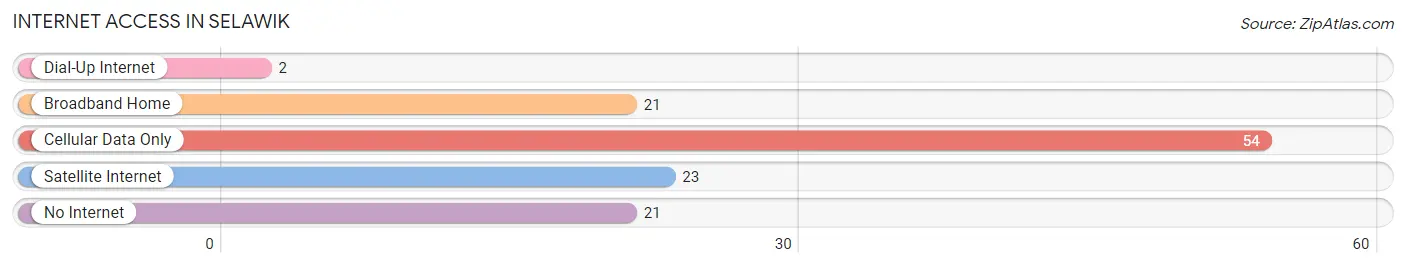
| Internet Type | # Households | % Households |
| Dial-Up Internet | 2 | 1.7% |
| Broadband Home | 21 | 17.5% |
| Cellular Data Only | 54 | 45.0% |
| Satellite Internet | 23 | 19.2% |
| No Internet | 21 | 17.5% |
| Total | 120 | 100.0% |
Selawik Summary
Selawik is a city located in the Northwest Arctic Borough of Alaska. It is situated on the Selawik River, approximately 40 miles from the Chukchi Sea. The city has a population of 845 people, as of the 2010 census, and is the largest city in the Northwest Arctic Borough.
History
The area around Selawik has been inhabited by the Iñupiat people for thousands of years. The Iñupiat people have a long history of living off the land, hunting, fishing, and gathering. The Iñupiat people have a strong cultural identity and continue to practice their traditional ways of life.
The first non-native settlers in the area arrived in the late 1800s. These settlers were primarily fur traders and trappers. The first permanent non-native settlement in the area was established in the early 1900s. This settlement was called Selawik Station and was located on the banks of the Selawik River.
In the early 1900s, the U.S. government began to establish schools in the area. The first school in Selawik was established in 1915. This school was called the Selawik Day School and was operated by the Bureau of Indian Affairs.
In the late 1940s, the U.S. government began to establish a permanent settlement in the area. This settlement was called Selawik Village and was located on the banks of the Selawik River. The village was established in 1949 and was the first permanent settlement in the area.
In the 1950s, the U.S. government began to build a road from Selawik to Kotzebue. This road was completed in 1959 and was the first road to connect Selawik to the rest of Alaska.
In the 1960s, the U.S. government began to build a new school in Selawik. This school was called the Selawik High School and was completed in 1965.
In the 1970s, the U.S. government began to build a new airport in Selawik. This airport was completed in 1975 and was the first airport in the area.
In the 1980s, the U.S. government began to build a new hospital in Selawik. This hospital was completed in 1988 and was the first hospital in the area.
In the 1990s, the U.S. government began to build a new community center in Selawik. This community center was completed in 1999 and was the first community center in the area.
Geography
Selawik is located in the Northwest Arctic Borough of Alaska. It is situated on the Selawik River, approximately 40 miles from the Chukchi Sea. The city has a total area of 4.3 square miles, all of which is land.
The climate in Selawik is subarctic. The average temperature in the summer is around 50°F and the average temperature in the winter is around -20°F. The average annual precipitation is around 10 inches.
Economy
The economy of Selawik is largely based on subsistence activities such as hunting, fishing, and gathering. The city also has a small commercial fishing industry.
The city also has a small tourism industry. Tourists come to the area to experience the traditional Iñupiat culture and to take part in outdoor activities such as fishing, hunting, and camping.
Demographics
As of the 2010 census, the population of Selawik was 845 people. The racial makeup of the city was 95.3% Native American, 2.2% White, 0.2% Asian, 0.1% Black, and 2.2% from other races.
The median household income in Selawik was $25,000, and the median family income was $30,000. The per capita income in Selawik was $13,000. The poverty rate in Selawik was 44.3%.
Conclusion
Selawik is a city located in the Northwest Arctic Borough of Alaska. It has a population of 845 people, as of the 2010 census, and is the largest city in the Northwest Arctic Borough. The city has a long history of being inhabited by the Iñupiat people and has a strong cultural identity. The economy of Selawik is largely based on subsistence activities such as hunting, fishing, and gathering. The city also has a small commercial fishing industry and a small tourism industry. The racial makeup of the city is 95.3% Native American, 2.2% White, 0.2% Asian, 0.1% Black, and 2.2% from other races. The median household income in Selawik was $25,000, and the median family income was $30,000. The poverty rate in Selawik was 44.3%.
Common Questions
What is the Total Population of Selawik?
Total Population of Selawik is 557.
What is the Total Male Population of Selawik?
Total Male Population of Selawik is 316.
What is the Total Female Population of Selawik?
Total Female Population of Selawik is 241.
What is the Ratio of Males per 100 Females in Selawik?
There are 131.12 Males per 100 Females in Selawik.
What is the Ratio of Females per 100 Males in Selawik?
There are 76.27 Females per 100 Males in Selawik.
What is the Median Population Age in Selawik?
Median Population Age in Selawik is 21.9 Years.
What is the Average Family Size in Selawik
Average Family Size in Selawik is 4.8 People.
What is the Average Household Size in Selawik
Average Household Size in Selawik is 4.6 People.
What is Per Capita Income in Selawik?
Per Capita income in Selawik is $14,015.
What is the Median Family Income in Selawik?
Median Family Income in Selawik is $54,583.
What is the Median Household income in Selawik?
Median Household Income in Selawik is $52,917.
What is Income or Wage Gap in Selawik?
Income or Wage Gap in Selawik is 43.9%.
Women in Selawik earn 56.1 cents for every dollar earned by a man.
What is Inequality or Gini Index in Selawik?
Inequality or Gini Index in Selawik is 0.41.
How Large is the Labor Force in Selawik?
There are 136 People in the Labor Forcein in Selawik.
What is the Percentage of People in the Labor Force in Selawik?
42.1% of People are in the Labor Force in Selawik.
What is the Unemployment Rate in Selawik?
Unemployment Rate in Selawik is 33.1%.