Point MacKenzie, AK
Point MacKenzie Map
Point MacKenzie Overview
1,707
TOTAL POPULATION
1,430
MALE POPULATION
277
FEMALE POPULATION
516.25
MALES / 100 FEMALES
19.37
FEMALES / 100 MALES
45.2
MEDIAN AGE
3.5
AVG FAMILY SIZE
3.7
AVG HOUSEHOLD SIZE
$12,507
PER CAPITA INCOME
$91,625
AVG FAMILY INCOME
$92,125
AVG HOUSEHOLD INCOME
0.39
INEQUALITY / GINI INDEX
193
LABOR FORCE [ PEOPLE ]
11.9%
PERCENT IN LABOR FORCE
7.3%
UNEMPLOYMENT RATE
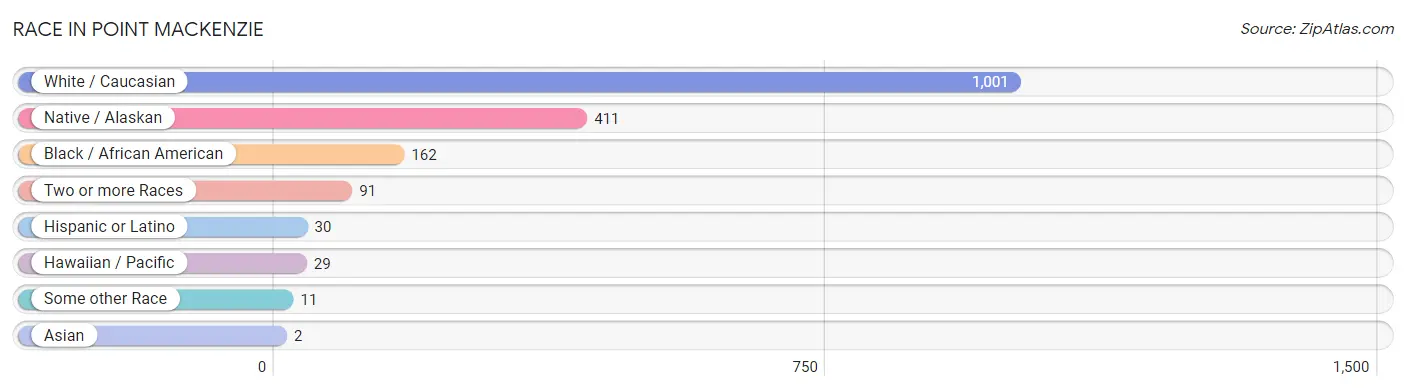
Race in Point MacKenzie
The most populous races in Point MacKenzie are White / Caucasian (1,001 | 58.6%), Native / Alaskan (411 | 24.1%), and Black / African American (162 | 9.5%).
| Race | # Population | % Population |
| Asian | 2 | 0.1% |
| Black / African American | 162 | 9.5% |
| Hawaiian / Pacific | 29 | 1.7% |
| Hispanic or Latino | 30 | 1.8% |
| Native / Alaskan | 411 | 24.1% |
| White / Caucasian | 1,001 | 58.6% |
| Two or more Races | 91 | 5.3% |
| Some other Race | 11 | 0.6% |
| Total | 1,707 | 100.0% |
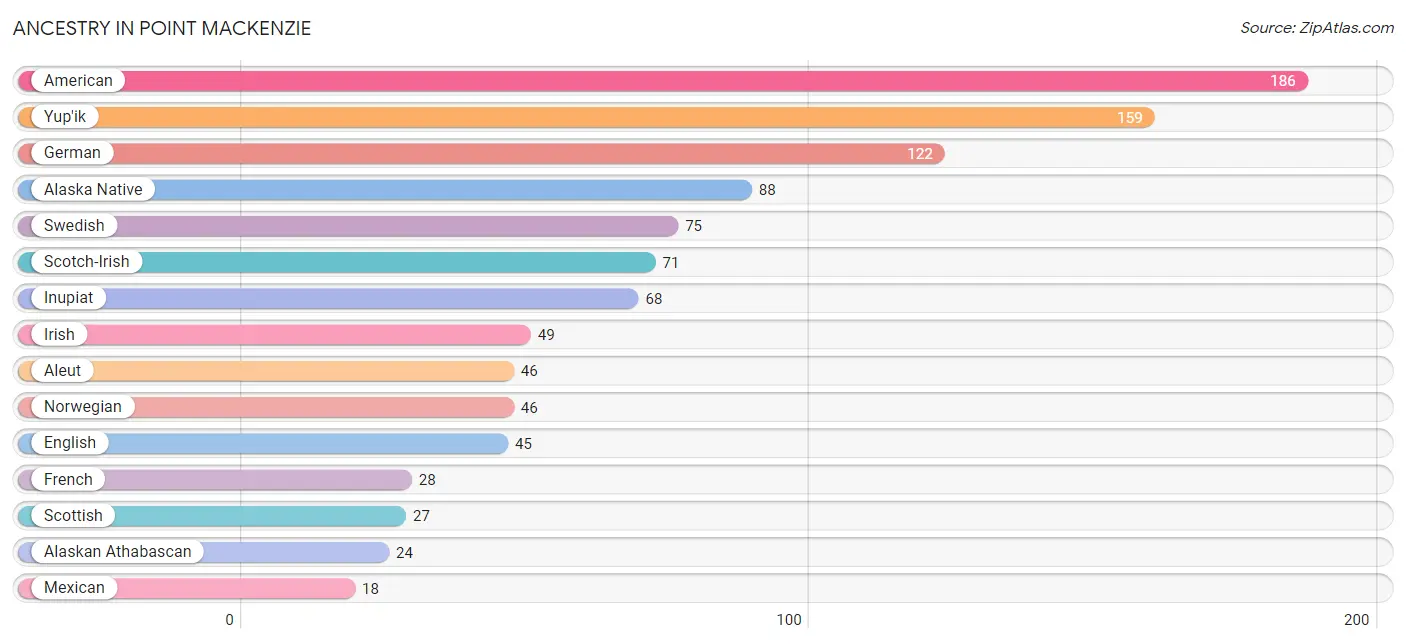
Ancestry in Point MacKenzie
The most populous ancestries reported in Point MacKenzie are American (186 | 10.9%), Yup'ik (159 | 9.3%), German (122 | 7.1%), Alaska Native (88 | 5.2%), and Swedish (75 | 4.4%), together accounting for 36.9% of all Point MacKenzie residents.
| Ancestry | # Population | % Population |
| Alaska Native | 88 | 5.2% |
| Alaskan Athabascan | 24 | 1.4% |
| Aleut | 46 | 2.7% |
| American | 186 | 10.9% |
| British | 2 | 0.1% |
| Chippewa | 11 | 0.6% |
| Crow | 6 | 0.4% |
| Cuban | 11 | 0.6% |
| Danish | 8 | 0.5% |
| English | 45 | 2.6% |
| French | 28 | 1.6% |
| German | 122 | 7.1% |
| Greek | 12 | 0.7% |
| Inupiat | 68 | 4.0% |
| Irish | 49 | 2.9% |
| Italian | 12 | 0.7% |
| Korean | 7 | 0.4% |
| Mexican | 18 | 1.1% |
| Native Hawaiian | 16 | 0.9% |
| Nigerian | 10 | 0.6% |
| Norwegian | 46 | 2.7% |
| Polish | 1 | 0.1% |
| Puerto Rican | 1 | 0.1% |
| Russian | 1 | 0.1% |
| Samoan | 13 | 0.8% |
| Scotch-Irish | 71 | 4.2% |
| Scottish | 27 | 1.6% |
| Subsaharan African | 10 | 0.6% |
| Swedish | 75 | 4.4% |
| Swiss | 17 | 1.0% |
| Tlingit-Haida | 16 | 0.9% |
| Tsimshian | 10 | 0.6% |
| Yup'ik | 159 | 9.3% | View All 33 Rows |
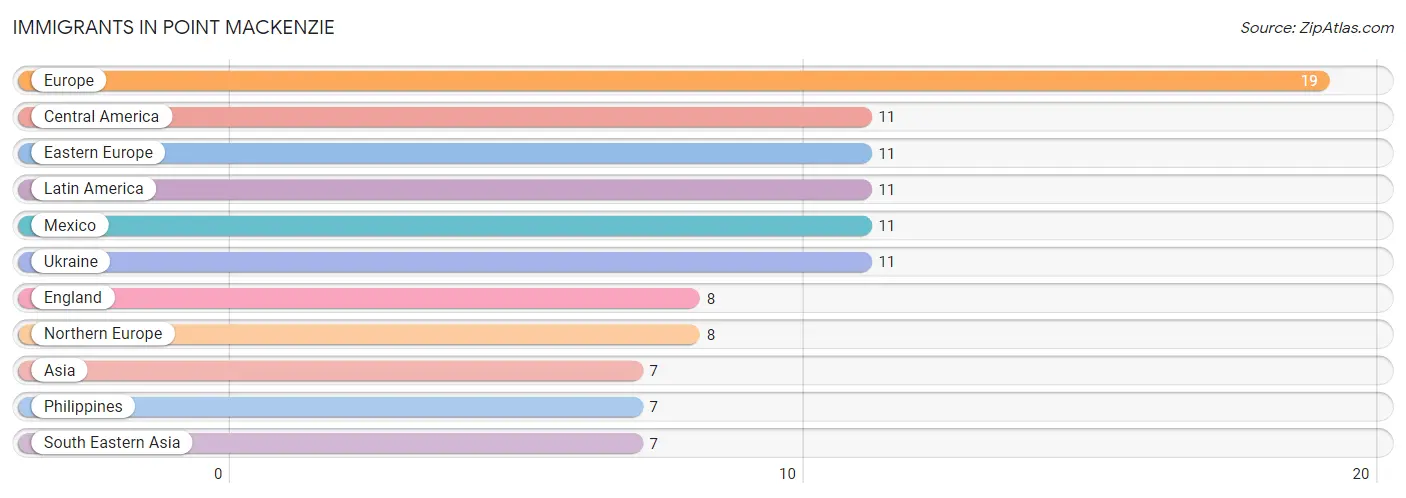
Immigrants in Point MacKenzie
The most numerous immigrant groups reported in Point MacKenzie came from Europe (19 | 1.1%), Central America (11 | 0.6%), Eastern Europe (11 | 0.6%), Latin America (11 | 0.6%), and Mexico (11 | 0.6%), together accounting for 3.7% of all Point MacKenzie residents.
| Immigration Origin | # Population | % Population |
| Asia | 7 | 0.4% |
| Central America | 11 | 0.6% |
| Eastern Europe | 11 | 0.6% |
| England | 8 | 0.5% |
| Europe | 19 | 1.1% |
| Latin America | 11 | 0.6% |
| Mexico | 11 | 0.6% |
| Northern Europe | 8 | 0.5% |
| Philippines | 7 | 0.4% |
| South Eastern Asia | 7 | 0.4% |
| Ukraine | 11 | 0.6% | View All 11 Rows |
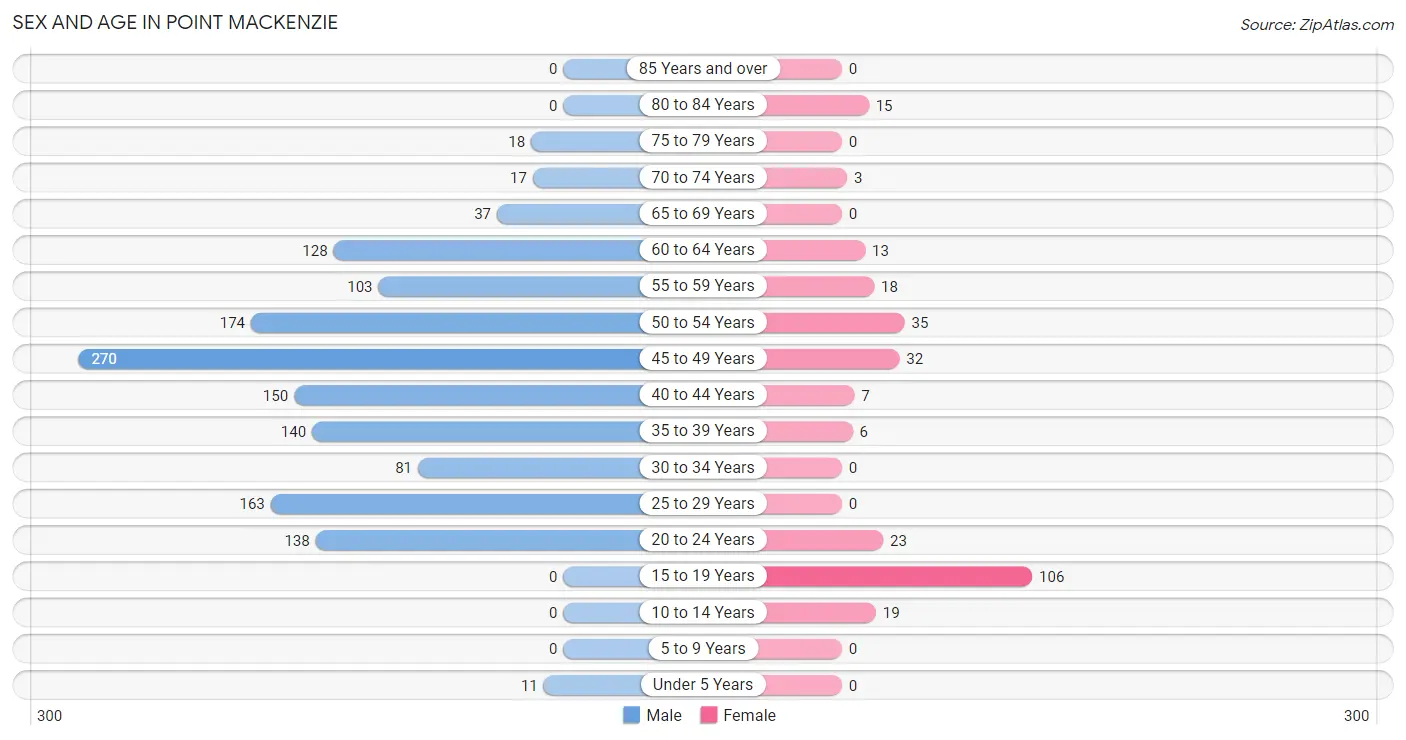
Sex and Age in Point MacKenzie
Sex and Age in Point MacKenzie
The most populous age groups in Point MacKenzie are 45 to 49 Years (270 | 18.9%) for men and 15 to 19 Years (106 | 38.3%) for women.
| Age Bracket | Male | Female |
| Under 5 Years | 11 (0.8%) | 0 (0.0%) |
| 5 to 9 Years | 0 (0.0%) | 0 (0.0%) |
| 10 to 14 Years | 0 (0.0%) | 19 (6.9%) |
| 15 to 19 Years | 0 (0.0%) | 106 (38.3%) |
| 20 to 24 Years | 138 (9.7%) | 23 (8.3%) |
| 25 to 29 Years | 163 (11.4%) | 0 (0.0%) |
| 30 to 34 Years | 81 (5.7%) | 0 (0.0%) |
| 35 to 39 Years | 140 (9.8%) | 6 (2.2%) |
| 40 to 44 Years | 150 (10.5%) | 7 (2.5%) |
| 45 to 49 Years | 270 (18.9%) | 32 (11.6%) |
| 50 to 54 Years | 174 (12.2%) | 35 (12.6%) |
| 55 to 59 Years | 103 (7.2%) | 18 (6.5%) |
| 60 to 64 Years | 128 (8.9%) | 13 (4.7%) |
| 65 to 69 Years | 37 (2.6%) | 0 (0.0%) |
| 70 to 74 Years | 17 (1.2%) | 3 (1.1%) |
| 75 to 79 Years | 18 (1.3%) | 0 (0.0%) |
| 80 to 84 Years | 0 (0.0%) | 15 (5.4%) |
| 85 Years and over | 0 (0.0%) | 0 (0.0%) |
| Total | 1,430 (100.0%) | 277 (100.0%) |
Families and Households in Point MacKenzie
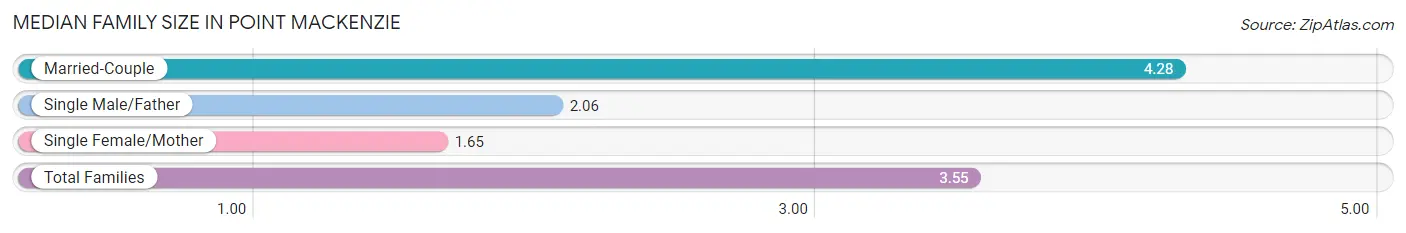
Median Family Size in Point MacKenzie
The median family size in Point MacKenzie is 3.55 persons per family, with married-couple families (81 | 69.8%) accounting for the largest median family size of 4.28 persons per family. On the other hand, single female/mother families (17 | 14.7%) represent the smallest median family size with 1.65 persons per family.
| Family Type | # Families | Family Size |
| Married-Couple | 81 (69.8%) | 4.28 |
| Single Male/Father | 18 (15.5%) | 2.06 |
| Single Female/Mother | 17 (14.7%) | 1.65 |
| Total Families | 116 (100.0%) | 3.55 |
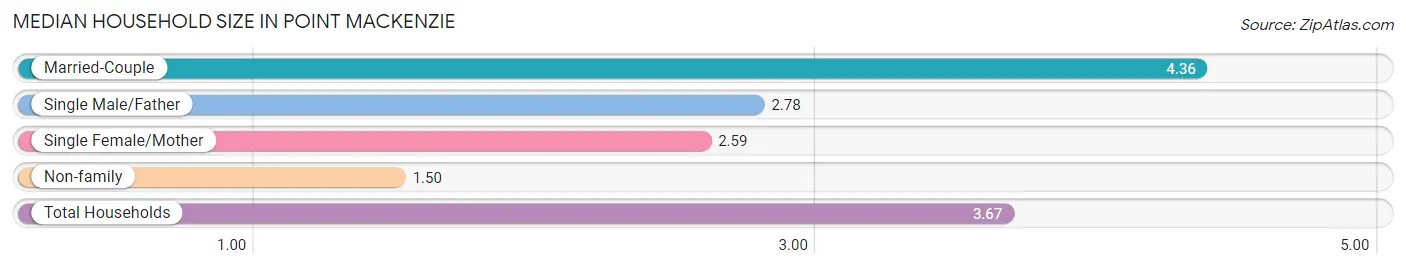
Median Household Size in Point MacKenzie
The median household size in Point MacKenzie is 3.67 persons per household, with married-couple households (81 | 64.3%) accounting for the largest median household size of 4.36 persons per household. non-family households (10 | 7.9%) represent the smallest median household size with 1.50 persons per household.
| Household Type | # Households | Household Size |
| Married-Couple | 81 (64.3%) | 4.36 |
| Single Male/Father | 18 (14.3%) | 2.78 |
| Single Female/Mother | 17 (13.5%) | 2.59 |
| Non-family | 10 (7.9%) | 1.50 |
| Total Households | 126 (100.0%) | 3.67 |
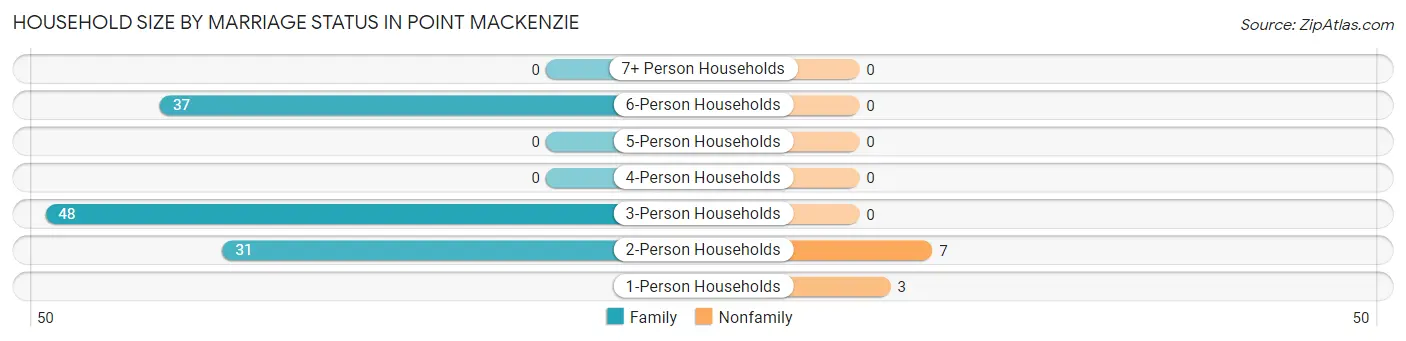
Household Size by Marriage Status in Point MacKenzie
Out of a total of 126 households in Point MacKenzie, 116 (92.1%) are family households, while 10 (7.9%) are nonfamily households. The most numerous type of family households are 3-person households, comprising 48, and the most common type of nonfamily households are 2-person households, comprising 7.
| Household Size | Family Households | Nonfamily Households |
| 1-Person Households | - | 3 (2.4%) |
| 2-Person Households | 31 (24.6%) | 7 (5.6%) |
| 3-Person Households | 48 (38.1%) | 0 (0.0%) |
| 4-Person Households | 0 (0.0%) | 0 (0.0%) |
| 5-Person Households | 0 (0.0%) | 0 (0.0%) |
| 6-Person Households | 37 (29.4%) | 0 (0.0%) |
| 7+ Person Households | 0 (0.0%) | 0 (0.0%) |
| Total | 116 (92.1%) | 10 (7.9%) |
Female Fertility in Point MacKenzie
Fertility by Age in Point MacKenzie
| Age Bracket | Women with Births | Births / 1,000 Women |
| 15 to 19 years | 0 (0.0%) | 0.0 |
| 20 to 34 years | 0 (0.0%) | 0.0 |
| 35 to 50 years | 0 (0.0%) | 0.0 |
| Total | 0 (0.0%) | 0.0 |
Fertility by Age by Marriage Status in Point MacKenzie
| Age Bracket | Married | Unmarried |
| 15 to 19 years | 0 (0.0%) | 0 (0.0%) |
| 20 to 34 years | 0 (0.0%) | 0 (0.0%) |
| 35 to 50 years | 0 (0.0%) | 0 (0.0%) |
| Total | 0 (0.0%) | 0 (0.0%) |
Fertility by Education in Point MacKenzie
| Educational Attainment | Women with Births | Births / 1,000 Women |
| Less than High School | 0 (0.0%) | 0.0 |
| High School Diploma | 0 (0.0%) | 0.0 |
| College or Associate's Degree | 0 (0.0%) | 0.0 |
| Bachelor's Degree | 0 (0.0%) | 0.0 |
| Graduate Degree | 0 (0.0%) | 0.0 |
| Total | 0 (0.0%) | 0.0 |
Fertility by Education by Marriage Status in Point MacKenzie
| Educational Attainment | Married | Unmarried |
| Less than High School | 0 (0.0%) | 0 (0.0%) |
| High School Diploma | 0 (0.0%) | 0 (0.0%) |
| College or Associate's Degree | 0 (0.0%) | 0 (0.0%) |
| Bachelor's Degree | 0 (0.0%) | 0 (0.0%) |
| Graduate Degree | 0 (0.0%) | 0 (0.0%) |
| Total | 0 (0.0%) | 0 (0.0%) |
Income in Point MacKenzie
Income Overview in Point MacKenzie
Per Capita Income in Point MacKenzie is $12,507, while median incomes of families and households are $91,625 and $92,125 respectively.
| Characteristic | Number | Measure |
| Per Capita Income | 1,707 | $12,507 |
| Median Family Income | 116 | $91,625 |
| Mean Family Income | 116 | $88,183 |
| Median Household Income | 126 | $92,125 |
| Mean Household Income | 126 | $107,142 |
| Income Deficit | 116 | $0 |
| Wage / Income Gap (%) | 1,707 | 0.00% |
| Wage / Income Gap ($) | 1,707 | 100.00¢ per $1 |
| Gini / Inequality Index | 1,707 | 0.39 |
Earnings by Sex in Point MacKenzie
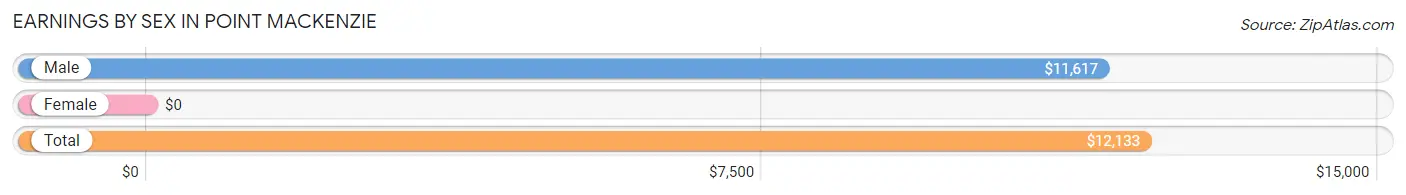
| Sex | Number | Average Earnings |
| Male | 697 (88.4%) | $11,617 |
| Female | 91 (11.6%) | $0 |
| Total | 788 (100.0%) | $12,133 |
Earnings by Sex by Income Bracket in Point MacKenzie
The most common earnings brackets in Point MacKenzie are $2,500 to $4,999 for men (146 | 20.9%) and $2,499 or less for women (29 | 31.9%).
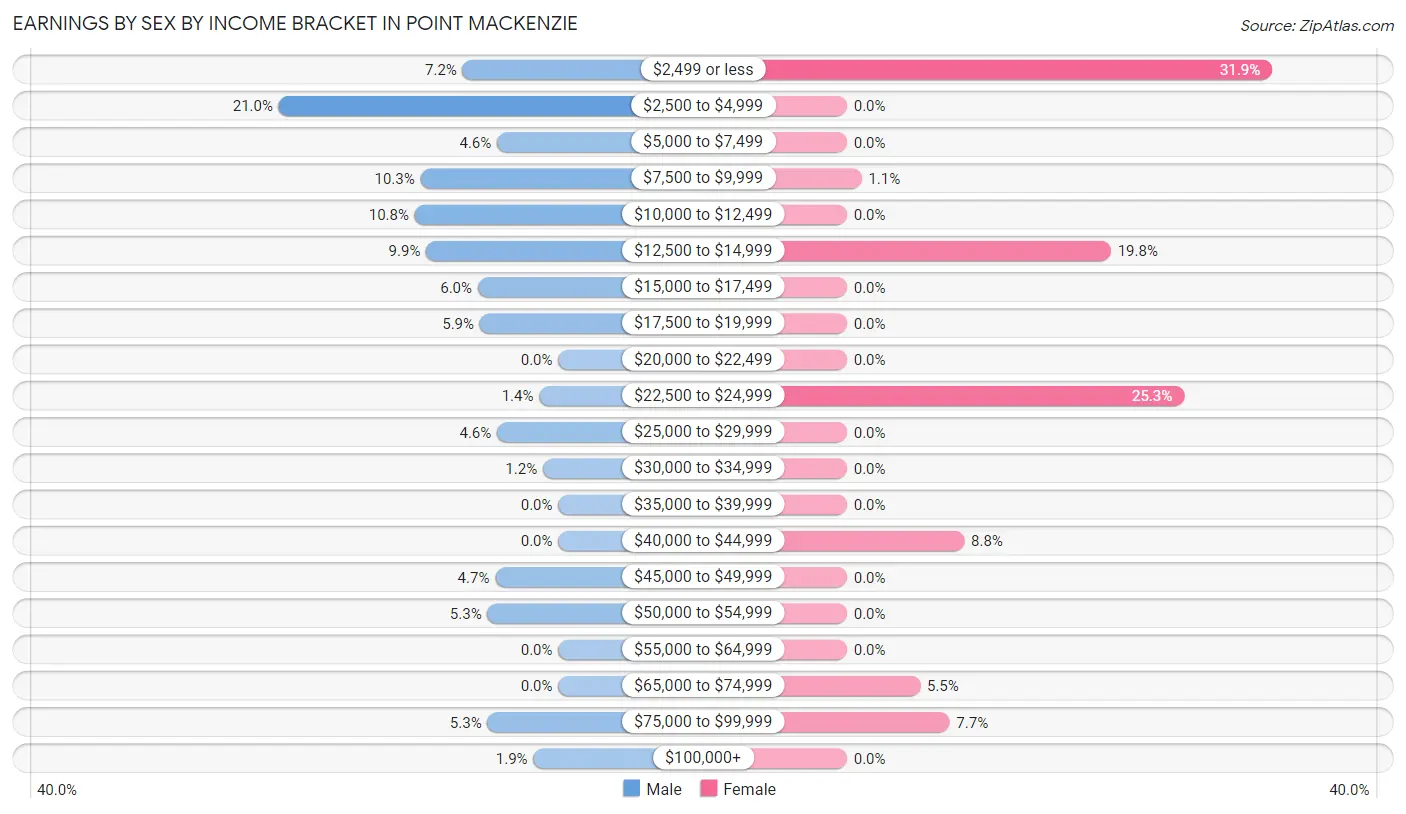
| Income | Male | Female |
| $2,499 or less | 50 (7.2%) | 29 (31.9%) |
| $2,500 to $4,999 | 146 (20.9%) | 0 (0.0%) |
| $5,000 to $7,499 | 32 (4.6%) | 0 (0.0%) |
| $7,500 to $9,999 | 72 (10.3%) | 1 (1.1%) |
| $10,000 to $12,499 | 75 (10.8%) | 0 (0.0%) |
| $12,500 to $14,999 | 69 (9.9%) | 18 (19.8%) |
| $15,000 to $17,499 | 42 (6.0%) | 0 (0.0%) |
| $17,500 to $19,999 | 41 (5.9%) | 0 (0.0%) |
| $20,000 to $22,499 | 0 (0.0%) | 0 (0.0%) |
| $22,500 to $24,999 | 10 (1.4%) | 23 (25.3%) |
| $25,000 to $29,999 | 32 (4.6%) | 0 (0.0%) |
| $30,000 to $34,999 | 8 (1.1%) | 0 (0.0%) |
| $35,000 to $39,999 | 0 (0.0%) | 0 (0.0%) |
| $40,000 to $44,999 | 0 (0.0%) | 8 (8.8%) |
| $45,000 to $49,999 | 33 (4.7%) | 0 (0.0%) |
| $50,000 to $54,999 | 37 (5.3%) | 0 (0.0%) |
| $55,000 to $64,999 | 0 (0.0%) | 0 (0.0%) |
| $65,000 to $74,999 | 0 (0.0%) | 5 (5.5%) |
| $75,000 to $99,999 | 37 (5.3%) | 7 (7.7%) |
| $100,000+ | 13 (1.9%) | 0 (0.0%) |
| Total | 697 (100.0%) | 91 (100.0%) |
Earnings by Sex by Educational Attainment in Point MacKenzie
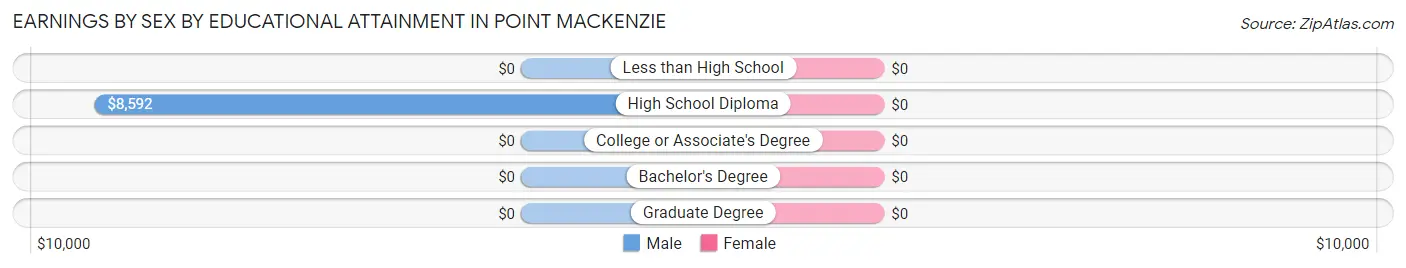
| Educational Attainment | Male Income | Female Income |
| Less than High School | - | - |
| High School Diploma | $8,592 | $0 |
| College or Associate's Degree | - | - |
| Bachelor's Degree | - | - |
| Graduate Degree | - | - |
| Total | $10,633 | $0 |
Family Income in Point MacKenzie
Family Income Brackets in Point MacKenzie
According to the Point MacKenzie family income data, there are 29 families falling into the $75,000 to $99,999 income range, which is the most common income bracket and makes up 25.0% of all families.
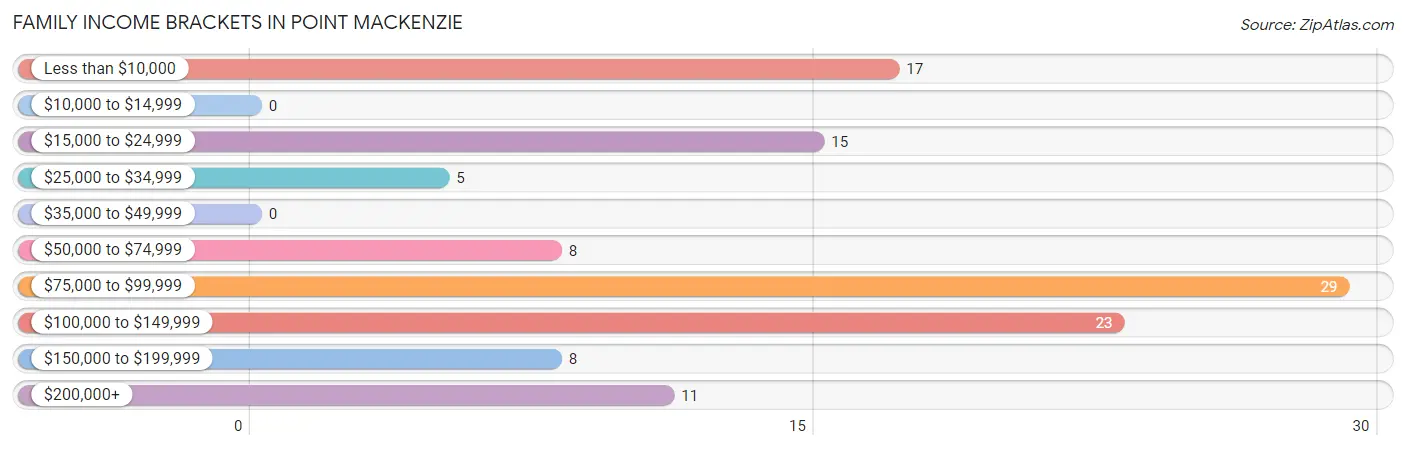
| Income Bracket | # Families | % Families |
| Less than $10,000 | 17 | 14.7% |
| $10,000 to $14,999 | 0 | 0.0% |
| $15,000 to $24,999 | 15 | 12.9% |
| $25,000 to $34,999 | 5 | 4.3% |
| $35,000 to $49,999 | 0 | 0.0% |
| $50,000 to $74,999 | 8 | 6.9% |
| $75,000 to $99,999 | 29 | 25.0% |
| $100,000 to $149,999 | 23 | 19.8% |
| $150,000 to $199,999 | 8 | 6.9% |
| $200,000+ | 11 | 9.5% |
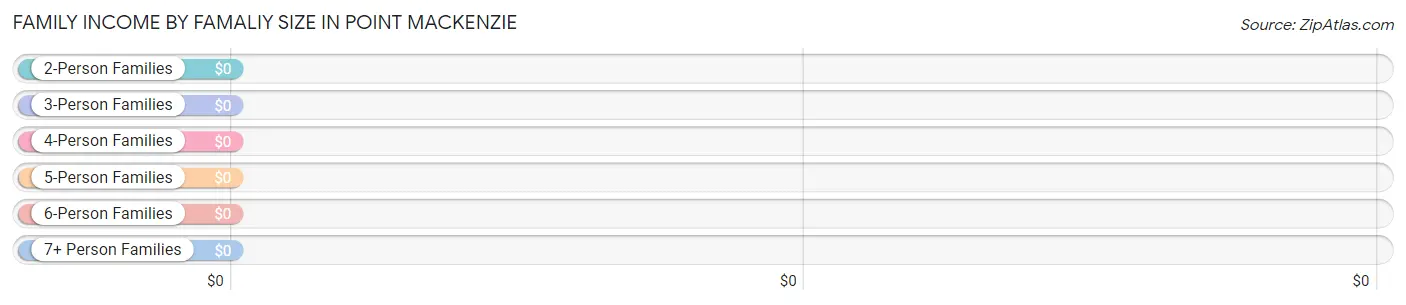
Family Income by Famaliy Size in Point MacKenzie
| Income Bracket | # Families | Median Income |
| 2-Person Families | 69 (59.5%) | $0 |
| 3-Person Families | 10 (8.6%) | $0 |
| 4-Person Families | 0 (0.0%) | $0 |
| 5-Person Families | 0 (0.0%) | $0 |
| 6-Person Families | 37 (31.9%) | $0 |
| 7+ Person Families | 0 (0.0%) | $0 |
| Total | 116 (100.0%) | $91,625 |
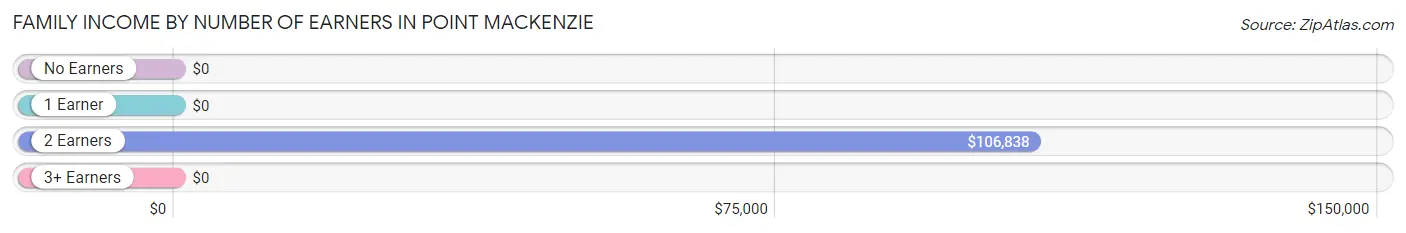
Family Income by Number of Earners in Point MacKenzie
| Number of Earners | # Families | Median Income |
| No Earners | 32 (27.6%) | $0 |
| 1 Earner | 21 (18.1%) | $0 |
| 2 Earners | 43 (37.1%) | $106,838 |
| 3+ Earners | 20 (17.2%) | $0 |
| Total | 116 (100.0%) | $91,625 |
Household Income in Point MacKenzie
Household Income Brackets in Point MacKenzie
With 23 households falling in the category, the $25,000 to $34,999 income range is the most frequent in Point MacKenzie, accounting for 18.2% of all households.
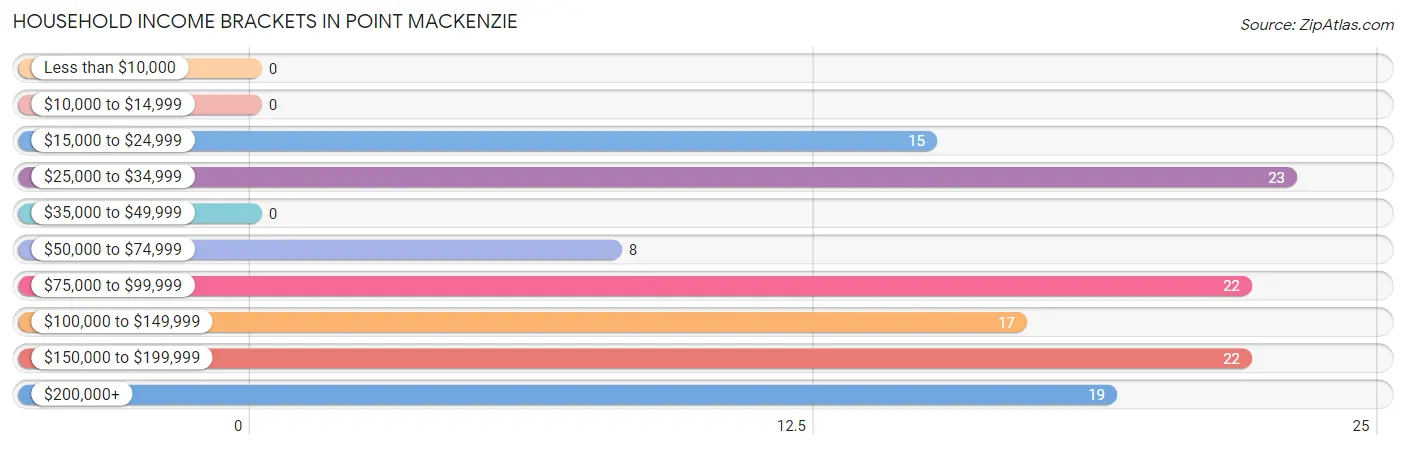
| Income Bracket | # Households | % Households |
| Less than $10,000 | 0 | 0.0% |
| $10,000 to $14,999 | 0 | 0.0% |
| $15,000 to $24,999 | 15 | 11.9% |
| $25,000 to $34,999 | 23 | 18.3% |
| $35,000 to $49,999 | 0 | 0.0% |
| $50,000 to $74,999 | 8 | 6.3% |
| $75,000 to $99,999 | 22 | 17.5% |
| $100,000 to $149,999 | 17 | 13.5% |
| $150,000 to $199,999 | 22 | 17.5% |
| $200,000+ | 19 | 15.1% |
Household Income by Householder Age in Point MacKenzie
The median household income in Point MacKenzie is $92,125, with the highest median household income of $91,625 found in the 45 to 64 years age bracket for the primary householder. A total of 88 households (69.8%) fall into this category.
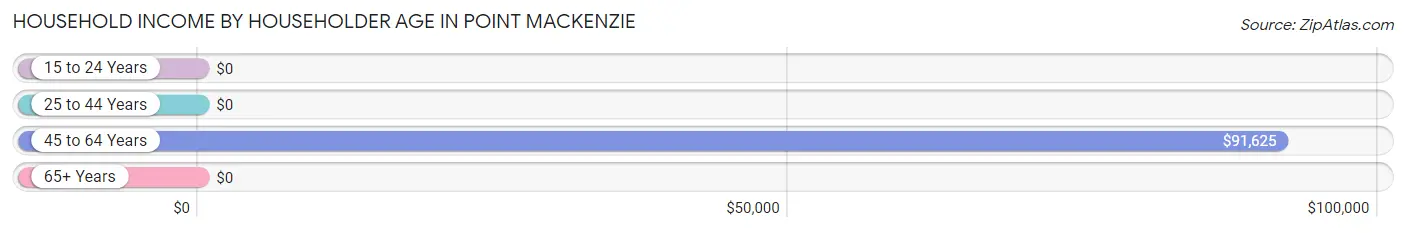
| Income Bracket | # Households | Median Income |
| 15 to 24 Years | 0 (0.0%) | $0 |
| 25 to 44 Years | 13 (10.3%) | $0 |
| 45 to 64 Years | 88 (69.8%) | $91,625 |
| 65+ Years | 25 (19.8%) | $0 |
| Total | 126 (100.0%) | $92,125 |
Poverty in Point MacKenzie
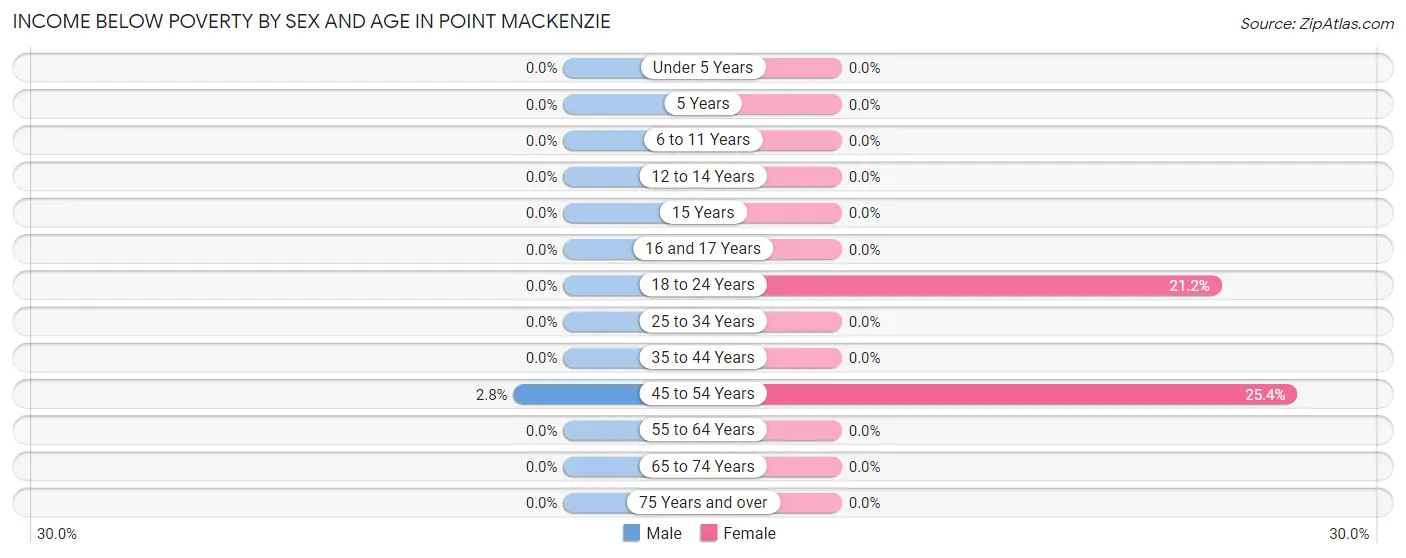
Income Below Poverty by Sex and Age in Point MacKenzie
With 0.5% poverty level for males and 10.6% for females among the residents of Point MacKenzie, 45 to 54 year old males and 45 to 54 year old females are the most vulnerable to poverty, with 1 males (2.8%) and 17 females (25.4%) in their respective age groups living below the poverty level.
| Age Bracket | Male | Female |
| Under 5 Years | 0 (0.0%) | 0 (0.0%) |
| 5 Years | 0 (0.0%) | 0 (0.0%) |
| 6 to 11 Years | 0 (0.0%) | 0 (0.0%) |
| 12 to 14 Years | 0 (0.0%) | 0 (0.0%) |
| 15 Years | 0 (0.0%) | 0 (0.0%) |
| 16 and 17 Years | 0 (0.0%) | 0 (0.0%) |
| 18 to 24 Years | 0 (0.0%) | 11 (21.1%) |
| 25 to 34 Years | 0 (0.0%) | 0 (0.0%) |
| 35 to 44 Years | 0 (0.0%) | 0 (0.0%) |
| 45 to 54 Years | 1 (2.8%) | 17 (25.4%) |
| 55 to 64 Years | 0 (0.0%) | 0 (0.0%) |
| 65 to 74 Years | 0 (0.0%) | 0 (0.0%) |
| 75 Years and over | 0 (0.0%) | 0 (0.0%) |
| Total | 1 (0.5%) | 28 (10.6%) |
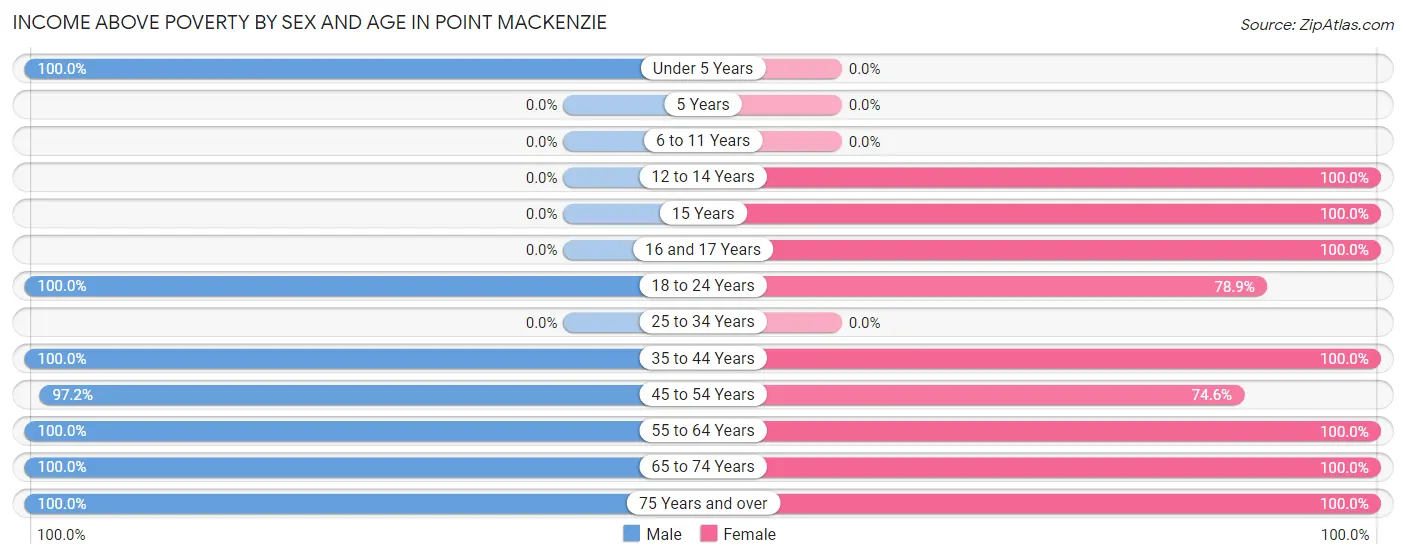
Income Above Poverty by Sex and Age in Point MacKenzie
According to the poverty statistics in Point MacKenzie, males aged under 5 years and females aged 12 to 14 years are the age groups that are most secure financially, with 100.0% of males and 100.0% of females in these age groups living above the poverty line.
| Age Bracket | Male | Female |
| Under 5 Years | 11 (100.0%) | 0 (0.0%) |
| 5 Years | 0 (0.0%) | 0 (0.0%) |
| 6 to 11 Years | 0 (0.0%) | 0 (0.0%) |
| 12 to 14 Years | 0 (0.0%) | 19 (100.0%) |
| 15 Years | 0 (0.0%) | 58 (100.0%) |
| 16 and 17 Years | 0 (0.0%) | 19 (100.0%) |
| 18 to 24 Years | 32 (100.0%) | 41 (78.8%) |
| 25 to 34 Years | 0 (0.0%) | 0 (0.0%) |
| 35 to 44 Years | 17 (100.0%) | 12 (100.0%) |
| 45 to 54 Years | 35 (97.2%) | 50 (74.6%) |
| 55 to 64 Years | 65 (100.0%) | 18 (100.0%) |
| 65 to 74 Years | 21 (100.0%) | 3 (100.0%) |
| 75 Years and over | 18 (100.0%) | 15 (100.0%) |
| Total | 199 (99.5%) | 235 (89.3%) |
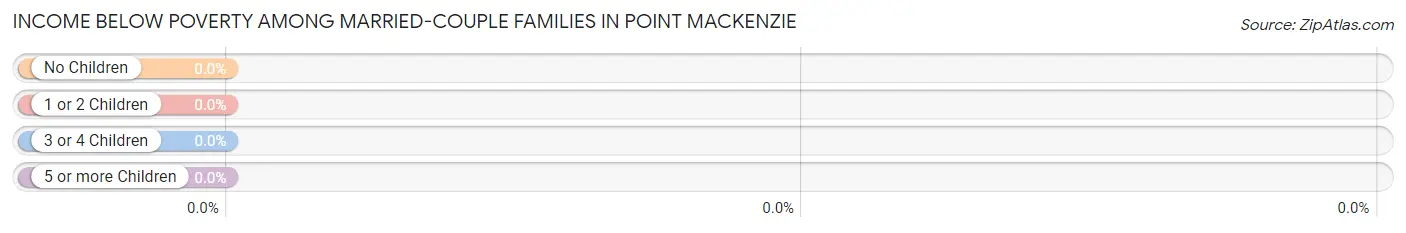
Income Below Poverty Among Married-Couple Families in Point MacKenzie
| Children | Above Poverty | Below Poverty |
| No Children | 36 (100.0%) | 0 (0.0%) |
| 1 or 2 Children | 25 (100.0%) | 0 (0.0%) |
| 3 or 4 Children | 20 (100.0%) | 0 (0.0%) |
| 5 or more Children | 0 (0.0%) | 0 (0.0%) |
| Total | 81 (100.0%) | 0 (0.0%) |
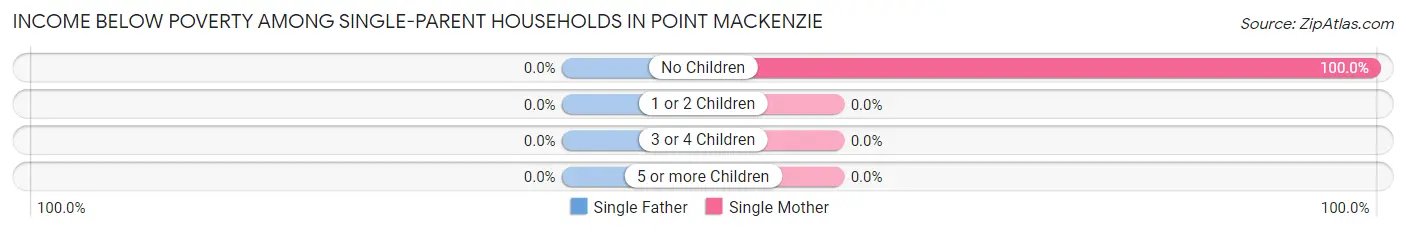
Income Below Poverty Among Single-Parent Households in Point MacKenzie
| Children | Single Father | Single Mother |
| No Children | 0 (0.0%) | 17 (100.0%) |
| 1 or 2 Children | 0 (0.0%) | 0 (0.0%) |
| 3 or 4 Children | 0 (0.0%) | 0 (0.0%) |
| 5 or more Children | 0 (0.0%) | 0 (0.0%) |
| Total | 0 (0.0%) | 17 (100.0%) |
Income Below Poverty Among Married-Couple vs Single-Parent Households in Point MacKenzie
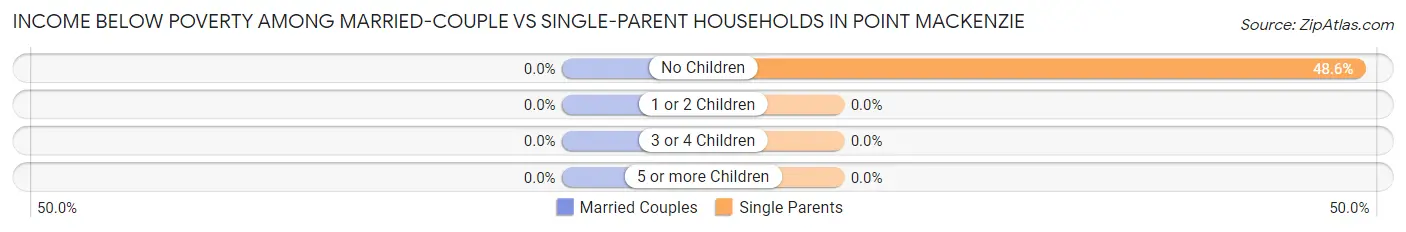
| Children | Married-Couple Families | Single-Parent Households |
| No Children | 0 (0.0%) | 17 (48.6%) |
| 1 or 2 Children | 0 (0.0%) | 0 (0.0%) |
| 3 or 4 Children | 0 (0.0%) | 0 (0.0%) |
| 5 or more Children | 0 (0.0%) | 0 (0.0%) |
| Total | 0 (0.0%) | 17 (48.6%) |
Employment Characteristics in Point MacKenzie
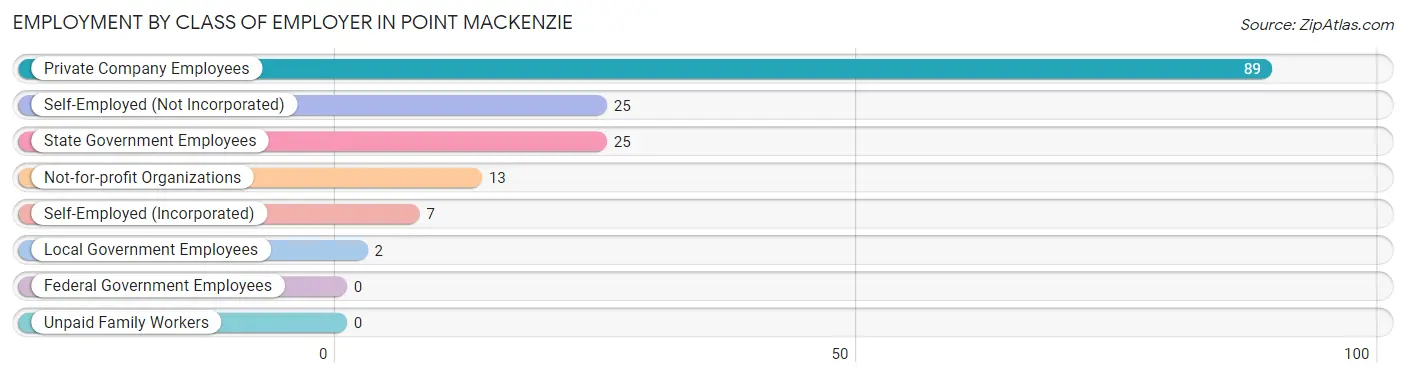
Employment by Class of Employer in Point MacKenzie
Among the 161 employed individuals in Point MacKenzie, private company employees (89 | 55.3%), self-employed (not incorporated) (25 | 15.5%), and state government employees (25 | 15.5%) make up the most common classes of employment.
| Employer Class | # Employees | % Employees |
| Private Company Employees | 89 | 55.3% |
| Self-Employed (Incorporated) | 7 | 4.3% |
| Self-Employed (Not Incorporated) | 25 | 15.5% |
| Not-for-profit Organizations | 13 | 8.1% |
| Local Government Employees | 2 | 1.2% |
| State Government Employees | 25 | 15.5% |
| Federal Government Employees | 0 | 0.0% |
| Unpaid Family Workers | 0 | 0.0% |
| Total | 161 | 100.0% |
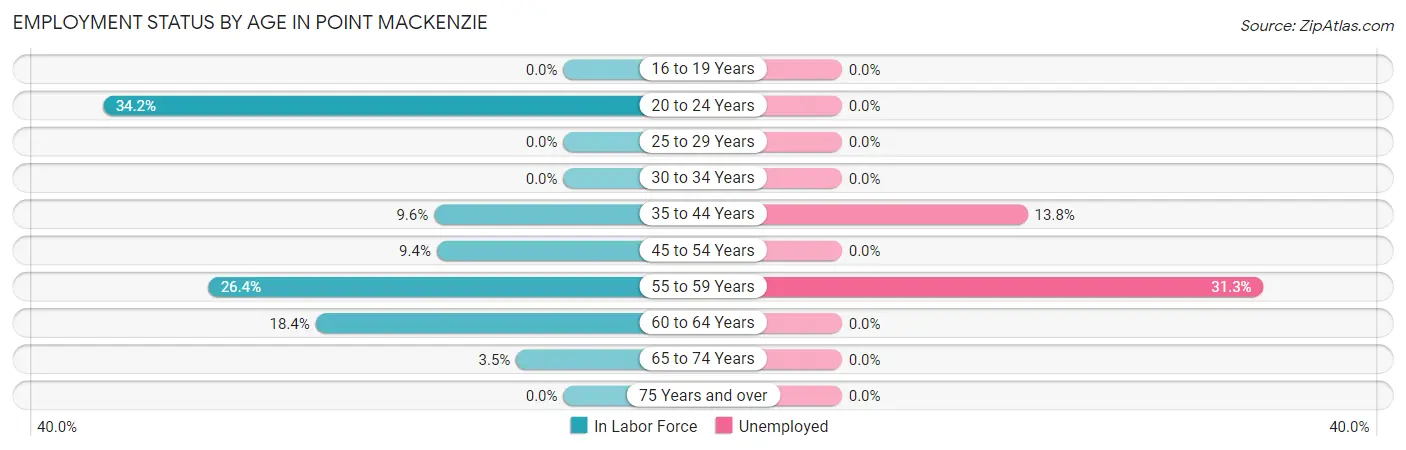
Employment Status by Age in Point MacKenzie
According to the labor force statistics for Point MacKenzie, out of the total population over 16 years of age (1,619), 11.9% or 193 individuals are in the labor force, with 7.3% or 14 of them unemployed. The age group with the highest labor force participation rate is 20 to 24 years, with 34.2% or 55 individuals in the labor force. Within the labor force, the 55 to 59 years age range has the highest percentage of unemployed individuals, with 31.3% or 10 of them being unemployed.
| Age Bracket | In Labor Force | Unemployed |
| 16 to 19 Years | 0 (0.0%) | 0 (0.0%) |
| 20 to 24 Years | 55 (34.2%) | 0 (0.0%) |
| 25 to 29 Years | 0 (0.0%) | 0 (0.0%) |
| 30 to 34 Years | 0 (0.0%) | 0 (0.0%) |
| 35 to 44 Years | 29 (9.6%) | 4 (13.8%) |
| 45 to 54 Years | 48 (9.4%) | 0 (0.0%) |
| 55 to 59 Years | 32 (26.4%) | 10 (31.3%) |
| 60 to 64 Years | 26 (18.4%) | 0 (0.0%) |
| 65 to 74 Years | 2 (3.5%) | 0 (0.0%) |
| 75 Years and over | 0 (0.0%) | 0 (0.0%) |
| Total | 193 (11.9%) | 14 (7.3%) |
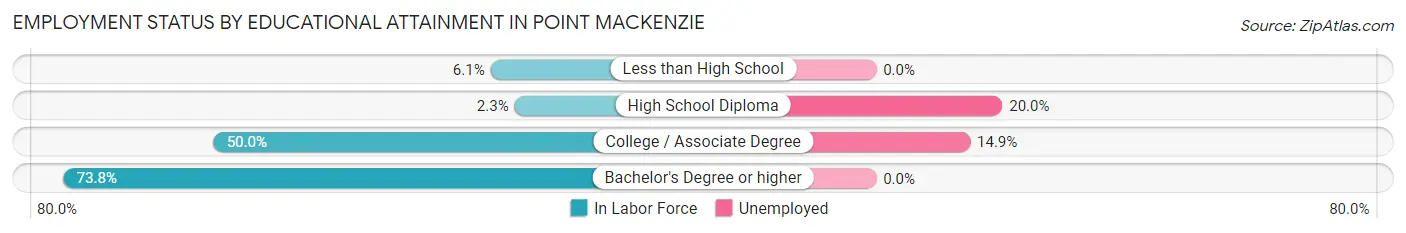
Employment Status by Educational Attainment in Point MacKenzie
According to labor force statistics for Point MacKenzie, 10.2% of individuals (135) out of the total population between 25 and 64 years of age (1,320) are in the labor force, with 10.4% or 14 of them being unemployed. The group with the highest labor force participation rate are those with the educational attainment of bachelor's degree or higher, with 73.8% or 31 individuals in the labor force. Within the labor force, individuals with high school diploma education have the highest percentage of unemployment, with 20.0% or 4 of them being unemployed.
| Educational Attainment | In Labor Force | Unemployed |
| Less than High School | 17 (6.1%) | 0 (0.0%) |
| High School Diploma | 20 (2.3%) | 173 (20.0%) |
| College / Associate Degree | 67 (50.0%) | 20 (14.9%) |
| Bachelor's Degree or higher | 31 (73.8%) | 0 (0.0%) |
| Total | 135 (10.2%) | 137 (10.4%) |
Employment Occupations by Sex in Point MacKenzie
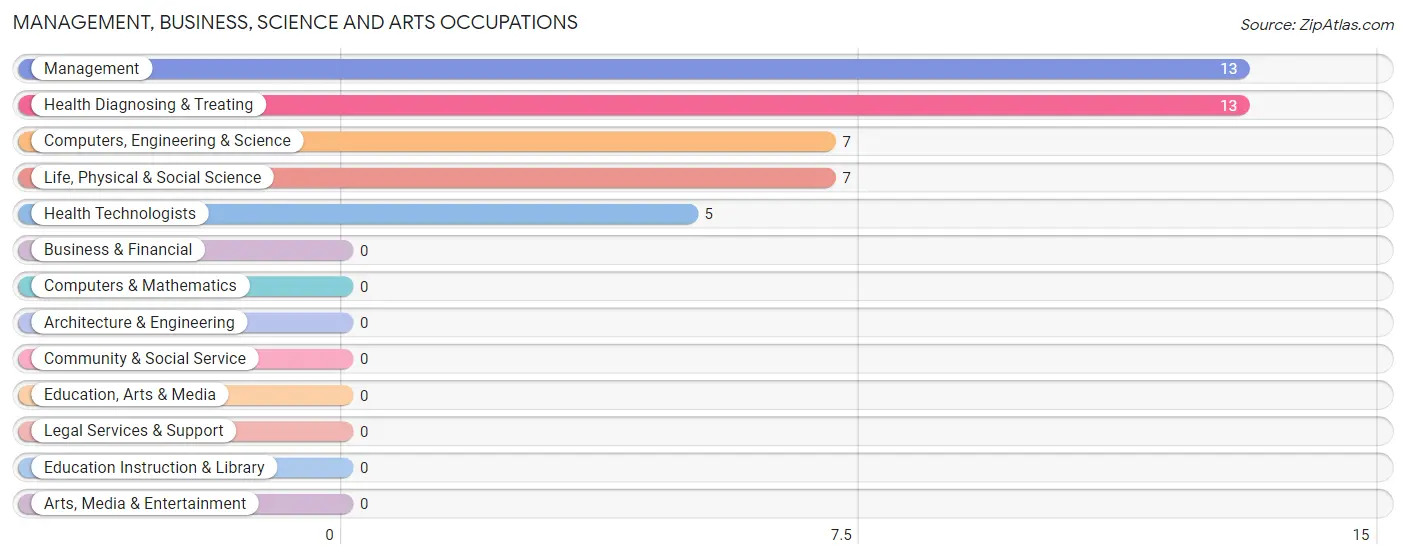
Management, Business, Science and Arts Occupations
The most common Management, Business, Science and Arts occupations in Point MacKenzie are Management (13 | 7.3%), Health Diagnosing & Treating (13 | 7.3%), Computers, Engineering & Science (7 | 3.9%), Life, Physical & Social Science (7 | 3.9%), and Health Technologists (5 | 2.8%).
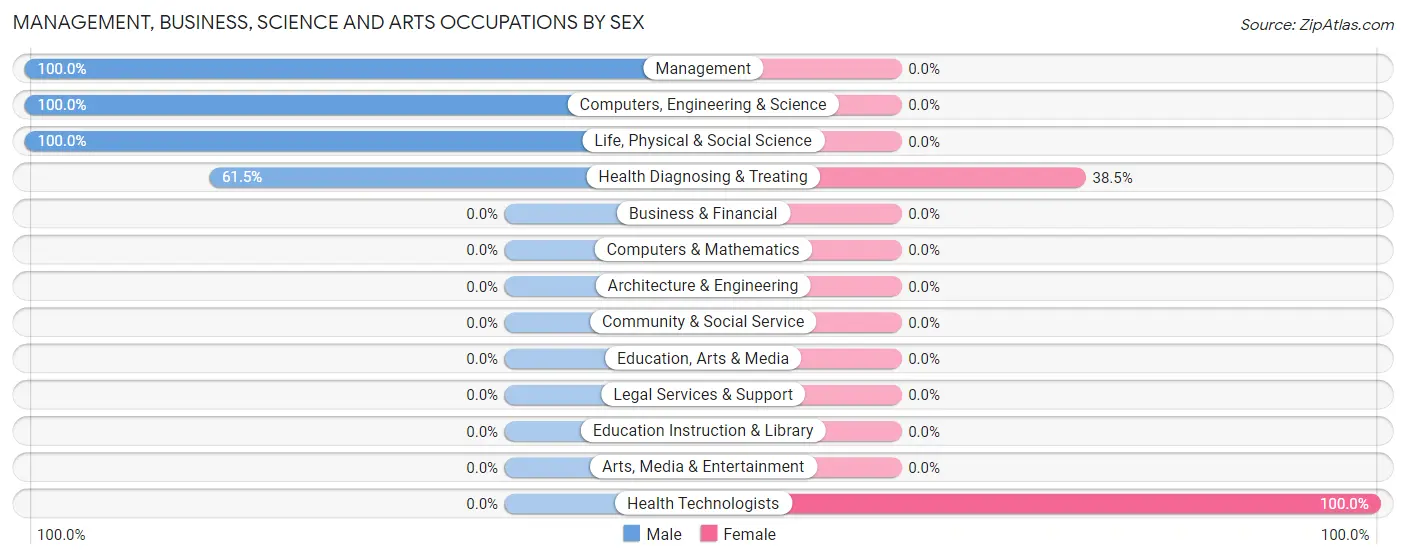
Management, Business, Science and Arts Occupations by Sex
Within the Management, Business, Science and Arts occupations in Point MacKenzie, the most male-oriented occupations are Management (100.0%), Computers, Engineering & Science (100.0%), and Life, Physical & Social Science (100.0%), while the most female-oriented occupations are Health Technologists (100.0%), and Health Diagnosing & Treating (38.5%).
| Occupation | Male | Female |
| Management | 13 (100.0%) | 0 (0.0%) |
| Business & Financial | 0 (0.0%) | 0 (0.0%) |
| Computers, Engineering & Science | 7 (100.0%) | 0 (0.0%) |
| Computers & Mathematics | 0 (0.0%) | 0 (0.0%) |
| Architecture & Engineering | 0 (0.0%) | 0 (0.0%) |
| Life, Physical & Social Science | 7 (100.0%) | 0 (0.0%) |
| Community & Social Service | 0 (0.0%) | 0 (0.0%) |
| Education, Arts & Media | 0 (0.0%) | 0 (0.0%) |
| Legal Services & Support | 0 (0.0%) | 0 (0.0%) |
| Education Instruction & Library | 0 (0.0%) | 0 (0.0%) |
| Arts, Media & Entertainment | 0 (0.0%) | 0 (0.0%) |
| Health Diagnosing & Treating | 8 (61.5%) | 5 (38.5%) |
| Health Technologists | 0 (0.0%) | 5 (100.0%) |
| Total (Category) | 28 (84.9%) | 5 (15.1%) |
| Total (Overall) | 125 (70.2%) | 53 (29.8%) |
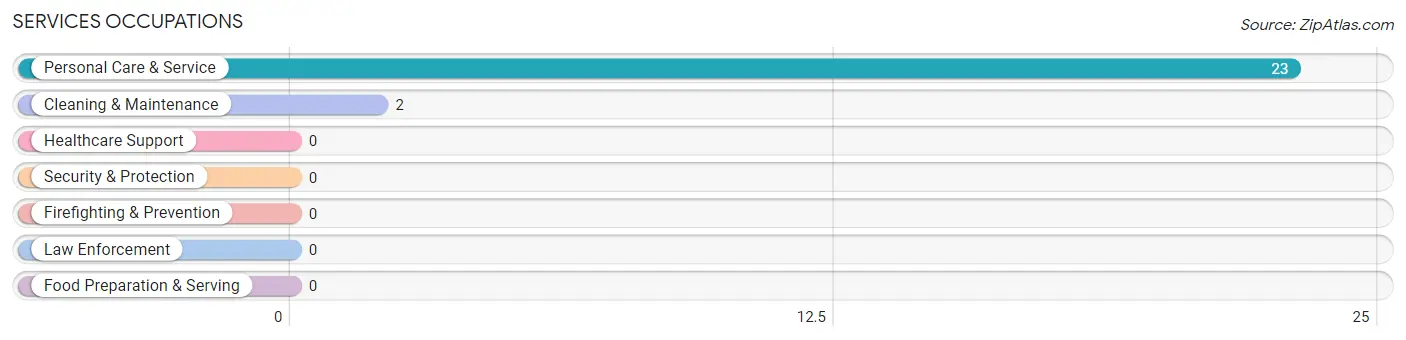
Services Occupations
The most common Services occupations in Point MacKenzie are Personal Care & Service (23 | 12.9%), and Cleaning & Maintenance (2 | 1.1%).
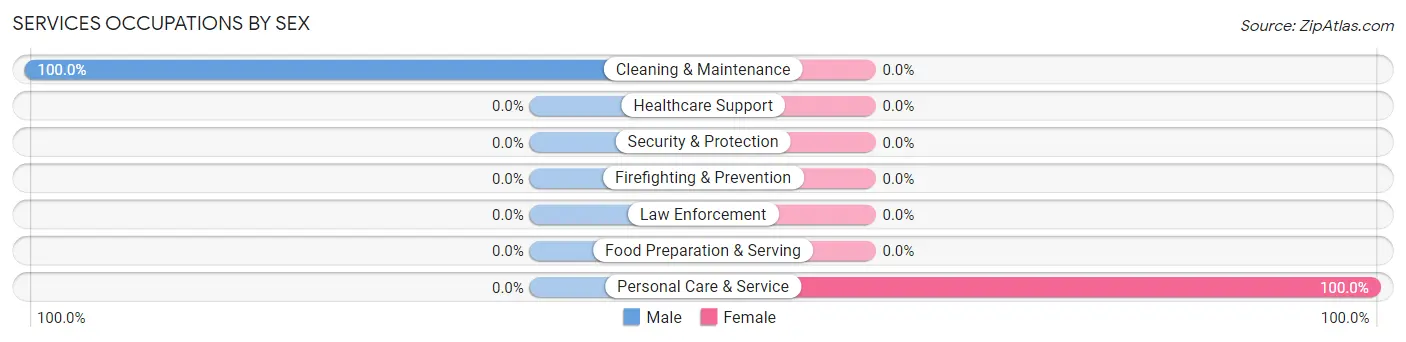
Services Occupations by Sex
| Occupation | Male | Female |
| Healthcare Support | 0 (0.0%) | 0 (0.0%) |
| Security & Protection | 0 (0.0%) | 0 (0.0%) |
| Firefighting & Prevention | 0 (0.0%) | 0 (0.0%) |
| Law Enforcement | 0 (0.0%) | 0 (0.0%) |
| Food Preparation & Serving | 0 (0.0%) | 0 (0.0%) |
| Cleaning & Maintenance | 2 (100.0%) | 0 (0.0%) |
| Personal Care & Service | 0 (0.0%) | 23 (100.0%) |
| Total (Category) | 2 (8.0%) | 23 (92.0%) |
| Total (Overall) | 125 (70.2%) | 53 (29.8%) |
Sales and Office Occupations
The most common Sales and Office occupations in Point MacKenzie are Office & Administration (18 | 10.1%), and Sales & Related (14 | 7.9%).

Sales and Office Occupations by Sex

| Occupation | Male | Female |
| Sales & Related | 7 (50.0%) | 7 (50.0%) |
| Office & Administration | 0 (0.0%) | 18 (100.0%) |
| Total (Category) | 7 (21.9%) | 25 (78.1%) |
| Total (Overall) | 125 (70.2%) | 53 (29.8%) |
Natural Resources, Construction and Maintenance Occupations
The most common Natural Resources, Construction and Maintenance occupations in Point MacKenzie are , and Construction & Extraction (23 | 12.9%).
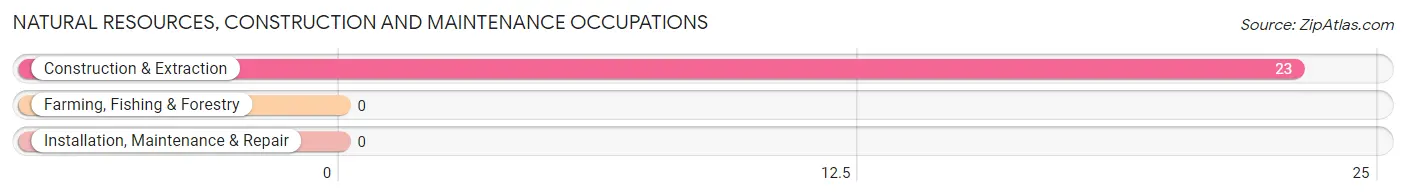
Natural Resources, Construction and Maintenance Occupations by Sex
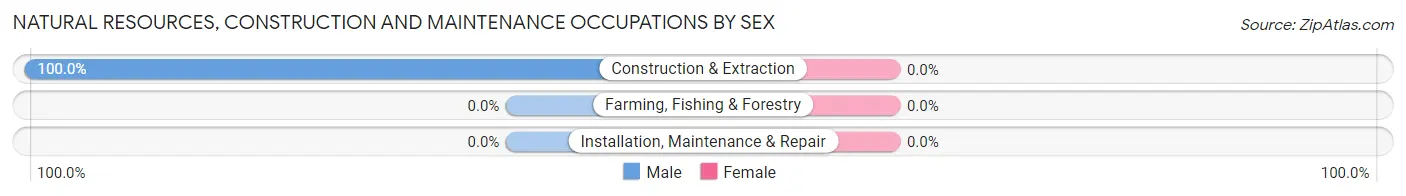
| Occupation | Male | Female |
| Farming, Fishing & Forestry | 0 (0.0%) | 0 (0.0%) |
| Construction & Extraction | 23 (100.0%) | 0 (0.0%) |
| Installation, Maintenance & Repair | 0 (0.0%) | 0 (0.0%) |
| Total (Category) | 23 (100.0%) | 0 (0.0%) |
| Total (Overall) | 125 (70.2%) | 53 (29.8%) |
Production, Transportation and Moving Occupations
The most common Production, Transportation and Moving occupations in Point MacKenzie are , and Production (65 | 36.5%).
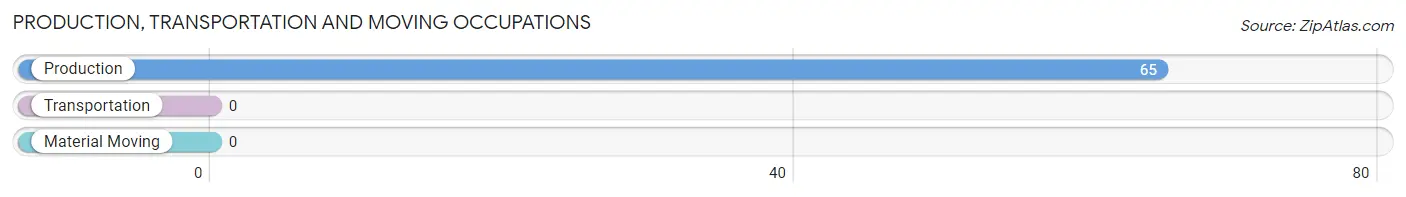
Production, Transportation and Moving Occupations by Sex
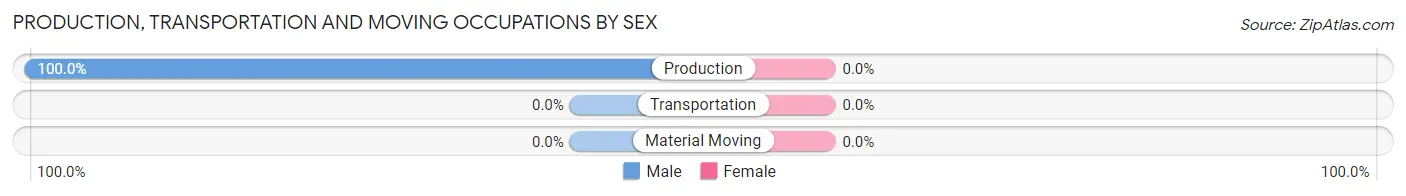
| Occupation | Male | Female |
| Production | 65 (100.0%) | 0 (0.0%) |
| Transportation | 0 (0.0%) | 0 (0.0%) |
| Material Moving | 0 (0.0%) | 0 (0.0%) |
| Total (Category) | 65 (100.0%) | 0 (0.0%) |
| Total (Overall) | 125 (70.2%) | 53 (29.8%) |
Employment Industries by Sex in Point MacKenzie
Employment Industries in Point MacKenzie
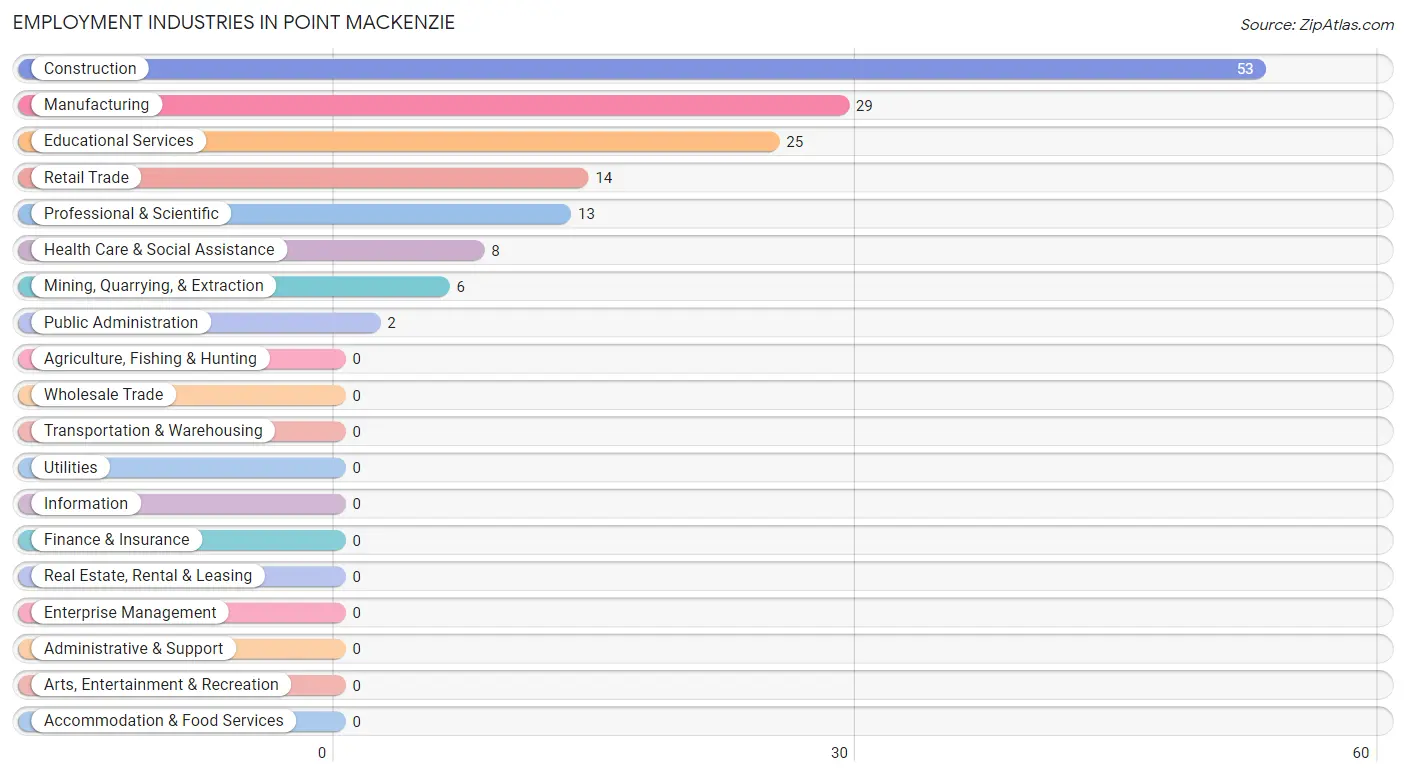
The major employment industries in Point MacKenzie include Construction (53 | 29.8%), Manufacturing (29 | 16.3%), Educational Services (25 | 14.0%), Retail Trade (14 | 7.9%), and Professional & Scientific (13 | 7.3%).
Employment Industries by Sex in Point MacKenzie
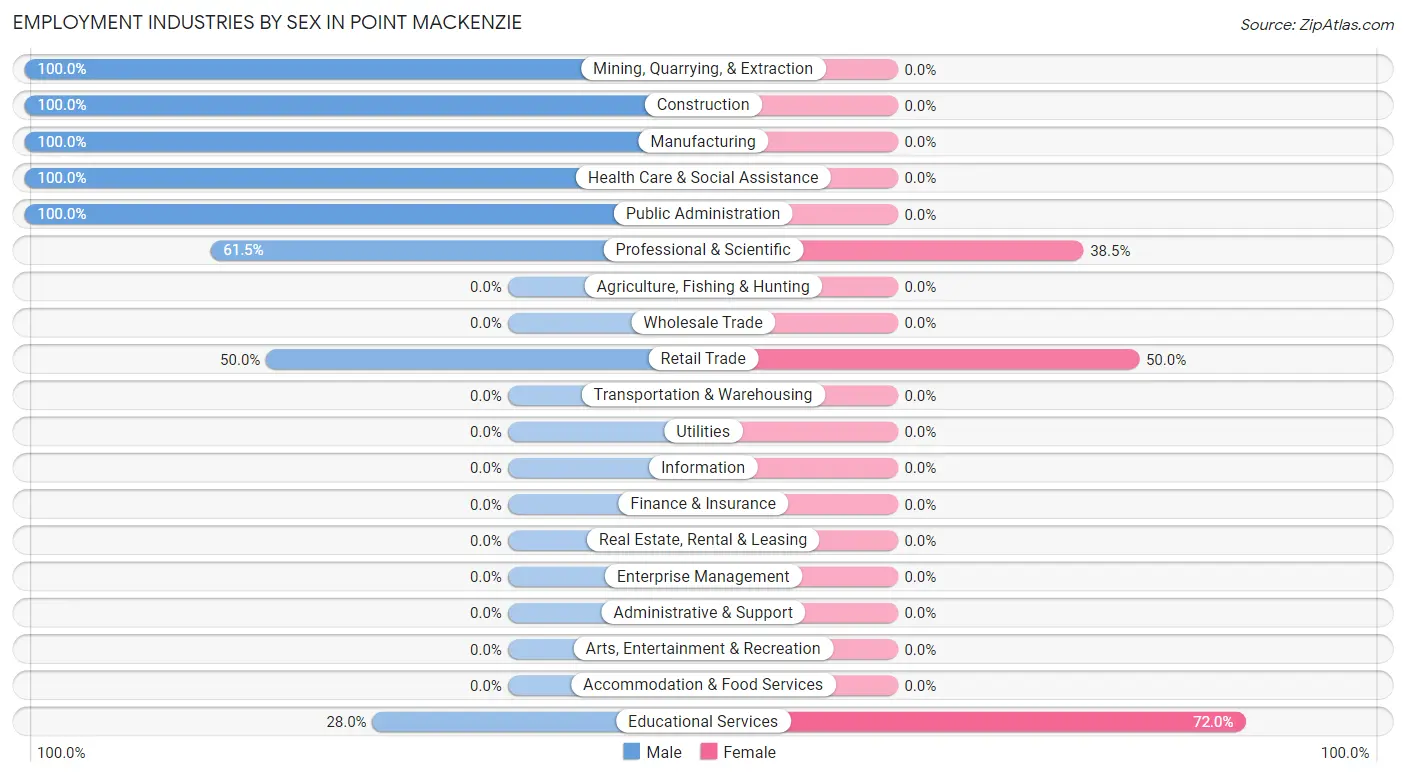
The Point MacKenzie industries that see more men than women are Mining, Quarrying, & Extraction (100.0%), Construction (100.0%), and Manufacturing (100.0%), whereas the industries that tend to have a higher number of women are Educational Services (72.0%), Retail Trade (50.0%), and Professional & Scientific (38.5%).
| Industry | Male | Female |
| Agriculture, Fishing & Hunting | 0 (0.0%) | 0 (0.0%) |
| Mining, Quarrying, & Extraction | 6 (100.0%) | 0 (0.0%) |
| Construction | 53 (100.0%) | 0 (0.0%) |
| Manufacturing | 29 (100.0%) | 0 (0.0%) |
| Wholesale Trade | 0 (0.0%) | 0 (0.0%) |
| Retail Trade | 7 (50.0%) | 7 (50.0%) |
| Transportation & Warehousing | 0 (0.0%) | 0 (0.0%) |
| Utilities | 0 (0.0%) | 0 (0.0%) |
| Information | 0 (0.0%) | 0 (0.0%) |
| Finance & Insurance | 0 (0.0%) | 0 (0.0%) |
| Real Estate, Rental & Leasing | 0 (0.0%) | 0 (0.0%) |
| Professional & Scientific | 8 (61.5%) | 5 (38.5%) |
| Enterprise Management | 0 (0.0%) | 0 (0.0%) |
| Administrative & Support | 0 (0.0%) | 0 (0.0%) |
| Educational Services | 7 (28.0%) | 18 (72.0%) |
| Health Care & Social Assistance | 8 (100.0%) | 0 (0.0%) |
| Arts, Entertainment & Recreation | 0 (0.0%) | 0 (0.0%) |
| Accommodation & Food Services | 0 (0.0%) | 0 (0.0%) |
| Public Administration | 2 (100.0%) | 0 (0.0%) |
| Total | 125 (70.2%) | 53 (29.8%) |
Education in Point MacKenzie
School Enrollment in Point MacKenzie
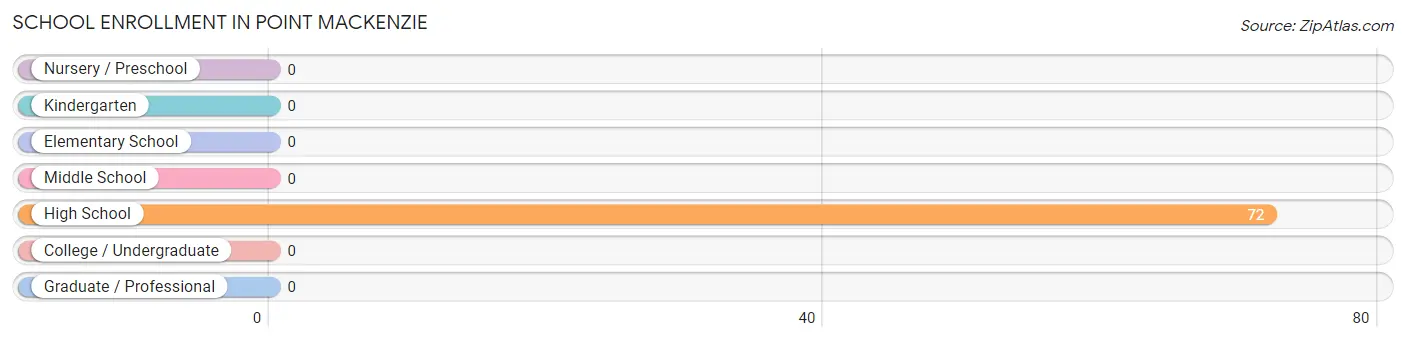
| School Level | # Students | % Students |
| Nursery / Preschool | 0 | 0.0% |
| Kindergarten | 0 | 0.0% |
| Elementary School | 0 | 0.0% |
| Middle School | 0 | 0.0% |
| High School | 72 | 100.0% |
| College / Undergraduate | 0 | 0.0% |
| Graduate / Professional | 0 | 0.0% |
| Total | 72 | 100.0% |
School Enrollment by Age by Funding Source in Point MacKenzie
Out of a total of 72 students who are enrolled in schools in Point MacKenzie, 57 (79.2%) attend a private institution, while the remaining 15 (20.8%) are enrolled in public schools. The age group of 15 to 17 year olds has the highest likelihood of being enrolled in private schools, with 57 (100.0% in the age bracket) enrolled. Conversely, the age group of 35 years and over has the lowest likelihood of being enrolled in a private school, with 15 (100.0% in the age bracket) attending a public institution.
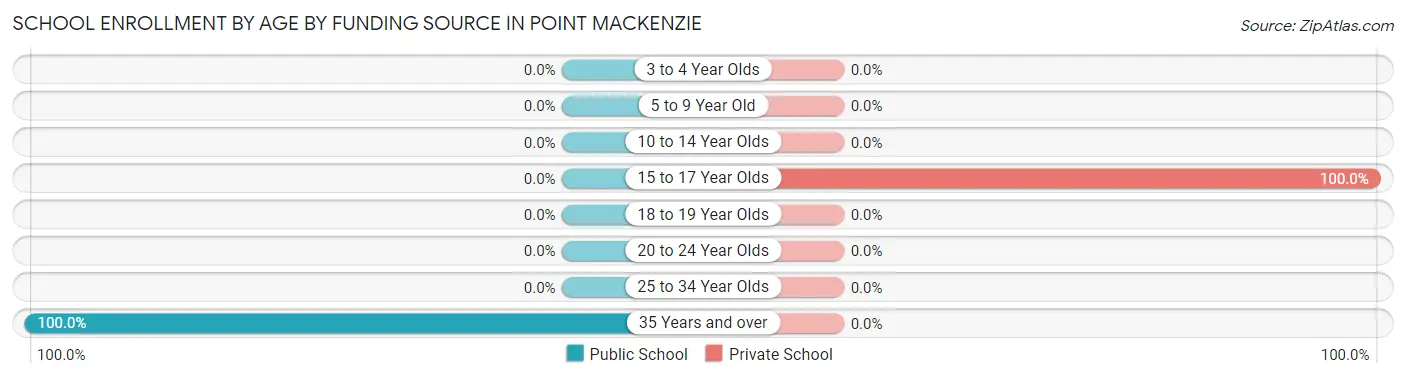
| Age Bracket | Public School | Private School |
| 3 to 4 Year Olds | 0 (0.0%) | 0 (0.0%) |
| 5 to 9 Year Old | 0 (0.0%) | 0 (0.0%) |
| 10 to 14 Year Olds | 0 (0.0%) | 0 (0.0%) |
| 15 to 17 Year Olds | 0 (0.0%) | 57 (100.0%) |
| 18 to 19 Year Olds | 0 (0.0%) | 0 (0.0%) |
| 20 to 24 Year Olds | 0 (0.0%) | 0 (0.0%) |
| 25 to 34 Year Olds | 0 (0.0%) | 0 (0.0%) |
| 35 Years and over | 15 (100.0%) | 0 (0.0%) |
| Total | 15 (20.8%) | 57 (79.2%) |
Educational Attainment by Field of Study in Point MacKenzie
Business (11 | 23.4%), engineering (8 | 17.0%), psychology (7 | 14.9%), social sciences (6 | 12.8%), and bio, nature & agricultural (5 | 10.6%) are the most common fields of study among 47 individuals in Point MacKenzie who have obtained a bachelor's degree or higher.
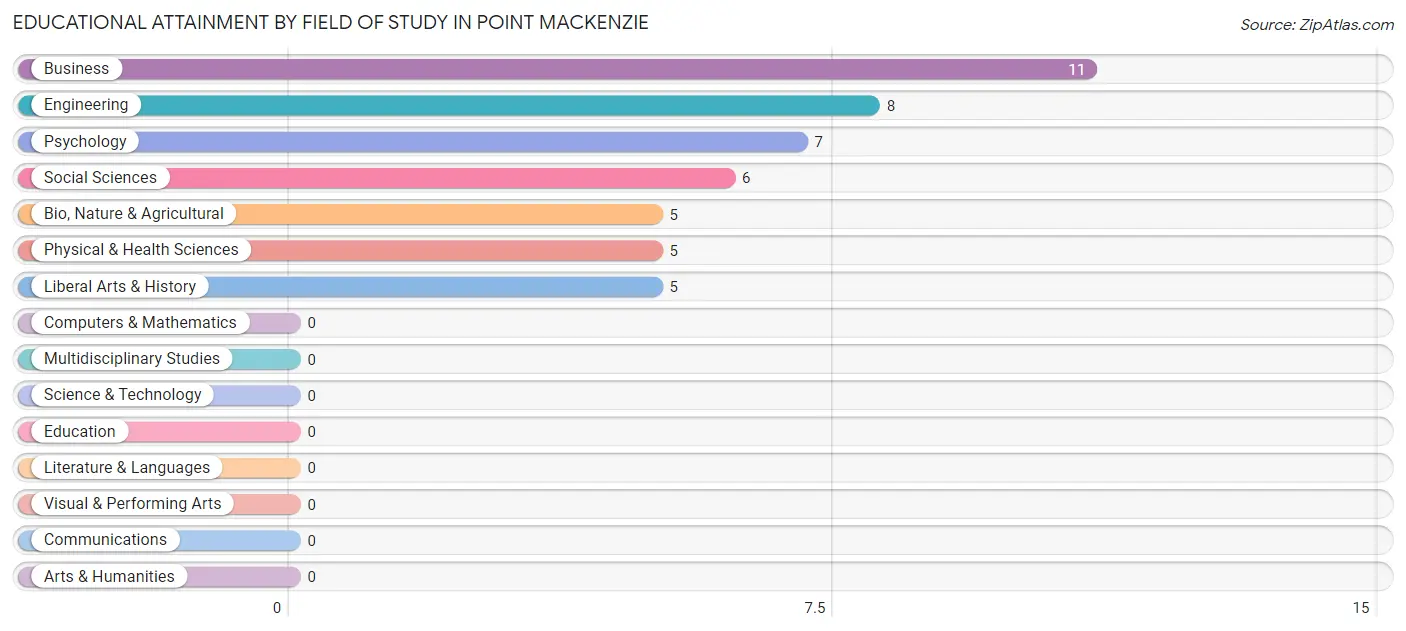
| Field of Study | # Graduates | % Graduates |
| Computers & Mathematics | 0 | 0.0% |
| Bio, Nature & Agricultural | 5 | 10.6% |
| Physical & Health Sciences | 5 | 10.6% |
| Psychology | 7 | 14.9% |
| Social Sciences | 6 | 12.8% |
| Engineering | 8 | 17.0% |
| Multidisciplinary Studies | 0 | 0.0% |
| Science & Technology | 0 | 0.0% |
| Business | 11 | 23.4% |
| Education | 0 | 0.0% |
| Literature & Languages | 0 | 0.0% |
| Liberal Arts & History | 5 | 10.6% |
| Visual & Performing Arts | 0 | 0.0% |
| Communications | 0 | 0.0% |
| Arts & Humanities | 0 | 0.0% |
| Total | 47 | 100.0% |
Transportation & Commute in Point MacKenzie
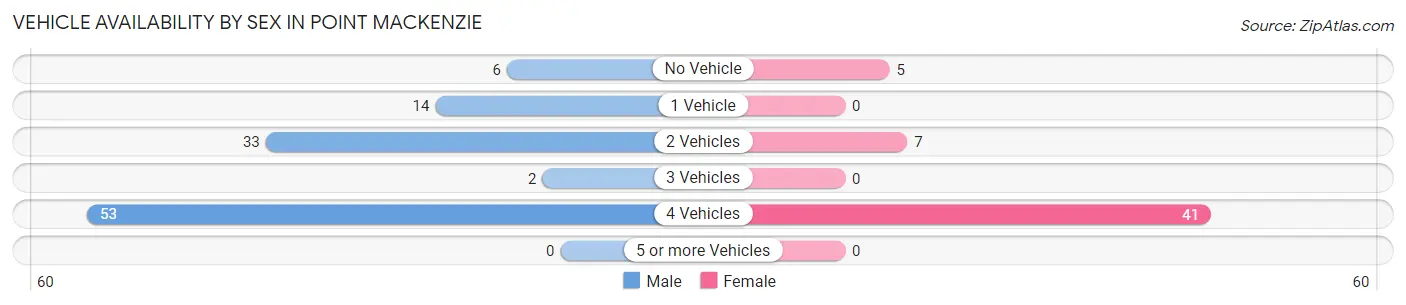
Vehicle Availability by Sex in Point MacKenzie
The most prevalent vehicle ownership categories in Point MacKenzie are males with 4 vehicles (53, accounting for 49.1%) and females with 4 vehicles (41, making up 100.0%).
| Vehicles Available | Male | Female |
| No Vehicle | 6 (5.6%) | 5 (9.4%) |
| 1 Vehicle | 14 (13.0%) | 0 (0.0%) |
| 2 Vehicles | 33 (30.6%) | 7 (13.2%) |
| 3 Vehicles | 2 (1.8%) | 0 (0.0%) |
| 4 Vehicles | 53 (49.1%) | 41 (77.4%) |
| 5 or more Vehicles | 0 (0.0%) | 0 (0.0%) |
| Total | 108 (100.0%) | 53 (100.0%) |
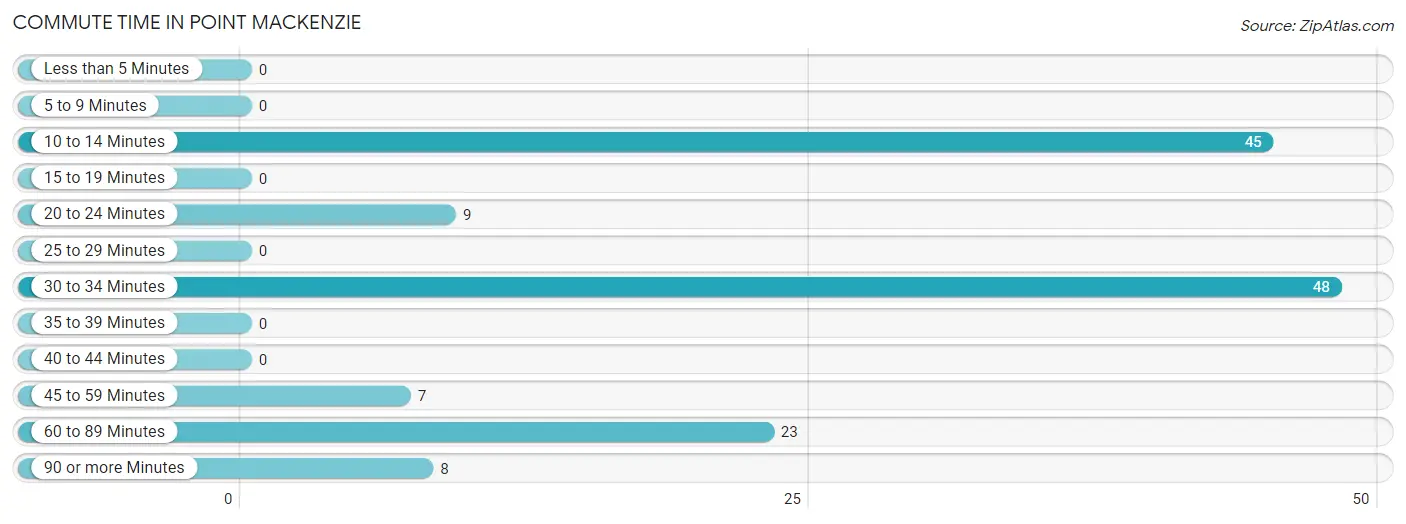
Commute Time in Point MacKenzie
The most frequently occuring commute durations in Point MacKenzie are 30 to 34 minutes (48 commuters, 34.3%), 10 to 14 minutes (45 commuters, 32.1%), and 60 to 89 minutes (23 commuters, 16.4%).
| Commute Time | # Commuters | % Commuters |
| Less than 5 Minutes | 0 | 0.0% |
| 5 to 9 Minutes | 0 | 0.0% |
| 10 to 14 Minutes | 45 | 32.1% |
| 15 to 19 Minutes | 0 | 0.0% |
| 20 to 24 Minutes | 9 | 6.4% |
| 25 to 29 Minutes | 0 | 0.0% |
| 30 to 34 Minutes | 48 | 34.3% |
| 35 to 39 Minutes | 0 | 0.0% |
| 40 to 44 Minutes | 0 | 0.0% |
| 45 to 59 Minutes | 7 | 5.0% |
| 60 to 89 Minutes | 23 | 16.4% |
| 90 or more Minutes | 8 | 5.7% |
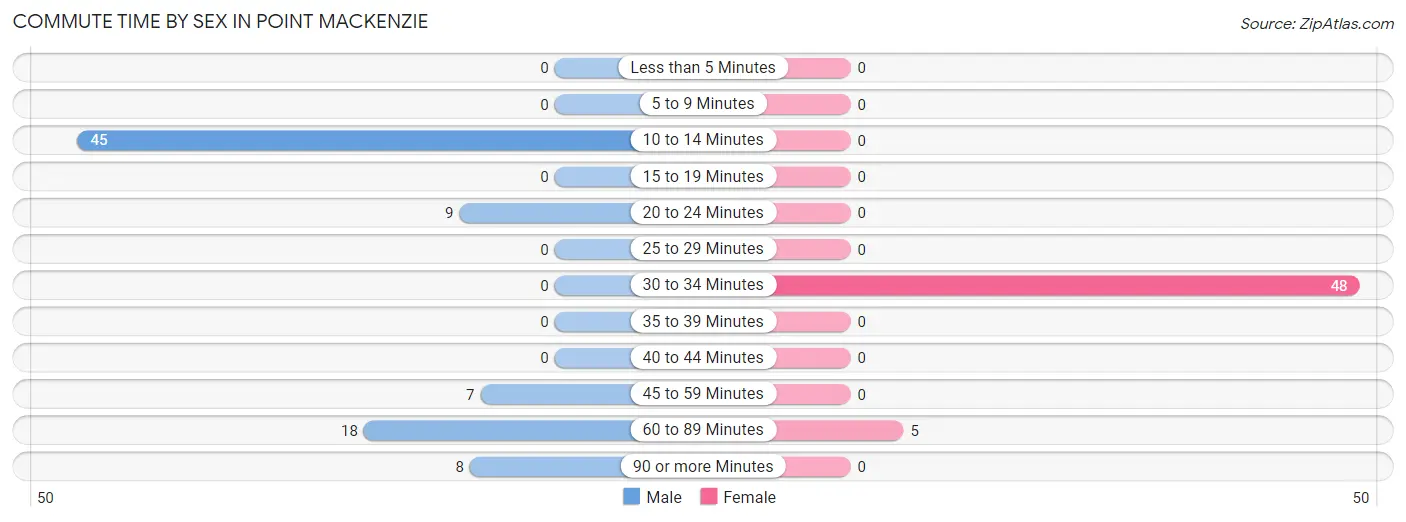
Commute Time by Sex in Point MacKenzie
The most common commute times in Point MacKenzie are 10 to 14 minutes (45 commuters, 51.7%) for males and 30 to 34 minutes (48 commuters, 90.6%) for females.
| Commute Time | Male | Female |
| Less than 5 Minutes | 0 (0.0%) | 0 (0.0%) |
| 5 to 9 Minutes | 0 (0.0%) | 0 (0.0%) |
| 10 to 14 Minutes | 45 (51.7%) | 0 (0.0%) |
| 15 to 19 Minutes | 0 (0.0%) | 0 (0.0%) |
| 20 to 24 Minutes | 9 (10.3%) | 0 (0.0%) |
| 25 to 29 Minutes | 0 (0.0%) | 0 (0.0%) |
| 30 to 34 Minutes | 0 (0.0%) | 48 (90.6%) |
| 35 to 39 Minutes | 0 (0.0%) | 0 (0.0%) |
| 40 to 44 Minutes | 0 (0.0%) | 0 (0.0%) |
| 45 to 59 Minutes | 7 (8.1%) | 0 (0.0%) |
| 60 to 89 Minutes | 18 (20.7%) | 5 (9.4%) |
| 90 or more Minutes | 8 (9.2%) | 0 (0.0%) |
Time of Departure to Work by Sex in Point MacKenzie
The most frequent times of departure to work in Point MacKenzie are 6:30 AM to 6:59 AM (25, 28.7%) for males and 8:00 AM to 8:29 AM (41, 77.4%) for females.
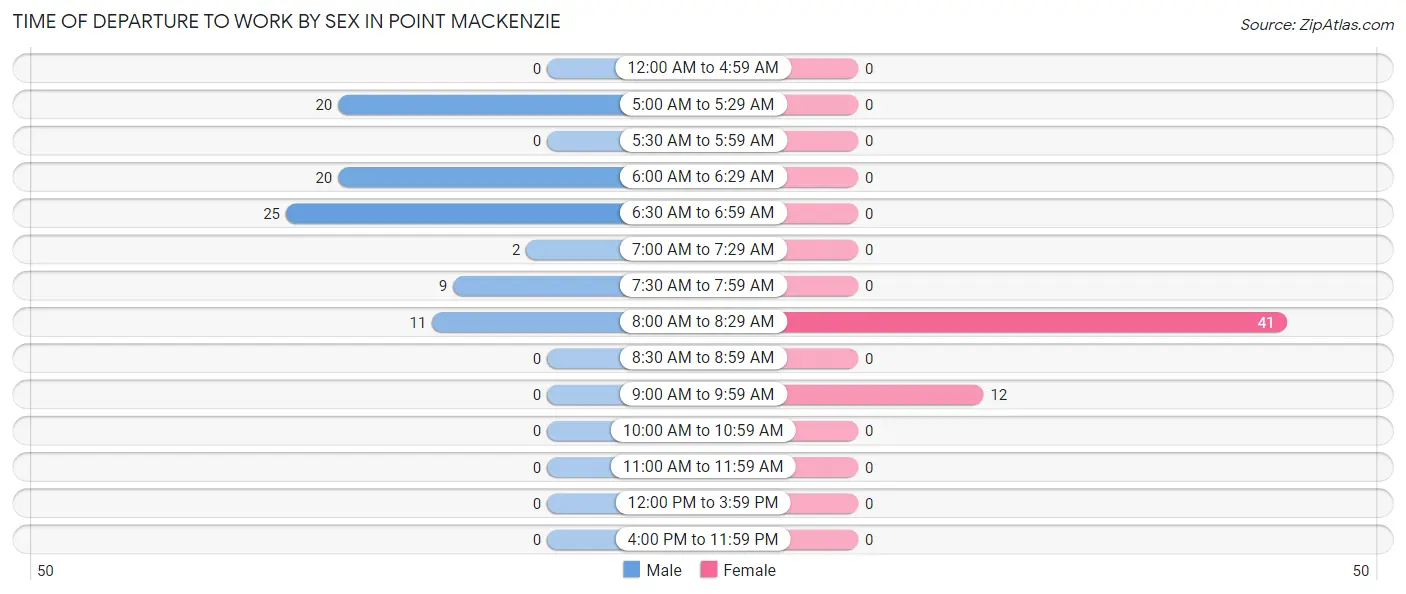
| Time of Departure | Male | Female |
| 12:00 AM to 4:59 AM | 0 (0.0%) | 0 (0.0%) |
| 5:00 AM to 5:29 AM | 20 (23.0%) | 0 (0.0%) |
| 5:30 AM to 5:59 AM | 0 (0.0%) | 0 (0.0%) |
| 6:00 AM to 6:29 AM | 20 (23.0%) | 0 (0.0%) |
| 6:30 AM to 6:59 AM | 25 (28.7%) | 0 (0.0%) |
| 7:00 AM to 7:29 AM | 2 (2.3%) | 0 (0.0%) |
| 7:30 AM to 7:59 AM | 9 (10.3%) | 0 (0.0%) |
| 8:00 AM to 8:29 AM | 11 (12.6%) | 41 (77.4%) |
| 8:30 AM to 8:59 AM | 0 (0.0%) | 0 (0.0%) |
| 9:00 AM to 9:59 AM | 0 (0.0%) | 12 (22.6%) |
| 10:00 AM to 10:59 AM | 0 (0.0%) | 0 (0.0%) |
| 11:00 AM to 11:59 AM | 0 (0.0%) | 0 (0.0%) |
| 12:00 PM to 3:59 PM | 0 (0.0%) | 0 (0.0%) |
| 4:00 PM to 11:59 PM | 0 (0.0%) | 0 (0.0%) |
| Total | 87 (100.0%) | 53 (100.0%) |
Housing Occupancy in Point MacKenzie
Occupancy by Ownership in Point MacKenzie
Of the total 126 dwellings in Point MacKenzie, owner-occupied units account for 119 (94.4%), while renter-occupied units make up 7 (5.6%).
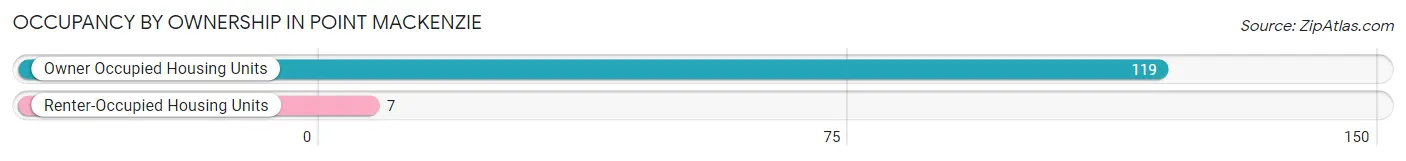
| Occupancy | # Housing Units | % Housing Units |
| Owner Occupied Housing Units | 119 | 94.4% |
| Renter-Occupied Housing Units | 7 | 5.6% |
| Total Occupied Housing Units | 126 | 100.0% |
Occupancy by Household Size in Point MacKenzie
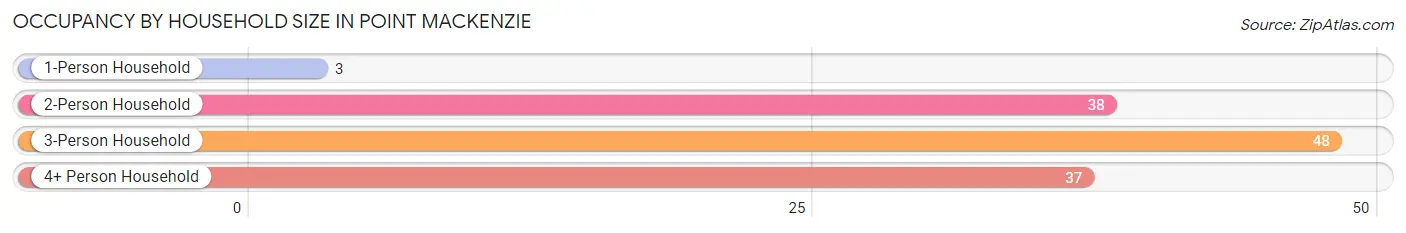
| Household Size | # Housing Units | % Housing Units |
| 1-Person Household | 3 | 2.4% |
| 2-Person Household | 38 | 30.2% |
| 3-Person Household | 48 | 38.1% |
| 4+ Person Household | 37 | 29.4% |
| Total Housing Units | 126 | 100.0% |
Occupancy by Ownership by Household Size in Point MacKenzie
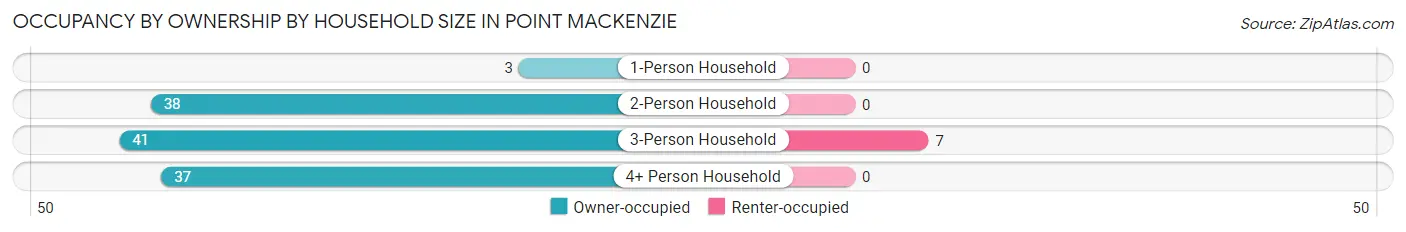
| Household Size | Owner-occupied | Renter-occupied |
| 1-Person Household | 3 (100.0%) | 0 (0.0%) |
| 2-Person Household | 38 (100.0%) | 0 (0.0%) |
| 3-Person Household | 41 (85.4%) | 7 (14.6%) |
| 4+ Person Household | 37 (100.0%) | 0 (0.0%) |
| Total Housing Units | 119 (94.4%) | 7 (5.6%) |
Occupancy by Educational Attainment in Point MacKenzie
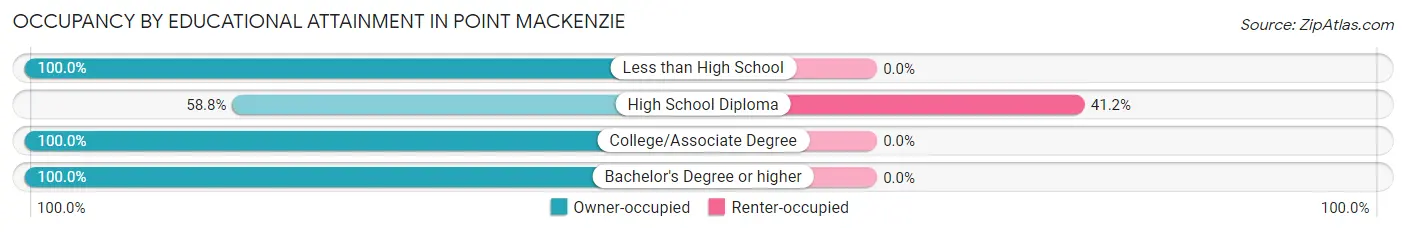
| Household Size | Owner-occupied | Renter-occupied |
| Less than High School | 54 (100.0%) | 0 (0.0%) |
| High School Diploma | 10 (58.8%) | 7 (41.2%) |
| College/Associate Degree | 42 (100.0%) | 0 (0.0%) |
| Bachelor's Degree or higher | 13 (100.0%) | 0 (0.0%) |
Occupancy by Age of Householder in Point MacKenzie
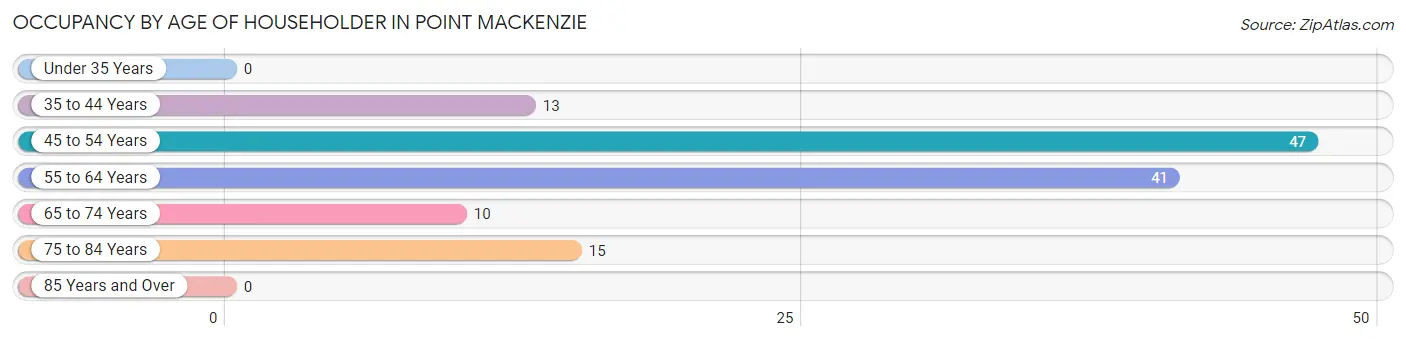
| Age Bracket | # Households | % Households |
| Under 35 Years | 0 | 0.0% |
| 35 to 44 Years | 13 | 10.3% |
| 45 to 54 Years | 47 | 37.3% |
| 55 to 64 Years | 41 | 32.5% |
| 65 to 74 Years | 10 | 7.9% |
| 75 to 84 Years | 15 | 11.9% |
| 85 Years and Over | 0 | 0.0% |
| Total | 126 | 100.0% |
Housing Finances in Point MacKenzie
Median Income by Occupancy in Point MacKenzie
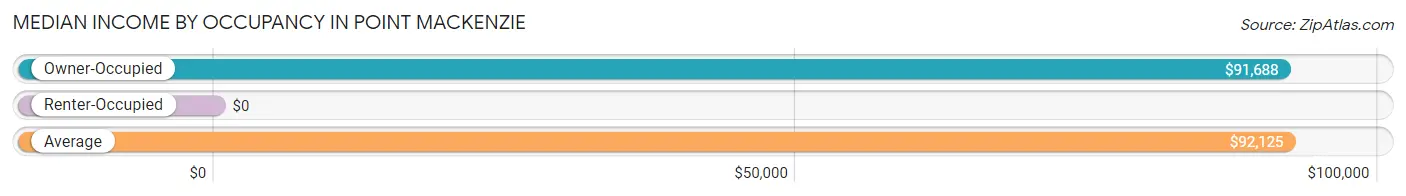
| Occupancy Type | # Households | Median Income |
| Owner-Occupied | 119 (94.4%) | $91,688 |
| Renter-Occupied | 7 (5.6%) | $0 |
| Average | 126 (100.0%) | $92,125 |
Occupancy by Householder Income Bracket in Point MacKenzie
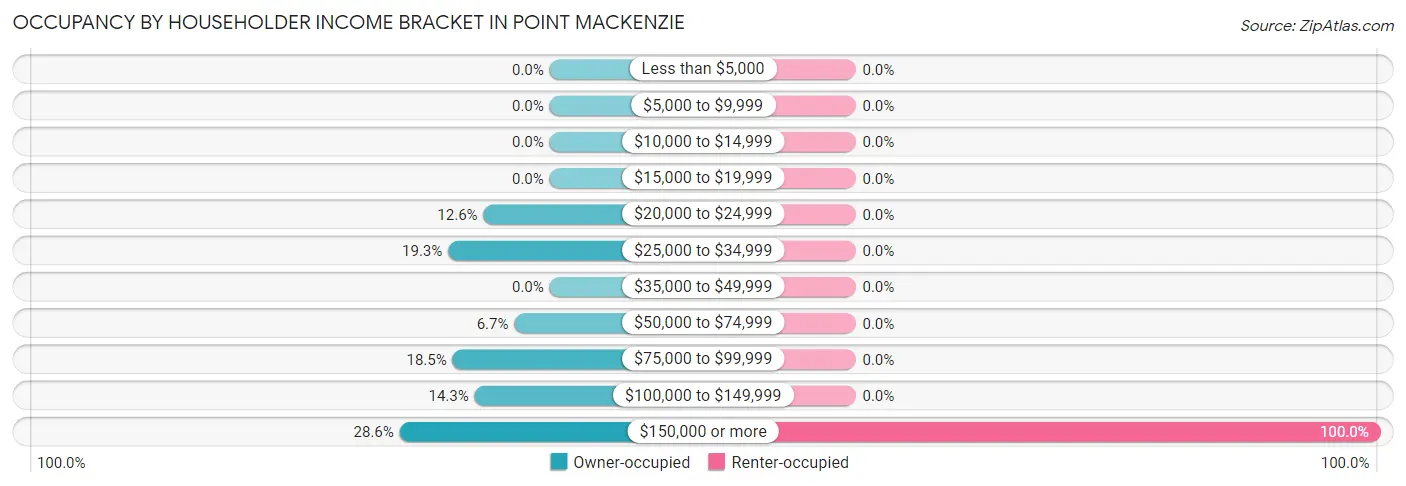
| Income Bracket | Owner-occupied | Renter-occupied |
| Less than $5,000 | 0 (0.0%) | 0 (0.0%) |
| $5,000 to $9,999 | 0 (0.0%) | 0 (0.0%) |
| $10,000 to $14,999 | 0 (0.0%) | 0 (0.0%) |
| $15,000 to $19,999 | 0 (0.0%) | 0 (0.0%) |
| $20,000 to $24,999 | 15 (12.6%) | 0 (0.0%) |
| $25,000 to $34,999 | 23 (19.3%) | 0 (0.0%) |
| $35,000 to $49,999 | 0 (0.0%) | 0 (0.0%) |
| $50,000 to $74,999 | 8 (6.7%) | 0 (0.0%) |
| $75,000 to $99,999 | 22 (18.5%) | 0 (0.0%) |
| $100,000 to $149,999 | 17 (14.3%) | 0 (0.0%) |
| $150,000 or more | 34 (28.6%) | 7 (100.0%) |
| Total | 119 (100.0%) | 7 (100.0%) |
Monthly Housing Cost Tiers in Point MacKenzie
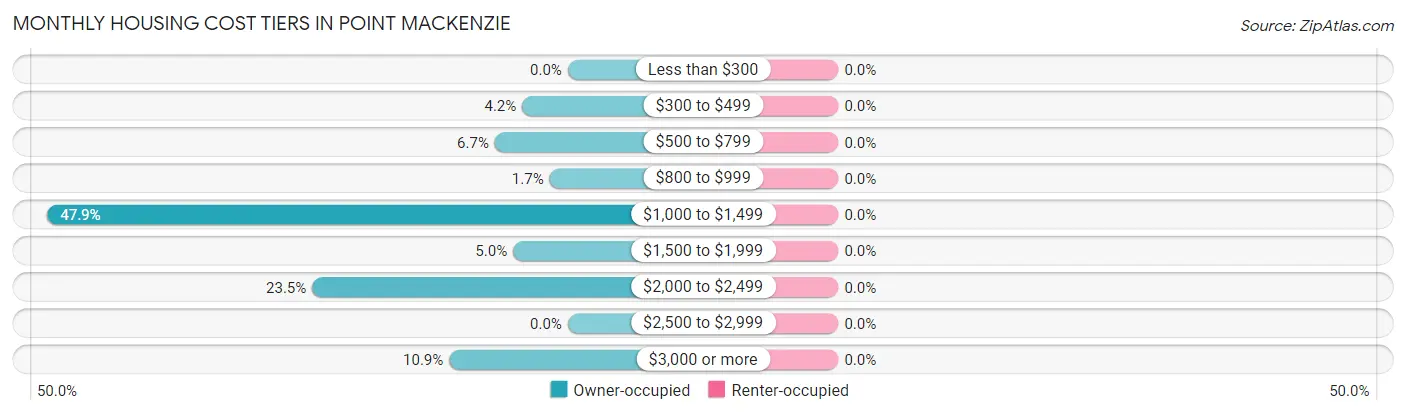
| Monthly Cost | Owner-occupied | Renter-occupied |
| Less than $300 | 0 (0.0%) | 0 (0.0%) |
| $300 to $499 | 5 (4.2%) | 0 (0.0%) |
| $500 to $799 | 8 (6.7%) | 0 (0.0%) |
| $800 to $999 | 2 (1.7%) | 0 (0.0%) |
| $1,000 to $1,499 | 57 (47.9%) | 0 (0.0%) |
| $1,500 to $1,999 | 6 (5.0%) | 0 (0.0%) |
| $2,000 to $2,499 | 28 (23.5%) | 0 (0.0%) |
| $2,500 to $2,999 | 0 (0.0%) | 0 (0.0%) |
| $3,000 or more | 13 (10.9%) | 0 (0.0%) |
| Total | 119 (100.0%) | 7 (100.0%) |
Physical Housing Characteristics in Point MacKenzie
Housing Structures in Point MacKenzie
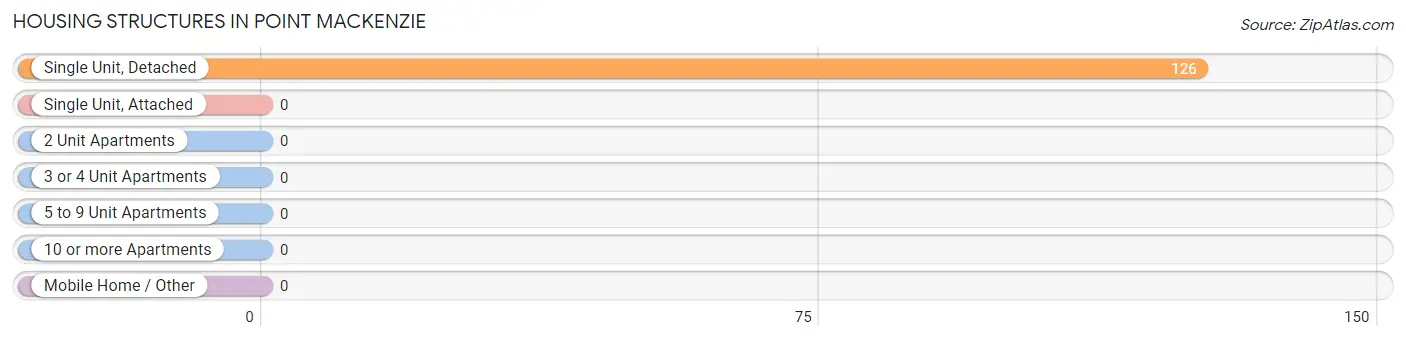
| Structure Type | # Housing Units | % Housing Units |
| Single Unit, Detached | 126 | 100.0% |
| Single Unit, Attached | 0 | 0.0% |
| 2 Unit Apartments | 0 | 0.0% |
| 3 or 4 Unit Apartments | 0 | 0.0% |
| 5 to 9 Unit Apartments | 0 | 0.0% |
| 10 or more Apartments | 0 | 0.0% |
| Mobile Home / Other | 0 | 0.0% |
| Total | 126 | 100.0% |
Housing Structures by Occupancy in Point MacKenzie
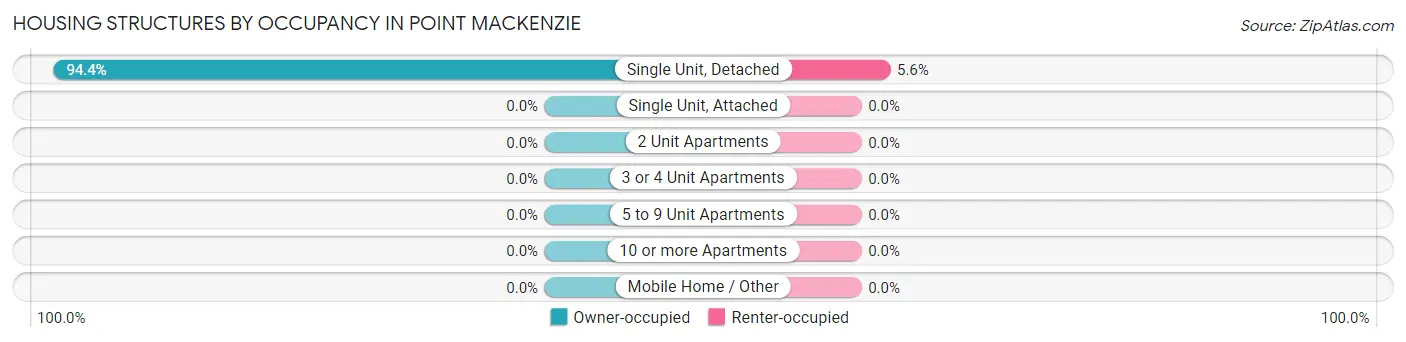
| Structure Type | Owner-occupied | Renter-occupied |
| Single Unit, Detached | 119 (94.4%) | 7 (5.6%) |
| Single Unit, Attached | 0 (0.0%) | 0 (0.0%) |
| 2 Unit Apartments | 0 (0.0%) | 0 (0.0%) |
| 3 or 4 Unit Apartments | 0 (0.0%) | 0 (0.0%) |
| 5 to 9 Unit Apartments | 0 (0.0%) | 0 (0.0%) |
| 10 or more Apartments | 0 (0.0%) | 0 (0.0%) |
| Mobile Home / Other | 0 (0.0%) | 0 (0.0%) |
| Total | 119 (94.4%) | 7 (5.6%) |
Housing Structures by Number of Rooms in Point MacKenzie
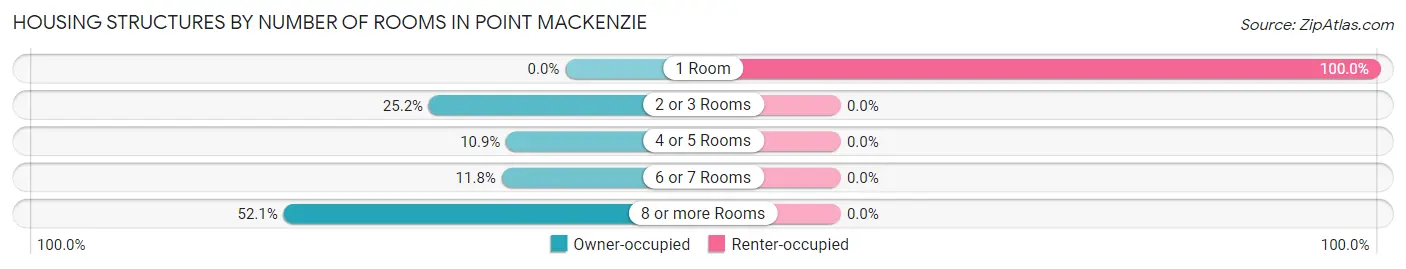
| Number of Rooms | Owner-occupied | Renter-occupied |
| 1 Room | 0 (0.0%) | 7 (100.0%) |
| 2 or 3 Rooms | 30 (25.2%) | 0 (0.0%) |
| 4 or 5 Rooms | 13 (10.9%) | 0 (0.0%) |
| 6 or 7 Rooms | 14 (11.8%) | 0 (0.0%) |
| 8 or more Rooms | 62 (52.1%) | 0 (0.0%) |
| Total | 119 (100.0%) | 7 (100.0%) |
Housing Structure by Heating Type in Point MacKenzie
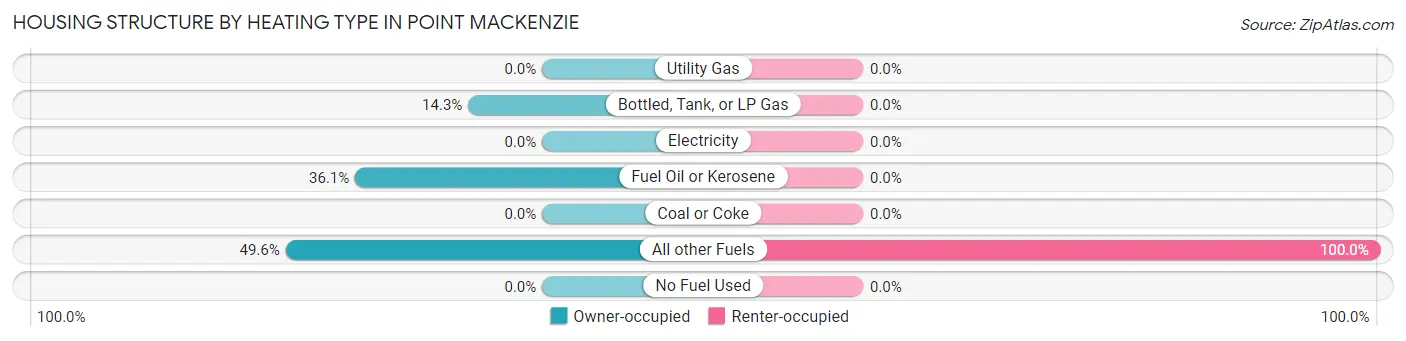
| Heating Type | Owner-occupied | Renter-occupied |
| Utility Gas | 0 (0.0%) | 0 (0.0%) |
| Bottled, Tank, or LP Gas | 17 (14.3%) | 0 (0.0%) |
| Electricity | 0 (0.0%) | 0 (0.0%) |
| Fuel Oil or Kerosene | 43 (36.1%) | 0 (0.0%) |
| Coal or Coke | 0 (0.0%) | 0 (0.0%) |
| All other Fuels | 59 (49.6%) | 7 (100.0%) |
| No Fuel Used | 0 (0.0%) | 0 (0.0%) |
| Total | 119 (100.0%) | 7 (100.0%) |
Household Vehicle Usage in Point MacKenzie
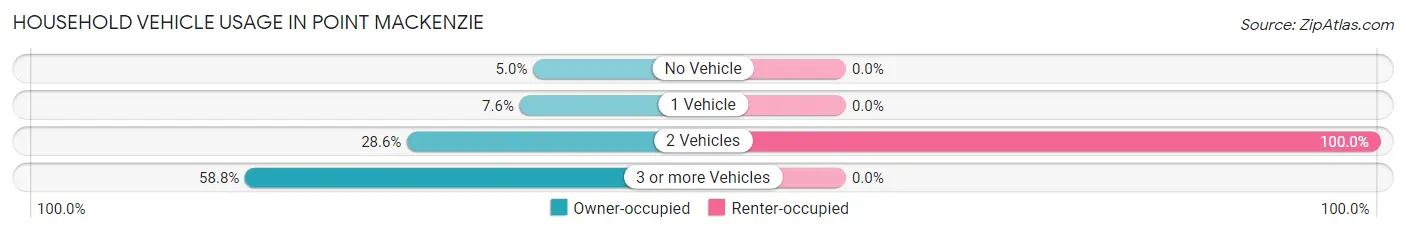
| Vehicles per Household | Owner-occupied | Renter-occupied |
| No Vehicle | 6 (5.0%) | 0 (0.0%) |
| 1 Vehicle | 9 (7.6%) | 0 (0.0%) |
| 2 Vehicles | 34 (28.6%) | 7 (100.0%) |
| 3 or more Vehicles | 70 (58.8%) | 0 (0.0%) |
| Total | 119 (100.0%) | 7 (100.0%) |
Real Estate & Mortgages in Point MacKenzie
Real Estate and Mortgage Overview in Point MacKenzie
| Characteristic | Without Mortgage | With Mortgage |
| Housing Units | 56 | 63 |
| Median Property Value | - | - |
| Median Household Income | $105,588 | $19 |
| Monthly Housing Costs | $1,182 | $13 |
| Real Estate Taxes | $4,941 | $0 |
Property Value by Mortgage Status in Point MacKenzie
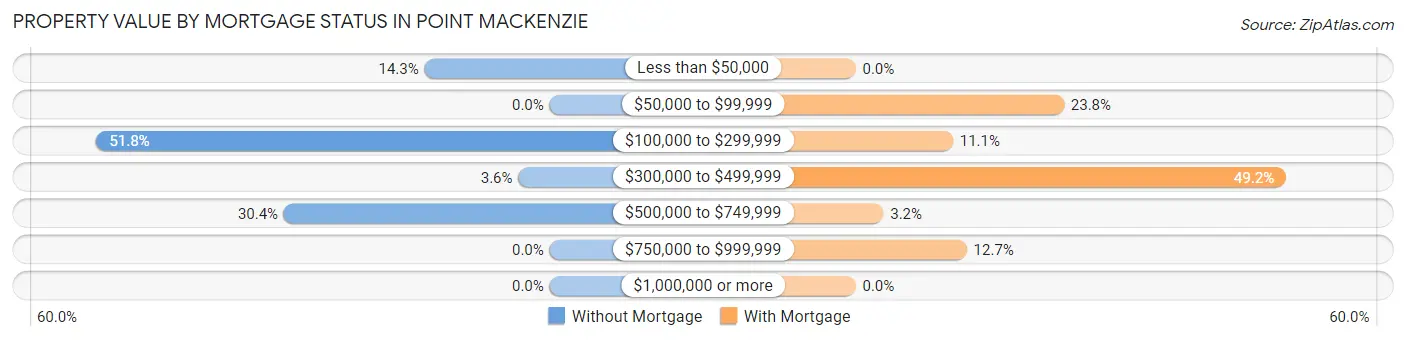
| Property Value | Without Mortgage | With Mortgage |
| Less than $50,000 | 8 (14.3%) | 0 (0.0%) |
| $50,000 to $99,999 | 0 (0.0%) | 15 (23.8%) |
| $100,000 to $299,999 | 29 (51.8%) | 7 (11.1%) |
| $300,000 to $499,999 | 2 (3.6%) | 31 (49.2%) |
| $500,000 to $749,999 | 17 (30.4%) | 2 (3.2%) |
| $750,000 to $999,999 | 0 (0.0%) | 8 (12.7%) |
| $1,000,000 or more | 0 (0.0%) | 0 (0.0%) |
| Total | 56 (100.0%) | 63 (100.0%) |
Household Income by Mortgage Status in Point MacKenzie
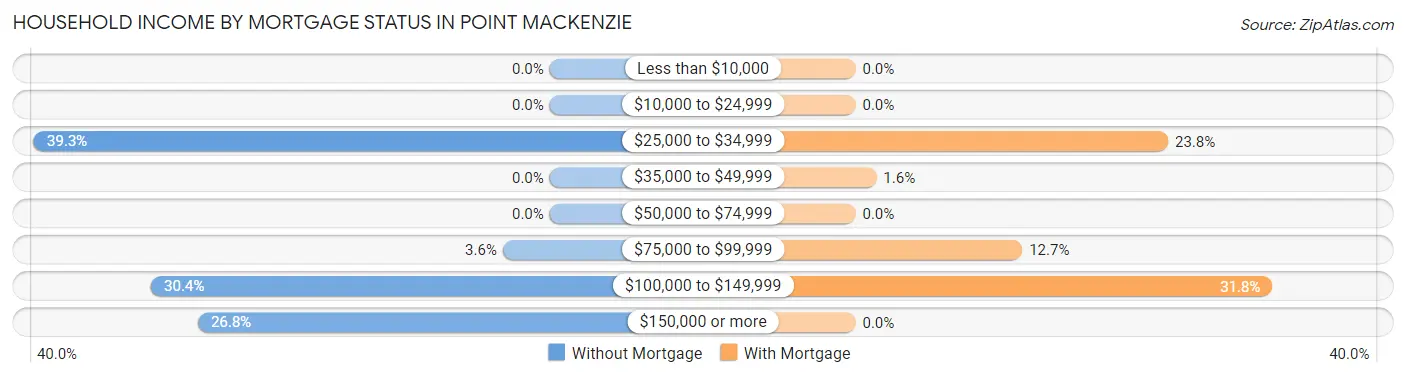
| Household Income | Without Mortgage | With Mortgage |
| Less than $10,000 | 0 (0.0%) | 0 (0.0%) |
| $10,000 to $24,999 | 0 (0.0%) | 0 (0.0%) |
| $25,000 to $34,999 | 22 (39.3%) | 15 (23.8%) |
| $35,000 to $49,999 | 0 (0.0%) | 1 (1.6%) |
| $50,000 to $74,999 | 0 (0.0%) | 0 (0.0%) |
| $75,000 to $99,999 | 2 (3.6%) | 8 (12.7%) |
| $100,000 to $149,999 | 17 (30.4%) | 20 (31.8%) |
| $150,000 or more | 15 (26.8%) | 0 (0.0%) |
| Total | 56 (100.0%) | 63 (100.0%) |
Property Value to Household Income Ratio in Point MacKenzie
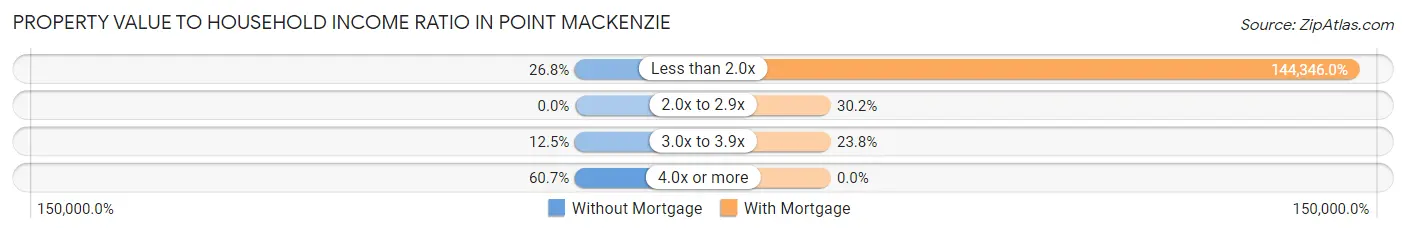
| Value-to-Income Ratio | Without Mortgage | With Mortgage |
| Less than 2.0x | 15 (26.8%) | 90,938 (144,346.0%) |
| 2.0x to 2.9x | 0 (0.0%) | 19 (30.2%) |
| 3.0x to 3.9x | 7 (12.5%) | 15 (23.8%) |
| 4.0x or more | 34 (60.7%) | 0 (0.0%) |
| Total | 56 (100.0%) | 63 (100.0%) |
Real Estate Taxes by Mortgage Status in Point MacKenzie
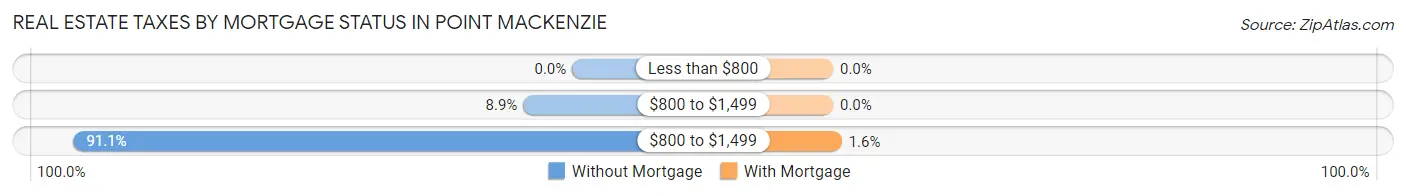
| Property Taxes | Without Mortgage | With Mortgage |
| Less than $800 | 0 (0.0%) | 0 (0.0%) |
| $800 to $1,499 | 5 (8.9%) | 0 (0.0%) |
| $800 to $1,499 | 51 (91.1%) | 1 (1.6%) |
| Total | 56 (100.0%) | 63 (100.0%) |
Health & Disability in Point MacKenzie
Health Insurance Coverage by Age in Point MacKenzie
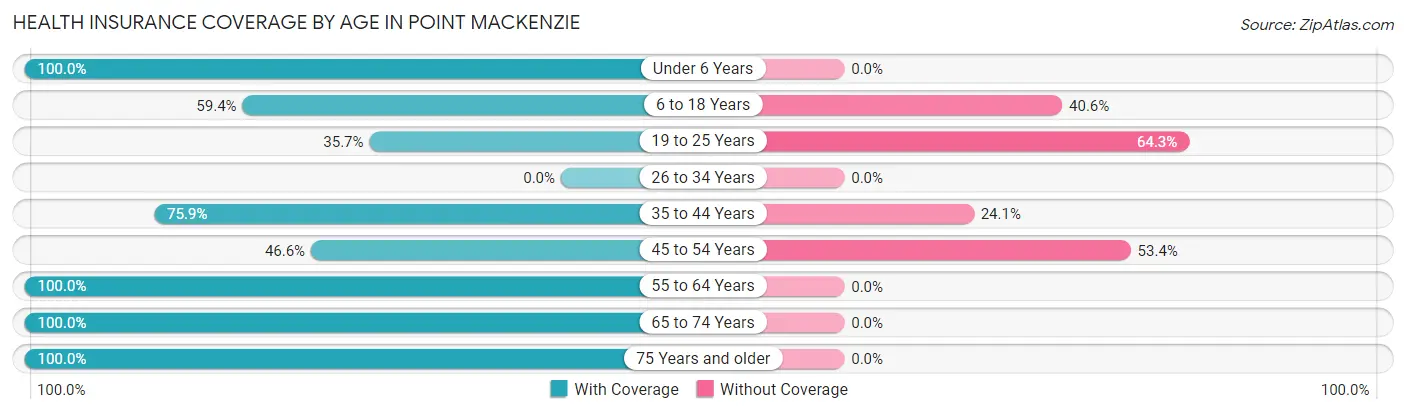
| Age Bracket | With Coverage | Without Coverage |
| Under 6 Years | 11 (100.0%) | 0 (0.0%) |
| 6 to 18 Years | 57 (59.4%) | 39 (40.6%) |
| 19 to 25 Years | 30 (35.7%) | 54 (64.3%) |
| 26 to 34 Years | 0 (0.0%) | 0 (0.0%) |
| 35 to 44 Years | 22 (75.9%) | 7 (24.1%) |
| 45 to 54 Years | 48 (46.6%) | 55 (53.4%) |
| 55 to 64 Years | 83 (100.0%) | 0 (0.0%) |
| 65 to 74 Years | 24 (100.0%) | 0 (0.0%) |
| 75 Years and older | 33 (100.0%) | 0 (0.0%) |
| Total | 308 (66.5%) | 155 (33.5%) |
Health Insurance Coverage by Citizenship Status in Point MacKenzie

| Citizenship Status | With Coverage | Without Coverage |
| Native Born | 11 (100.0%) | 0 (0.0%) |
| Foreign Born, Citizen | 57 (59.4%) | 39 (40.6%) |
| Foreign Born, not a Citizen | 30 (35.7%) | 54 (64.3%) |
Health Insurance Coverage by Household Income in Point MacKenzie
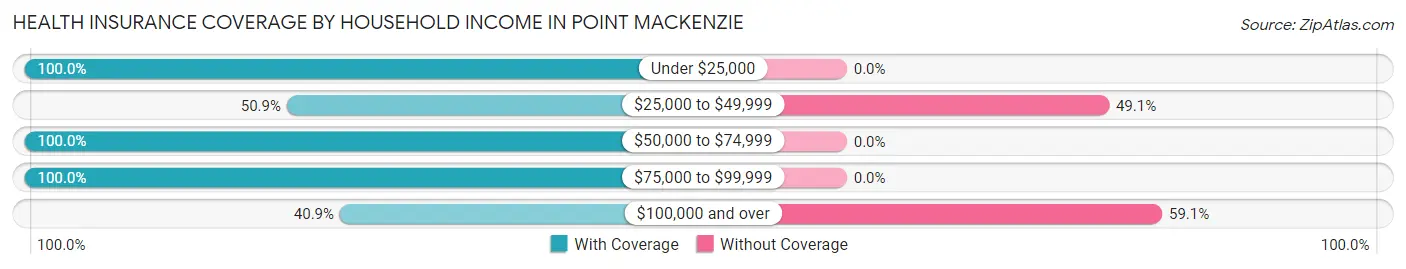
| Household Income | With Coverage | Without Coverage |
| Under $25,000 | 33 (100.0%) | 0 (0.0%) |
| $25,000 to $49,999 | 29 (50.9%) | 28 (49.1%) |
| $50,000 to $74,999 | 30 (100.0%) | 0 (0.0%) |
| $75,000 to $99,999 | 127 (100.0%) | 0 (0.0%) |
| $100,000 and over | 88 (40.9%) | 127 (59.1%) |
Public vs Private Health Insurance Coverage by Age in Point MacKenzie
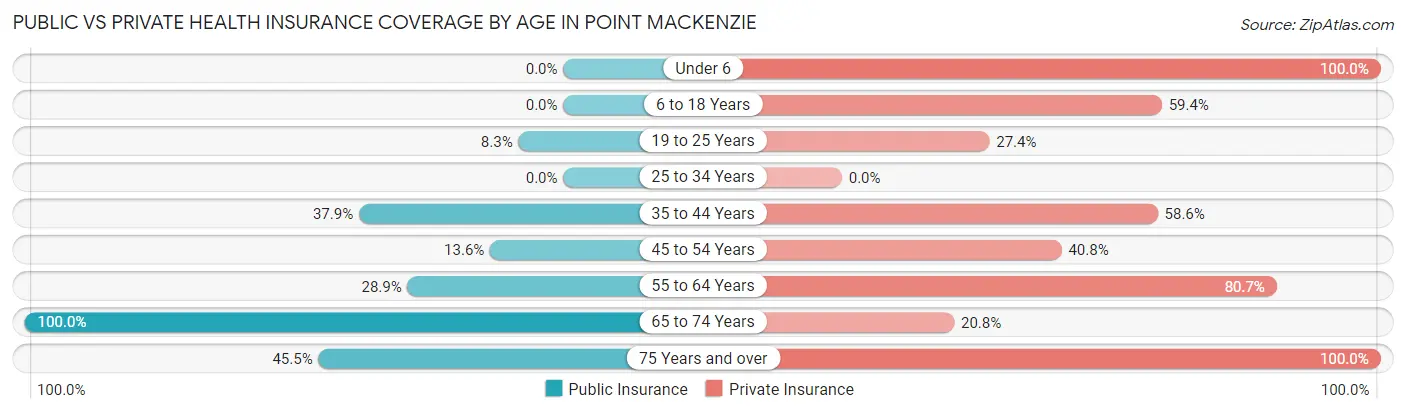
| Age Bracket | Public Insurance | Private Insurance |
| Under 6 | 0 (0.0%) | 11 (100.0%) |
| 6 to 18 Years | 0 (0.0%) | 57 (59.4%) |
| 19 to 25 Years | 7 (8.3%) | 23 (27.4%) |
| 25 to 34 Years | 0 (0.0%) | 0 (0.0%) |
| 35 to 44 Years | 11 (37.9%) | 17 (58.6%) |
| 45 to 54 Years | 14 (13.6%) | 42 (40.8%) |
| 55 to 64 Years | 24 (28.9%) | 67 (80.7%) |
| 65 to 74 Years | 24 (100.0%) | 5 (20.8%) |
| 75 Years and over | 15 (45.5%) | 33 (100.0%) |
| Total | 95 (20.5%) | 255 (55.1%) |
Disability Status by Sex by Age in Point MacKenzie
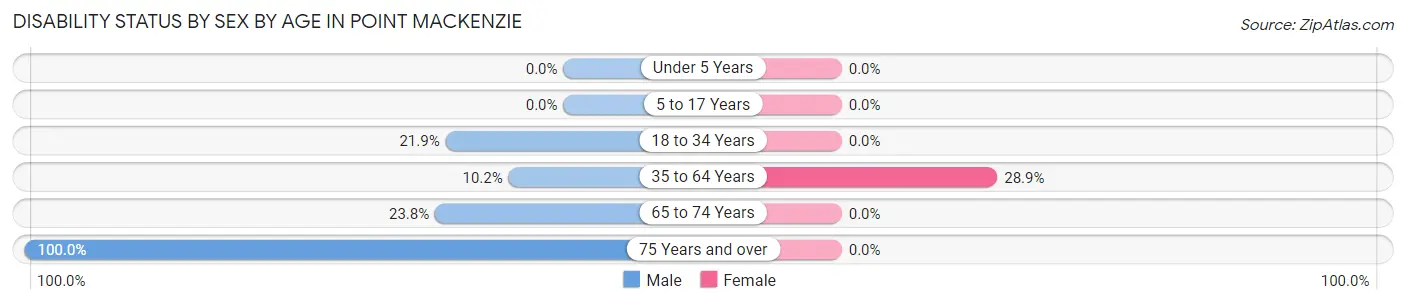
| Age Bracket | Male | Female |
| Under 5 Years | 0 (0.0%) | 0 (0.0%) |
| 5 to 17 Years | 0 (0.0%) | 0 (0.0%) |
| 18 to 34 Years | 7 (21.9%) | 0 (0.0%) |
| 35 to 64 Years | 12 (10.2%) | 28 (28.9%) |
| 65 to 74 Years | 5 (23.8%) | 0 (0.0%) |
| 75 Years and over | 18 (100.0%) | 0 (0.0%) |
Disability Class by Sex by Age in Point MacKenzie
Disability Class: Hearing Difficulty
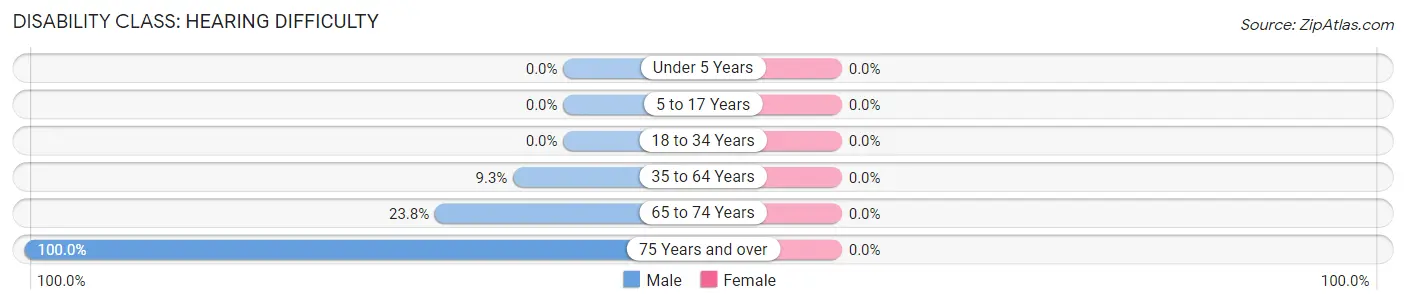
| Age Bracket | Male | Female |
| Under 5 Years | 0 (0.0%) | 0 (0.0%) |
| 5 to 17 Years | 0 (0.0%) | 0 (0.0%) |
| 18 to 34 Years | 0 (0.0%) | 0 (0.0%) |
| 35 to 64 Years | 11 (9.3%) | 0 (0.0%) |
| 65 to 74 Years | 5 (23.8%) | 0 (0.0%) |
| 75 Years and over | 18 (100.0%) | 0 (0.0%) |
Disability Class: Vision Difficulty
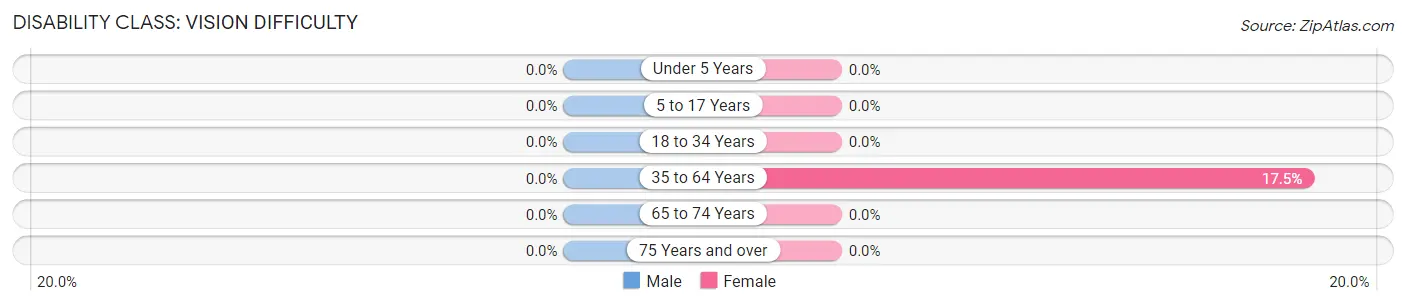
| Age Bracket | Male | Female |
| Under 5 Years | 0 (0.0%) | 0 (0.0%) |
| 5 to 17 Years | 0 (0.0%) | 0 (0.0%) |
| 18 to 34 Years | 0 (0.0%) | 0 (0.0%) |
| 35 to 64 Years | 0 (0.0%) | 17 (17.5%) |
| 65 to 74 Years | 0 (0.0%) | 0 (0.0%) |
| 75 Years and over | 0 (0.0%) | 0 (0.0%) |
Disability Class: Cognitive Difficulty
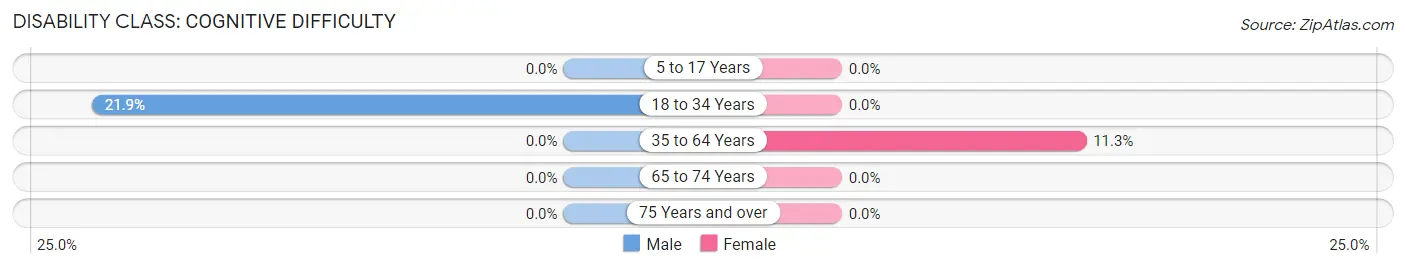
| Age Bracket | Male | Female |
| 5 to 17 Years | 0 (0.0%) | 0 (0.0%) |
| 18 to 34 Years | 7 (21.9%) | 0 (0.0%) |
| 35 to 64 Years | 0 (0.0%) | 11 (11.3%) |
| 65 to 74 Years | 0 (0.0%) | 0 (0.0%) |
| 75 Years and over | 0 (0.0%) | 0 (0.0%) |
Disability Class: Ambulatory Difficulty
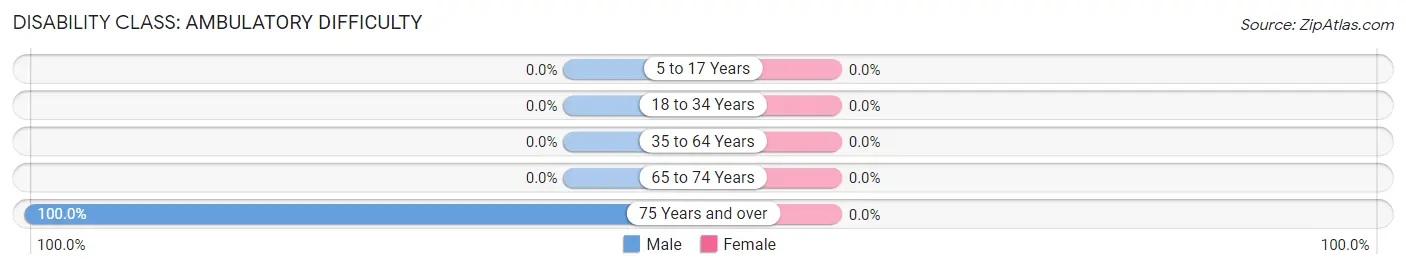
| Age Bracket | Male | Female |
| 5 to 17 Years | 0 (0.0%) | 0 (0.0%) |
| 18 to 34 Years | 0 (0.0%) | 0 (0.0%) |
| 35 to 64 Years | 0 (0.0%) | 0 (0.0%) |
| 65 to 74 Years | 0 (0.0%) | 0 (0.0%) |
| 75 Years and over | 18 (100.0%) | 0 (0.0%) |
Disability Class: Self-Care Difficulty
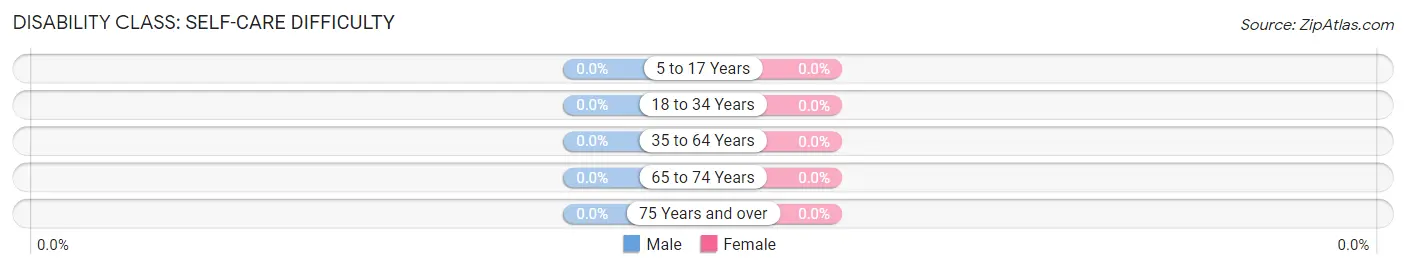
| Age Bracket | Male | Female |
| 5 to 17 Years | 0 (0.0%) | 0 (0.0%) |
| 18 to 34 Years | 0 (0.0%) | 0 (0.0%) |
| 35 to 64 Years | 0 (0.0%) | 0 (0.0%) |
| 65 to 74 Years | 0 (0.0%) | 0 (0.0%) |
| 75 Years and over | 0 (0.0%) | 0 (0.0%) |
Technology Access in Point MacKenzie
Computing Device Access in Point MacKenzie
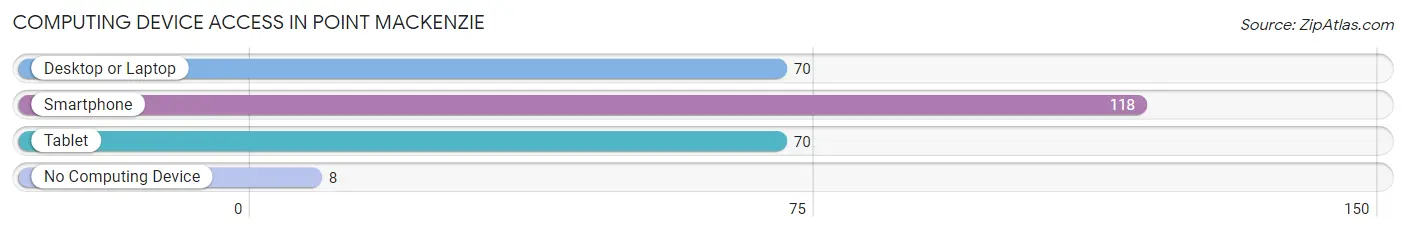
| Device Type | # Households | % Households |
| Desktop or Laptop | 70 | 55.6% |
| Smartphone | 118 | 93.6% |
| Tablet | 70 | 55.6% |
| No Computing Device | 8 | 6.4% |
| Total | 126 | 100.0% |
Internet Access in Point MacKenzie
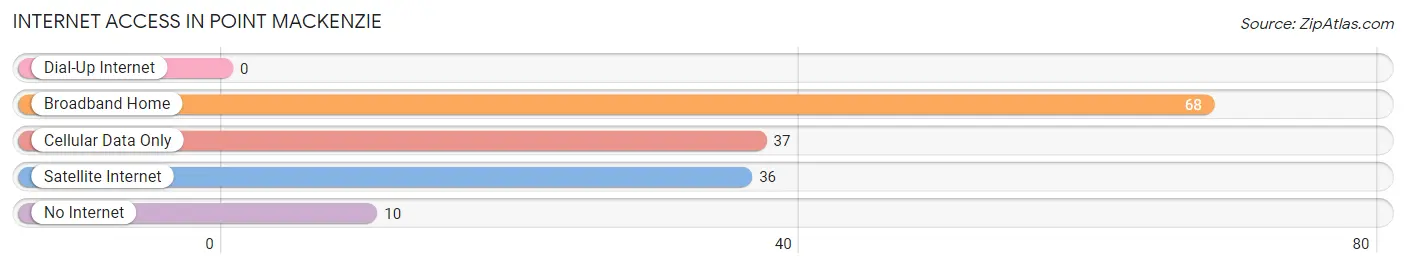
| Internet Type | # Households | % Households |
| Dial-Up Internet | 0 | 0.0% |
| Broadband Home | 68 | 54.0% |
| Cellular Data Only | 37 | 29.4% |
| Satellite Internet | 36 | 28.6% |
| No Internet | 10 | 7.9% |
| Total | 126 | 100.0% |
Point MacKenzie Summary
Mackenzie, Alaska is a small town located in the northern part of the state, near the Canadian border. It is situated on the banks of the Mackenzie River, which is the longest river in North America. The town is home to approximately 1,000 people, and is the largest settlement in the region.
Geography
Mackenzie is located in the northern part of Alaska, near the Canadian border. It is situated on the banks of the Mackenzie River, which is the longest river in North America. The town is surrounded by mountains, and is located in a valley. The climate in Mackenzie is cold and dry, with temperatures ranging from -20°F in the winter to 70°F in the summer.
Economy
Mackenzie’s economy is largely based on fishing, hunting, and trapping. The town is home to several fish processing plants, and the local economy is heavily reliant on the fishing industry. The town also has a small tourism industry, with visitors coming to experience the natural beauty of the area.
Demographics
Mackenzie is home to approximately 1,000 people, with the majority of the population being of Native American descent. The town is also home to a small number of non-Native Americans, primarily of European descent. The town has a median household income of $45,000, and the unemployment rate is around 8%.
History
Mackenzie was first settled in the late 1800s by Native Americans, who were drawn to the area by the abundance of fish in the Mackenzie River. The town was officially incorporated in 1901, and the population began to grow steadily. In the early 1900s, the town was a major hub for the fur trade, and the local economy was heavily reliant on the trapping industry.
In the 1950s, the town began to experience a decline in population as the fur trade declined and the fishing industry began to take over. The town experienced a resurgence in the 1970s, when the oil industry began to take off in the region. The town has since become a major hub for the oil industry, and the local economy is heavily reliant on the industry.
Conclusion
Mackenzie, Alaska is a small town located in the northern part of the state, near the Canadian border. It is situated on the banks of the Mackenzie River, which is the longest river in North America. The town is home to approximately 1,000 people, and is the largest settlement in the region. The economy is largely based on fishing, hunting, and trapping, and the town is also home to a small tourism industry. The majority of the population is of Native American descent, and the median household income is around $45,000. The town has a long history, and has experienced a resurgence in recent years due to the oil industry.
Common Questions
What is the Total Population of Point MacKenzie?
Total Population of Point MacKenzie is 1,707.
What is the Total Male Population of Point MacKenzie?
Total Male Population of Point MacKenzie is 1,430.
What is the Total Female Population of Point MacKenzie?
Total Female Population of Point MacKenzie is 277.
What is the Ratio of Males per 100 Females in Point MacKenzie?
There are 516.25 Males per 100 Females in Point MacKenzie.
What is the Ratio of Females per 100 Males in Point MacKenzie?
There are 19.37 Females per 100 Males in Point MacKenzie.
What is the Median Population Age in Point MacKenzie?
Median Population Age in Point MacKenzie is 45.2 Years.
What is the Average Family Size in Point MacKenzie
Average Family Size in Point MacKenzie is 3.5 People.
What is the Average Household Size in Point MacKenzie
Average Household Size in Point MacKenzie is 3.7 People.
What is Per Capita Income in Point MacKenzie?
Per Capita income in Point MacKenzie is $12,507.
What is the Median Family Income in Point MacKenzie?
Median Family Income in Point MacKenzie is $91,625.
What is the Median Household income in Point MacKenzie?
Median Household Income in Point MacKenzie is $92,125.
What is Inequality or Gini Index in Point MacKenzie?
Inequality or Gini Index in Point MacKenzie is 0.39.
How Large is the Labor Force in Point MacKenzie?
There are 193 People in the Labor Forcein in Point MacKenzie.
What is the Percentage of People in the Labor Force in Point MacKenzie?
11.9% of People are in the Labor Force in Point MacKenzie.
What is the Unemployment Rate in Point MacKenzie?
Unemployment Rate in Point MacKenzie is 7.3%.