Klukwan, AK
Klukwan Map
Klukwan Overview
67
TOTAL POPULATION
38
MALE POPULATION
29
FEMALE POPULATION
131.03
MALES / 100 FEMALES
76.32
FEMALES / 100 MALES
44.9
MEDIAN AGE
3.3
AVG FAMILY SIZE
2.2
AVG HOUSEHOLD SIZE
$24,327
PER CAPITA INCOME
76.5%
WAGE / INCOME GAP [ % ]
23.5¢/ $1
WAGE / INCOME GAP [ $ ]
0.51
INEQUALITY / GINI INDEX
29
LABOR FORCE [ PEOPLE ]
50.0%
PERCENT IN LABOR FORCE
6.9%
UNEMPLOYMENT RATE
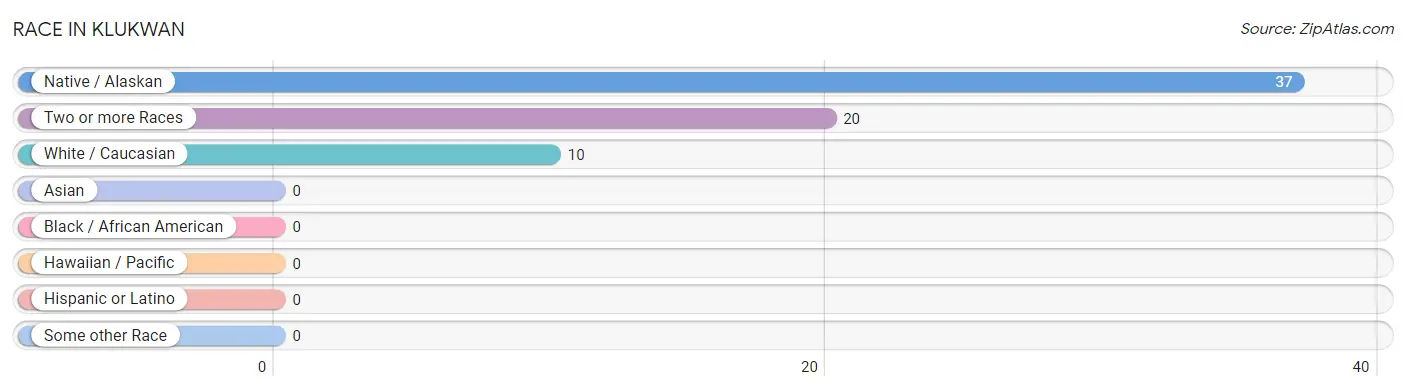
Race in Klukwan
The most populous races in Klukwan are Native / Alaskan (37 | 55.2%), Two or more Races (20 | 29.8%), and White / Caucasian (10 | 14.9%).
| Race | # Population | % Population |
| Asian | 0 | 0.0% |
| Black / African American | 0 | 0.0% |
| Hawaiian / Pacific | 0 | 0.0% |
| Hispanic or Latino | 0 | 0.0% |
| Native / Alaskan | 37 | 55.2% |
| White / Caucasian | 10 | 14.9% |
| Two or more Races | 20 | 29.8% |
| Some other Race | 0 | 0.0% |
| Total | 67 | 100.0% |
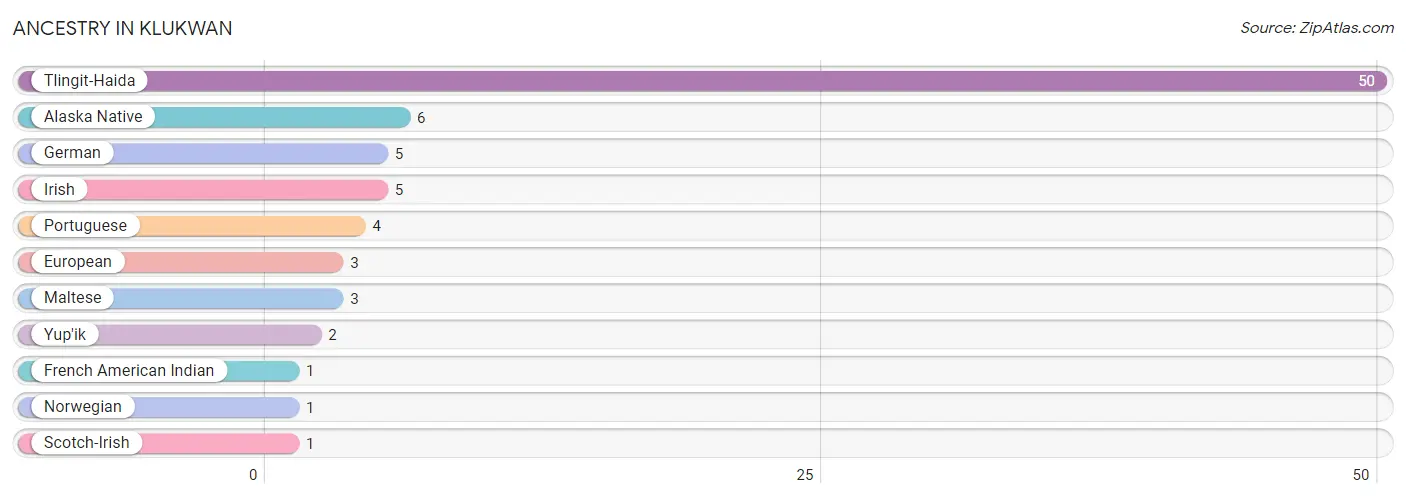
Ancestry in Klukwan
The most populous ancestries reported in Klukwan are Tlingit-Haida (50 | 74.6%), Alaska Native (6 | 9.0%), German (5 | 7.5%), Irish (5 | 7.5%), and Portuguese (4 | 6.0%), together accounting for 104.5% of all Klukwan residents.
| Ancestry | # Population | % Population |
| Alaska Native | 6 | 9.0% |
| European | 3 | 4.5% |
| French American Indian | 1 | 1.5% |
| German | 5 | 7.5% |
| Irish | 5 | 7.5% |
| Maltese | 3 | 4.5% |
| Norwegian | 1 | 1.5% |
| Portuguese | 4 | 6.0% |
| Scotch-Irish | 1 | 1.5% |
| Tlingit-Haida | 50 | 74.6% |
| Yup'ik | 2 | 3.0% | View All 11 Rows |
Immigrants in Klukwan

| Immigration Origin | # Population | % Population | View All 0 Rows |
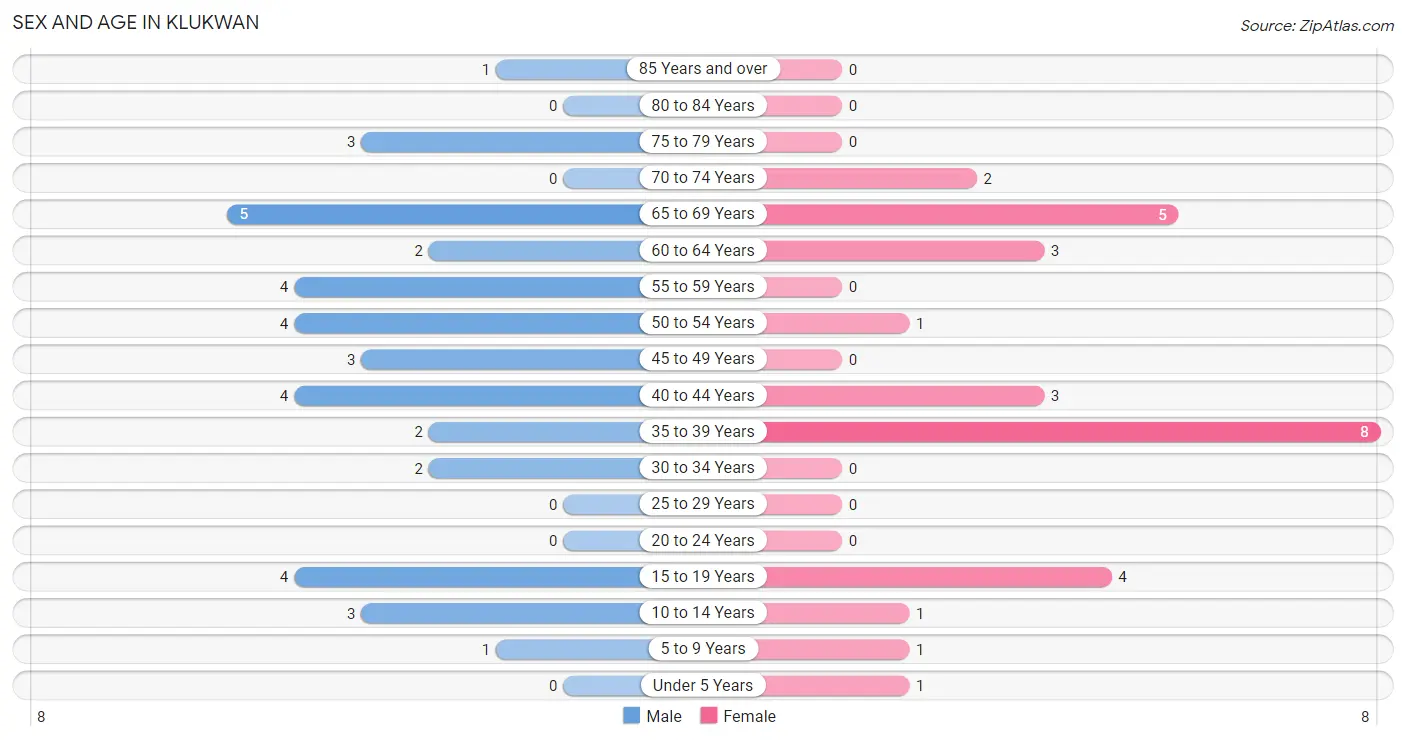
Sex and Age in Klukwan
Sex and Age in Klukwan
The most populous age groups in Klukwan are 65 to 69 Years (5 | 13.2%) for men and 35 to 39 Years (8 | 27.6%) for women.
| Age Bracket | Male | Female |
| Under 5 Years | 0 (0.0%) | 1 (3.5%) |
| 5 to 9 Years | 1 (2.6%) | 1 (3.5%) |
| 10 to 14 Years | 3 (7.9%) | 1 (3.5%) |
| 15 to 19 Years | 4 (10.5%) | 4 (13.8%) |
| 20 to 24 Years | 0 (0.0%) | 0 (0.0%) |
| 25 to 29 Years | 0 (0.0%) | 0 (0.0%) |
| 30 to 34 Years | 2 (5.3%) | 0 (0.0%) |
| 35 to 39 Years | 2 (5.3%) | 8 (27.6%) |
| 40 to 44 Years | 4 (10.5%) | 3 (10.3%) |
| 45 to 49 Years | 3 (7.9%) | 0 (0.0%) |
| 50 to 54 Years | 4 (10.5%) | 1 (3.5%) |
| 55 to 59 Years | 4 (10.5%) | 0 (0.0%) |
| 60 to 64 Years | 2 (5.3%) | 3 (10.3%) |
| 65 to 69 Years | 5 (13.2%) | 5 (17.2%) |
| 70 to 74 Years | 0 (0.0%) | 2 (6.9%) |
| 75 to 79 Years | 3 (7.9%) | 0 (0.0%) |
| 80 to 84 Years | 0 (0.0%) | 0 (0.0%) |
| 85 Years and over | 1 (2.6%) | 0 (0.0%) |
| Total | 38 (100.0%) | 29 (100.0%) |
Families and Households in Klukwan
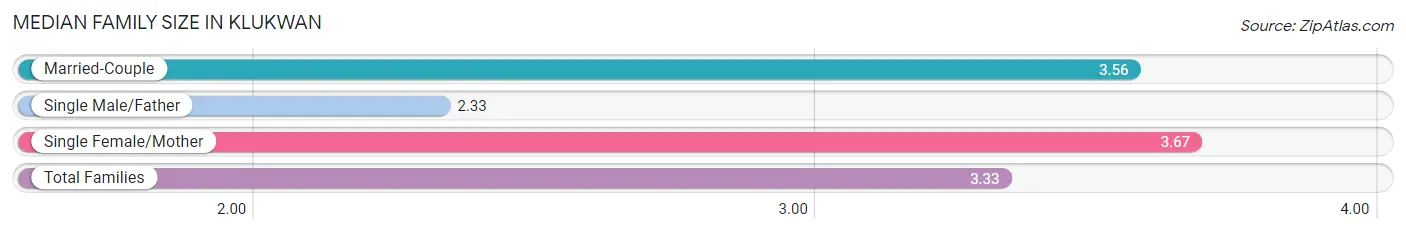
Median Family Size in Klukwan
The median family size in Klukwan is 3.33 persons per family, with single female/mother families (3 | 20.0%) accounting for the largest median family size of 3.67 persons per family. On the other hand, single male/father families (3 | 20.0%) represent the smallest median family size with 2.33 persons per family.
| Family Type | # Families | Family Size |
| Married-Couple | 9 (60.0%) | 3.56 |
| Single Male/Father | 3 (20.0%) | 2.33 |
| Single Female/Mother | 3 (20.0%) | 3.67 |
| Total Families | 15 (100.0%) | 3.33 |
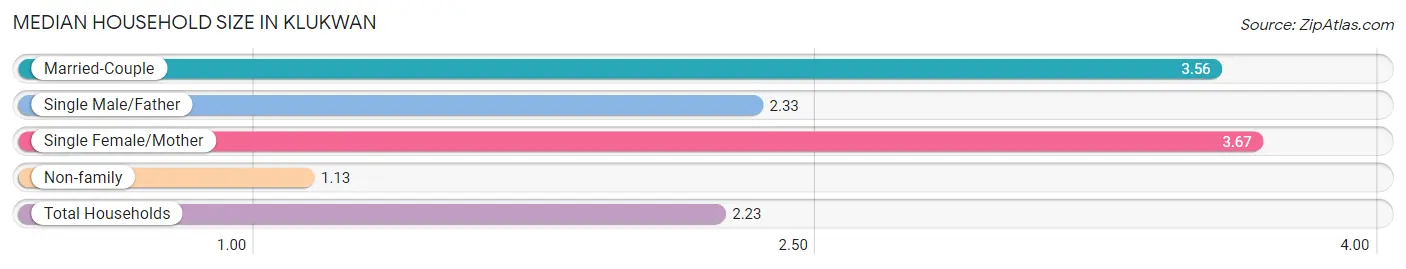
Median Household Size in Klukwan
The median household size in Klukwan is 2.23 persons per household, with single female/mother households (3 | 10.0%) accounting for the largest median household size of 3.67 persons per household. non-family households (15 | 50.0%) represent the smallest median household size with 1.13 persons per household.
| Household Type | # Households | Household Size |
| Married-Couple | 9 (30.0%) | 3.56 |
| Single Male/Father | 3 (10.0%) | 2.33 |
| Single Female/Mother | 3 (10.0%) | 3.67 |
| Non-family | 15 (50.0%) | 1.13 |
| Total Households | 30 (100.0%) | 2.23 |
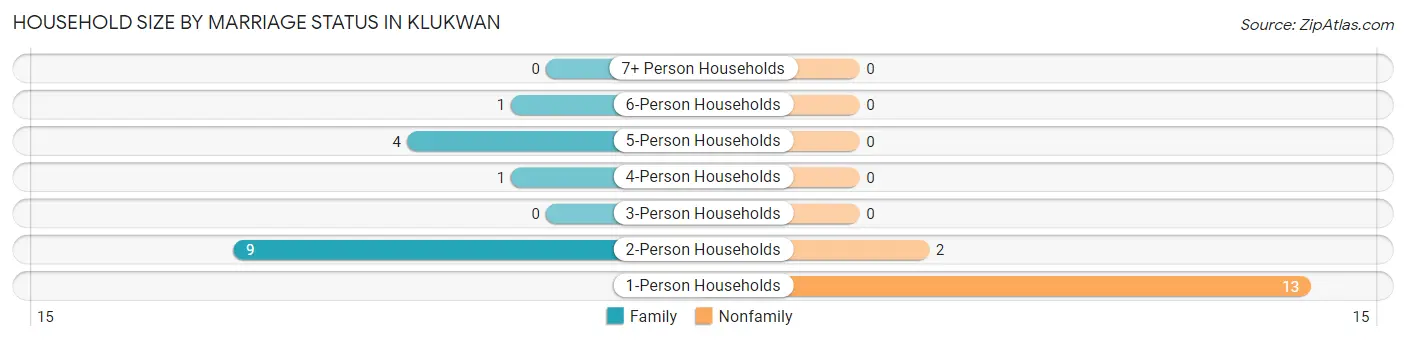
Household Size by Marriage Status in Klukwan
Out of a total of 30 households in Klukwan, 15 (50.0%) are family households, while 15 (50.0%) are nonfamily households. The most numerous type of family households are 2-person households, comprising 9, and the most common type of nonfamily households are 1-person households, comprising 13.
| Household Size | Family Households | Nonfamily Households |
| 1-Person Households | - | 13 (43.3%) |
| 2-Person Households | 9 (30.0%) | 2 (6.7%) |
| 3-Person Households | 0 (0.0%) | 0 (0.0%) |
| 4-Person Households | 1 (3.3%) | 0 (0.0%) |
| 5-Person Households | 4 (13.3%) | 0 (0.0%) |
| 6-Person Households | 1 (3.3%) | 0 (0.0%) |
| 7+ Person Households | 0 (0.0%) | 0 (0.0%) |
| Total | 15 (50.0%) | 15 (50.0%) |
Female Fertility in Klukwan
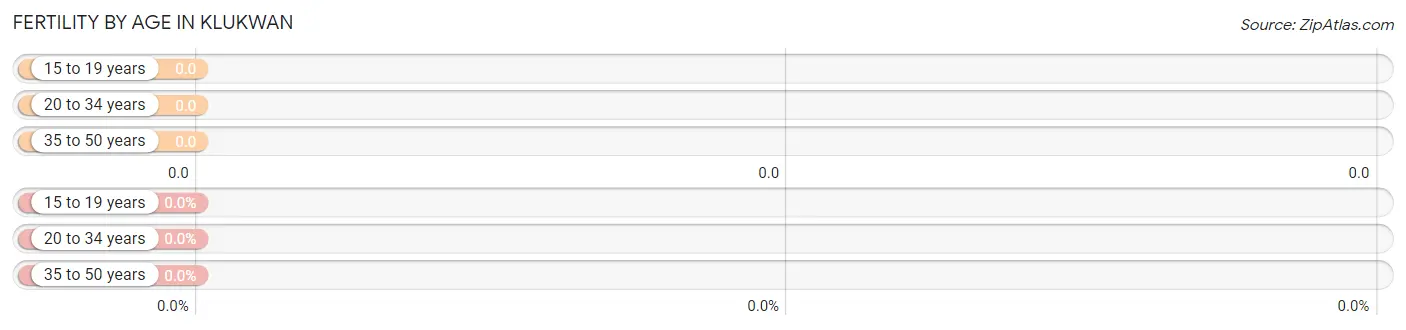
Fertility by Age in Klukwan
| Age Bracket | Women with Births | Births / 1,000 Women |
| 15 to 19 years | 0 (0.0%) | 0.0 |
| 20 to 34 years | 0 (0.0%) | 0.0 |
| 35 to 50 years | 0 (0.0%) | 0.0 |
| Total | 0 (0.0%) | 0.0 |
Fertility by Age by Marriage Status in Klukwan
| Age Bracket | Married | Unmarried |
| 15 to 19 years | 0 (0.0%) | 0 (0.0%) |
| 20 to 34 years | 0 (0.0%) | 0 (0.0%) |
| 35 to 50 years | 0 (0.0%) | 0 (0.0%) |
| Total | 0 (0.0%) | 0 (0.0%) |
Fertility by Education in Klukwan
| Educational Attainment | Women with Births | Births / 1,000 Women |
| Less than High School | 0 (0.0%) | 0.0 |
| High School Diploma | 0 (0.0%) | 0.0 |
| College or Associate's Degree | 0 (0.0%) | 0.0 |
| Bachelor's Degree | 0 (0.0%) | 0.0 |
| Graduate Degree | 0 (0.0%) | 0.0 |
| Total | 0 (0.0%) | 0.0 |
Fertility by Education by Marriage Status in Klukwan
| Educational Attainment | Married | Unmarried |
| Less than High School | 0 (0.0%) | 0 (0.0%) |
| High School Diploma | 0 (0.0%) | 0 (0.0%) |
| College or Associate's Degree | 0 (0.0%) | 0 (0.0%) |
| Bachelor's Degree | 0 (0.0%) | 0 (0.0%) |
| Graduate Degree | 0 (0.0%) | 0 (0.0%) |
| Total | 0 (0.0%) | 0 (0.0%) |
Income in Klukwan
Income Overview in Klukwan
| Characteristic | Number | Measure |
| Per Capita Income | 67 | $24,327 |
| Median Family Income | 15 | $0 |
| Mean Family Income | 15 | $67,467 |
| Median Household Income | 30 | $0 |
| Mean Household Income | 30 | $49,487 |
| Income Deficit | 15 | $0 |
| Wage / Income Gap (%) | 67 | 76.50% |
| Wage / Income Gap ($) | 67 | 23.50¢ per $1 |
| Gini / Inequality Index | 67 | 0.51 |
Earnings by Sex in Klukwan
Average Earnings in Klukwan are $19,500, $17,917 for men and $76,250 for women, a difference of 76.5%.
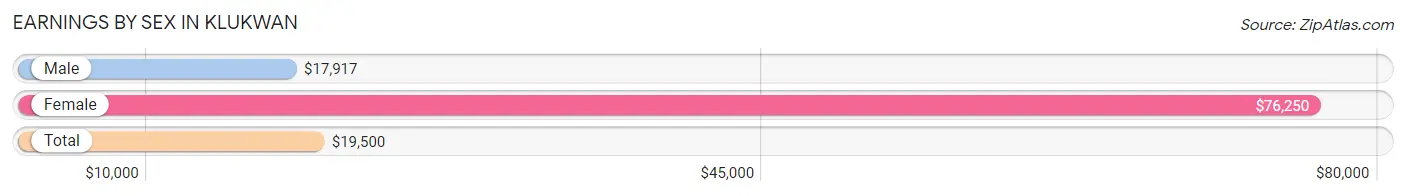
| Sex | Number | Average Earnings |
| Male | 23 (67.6%) | $17,917 |
| Female | 11 (32.4%) | $76,250 |
| Total | 34 (100.0%) | $19,500 |
Earnings by Sex by Income Bracket in Klukwan
The most common earnings brackets in Klukwan are $2,499 or less for men (6 | 26.1%) and $75,000 to $99,999 for women (7 | 63.6%).
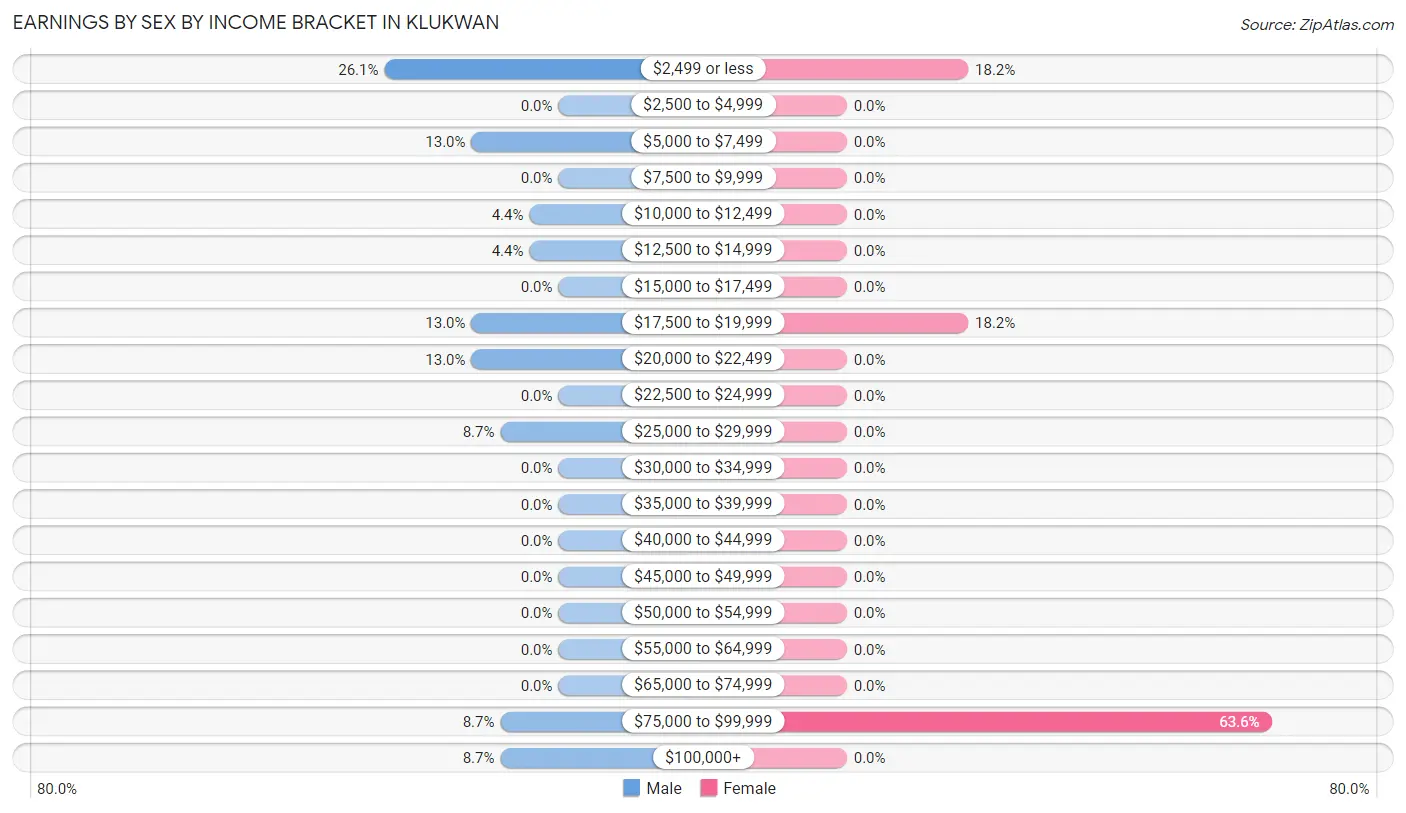
| Income | Male | Female |
| $2,499 or less | 6 (26.1%) | 2 (18.2%) |
| $2,500 to $4,999 | 0 (0.0%) | 0 (0.0%) |
| $5,000 to $7,499 | 3 (13.0%) | 0 (0.0%) |
| $7,500 to $9,999 | 0 (0.0%) | 0 (0.0%) |
| $10,000 to $12,499 | 1 (4.3%) | 0 (0.0%) |
| $12,500 to $14,999 | 1 (4.3%) | 0 (0.0%) |
| $15,000 to $17,499 | 0 (0.0%) | 0 (0.0%) |
| $17,500 to $19,999 | 3 (13.0%) | 2 (18.2%) |
| $20,000 to $22,499 | 3 (13.0%) | 0 (0.0%) |
| $22,500 to $24,999 | 0 (0.0%) | 0 (0.0%) |
| $25,000 to $29,999 | 2 (8.7%) | 0 (0.0%) |
| $30,000 to $34,999 | 0 (0.0%) | 0 (0.0%) |
| $35,000 to $39,999 | 0 (0.0%) | 0 (0.0%) |
| $40,000 to $44,999 | 0 (0.0%) | 0 (0.0%) |
| $45,000 to $49,999 | 0 (0.0%) | 0 (0.0%) |
| $50,000 to $54,999 | 0 (0.0%) | 0 (0.0%) |
| $55,000 to $64,999 | 0 (0.0%) | 0 (0.0%) |
| $65,000 to $74,999 | 0 (0.0%) | 0 (0.0%) |
| $75,000 to $99,999 | 2 (8.7%) | 7 (63.6%) |
| $100,000+ | 2 (8.7%) | 0 (0.0%) |
| Total | 23 (100.0%) | 11 (100.0%) |
Earnings by Sex by Educational Attainment in Klukwan
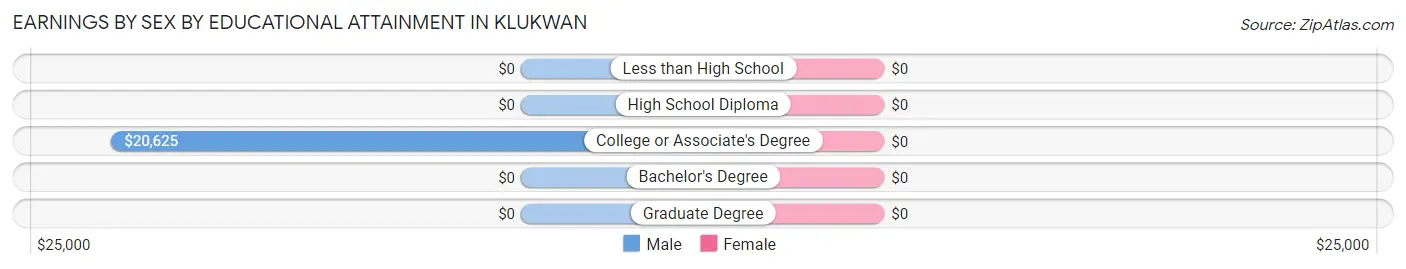
| Educational Attainment | Male Income | Female Income |
| Less than High School | - | - |
| High School Diploma | - | - |
| College or Associate's Degree | $20,625 | $0 |
| Bachelor's Degree | - | - |
| Graduate Degree | - | - |
| Total | $18,750 | $77,083 |
Family Income in Klukwan
Family Income Brackets in Klukwan
According to the Klukwan family income data, there are 5 families falling into the $100,000 to $149,999 income range, which is the most common income bracket and makes up 33.3% of all families.
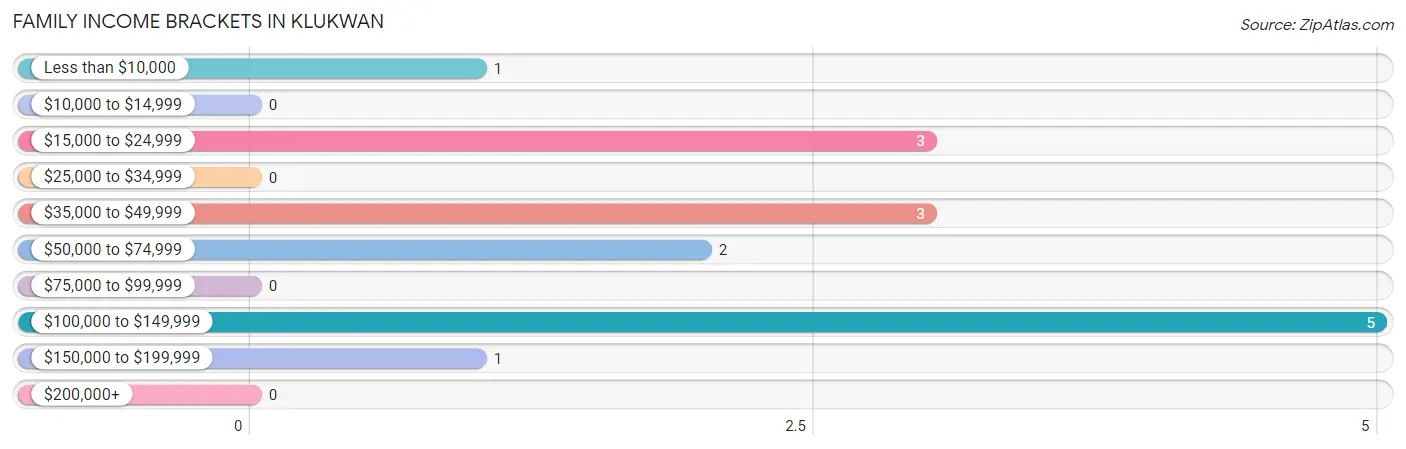
| Income Bracket | # Families | % Families |
| Less than $10,000 | 1 | 6.7% |
| $10,000 to $14,999 | 0 | 0.0% |
| $15,000 to $24,999 | 3 | 20.0% |
| $25,000 to $34,999 | 0 | 0.0% |
| $35,000 to $49,999 | 3 | 20.0% |
| $50,000 to $74,999 | 2 | 13.3% |
| $75,000 to $99,999 | 0 | 0.0% |
| $100,000 to $149,999 | 5 | 33.3% |
| $150,000 to $199,999 | 1 | 6.7% |
| $200,000+ | 0 | 0.0% |
Family Income by Famaliy Size in Klukwan
2-person families (9 | 60.0%) account for the highest median family income in Klukwan with $40,625 per family, while 2-person families (9 | 60.0%) have the highest median income of $20,312 per family member.
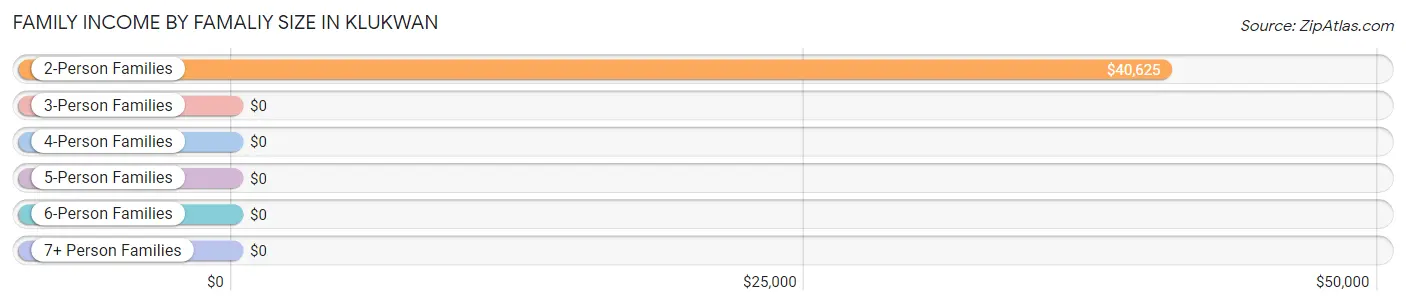
| Income Bracket | # Families | Median Income |
| 2-Person Families | 9 (60.0%) | $40,625 |
| 3-Person Families | 0 (0.0%) | $0 |
| 4-Person Families | 1 (6.7%) | $0 |
| 5-Person Families | 4 (26.7%) | $0 |
| 6-Person Families | 1 (6.7%) | $0 |
| 7+ Person Families | 0 (0.0%) | $0 |
| Total | 15 (100.0%) | $0 |
Family Income by Number of Earners in Klukwan
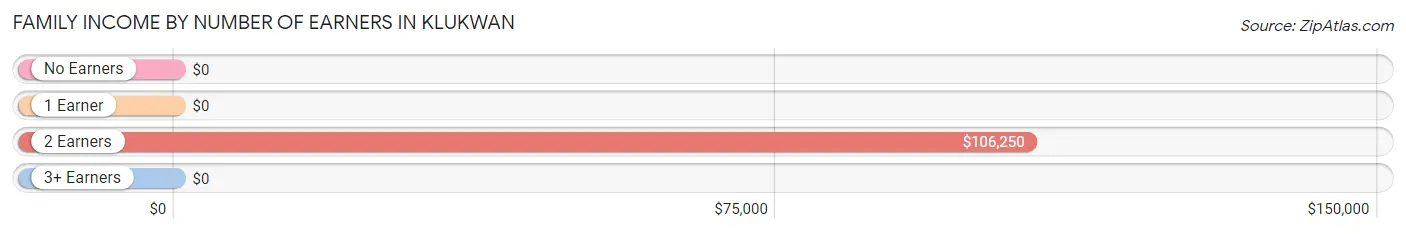
| Number of Earners | # Families | Median Income |
| No Earners | 3 (20.0%) | $0 |
| 1 Earner | 6 (40.0%) | $0 |
| 2 Earners | 5 (33.3%) | $106,250 |
| 3+ Earners | 1 (6.7%) | $0 |
| Total | 15 (100.0%) | $0 |
Household Income in Klukwan
Household Income Brackets in Klukwan
With 8 households falling in the category, the $15,000 to $24,999 income range is the most frequent in Klukwan, accounting for 26.7% of all households.
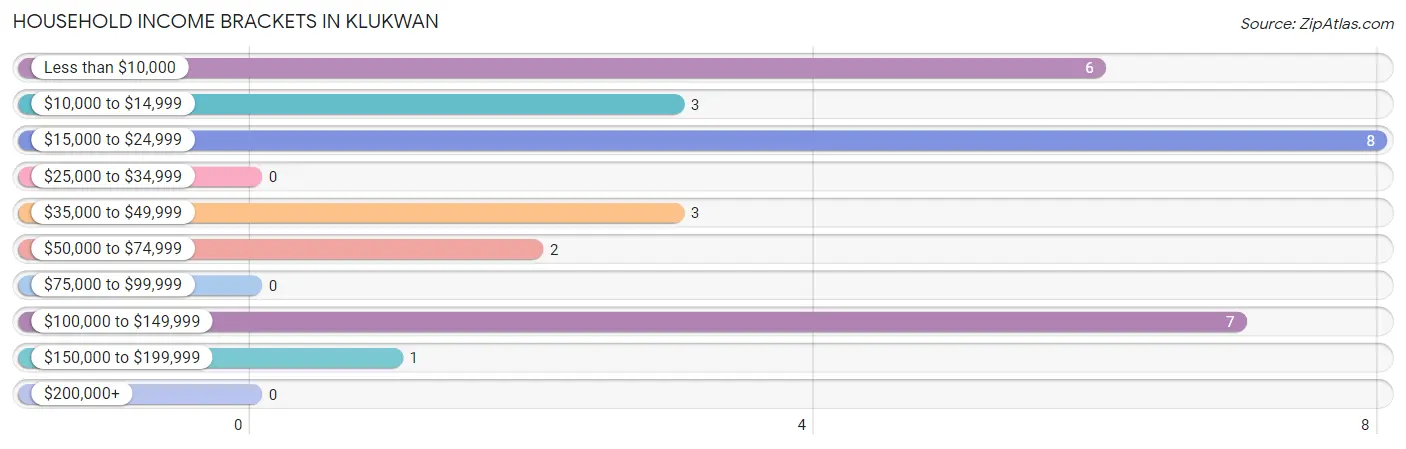
| Income Bracket | # Households | % Households |
| Less than $10,000 | 6 | 20.0% |
| $10,000 to $14,999 | 3 | 10.0% |
| $15,000 to $24,999 | 8 | 26.7% |
| $25,000 to $34,999 | 0 | 0.0% |
| $35,000 to $49,999 | 3 | 10.0% |
| $50,000 to $74,999 | 2 | 6.7% |
| $75,000 to $99,999 | 0 | 0.0% |
| $100,000 to $149,999 | 7 | 23.3% |
| $150,000 to $199,999 | 1 | 3.3% |
| $200,000+ | 0 | 0.0% |
Household Income by Householder Age in Klukwan
The median household income in Klukwan is $0, with the highest median household income of $105,833 found in the 25 to 44 years age bracket for the primary householder. A total of 8 households (26.7%) fall into this category.
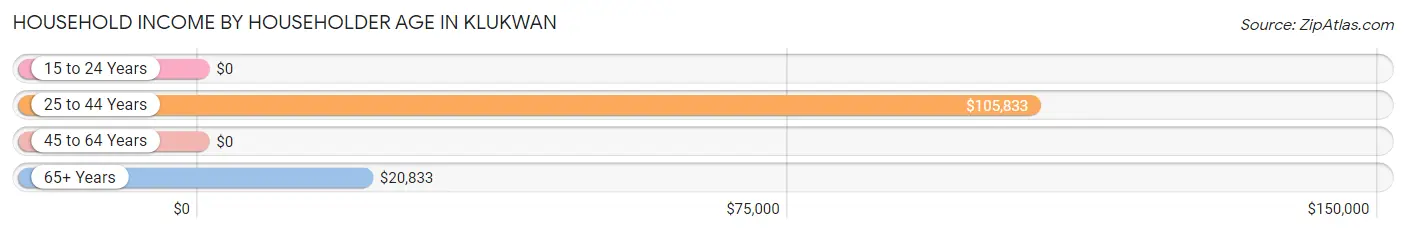
| Income Bracket | # Households | Median Income |
| 15 to 24 Years | 0 (0.0%) | $0 |
| 25 to 44 Years | 8 (26.7%) | $105,833 |
| 45 to 64 Years | 12 (40.0%) | $0 |
| 65+ Years | 10 (33.3%) | $20,833 |
| Total | 30 (100.0%) | $0 |
Poverty in Klukwan
Income Below Poverty by Sex and Age in Klukwan
With 28.9% poverty level for males and 10.3% for females among the residents of Klukwan, 45 to 54 year old males and 16 and 17 year old females are the most vulnerable to poverty, with 6 males (85.7%) and 2 females (100.0%) in their respective age groups living below the poverty level.
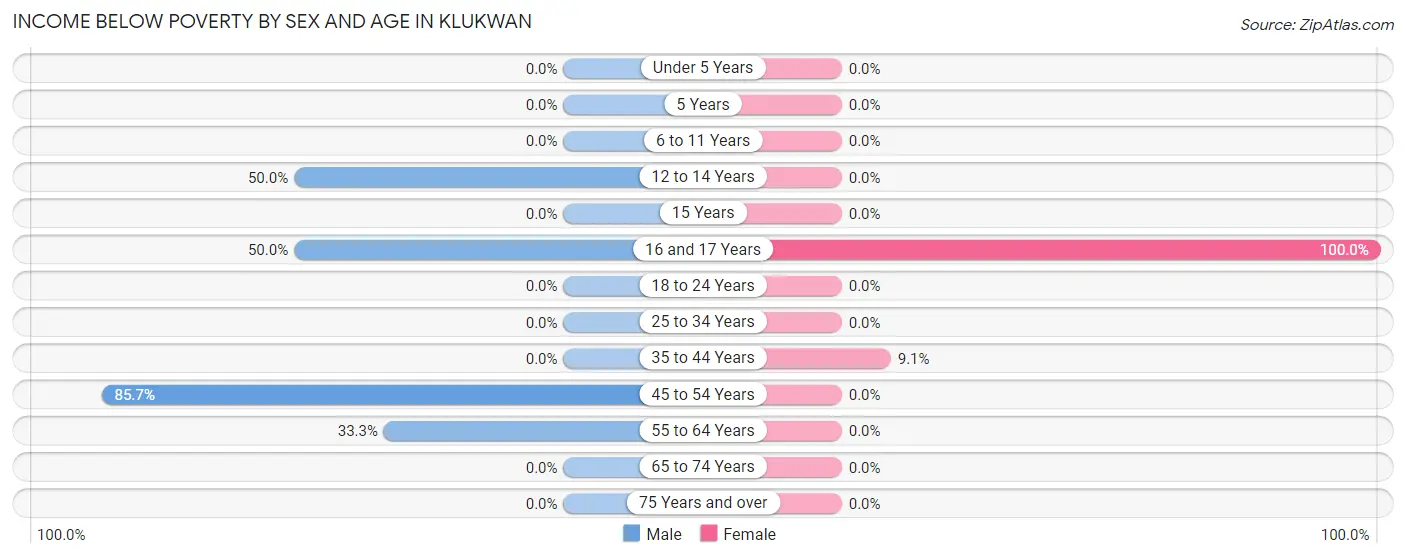
| Age Bracket | Male | Female |
| Under 5 Years | 0 (0.0%) | 0 (0.0%) |
| 5 Years | 0 (0.0%) | 0 (0.0%) |
| 6 to 11 Years | 0 (0.0%) | 0 (0.0%) |
| 12 to 14 Years | 1 (50.0%) | 0 (0.0%) |
| 15 Years | 0 (0.0%) | 0 (0.0%) |
| 16 and 17 Years | 2 (50.0%) | 2 (100.0%) |
| 18 to 24 Years | 0 (0.0%) | 0 (0.0%) |
| 25 to 34 Years | 0 (0.0%) | 0 (0.0%) |
| 35 to 44 Years | 0 (0.0%) | 1 (9.1%) |
| 45 to 54 Years | 6 (85.7%) | 0 (0.0%) |
| 55 to 64 Years | 2 (33.3%) | 0 (0.0%) |
| 65 to 74 Years | 0 (0.0%) | 0 (0.0%) |
| 75 Years and over | 0 (0.0%) | 0 (0.0%) |
| Total | 11 (28.9%) | 3 (10.3%) |
Income Above Poverty by Sex and Age in Klukwan
According to the poverty statistics in Klukwan, males aged 5 years and females aged under 5 years are the age groups that are most secure financially, with 100.0% of males and 100.0% of females in these age groups living above the poverty line.
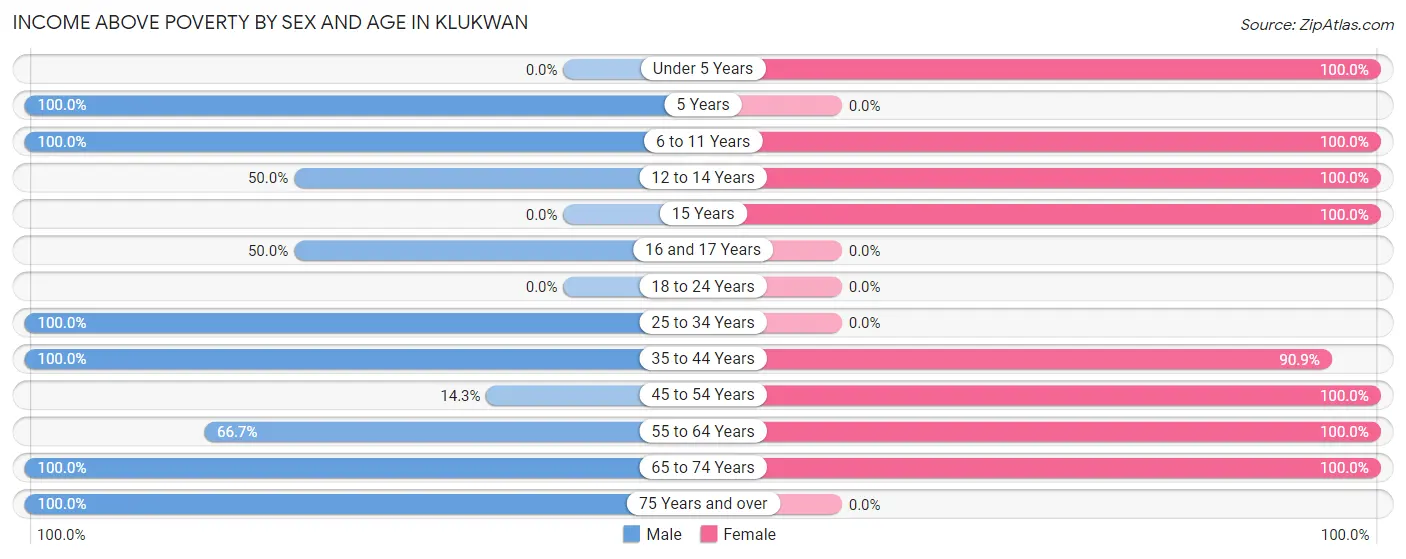
| Age Bracket | Male | Female |
| Under 5 Years | 0 (0.0%) | 1 (100.0%) |
| 5 Years | 1 (100.0%) | 0 (0.0%) |
| 6 to 11 Years | 1 (100.0%) | 1 (100.0%) |
| 12 to 14 Years | 1 (50.0%) | 1 (100.0%) |
| 15 Years | 0 (0.0%) | 2 (100.0%) |
| 16 and 17 Years | 2 (50.0%) | 0 (0.0%) |
| 18 to 24 Years | 0 (0.0%) | 0 (0.0%) |
| 25 to 34 Years | 2 (100.0%) | 0 (0.0%) |
| 35 to 44 Years | 6 (100.0%) | 10 (90.9%) |
| 45 to 54 Years | 1 (14.3%) | 1 (100.0%) |
| 55 to 64 Years | 4 (66.7%) | 3 (100.0%) |
| 65 to 74 Years | 5 (100.0%) | 7 (100.0%) |
| 75 Years and over | 4 (100.0%) | 0 (0.0%) |
| Total | 27 (71.1%) | 26 (89.7%) |
Income Below Poverty Among Married-Couple Families in Klukwan
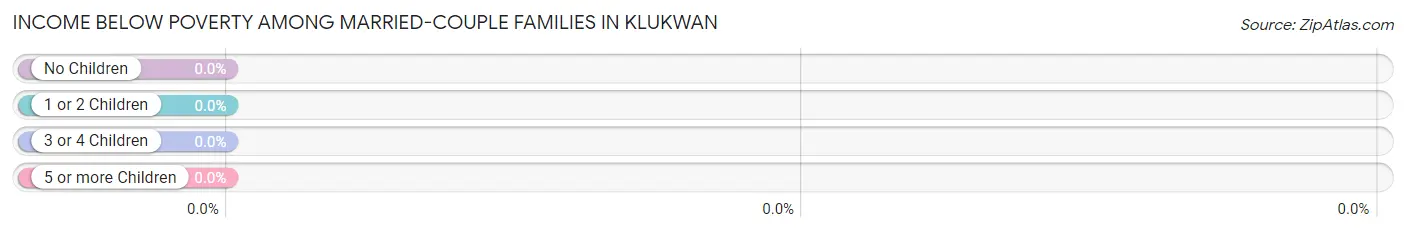
| Children | Above Poverty | Below Poverty |
| No Children | 4 (100.0%) | 0 (0.0%) |
| 1 or 2 Children | 1 (100.0%) | 0 (0.0%) |
| 3 or 4 Children | 4 (100.0%) | 0 (0.0%) |
| 5 or more Children | 0 (0.0%) | 0 (0.0%) |
| Total | 9 (100.0%) | 0 (0.0%) |
Income Below Poverty Among Single-Parent Households in Klukwan
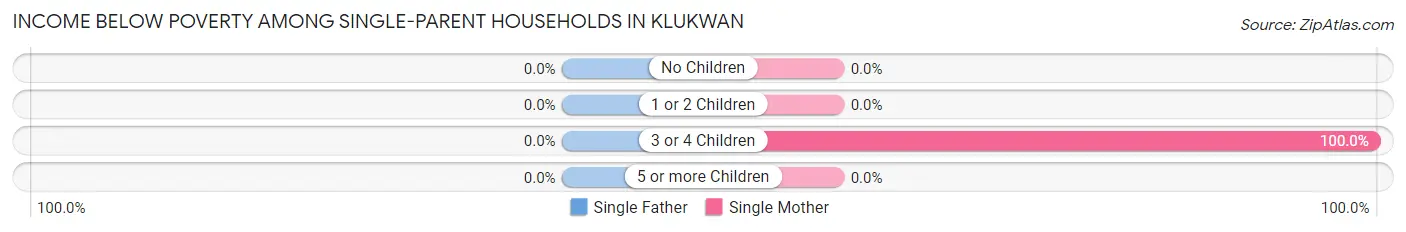
| Children | Single Father | Single Mother |
| No Children | 0 (0.0%) | 0 (0.0%) |
| 1 or 2 Children | 0 (0.0%) | 0 (0.0%) |
| 3 or 4 Children | 0 (0.0%) | 1 (100.0%) |
| 5 or more Children | 0 (0.0%) | 0 (0.0%) |
| Total | 0 (0.0%) | 1 (33.3%) |
Income Below Poverty Among Married-Couple vs Single-Parent Households in Klukwan
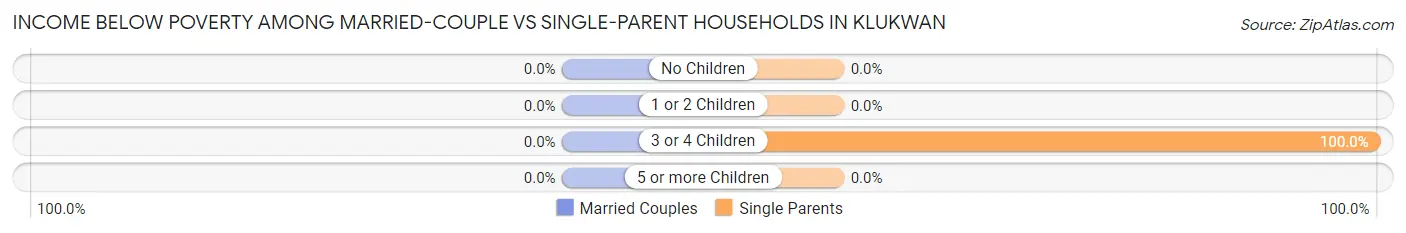
| Children | Married-Couple Families | Single-Parent Households |
| No Children | 0 (0.0%) | 0 (0.0%) |
| 1 or 2 Children | 0 (0.0%) | 0 (0.0%) |
| 3 or 4 Children | 0 (0.0%) | 1 (100.0%) |
| 5 or more Children | 0 (0.0%) | 0 (0.0%) |
| Total | 0 (0.0%) | 1 (16.7%) |
Employment Characteristics in Klukwan
Employment by Class of Employer in Klukwan
Among the 25 employed individuals in Klukwan, private company employees (8 | 32.0%), local government employees (8 | 32.0%), and self-employed (not incorporated) (6 | 24.0%) make up the most common classes of employment.
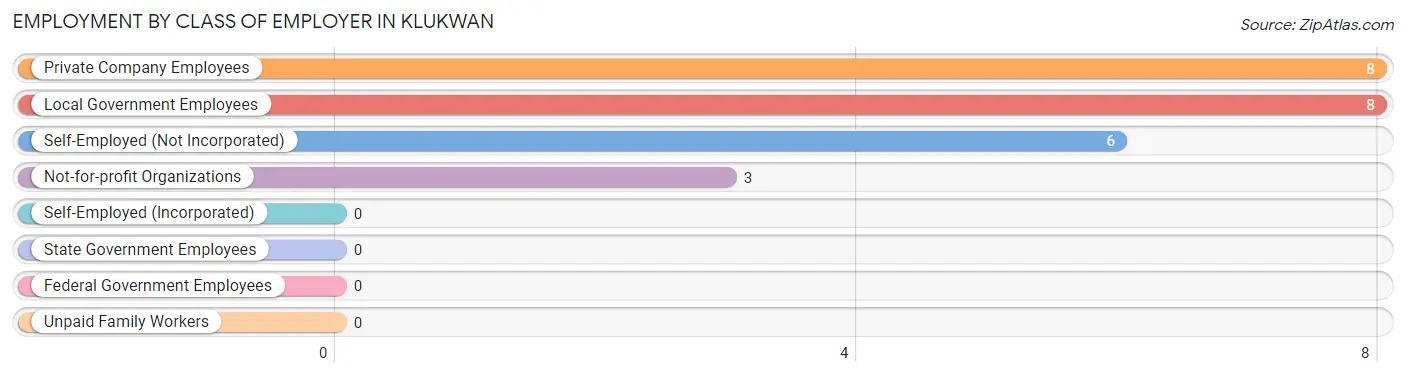
| Employer Class | # Employees | % Employees |
| Private Company Employees | 8 | 32.0% |
| Self-Employed (Incorporated) | 0 | 0.0% |
| Self-Employed (Not Incorporated) | 6 | 24.0% |
| Not-for-profit Organizations | 3 | 12.0% |
| Local Government Employees | 8 | 32.0% |
| State Government Employees | 0 | 0.0% |
| Federal Government Employees | 0 | 0.0% |
| Unpaid Family Workers | 0 | 0.0% |
| Total | 25 | 100.0% |
Employment Status by Age in Klukwan
According to the labor force statistics for Klukwan, out of the total population over 16 years of age (58), 50.0% or 29 individuals are in the labor force, with 6.9% or 2 of them unemployed. The age group with the highest labor force participation rate is 55 to 59 years, with 100.0% or 4 individuals in the labor force. Within the labor force, the 35 to 44 years age range has the highest percentage of unemployed individuals, with 16.7% or 2 of them being unemployed.
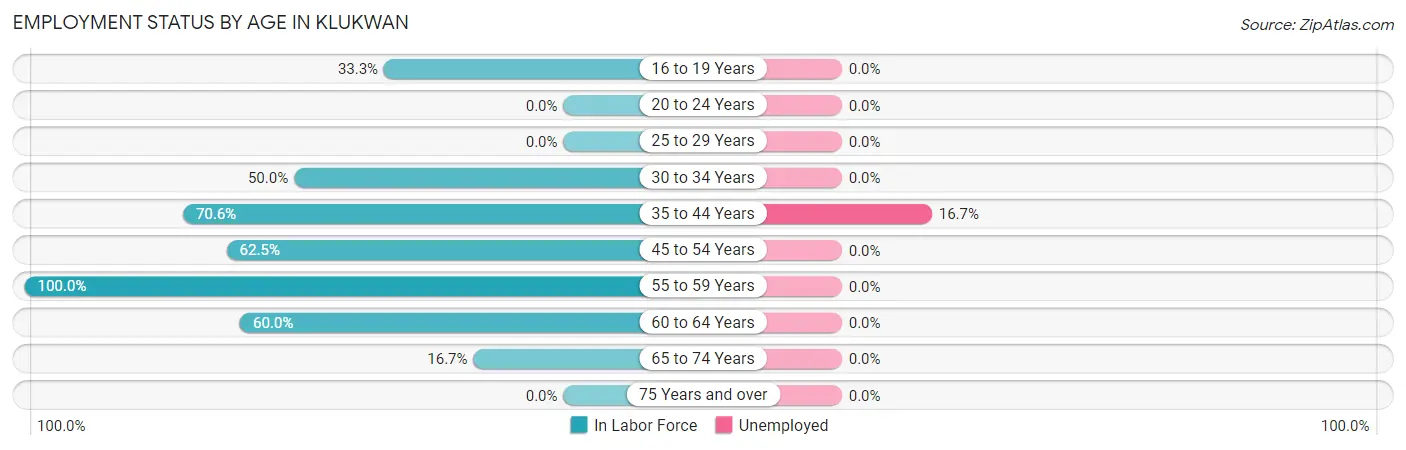
| Age Bracket | In Labor Force | Unemployed |
| 16 to 19 Years | 2 (33.3%) | 0 (0.0%) |
| 20 to 24 Years | 0 (0.0%) | 0 (0.0%) |
| 25 to 29 Years | 0 (0.0%) | 0 (0.0%) |
| 30 to 34 Years | 1 (50.0%) | 0 (0.0%) |
| 35 to 44 Years | 12 (70.6%) | 2 (16.7%) |
| 45 to 54 Years | 5 (62.5%) | 0 (0.0%) |
| 55 to 59 Years | 4 (100.0%) | 0 (0.0%) |
| 60 to 64 Years | 3 (60.0%) | 0 (0.0%) |
| 65 to 74 Years | 2 (16.7%) | 0 (0.0%) |
| 75 Years and over | 0 (0.0%) | 0 (0.0%) |
| Total | 29 (50.0%) | 2 (6.9%) |
Employment Status by Educational Attainment in Klukwan
According to labor force statistics for Klukwan, 69.4% of individuals (25) out of the total population between 25 and 64 years of age (36) are in the labor force, with 8.0% or 2 of them being unemployed. The group with the highest labor force participation rate are those with the educational attainment of bachelor's degree or higher, with 100.0% or 7 individuals in the labor force. Within the labor force, individuals with college / associate degree education have the highest percentage of unemployment, with 18.2% or 2 of them being unemployed.
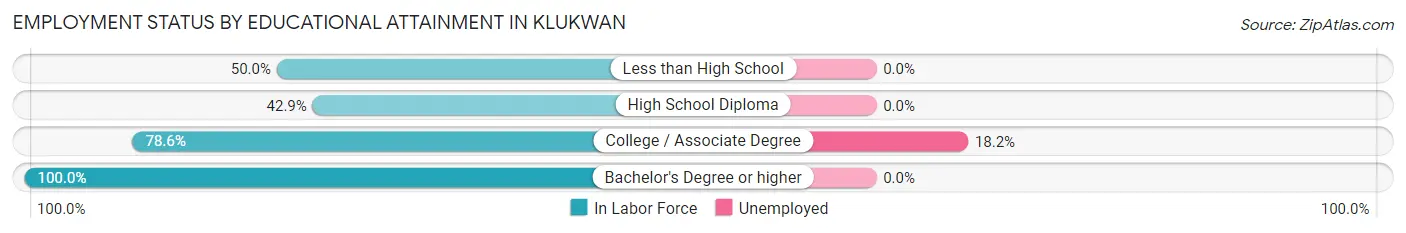
| Educational Attainment | In Labor Force | Unemployed |
| Less than High School | 4 (50.0%) | 0 (0.0%) |
| High School Diploma | 3 (42.9%) | 0 (0.0%) |
| College / Associate Degree | 11 (78.6%) | 3 (18.2%) |
| Bachelor's Degree or higher | 7 (100.0%) | 0 (0.0%) |
| Total | 25 (69.4%) | 3 (8.0%) |
Employment Occupations by Sex in Klukwan
Management, Business, Science and Arts Occupations
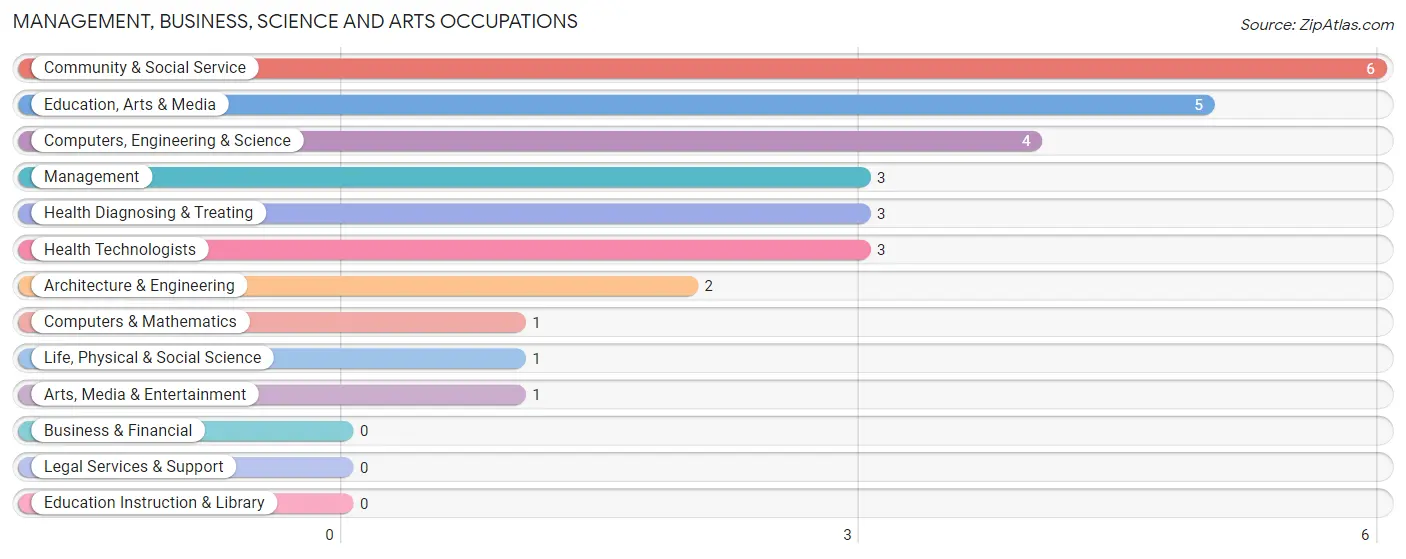
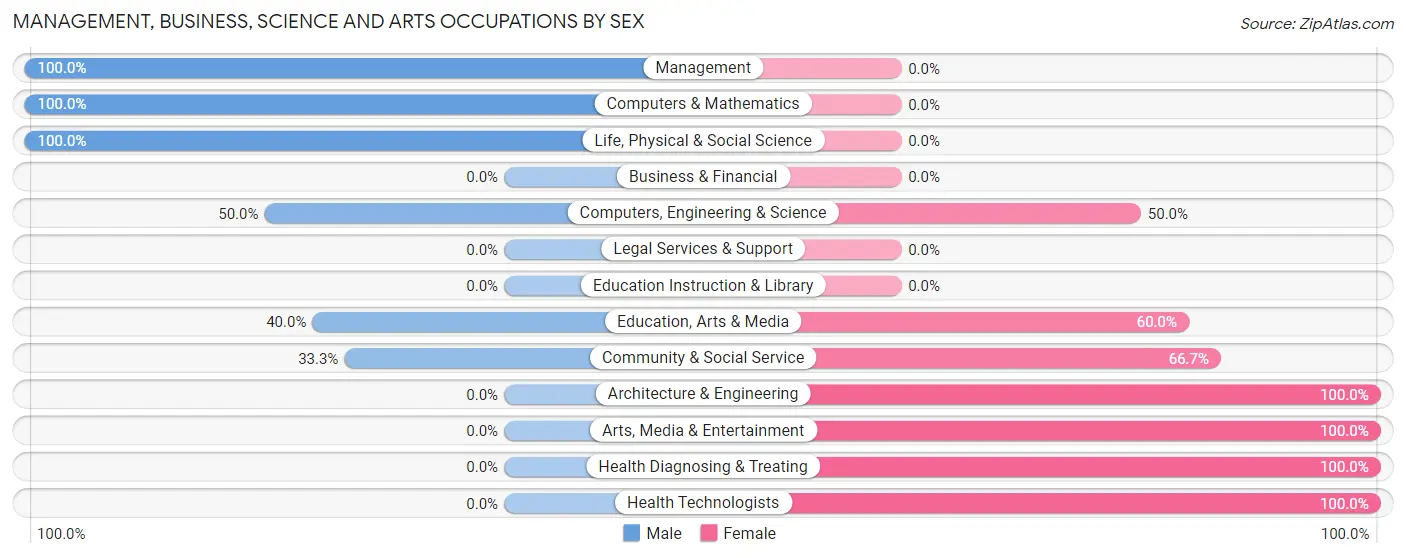
The most common Management, Business, Science and Arts occupations in Klukwan are Community & Social Service (6 | 22.2%), Education, Arts & Media (5 | 18.5%), Computers, Engineering & Science (4 | 14.8%), Management (3 | 11.1%), and Health Diagnosing & Treating (3 | 11.1%).
Management, Business, Science and Arts Occupations by Sex
Within the Management, Business, Science and Arts occupations in Klukwan, the most male-oriented occupations are Management (100.0%), Computers & Mathematics (100.0%), and Life, Physical & Social Science (100.0%), while the most female-oriented occupations are Architecture & Engineering (100.0%), Arts, Media & Entertainment (100.0%), and Health Diagnosing & Treating (100.0%).
| Occupation | Male | Female |
| Management | 3 (100.0%) | 0 (0.0%) |
| Business & Financial | 0 (0.0%) | 0 (0.0%) |
| Computers, Engineering & Science | 2 (50.0%) | 2 (50.0%) |
| Computers & Mathematics | 1 (100.0%) | 0 (0.0%) |
| Architecture & Engineering | 0 (0.0%) | 2 (100.0%) |
| Life, Physical & Social Science | 1 (100.0%) | 0 (0.0%) |
| Community & Social Service | 2 (33.3%) | 4 (66.7%) |
| Education, Arts & Media | 2 (40.0%) | 3 (60.0%) |
| Legal Services & Support | 0 (0.0%) | 0 (0.0%) |
| Education Instruction & Library | 0 (0.0%) | 0 (0.0%) |
| Arts, Media & Entertainment | 0 (0.0%) | 1 (100.0%) |
| Health Diagnosing & Treating | 0 (0.0%) | 3 (100.0%) |
| Health Technologists | 0 (0.0%) | 3 (100.0%) |
| Total (Category) | 7 (43.8%) | 9 (56.2%) |
| Total (Overall) | 16 (59.3%) | 11 (40.7%) |
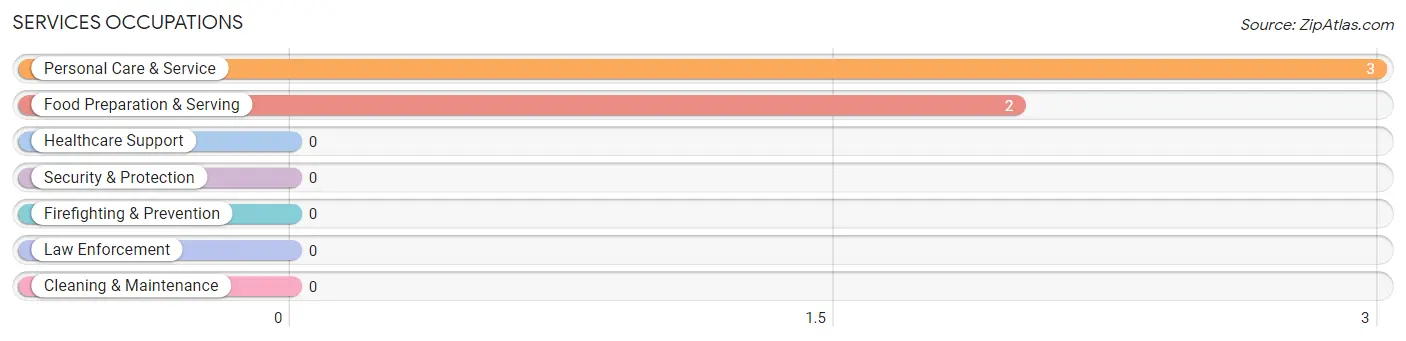
Services Occupations
The most common Services occupations in Klukwan are Personal Care & Service (3 | 11.1%), and Food Preparation & Serving (2 | 7.4%).
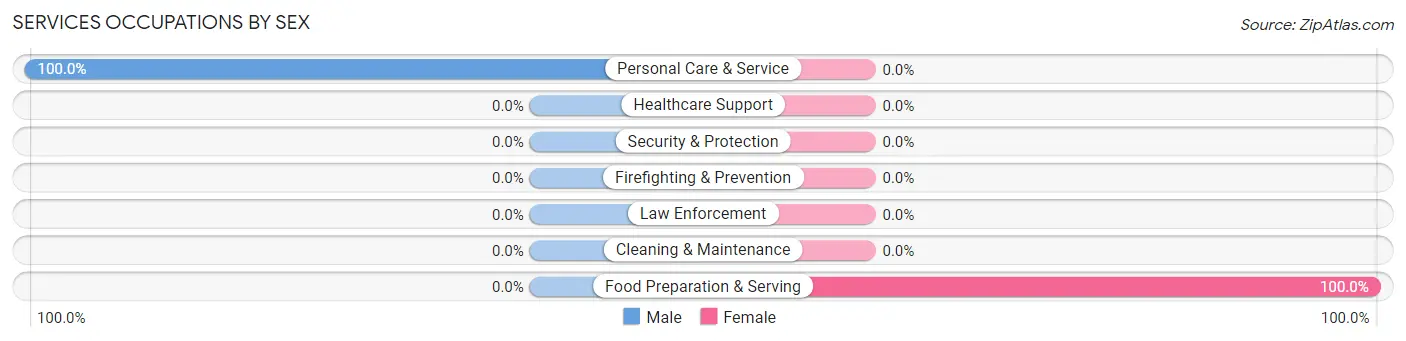
Services Occupations by Sex
| Occupation | Male | Female |
| Healthcare Support | 0 (0.0%) | 0 (0.0%) |
| Security & Protection | 0 (0.0%) | 0 (0.0%) |
| Firefighting & Prevention | 0 (0.0%) | 0 (0.0%) |
| Law Enforcement | 0 (0.0%) | 0 (0.0%) |
| Food Preparation & Serving | 0 (0.0%) | 2 (100.0%) |
| Cleaning & Maintenance | 0 (0.0%) | 0 (0.0%) |
| Personal Care & Service | 3 (100.0%) | 0 (0.0%) |
| Total (Category) | 3 (60.0%) | 2 (40.0%) |
| Total (Overall) | 16 (59.3%) | 11 (40.7%) |
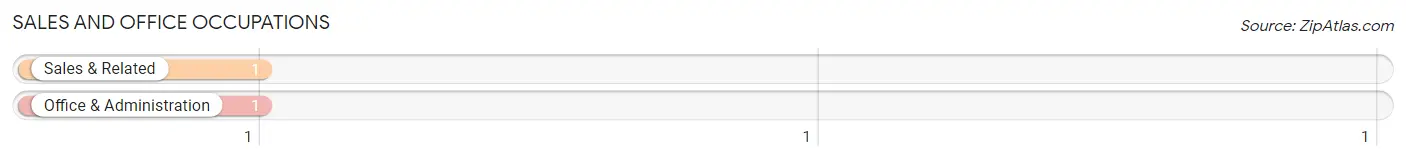
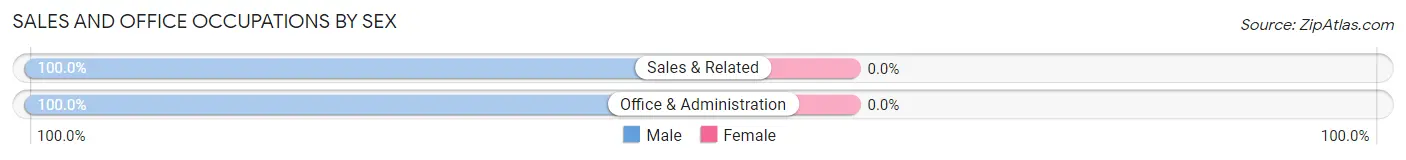
Sales and Office Occupations
The most common Sales and Office occupations in Klukwan are Sales & Related (1 | 3.7%), and Office & Administration (1 | 3.7%).
Sales and Office Occupations by Sex
| Occupation | Male | Female |
| Sales & Related | 1 (100.0%) | 0 (0.0%) |
| Office & Administration | 1 (100.0%) | 0 (0.0%) |
| Total (Category) | 2 (100.0%) | 0 (0.0%) |
| Total (Overall) | 16 (59.3%) | 11 (40.7%) |
Natural Resources, Construction and Maintenance Occupations
The most common Natural Resources, Construction and Maintenance occupations in Klukwan are , and Construction & Extraction (2 | 7.4%).
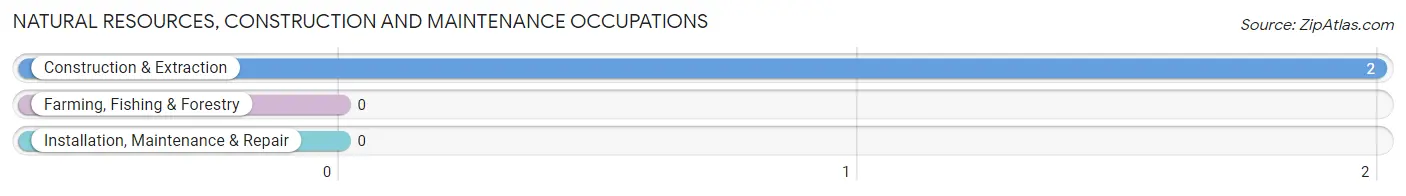
Natural Resources, Construction and Maintenance Occupations by Sex
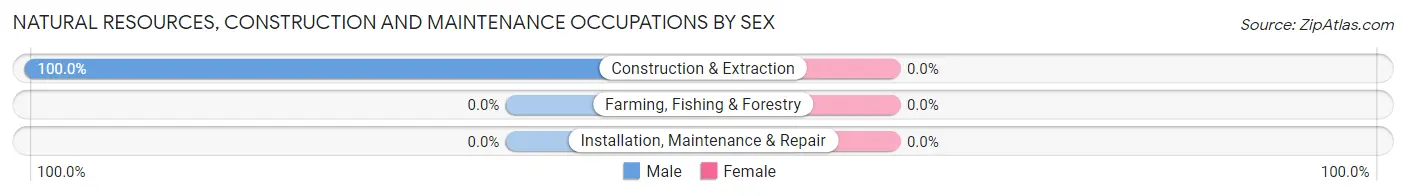
| Occupation | Male | Female |
| Farming, Fishing & Forestry | 0 (0.0%) | 0 (0.0%) |
| Construction & Extraction | 2 (100.0%) | 0 (0.0%) |
| Installation, Maintenance & Repair | 0 (0.0%) | 0 (0.0%) |
| Total (Category) | 2 (100.0%) | 0 (0.0%) |
| Total (Overall) | 16 (59.3%) | 11 (40.7%) |
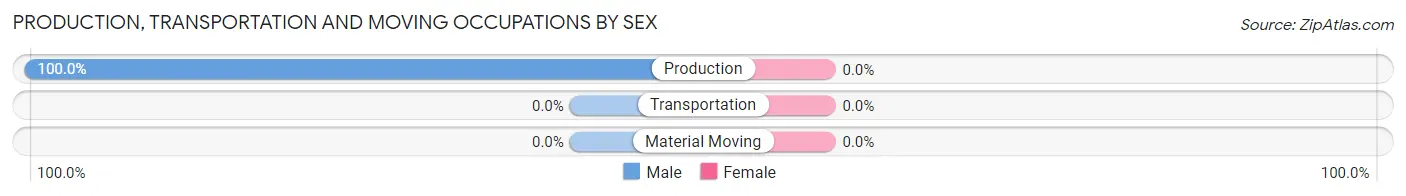
Production, Transportation and Moving Occupations
The most common Production, Transportation and Moving occupations in Klukwan are , and Production (2 | 7.4%).
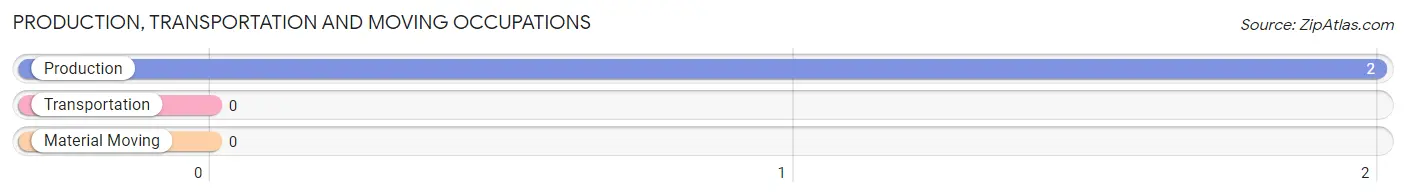
Production, Transportation and Moving Occupations by Sex
| Occupation | Male | Female |
| Production | 2 (100.0%) | 0 (0.0%) |
| Transportation | 0 (0.0%) | 0 (0.0%) |
| Material Moving | 0 (0.0%) | 0 (0.0%) |
| Total (Category) | 2 (100.0%) | 0 (0.0%) |
| Total (Overall) | 16 (59.3%) | 11 (40.7%) |
Employment Industries by Sex in Klukwan
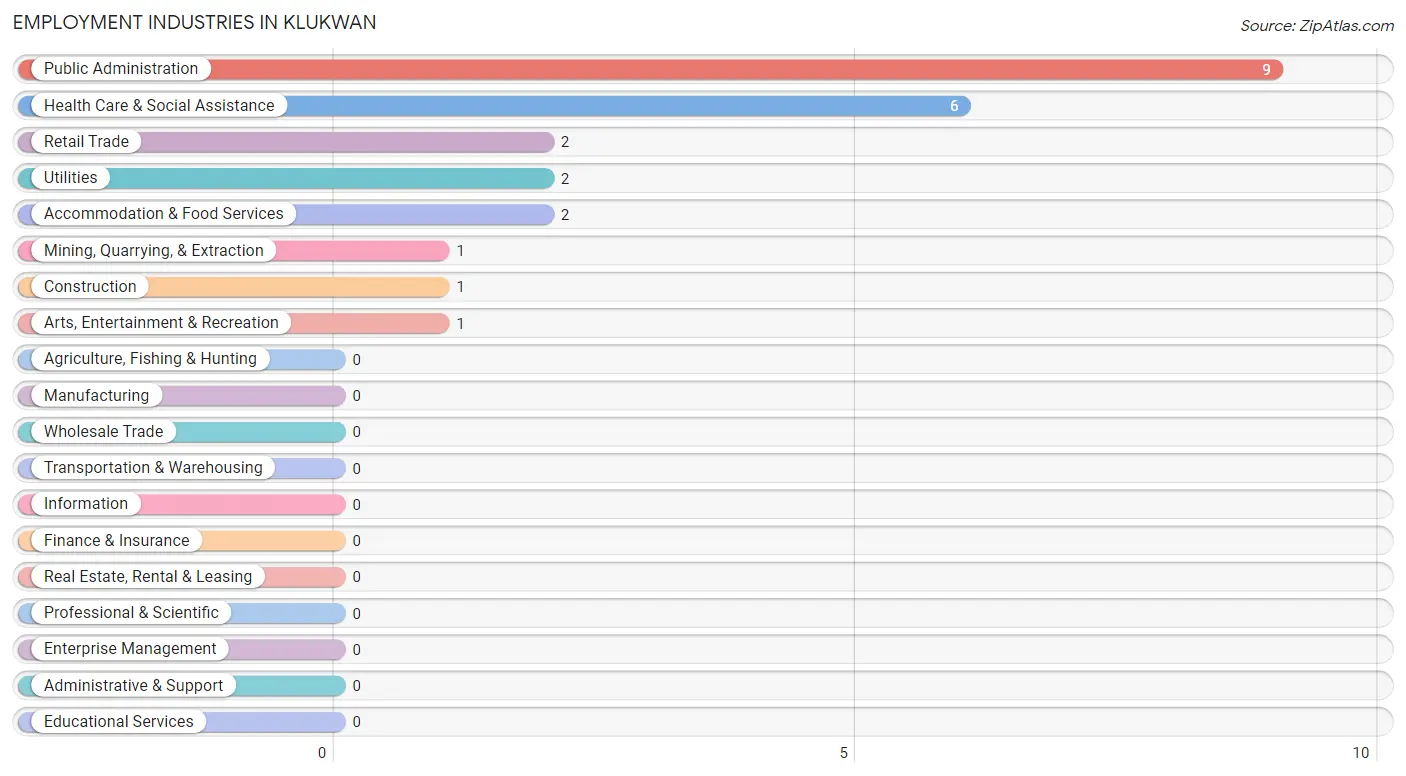
Employment Industries in Klukwan
The major employment industries in Klukwan include Public Administration (9 | 33.3%), Health Care & Social Assistance (6 | 22.2%), Retail Trade (2 | 7.4%), Utilities (2 | 7.4%), and Accommodation & Food Services (2 | 7.4%).
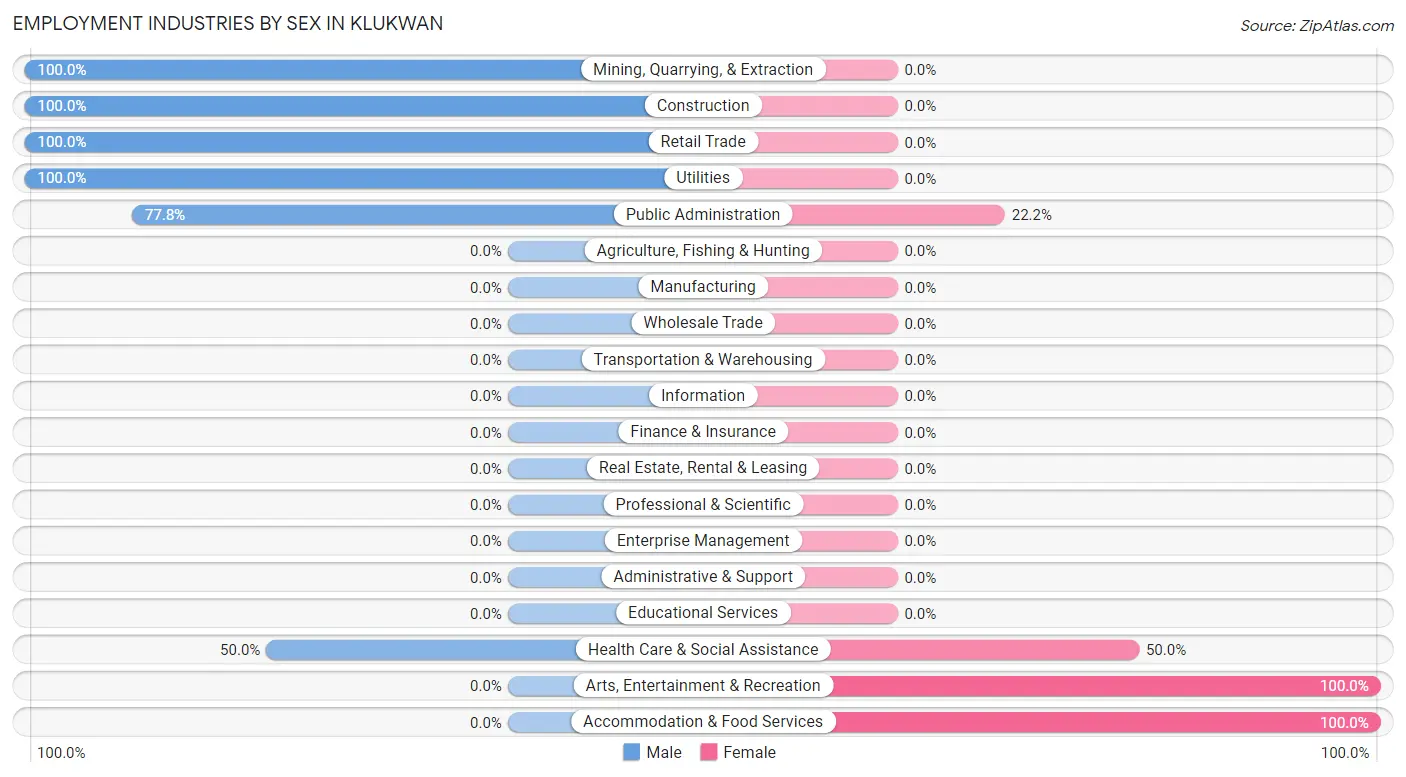
Employment Industries by Sex in Klukwan
The Klukwan industries that see more men than women are Mining, Quarrying, & Extraction (100.0%), Construction (100.0%), and Retail Trade (100.0%), whereas the industries that tend to have a higher number of women are Arts, Entertainment & Recreation (100.0%), Accommodation & Food Services (100.0%), and Health Care & Social Assistance (50.0%).
| Industry | Male | Female |
| Agriculture, Fishing & Hunting | 0 (0.0%) | 0 (0.0%) |
| Mining, Quarrying, & Extraction | 1 (100.0%) | 0 (0.0%) |
| Construction | 1 (100.0%) | 0 (0.0%) |
| Manufacturing | 0 (0.0%) | 0 (0.0%) |
| Wholesale Trade | 0 (0.0%) | 0 (0.0%) |
| Retail Trade | 2 (100.0%) | 0 (0.0%) |
| Transportation & Warehousing | 0 (0.0%) | 0 (0.0%) |
| Utilities | 2 (100.0%) | 0 (0.0%) |
| Information | 0 (0.0%) | 0 (0.0%) |
| Finance & Insurance | 0 (0.0%) | 0 (0.0%) |
| Real Estate, Rental & Leasing | 0 (0.0%) | 0 (0.0%) |
| Professional & Scientific | 0 (0.0%) | 0 (0.0%) |
| Enterprise Management | 0 (0.0%) | 0 (0.0%) |
| Administrative & Support | 0 (0.0%) | 0 (0.0%) |
| Educational Services | 0 (0.0%) | 0 (0.0%) |
| Health Care & Social Assistance | 3 (50.0%) | 3 (50.0%) |
| Arts, Entertainment & Recreation | 0 (0.0%) | 1 (100.0%) |
| Accommodation & Food Services | 0 (0.0%) | 2 (100.0%) |
| Public Administration | 7 (77.8%) | 2 (22.2%) |
| Total | 16 (59.3%) | 11 (40.7%) |
Education in Klukwan
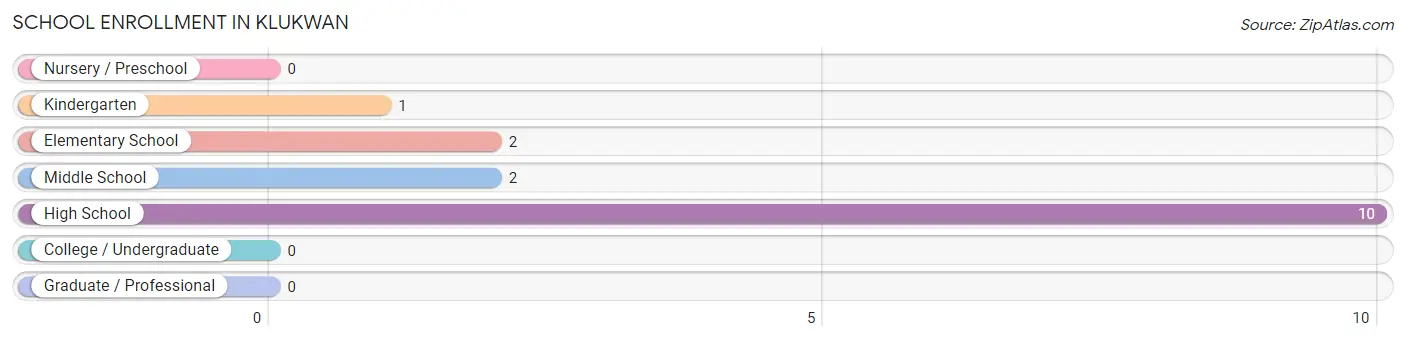
School Enrollment in Klukwan
The most common levels of schooling among the 15 students in Klukwan are high school (10 | 66.7%), elementary school (2 | 13.3%), and middle school (2 | 13.3%).
| School Level | # Students | % Students |
| Nursery / Preschool | 0 | 0.0% |
| Kindergarten | 1 | 6.7% |
| Elementary School | 2 | 13.3% |
| Middle School | 2 | 13.3% |
| High School | 10 | 66.7% |
| College / Undergraduate | 0 | 0.0% |
| Graduate / Professional | 0 | 0.0% |
| Total | 15 | 100.0% |
School Enrollment by Age by Funding Source in Klukwan
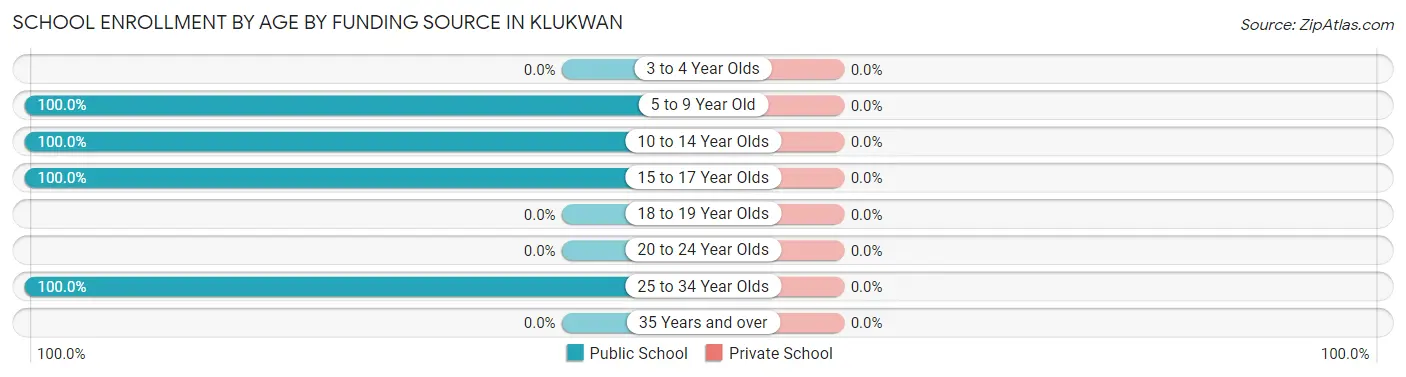
| Age Bracket | Public School | Private School |
| 3 to 4 Year Olds | 0 (0.0%) | 0 (0.0%) |
| 5 to 9 Year Old | 2 (100.0%) | 0 (0.0%) |
| 10 to 14 Year Olds | 4 (100.0%) | 0 (0.0%) |
| 15 to 17 Year Olds | 8 (100.0%) | 0 (0.0%) |
| 18 to 19 Year Olds | 0 (0.0%) | 0 (0.0%) |
| 20 to 24 Year Olds | 0 (0.0%) | 0 (0.0%) |
| 25 to 34 Year Olds | 1 (100.0%) | 0 (0.0%) |
| 35 Years and over | 0 (0.0%) | 0 (0.0%) |
| Total | 15 (100.0%) | 0 (0.0%) |
Educational Attainment by Field of Study in Klukwan
Social sciences (4 | 57.1%), and business (3 | 42.9%) are the most common fields of study among 7 individuals in Klukwan who have obtained a bachelor's degree or higher.
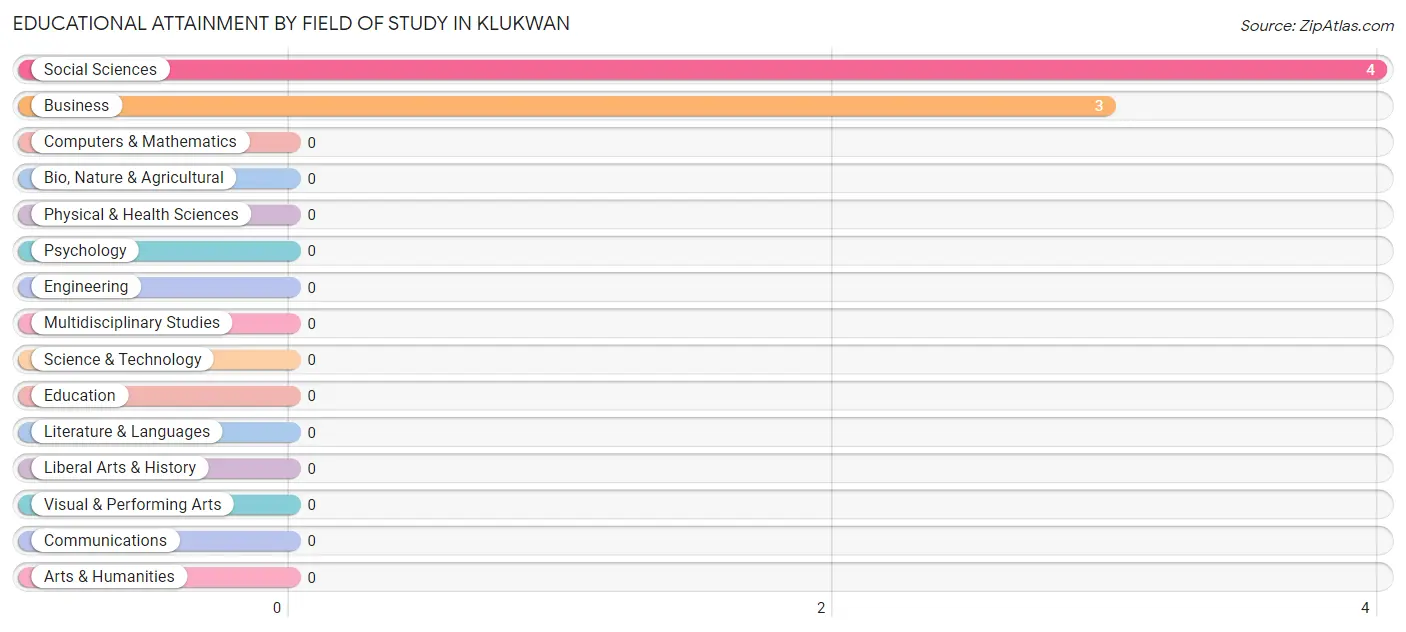
| Field of Study | # Graduates | % Graduates |
| Computers & Mathematics | 0 | 0.0% |
| Bio, Nature & Agricultural | 0 | 0.0% |
| Physical & Health Sciences | 0 | 0.0% |
| Psychology | 0 | 0.0% |
| Social Sciences | 4 | 57.1% |
| Engineering | 0 | 0.0% |
| Multidisciplinary Studies | 0 | 0.0% |
| Science & Technology | 0 | 0.0% |
| Business | 3 | 42.9% |
| Education | 0 | 0.0% |
| Literature & Languages | 0 | 0.0% |
| Liberal Arts & History | 0 | 0.0% |
| Visual & Performing Arts | 0 | 0.0% |
| Communications | 0 | 0.0% |
| Arts & Humanities | 0 | 0.0% |
| Total | 7 | 100.0% |
Transportation & Commute in Klukwan
Vehicle Availability by Sex in Klukwan
The most prevalent vehicle ownership categories in Klukwan are males with 1 vehicle (9, accounting for 60.0%) and females with 1 vehicle (5, making up 90.0%).
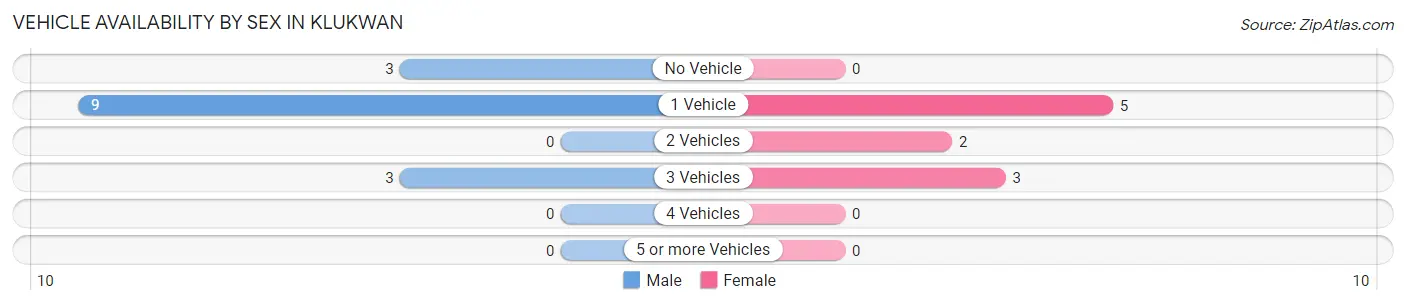
| Vehicles Available | Male | Female |
| No Vehicle | 3 (20.0%) | 0 (0.0%) |
| 1 Vehicle | 9 (60.0%) | 5 (50.0%) |
| 2 Vehicles | 0 (0.0%) | 2 (20.0%) |
| 3 Vehicles | 3 (20.0%) | 3 (30.0%) |
| 4 Vehicles | 0 (0.0%) | 0 (0.0%) |
| 5 or more Vehicles | 0 (0.0%) | 0 (0.0%) |
| Total | 15 (100.0%) | 10 (100.0%) |
Commute Time in Klukwan
The most frequently occuring commute durations in Klukwan are less than 5 minutes (7 commuters, 43.8%), 5 to 9 minutes (4 commuters, 25.0%), and 30 to 34 minutes (2 commuters, 12.5%).
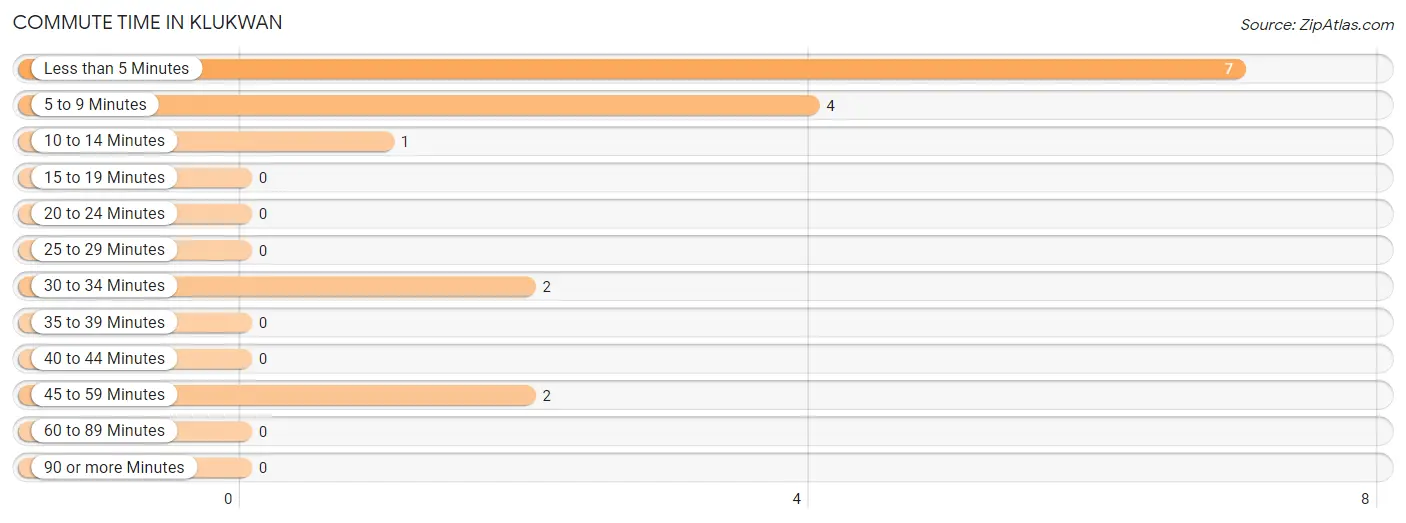
| Commute Time | # Commuters | % Commuters |
| Less than 5 Minutes | 7 | 43.8% |
| 5 to 9 Minutes | 4 | 25.0% |
| 10 to 14 Minutes | 1 | 6.2% |
| 15 to 19 Minutes | 0 | 0.0% |
| 20 to 24 Minutes | 0 | 0.0% |
| 25 to 29 Minutes | 0 | 0.0% |
| 30 to 34 Minutes | 2 | 12.5% |
| 35 to 39 Minutes | 0 | 0.0% |
| 40 to 44 Minutes | 0 | 0.0% |
| 45 to 59 Minutes | 2 | 12.5% |
| 60 to 89 Minutes | 0 | 0.0% |
| 90 or more Minutes | 0 | 0.0% |
Commute Time by Sex in Klukwan
The most common commute times in Klukwan are less than 5 minutes (4 commuters, 44.4%) for males and less than 5 minutes (3 commuters, 42.9%) for females.
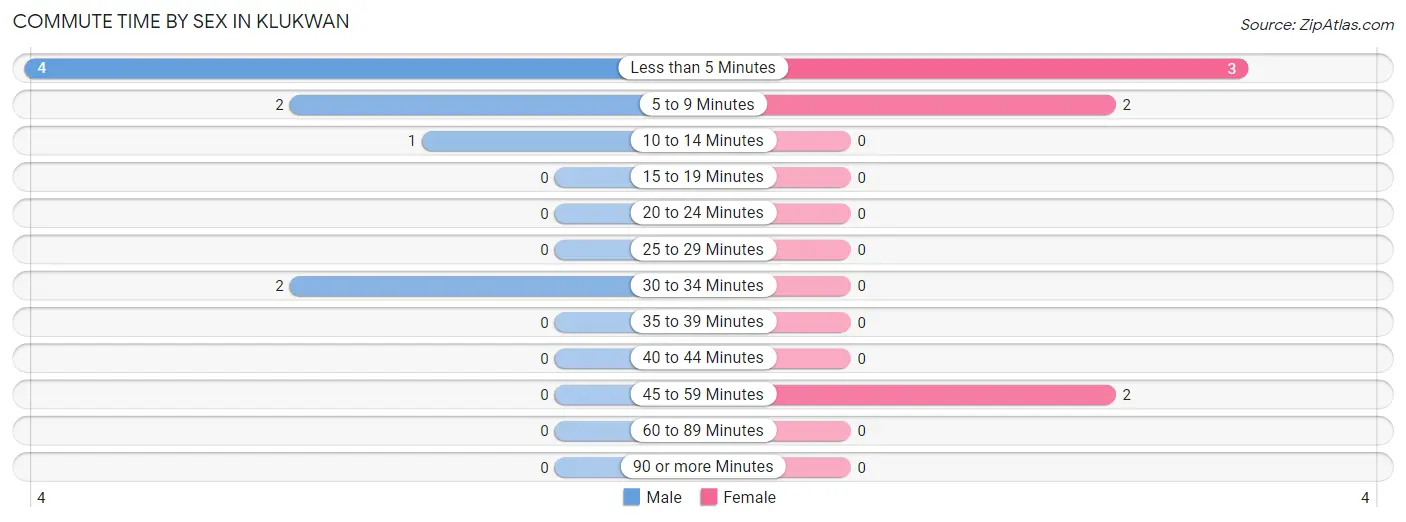
| Commute Time | Male | Female |
| Less than 5 Minutes | 4 (44.4%) | 3 (42.9%) |
| 5 to 9 Minutes | 2 (22.2%) | 2 (28.6%) |
| 10 to 14 Minutes | 1 (11.1%) | 0 (0.0%) |
| 15 to 19 Minutes | 0 (0.0%) | 0 (0.0%) |
| 20 to 24 Minutes | 0 (0.0%) | 0 (0.0%) |
| 25 to 29 Minutes | 0 (0.0%) | 0 (0.0%) |
| 30 to 34 Minutes | 2 (22.2%) | 0 (0.0%) |
| 35 to 39 Minutes | 0 (0.0%) | 0 (0.0%) |
| 40 to 44 Minutes | 0 (0.0%) | 0 (0.0%) |
| 45 to 59 Minutes | 0 (0.0%) | 2 (28.6%) |
| 60 to 89 Minutes | 0 (0.0%) | 0 (0.0%) |
| 90 or more Minutes | 0 (0.0%) | 0 (0.0%) |
Time of Departure to Work by Sex in Klukwan
The most frequent times of departure to work in Klukwan are 7:00 AM to 7:29 AM (4, 44.4%) for males and 7:00 AM to 7:29 AM (3, 42.9%) for females.
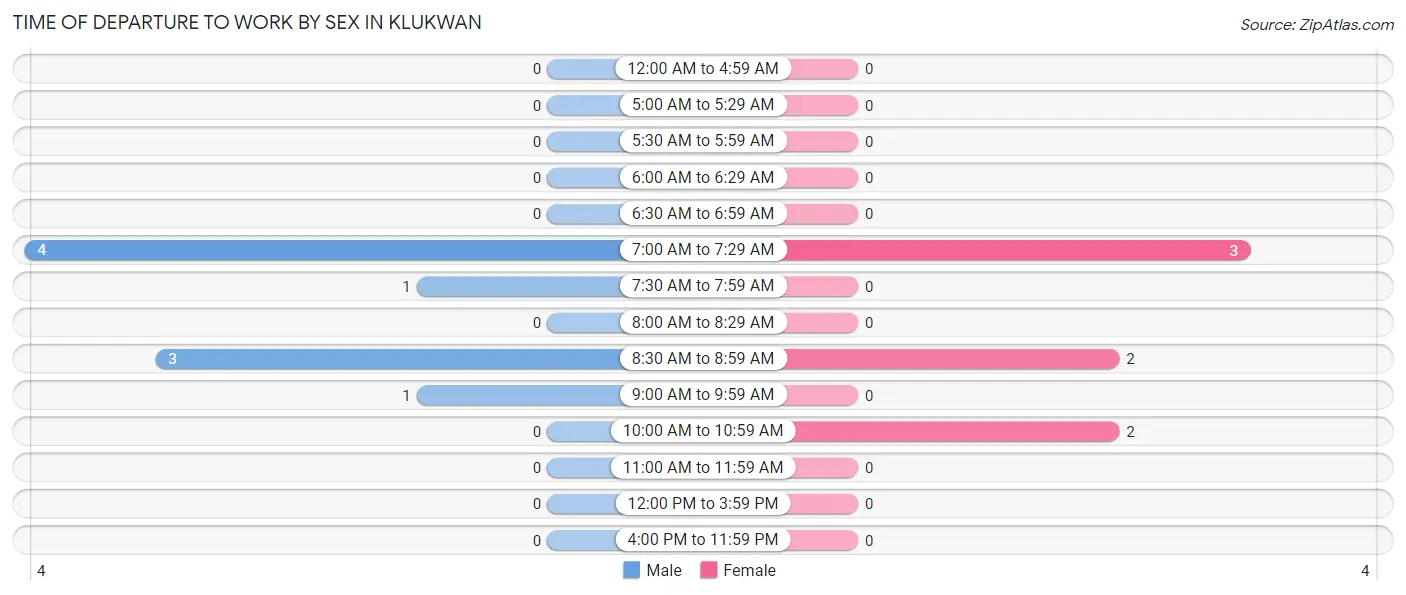
| Time of Departure | Male | Female |
| 12:00 AM to 4:59 AM | 0 (0.0%) | 0 (0.0%) |
| 5:00 AM to 5:29 AM | 0 (0.0%) | 0 (0.0%) |
| 5:30 AM to 5:59 AM | 0 (0.0%) | 0 (0.0%) |
| 6:00 AM to 6:29 AM | 0 (0.0%) | 0 (0.0%) |
| 6:30 AM to 6:59 AM | 0 (0.0%) | 0 (0.0%) |
| 7:00 AM to 7:29 AM | 4 (44.4%) | 3 (42.9%) |
| 7:30 AM to 7:59 AM | 1 (11.1%) | 0 (0.0%) |
| 8:00 AM to 8:29 AM | 0 (0.0%) | 0 (0.0%) |
| 8:30 AM to 8:59 AM | 3 (33.3%) | 2 (28.6%) |
| 9:00 AM to 9:59 AM | 1 (11.1%) | 0 (0.0%) |
| 10:00 AM to 10:59 AM | 0 (0.0%) | 2 (28.6%) |
| 11:00 AM to 11:59 AM | 0 (0.0%) | 0 (0.0%) |
| 12:00 PM to 3:59 PM | 0 (0.0%) | 0 (0.0%) |
| 4:00 PM to 11:59 PM | 0 (0.0%) | 0 (0.0%) |
| Total | 9 (100.0%) | 7 (100.0%) |
Housing Occupancy in Klukwan
Occupancy by Ownership in Klukwan
Of the total 30 dwellings in Klukwan, owner-occupied units account for 20 (66.7%), while renter-occupied units make up 10 (33.3%).
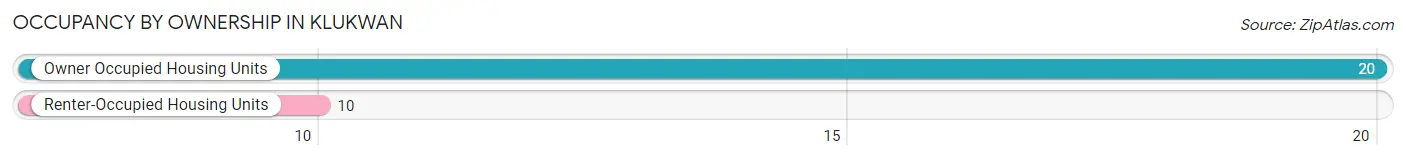
| Occupancy | # Housing Units | % Housing Units |
| Owner Occupied Housing Units | 20 | 66.7% |
| Renter-Occupied Housing Units | 10 | 33.3% |
| Total Occupied Housing Units | 30 | 100.0% |
Occupancy by Household Size in Klukwan
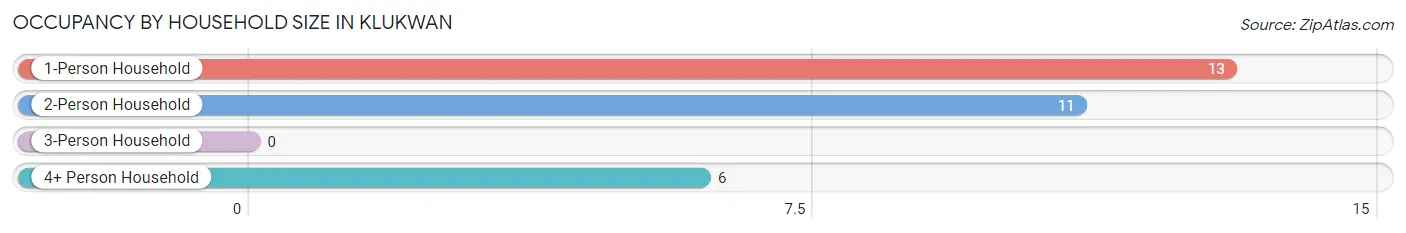
| Household Size | # Housing Units | % Housing Units |
| 1-Person Household | 13 | 43.3% |
| 2-Person Household | 11 | 36.7% |
| 3-Person Household | 0 | 0.0% |
| 4+ Person Household | 6 | 20.0% |
| Total Housing Units | 30 | 100.0% |
Occupancy by Ownership by Household Size in Klukwan
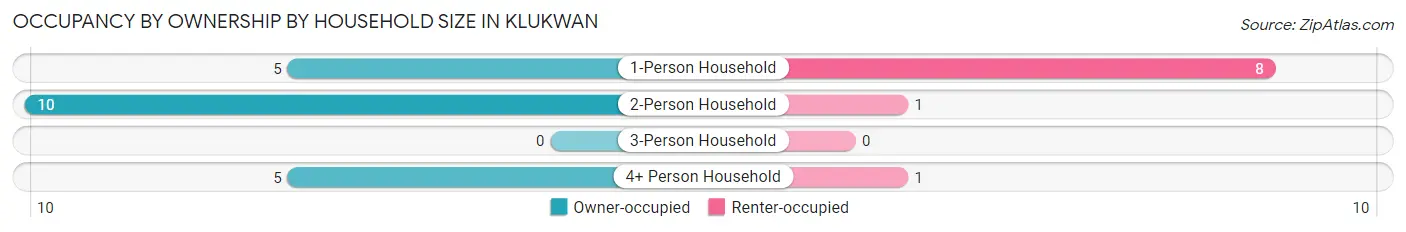
| Household Size | Owner-occupied | Renter-occupied |
| 1-Person Household | 5 (38.5%) | 8 (61.5%) |
| 2-Person Household | 10 (90.9%) | 1 (9.1%) |
| 3-Person Household | 0 (0.0%) | 0 (0.0%) |
| 4+ Person Household | 5 (83.3%) | 1 (16.7%) |
| Total Housing Units | 20 (66.7%) | 10 (33.3%) |
Occupancy by Educational Attainment in Klukwan
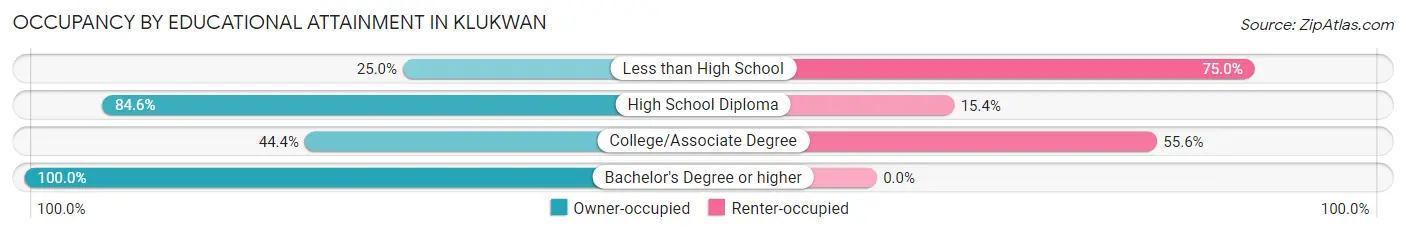
| Household Size | Owner-occupied | Renter-occupied |
| Less than High School | 1 (25.0%) | 3 (75.0%) |
| High School Diploma | 11 (84.6%) | 2 (15.4%) |
| College/Associate Degree | 4 (44.4%) | 5 (55.6%) |
| Bachelor's Degree or higher | 4 (100.0%) | 0 (0.0%) |
Occupancy by Age of Householder in Klukwan
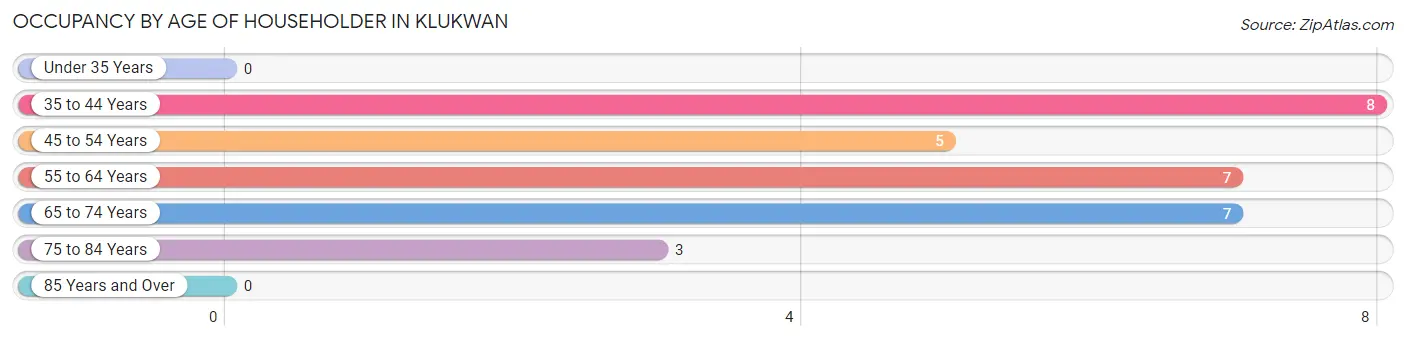
| Age Bracket | # Households | % Households |
| Under 35 Years | 0 | 0.0% |
| 35 to 44 Years | 8 | 26.7% |
| 45 to 54 Years | 5 | 16.7% |
| 55 to 64 Years | 7 | 23.3% |
| 65 to 74 Years | 7 | 23.3% |
| 75 to 84 Years | 3 | 10.0% |
| 85 Years and Over | 0 | 0.0% |
| Total | 30 | 100.0% |
Housing Finances in Klukwan
Median Income by Occupancy in Klukwan
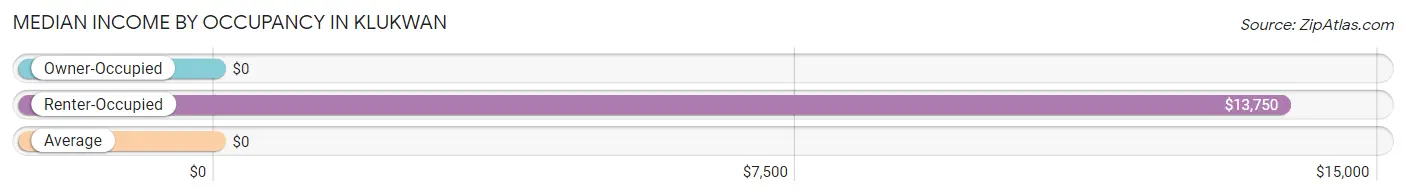
| Occupancy Type | # Households | Median Income |
| Owner-Occupied | 20 (66.7%) | $0 |
| Renter-Occupied | 10 (33.3%) | $13,750 |
| Average | 30 (100.0%) | $0 |
Occupancy by Householder Income Bracket in Klukwan
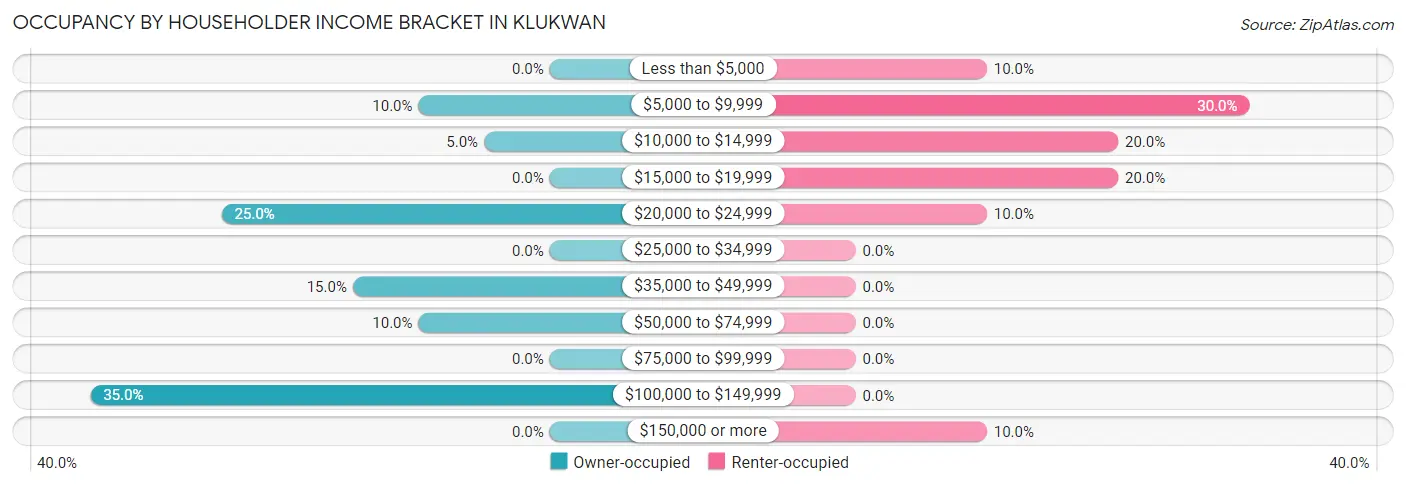
| Income Bracket | Owner-occupied | Renter-occupied |
| Less than $5,000 | 0 (0.0%) | 1 (10.0%) |
| $5,000 to $9,999 | 2 (10.0%) | 3 (30.0%) |
| $10,000 to $14,999 | 1 (5.0%) | 2 (20.0%) |
| $15,000 to $19,999 | 0 (0.0%) | 2 (20.0%) |
| $20,000 to $24,999 | 5 (25.0%) | 1 (10.0%) |
| $25,000 to $34,999 | 0 (0.0%) | 0 (0.0%) |
| $35,000 to $49,999 | 3 (15.0%) | 0 (0.0%) |
| $50,000 to $74,999 | 2 (10.0%) | 0 (0.0%) |
| $75,000 to $99,999 | 0 (0.0%) | 0 (0.0%) |
| $100,000 to $149,999 | 7 (35.0%) | 0 (0.0%) |
| $150,000 or more | 0 (0.0%) | 1 (10.0%) |
| Total | 20 (100.0%) | 10 (100.0%) |
Monthly Housing Cost Tiers in Klukwan
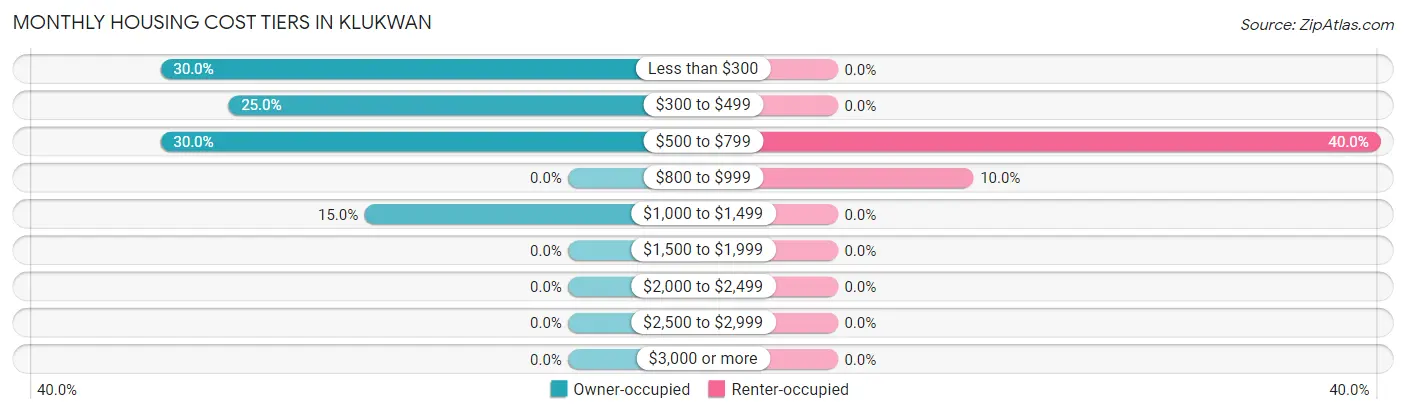
| Monthly Cost | Owner-occupied | Renter-occupied |
| Less than $300 | 6 (30.0%) | 0 (0.0%) |
| $300 to $499 | 5 (25.0%) | 0 (0.0%) |
| $500 to $799 | 6 (30.0%) | 4 (40.0%) |
| $800 to $999 | 0 (0.0%) | 1 (10.0%) |
| $1,000 to $1,499 | 3 (15.0%) | 0 (0.0%) |
| $1,500 to $1,999 | 0 (0.0%) | 0 (0.0%) |
| $2,000 to $2,499 | 0 (0.0%) | 0 (0.0%) |
| $2,500 to $2,999 | 0 (0.0%) | 0 (0.0%) |
| $3,000 or more | 0 (0.0%) | 0 (0.0%) |
| Total | 20 (100.0%) | 10 (100.0%) |
Physical Housing Characteristics in Klukwan
Housing Structures in Klukwan
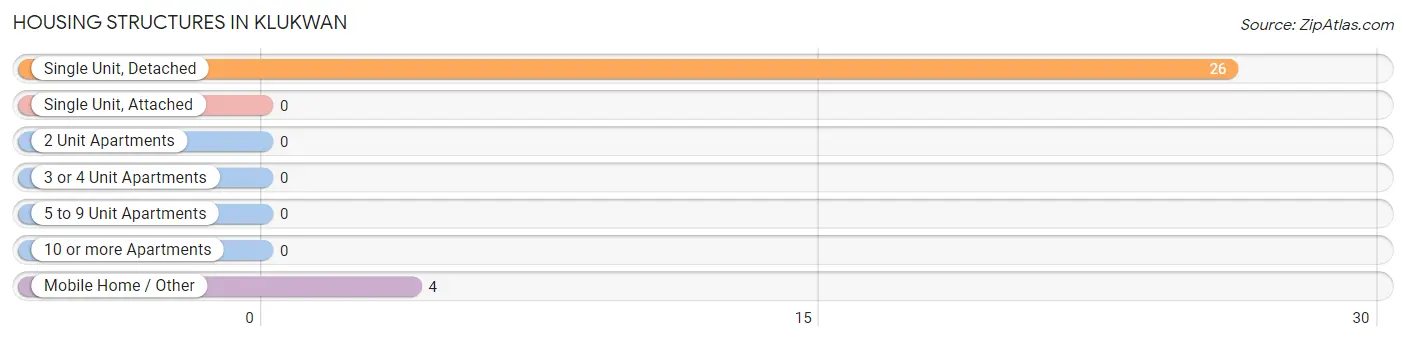
| Structure Type | # Housing Units | % Housing Units |
| Single Unit, Detached | 26 | 86.7% |
| Single Unit, Attached | 0 | 0.0% |
| 2 Unit Apartments | 0 | 0.0% |
| 3 or 4 Unit Apartments | 0 | 0.0% |
| 5 to 9 Unit Apartments | 0 | 0.0% |
| 10 or more Apartments | 0 | 0.0% |
| Mobile Home / Other | 4 | 13.3% |
| Total | 30 | 100.0% |
Housing Structures by Occupancy in Klukwan
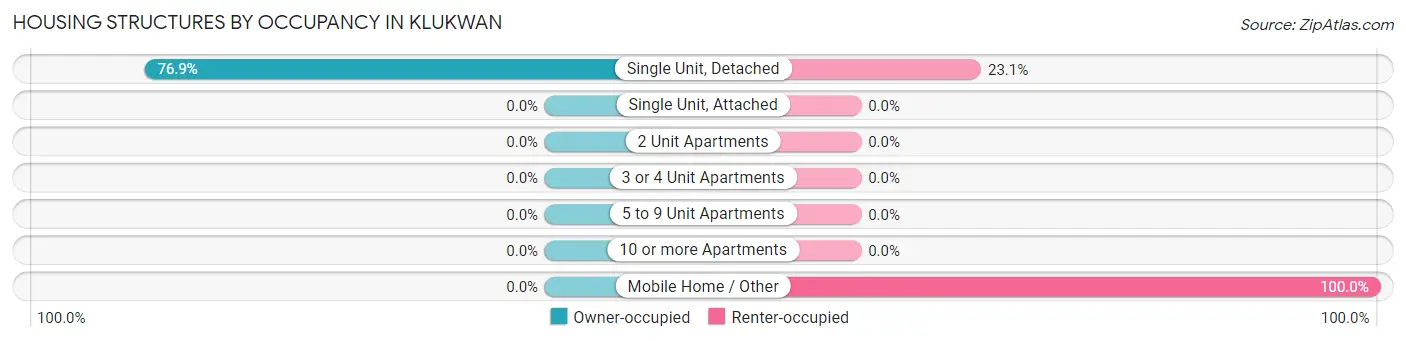
| Structure Type | Owner-occupied | Renter-occupied |
| Single Unit, Detached | 20 (76.9%) | 6 (23.1%) |
| Single Unit, Attached | 0 (0.0%) | 0 (0.0%) |
| 2 Unit Apartments | 0 (0.0%) | 0 (0.0%) |
| 3 or 4 Unit Apartments | 0 (0.0%) | 0 (0.0%) |
| 5 to 9 Unit Apartments | 0 (0.0%) | 0 (0.0%) |
| 10 or more Apartments | 0 (0.0%) | 0 (0.0%) |
| Mobile Home / Other | 0 (0.0%) | 4 (100.0%) |
| Total | 20 (66.7%) | 10 (33.3%) |
Housing Structures by Number of Rooms in Klukwan
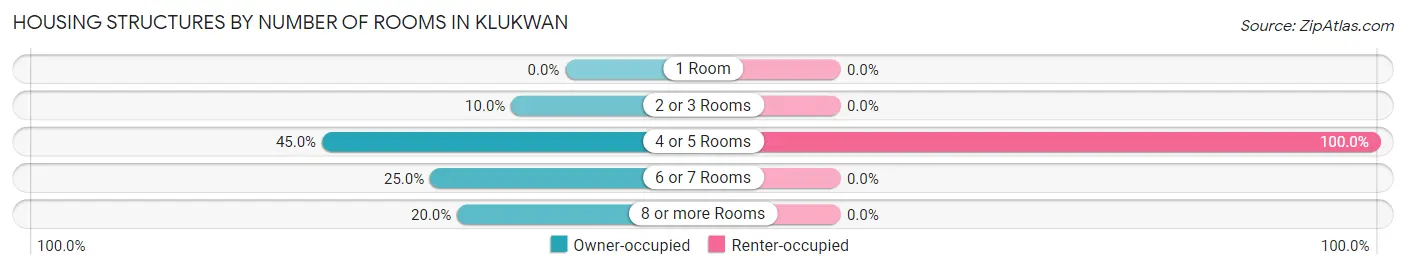
| Number of Rooms | Owner-occupied | Renter-occupied |
| 1 Room | 0 (0.0%) | 0 (0.0%) |
| 2 or 3 Rooms | 2 (10.0%) | 0 (0.0%) |
| 4 or 5 Rooms | 9 (45.0%) | 10 (100.0%) |
| 6 or 7 Rooms | 5 (25.0%) | 0 (0.0%) |
| 8 or more Rooms | 4 (20.0%) | 0 (0.0%) |
| Total | 20 (100.0%) | 10 (100.0%) |
Housing Structure by Heating Type in Klukwan
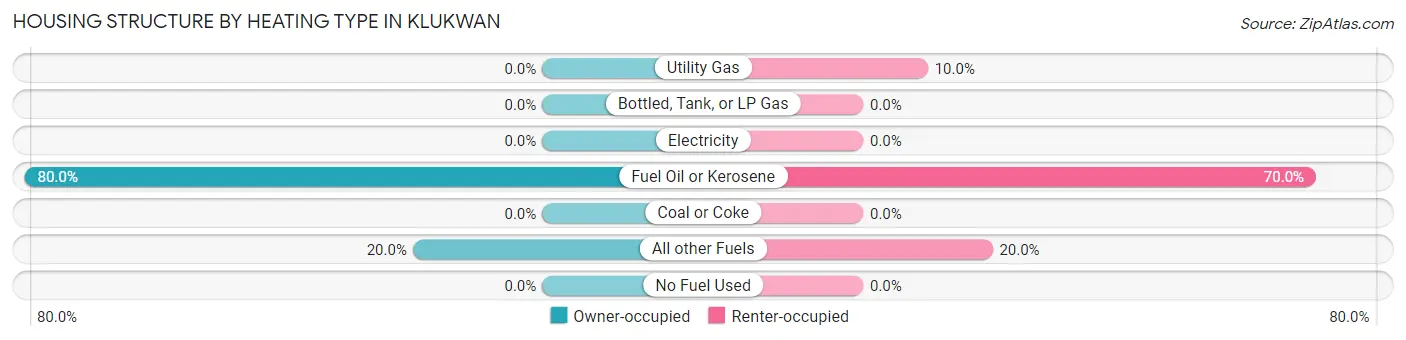
| Heating Type | Owner-occupied | Renter-occupied |
| Utility Gas | 0 (0.0%) | 1 (10.0%) |
| Bottled, Tank, or LP Gas | 0 (0.0%) | 0 (0.0%) |
| Electricity | 0 (0.0%) | 0 (0.0%) |
| Fuel Oil or Kerosene | 16 (80.0%) | 7 (70.0%) |
| Coal or Coke | 0 (0.0%) | 0 (0.0%) |
| All other Fuels | 4 (20.0%) | 2 (20.0%) |
| No Fuel Used | 0 (0.0%) | 0 (0.0%) |
| Total | 20 (100.0%) | 10 (100.0%) |
Household Vehicle Usage in Klukwan
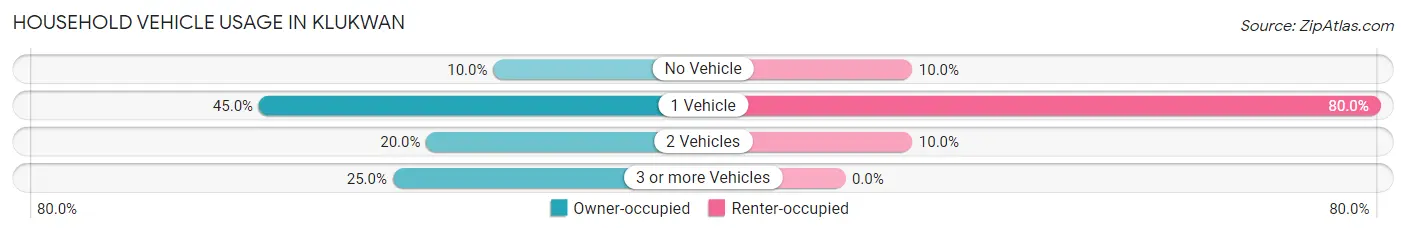
| Vehicles per Household | Owner-occupied | Renter-occupied |
| No Vehicle | 2 (10.0%) | 1 (10.0%) |
| 1 Vehicle | 9 (45.0%) | 8 (80.0%) |
| 2 Vehicles | 4 (20.0%) | 1 (10.0%) |
| 3 or more Vehicles | 5 (25.0%) | 0 (0.0%) |
| Total | 20 (100.0%) | 10 (100.0%) |
Real Estate & Mortgages in Klukwan
Real Estate and Mortgage Overview in Klukwan
| Characteristic | Without Mortgage | With Mortgage |
| Housing Units | 20 | 0 |
| Median Property Value | - | - |
| Median Household Income | - | - |
| Monthly Housing Costs | $400 | $0 |
| Real Estate Taxes | - | - |
Property Value by Mortgage Status in Klukwan
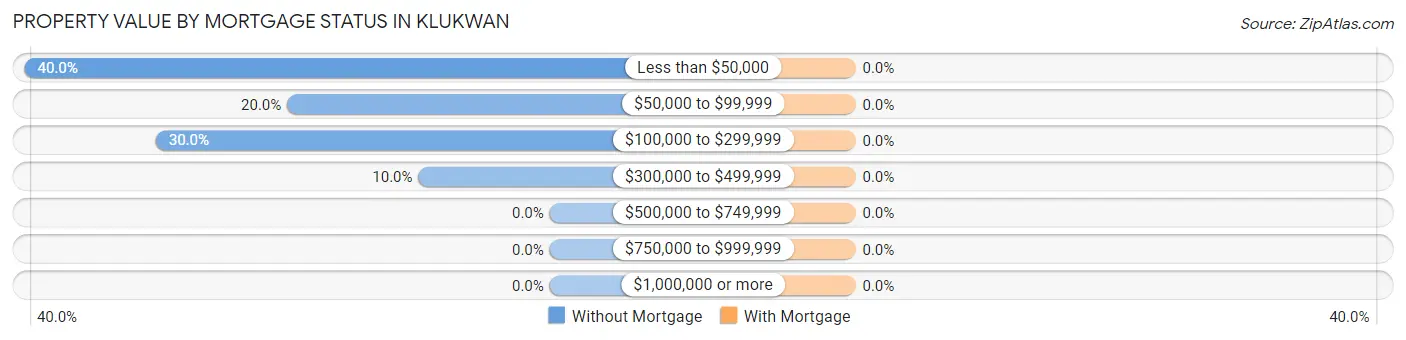
| Property Value | Without Mortgage | With Mortgage |
| Less than $50,000 | 8 (40.0%) | 0 (0.0%) |
| $50,000 to $99,999 | 4 (20.0%) | 0 (0.0%) |
| $100,000 to $299,999 | 6 (30.0%) | 0 (0.0%) |
| $300,000 to $499,999 | 2 (10.0%) | 0 (0.0%) |
| $500,000 to $749,999 | 0 (0.0%) | 0 (0.0%) |
| $750,000 to $999,999 | 0 (0.0%) | 0 (0.0%) |
| $1,000,000 or more | 0 (0.0%) | 0 (0.0%) |
| Total | 20 (100.0%) | 0 (0.0%) |
Household Income by Mortgage Status in Klukwan
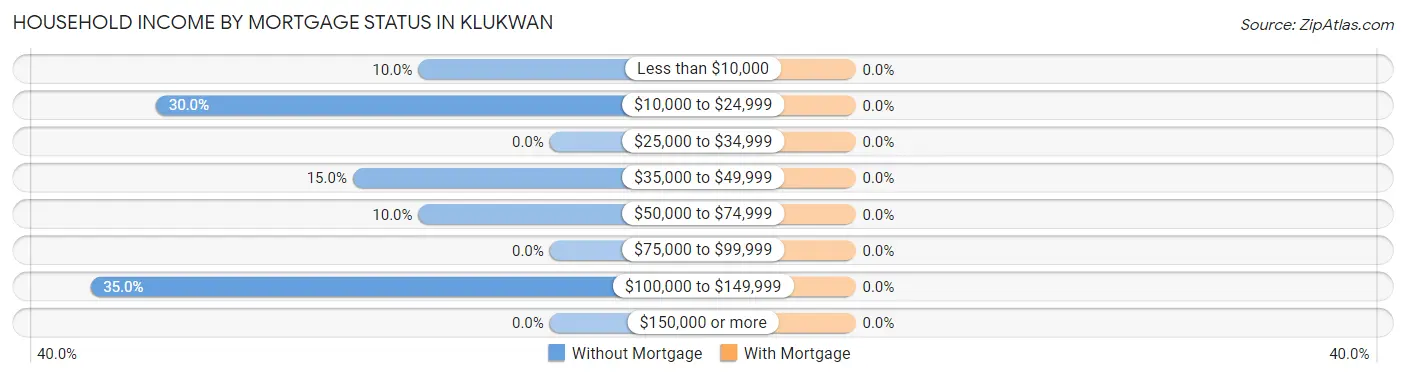
| Household Income | Without Mortgage | With Mortgage |
| Less than $10,000 | 2 (10.0%) | 0 (0.0%) |
| $10,000 to $24,999 | 6 (30.0%) | 0 (0.0%) |
| $25,000 to $34,999 | 0 (0.0%) | 0 (0.0%) |
| $35,000 to $49,999 | 3 (15.0%) | 0 (0.0%) |
| $50,000 to $74,999 | 2 (10.0%) | 0 (0.0%) |
| $75,000 to $99,999 | 0 (0.0%) | 0 (0.0%) |
| $100,000 to $149,999 | 7 (35.0%) | 0 (0.0%) |
| $150,000 or more | 0 (0.0%) | 0 (0.0%) |
| Total | 20 (100.0%) | 0 (0.0%) |
Property Value to Household Income Ratio in Klukwan
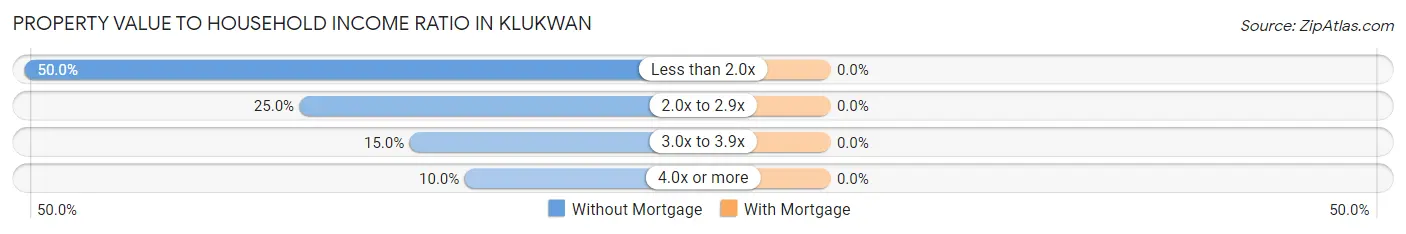
| Value-to-Income Ratio | Without Mortgage | With Mortgage |
| Less than 2.0x | 10 (50.0%) | 0 (0.0%) |
| 2.0x to 2.9x | 5 (25.0%) | 0 (0.0%) |
| 3.0x to 3.9x | 3 (15.0%) | 0 (0.0%) |
| 4.0x or more | 2 (10.0%) | 0 (0.0%) |
| Total | 20 (100.0%) | 0 (0.0%) |
Real Estate Taxes by Mortgage Status in Klukwan
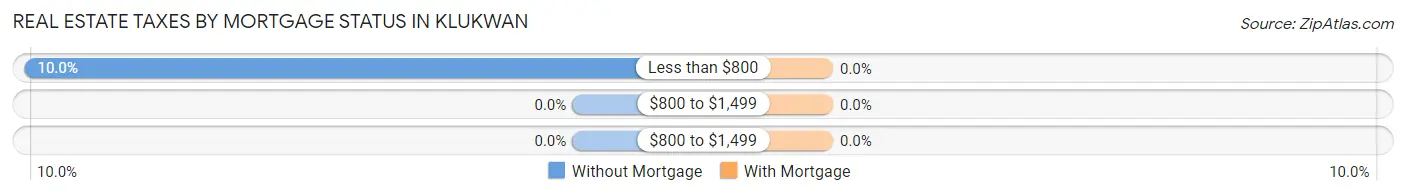
| Property Taxes | Without Mortgage | With Mortgage |
| Less than $800 | 2 (10.0%) | 0 (0.0%) |
| $800 to $1,499 | 0 (0.0%) | 0 (0.0%) |
| $800 to $1,499 | 0 (0.0%) | 0 (0.0%) |
| Total | 20 (100.0%) | 0 (0.0%) |
Health & Disability in Klukwan
Health Insurance Coverage by Age in Klukwan
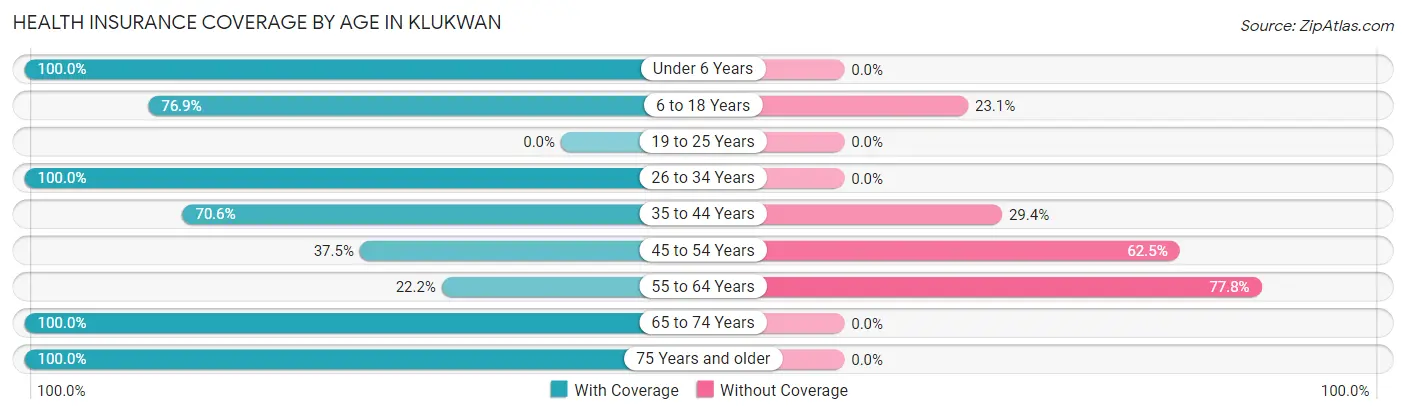
| Age Bracket | With Coverage | Without Coverage |
| Under 6 Years | 2 (100.0%) | 0 (0.0%) |
| 6 to 18 Years | 10 (76.9%) | 3 (23.1%) |
| 19 to 25 Years | 0 (0.0%) | 0 (0.0%) |
| 26 to 34 Years | 2 (100.0%) | 0 (0.0%) |
| 35 to 44 Years | 12 (70.6%) | 5 (29.4%) |
| 45 to 54 Years | 3 (37.5%) | 5 (62.5%) |
| 55 to 64 Years | 2 (22.2%) | 7 (77.8%) |
| 65 to 74 Years | 12 (100.0%) | 0 (0.0%) |
| 75 Years and older | 4 (100.0%) | 0 (0.0%) |
| Total | 47 (70.2%) | 20 (29.8%) |
Health Insurance Coverage by Citizenship Status in Klukwan
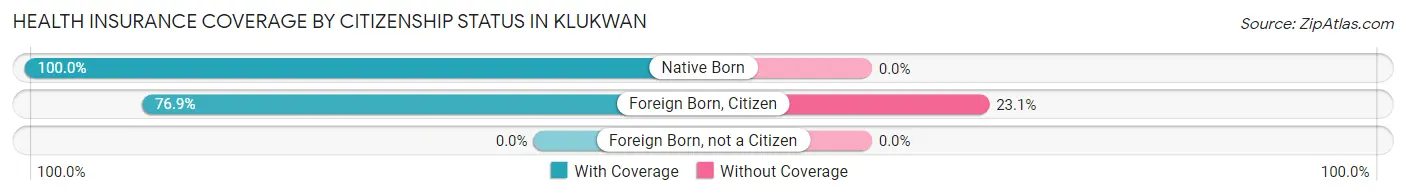
| Citizenship Status | With Coverage | Without Coverage |
| Native Born | 2 (100.0%) | 0 (0.0%) |
| Foreign Born, Citizen | 10 (76.9%) | 3 (23.1%) |
| Foreign Born, not a Citizen | 0 (0.0%) | 0 (0.0%) |
Health Insurance Coverage by Household Income in Klukwan
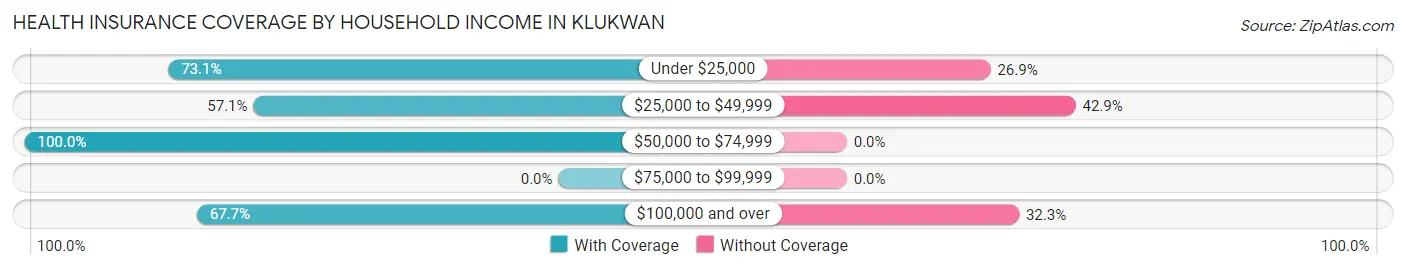
| Household Income | With Coverage | Without Coverage |
| Under $25,000 | 19 (73.1%) | 7 (26.9%) |
| $25,000 to $49,999 | 4 (57.1%) | 3 (42.9%) |
| $50,000 to $74,999 | 3 (100.0%) | 0 (0.0%) |
| $75,000 to $99,999 | 0 (0.0%) | 0 (0.0%) |
| $100,000 and over | 21 (67.7%) | 10 (32.3%) |
Public vs Private Health Insurance Coverage by Age in Klukwan
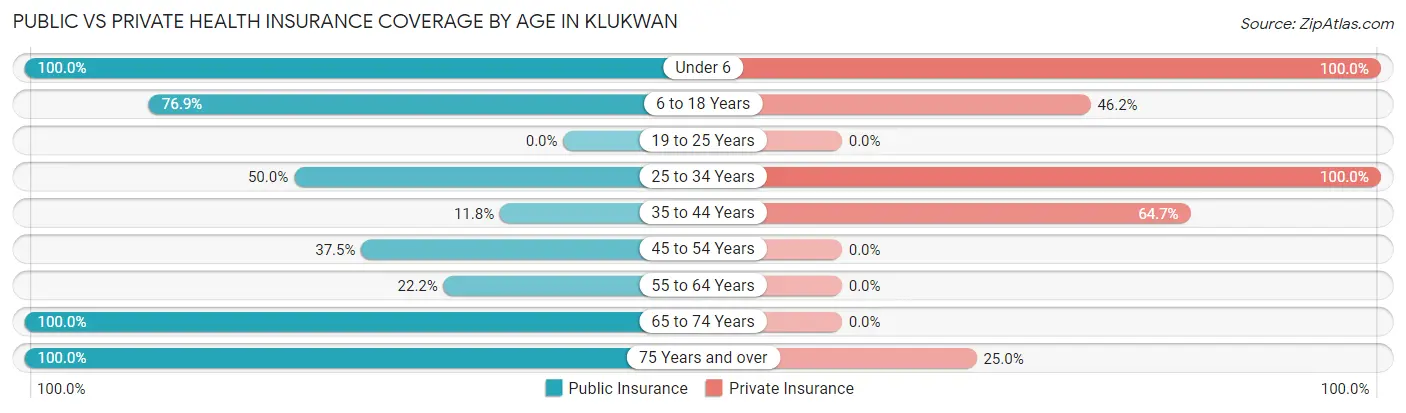
| Age Bracket | Public Insurance | Private Insurance |
| Under 6 | 2 (100.0%) | 2 (100.0%) |
| 6 to 18 Years | 10 (76.9%) | 6 (46.2%) |
| 19 to 25 Years | 0 (0.0%) | 0 (0.0%) |
| 25 to 34 Years | 1 (50.0%) | 2 (100.0%) |
| 35 to 44 Years | 2 (11.8%) | 11 (64.7%) |
| 45 to 54 Years | 3 (37.5%) | 0 (0.0%) |
| 55 to 64 Years | 2 (22.2%) | 0 (0.0%) |
| 65 to 74 Years | 12 (100.0%) | 0 (0.0%) |
| 75 Years and over | 4 (100.0%) | 1 (25.0%) |
| Total | 36 (53.7%) | 22 (32.8%) |
Disability Status by Sex by Age in Klukwan
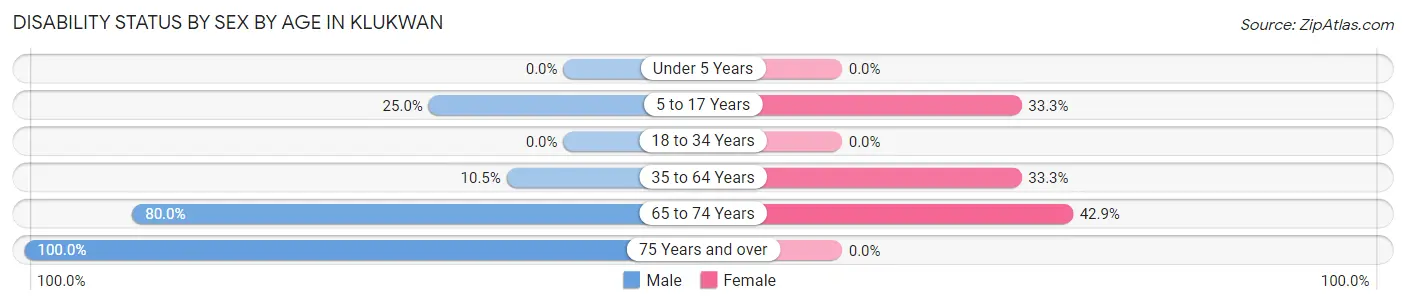
| Age Bracket | Male | Female |
| Under 5 Years | 0 (0.0%) | 0 (0.0%) |
| 5 to 17 Years | 2 (25.0%) | 2 (33.3%) |
| 18 to 34 Years | 0 (0.0%) | 0 (0.0%) |
| 35 to 64 Years | 2 (10.5%) | 5 (33.3%) |
| 65 to 74 Years | 4 (80.0%) | 3 (42.9%) |
| 75 Years and over | 4 (100.0%) | 0 (0.0%) |
Disability Class by Sex by Age in Klukwan
Disability Class: Hearing Difficulty
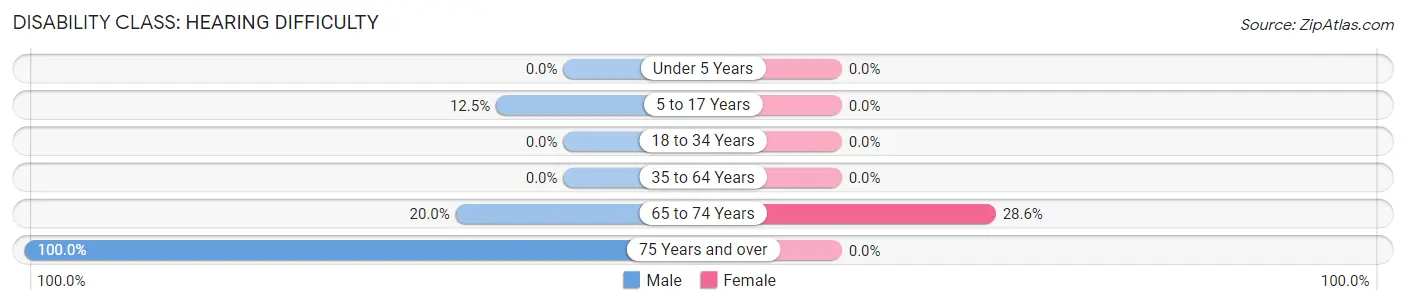
| Age Bracket | Male | Female |
| Under 5 Years | 0 (0.0%) | 0 (0.0%) |
| 5 to 17 Years | 1 (12.5%) | 0 (0.0%) |
| 18 to 34 Years | 0 (0.0%) | 0 (0.0%) |
| 35 to 64 Years | 0 (0.0%) | 0 (0.0%) |
| 65 to 74 Years | 1 (20.0%) | 2 (28.6%) |
| 75 Years and over | 4 (100.0%) | 0 (0.0%) |
Disability Class: Vision Difficulty
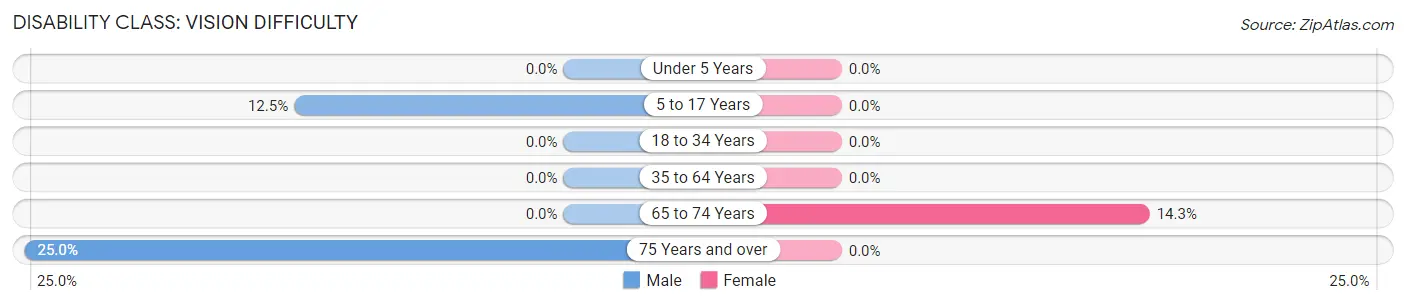
| Age Bracket | Male | Female |
| Under 5 Years | 0 (0.0%) | 0 (0.0%) |
| 5 to 17 Years | 1 (12.5%) | 0 (0.0%) |
| 18 to 34 Years | 0 (0.0%) | 0 (0.0%) |
| 35 to 64 Years | 0 (0.0%) | 0 (0.0%) |
| 65 to 74 Years | 0 (0.0%) | 1 (14.3%) |
| 75 Years and over | 1 (25.0%) | 0 (0.0%) |
Disability Class: Cognitive Difficulty
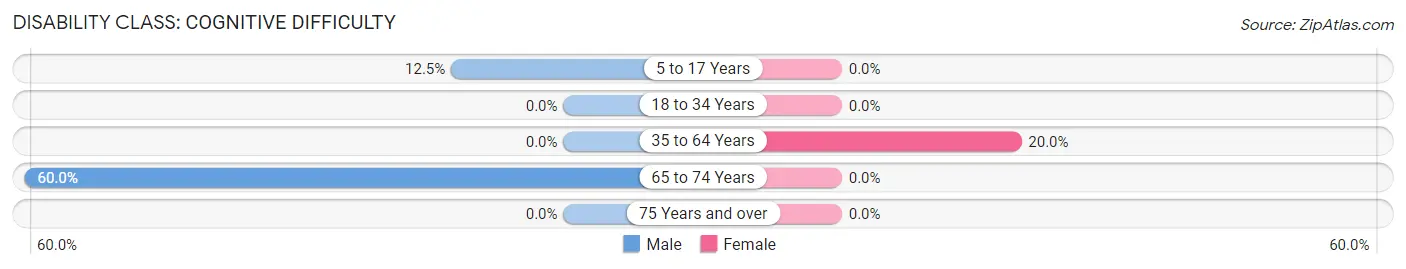
| Age Bracket | Male | Female |
| 5 to 17 Years | 1 (12.5%) | 0 (0.0%) |
| 18 to 34 Years | 0 (0.0%) | 0 (0.0%) |
| 35 to 64 Years | 0 (0.0%) | 3 (20.0%) |
| 65 to 74 Years | 3 (60.0%) | 0 (0.0%) |
| 75 Years and over | 0 (0.0%) | 0 (0.0%) |
Disability Class: Ambulatory Difficulty
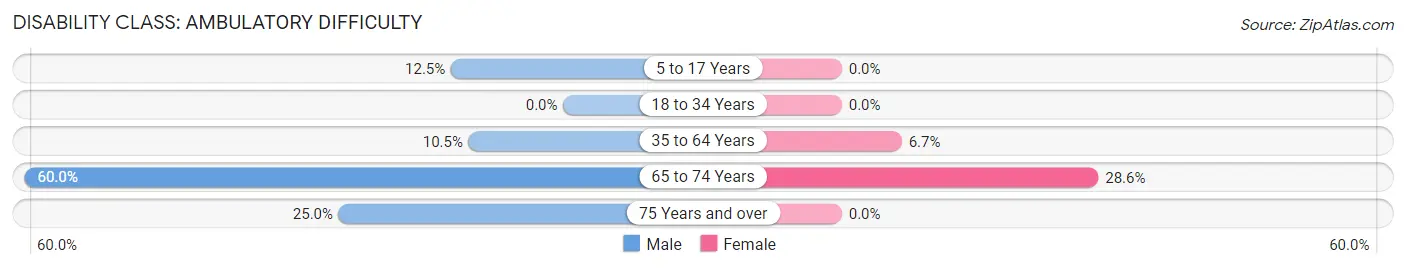
| Age Bracket | Male | Female |
| 5 to 17 Years | 1 (12.5%) | 0 (0.0%) |
| 18 to 34 Years | 0 (0.0%) | 0 (0.0%) |
| 35 to 64 Years | 2 (10.5%) | 1 (6.7%) |
| 65 to 74 Years | 3 (60.0%) | 2 (28.6%) |
| 75 Years and over | 1 (25.0%) | 0 (0.0%) |
Disability Class: Self-Care Difficulty
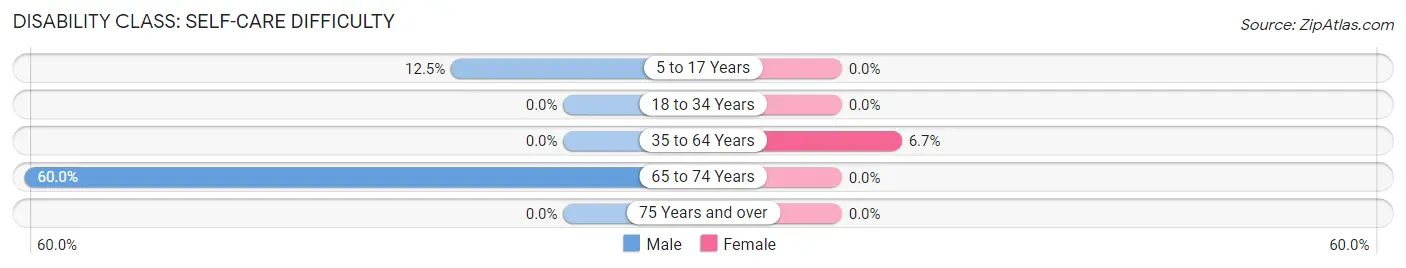
| Age Bracket | Male | Female |
| 5 to 17 Years | 1 (12.5%) | 0 (0.0%) |
| 18 to 34 Years | 0 (0.0%) | 0 (0.0%) |
| 35 to 64 Years | 0 (0.0%) | 1 (6.7%) |
| 65 to 74 Years | 3 (60.0%) | 0 (0.0%) |
| 75 Years and over | 0 (0.0%) | 0 (0.0%) |
Technology Access in Klukwan
Computing Device Access in Klukwan
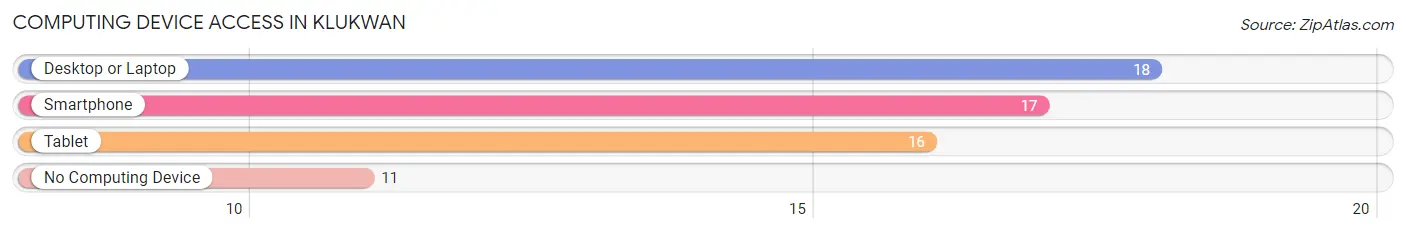
| Device Type | # Households | % Households |
| Desktop or Laptop | 18 | 60.0% |
| Smartphone | 17 | 56.7% |
| Tablet | 16 | 53.3% |
| No Computing Device | 11 | 36.7% |
| Total | 30 | 100.0% |
Internet Access in Klukwan
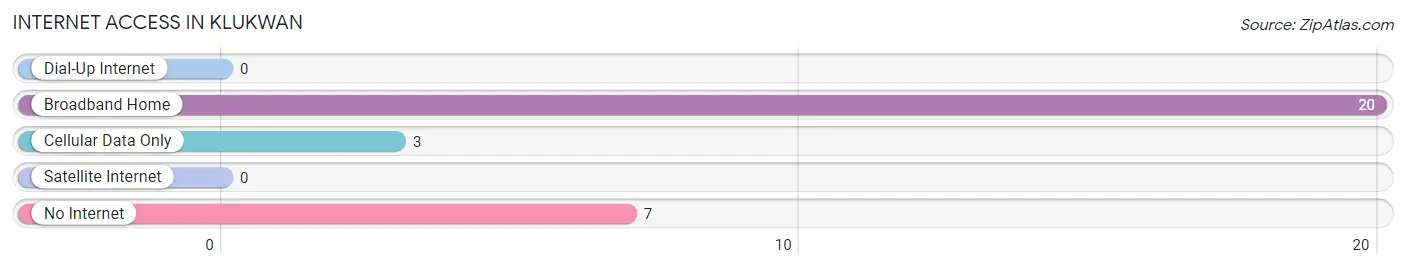
| Internet Type | # Households | % Households |
| Dial-Up Internet | 0 | 0.0% |
| Broadband Home | 20 | 66.7% |
| Cellular Data Only | 3 | 10.0% |
| Satellite Internet | 0 | 0.0% |
| No Internet | 7 | 23.3% |
| Total | 30 | 100.0% |
Klukwan Summary
Klukwan is a small village located in the Chilkat Valley of Southeast Alaska. It is situated on the Chilkat River, approximately 20 miles north of Haines and 40 miles south of Skagway. The village is home to the Tlingit people, who have lived in the area for thousands of years. The population of Klukwan was estimated to be around 200 people in 2000.
Geography
Klukwan is located in the Chilkat Valley, which is part of the larger Chilkat River watershed. The Chilkat River is a major salmon-bearing river that flows through the valley and is a major source of subsistence for the Tlingit people. The village is surrounded by mountains and is located at an elevation of approximately 200 feet. The climate in Klukwan is mild and wet, with an average annual temperature of 45°F and an average annual precipitation of over 70 inches.
Economy
Klukwan’s economy is largely based on subsistence activities, such as fishing, hunting, and gathering. The village is also home to a small commercial fishing fleet, which provides employment for some of the residents. The village also has a small sawmill, which provides lumber for local construction projects. In addition, the village has a small tourism industry, with visitors coming to experience the traditional Tlingit culture and to take part in outdoor activities such as fishing, hunting, and hiking.
Demographics
Klukwan is home to the Tlingit people, who have lived in the area for thousands of years. The population of the village was estimated to be around 200 people in 2000. The majority of the population is Native American, with the Tlingit people making up the majority of the population. The village also has a small non-Native American population, which includes people of European and Asian descent.
The Tlingit people of Klukwan are a matrilineal society, meaning that descent and inheritance are traced through the female line. The Tlingit language is still spoken in the village, and the traditional Tlingit culture is still practiced. The village is also home to a number of traditional Tlingit art forms, such as wood carving, weaving, and basketry.
Conclusion
Klukwan is a small village located in the Chilkat Valley of Southeast Alaska. It is home to the Tlingit people, who have lived in the area for thousands of years. The village’s economy is largely based on subsistence activities, such as fishing, hunting, and gathering. The population of the village was estimated to be around 200 people in 2000, with the majority of the population being Native American. The traditional Tlingit culture is still practiced in the village, and the Tlingit language is still spoken. Klukwan is a unique and vibrant community that is worth visiting to experience the traditional Tlingit culture and to take part in outdoor activities such as fishing, hunting, and hiking.
Common Questions
What is the Total Population of Klukwan?
Total Population of Klukwan is 67.
What is the Total Male Population of Klukwan?
Total Male Population of Klukwan is 38.
What is the Total Female Population of Klukwan?
Total Female Population of Klukwan is 29.
What is the Ratio of Males per 100 Females in Klukwan?
There are 131.03 Males per 100 Females in Klukwan.
What is the Ratio of Females per 100 Males in Klukwan?
There are 76.32 Females per 100 Males in Klukwan.
What is the Median Population Age in Klukwan?
Median Population Age in Klukwan is 44.9 Years.
What is the Average Family Size in Klukwan
Average Family Size in Klukwan is 3.3 People.
What is the Average Household Size in Klukwan
Average Household Size in Klukwan is 2.2 People.
What is Per Capita Income in Klukwan?
Per Capita income in Klukwan is $24,327.
What is Income or Wage Gap in Klukwan?
Income or Wage Gap in Klukwan is 76.5%.
Women in Klukwan earn 23.5 cents for every dollar earned by a man.
What is Inequality or Gini Index in Klukwan?
Inequality or Gini Index in Klukwan is 0.51.
How Large is the Labor Force in Klukwan?
There are 29 People in the Labor Forcein in Klukwan.
What is the Percentage of People in the Labor Force in Klukwan?
50.0% of People are in the Labor Force in Klukwan.
What is the Unemployment Rate in Klukwan?
Unemployment Rate in Klukwan is 6.9%.