Chefornak, AK
Chefornak Map
Chefornak Overview
476
TOTAL POPULATION
272
MALE POPULATION
204
FEMALE POPULATION
133.33
MALES / 100 FEMALES
75.00
FEMALES / 100 MALES
25.2
MEDIAN AGE
5.3
AVG FAMILY SIZE
5.3
AVG HOUSEHOLD SIZE
$12,776
PER CAPITA INCOME
$50,750
AVG FAMILY INCOME
$47,500
AVG HOUSEHOLD INCOME
1.4%
WAGE / INCOME GAP [ % ]
98.6¢/ $1
WAGE / INCOME GAP [ $ ]
$15,022
FAMILY INCOME DEFICIT
0.41
INEQUALITY / GINI INDEX
162
LABOR FORCE [ PEOPLE ]
53.6%
PERCENT IN LABOR FORCE
27.8%
UNEMPLOYMENT RATE
Chefornak Zip Codes
Chefornak Area Codes
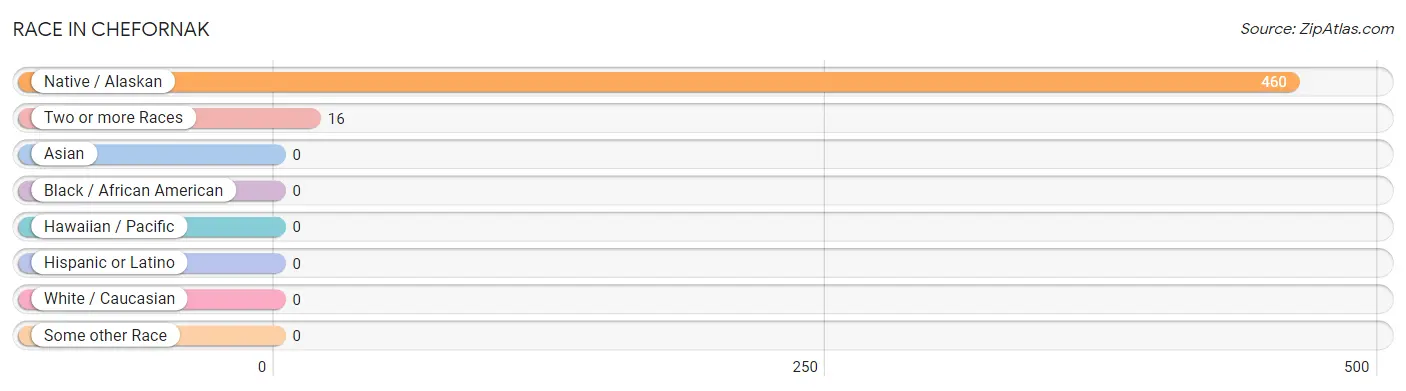
Race in Chefornak
The most populous races in Chefornak are Native / Alaskan (460 | 96.6%), and Two or more Races (16 | 3.4%).
| Race | # Population | % Population |
| Asian | 0 | 0.0% |
| Black / African American | 0 | 0.0% |
| Hawaiian / Pacific | 0 | 0.0% |
| Hispanic or Latino | 0 | 0.0% |
| Native / Alaskan | 460 | 96.6% |
| White / Caucasian | 0 | 0.0% |
| Two or more Races | 16 | 3.4% |
| Some other Race | 0 | 0.0% |
| Total | 476 | 100.0% |
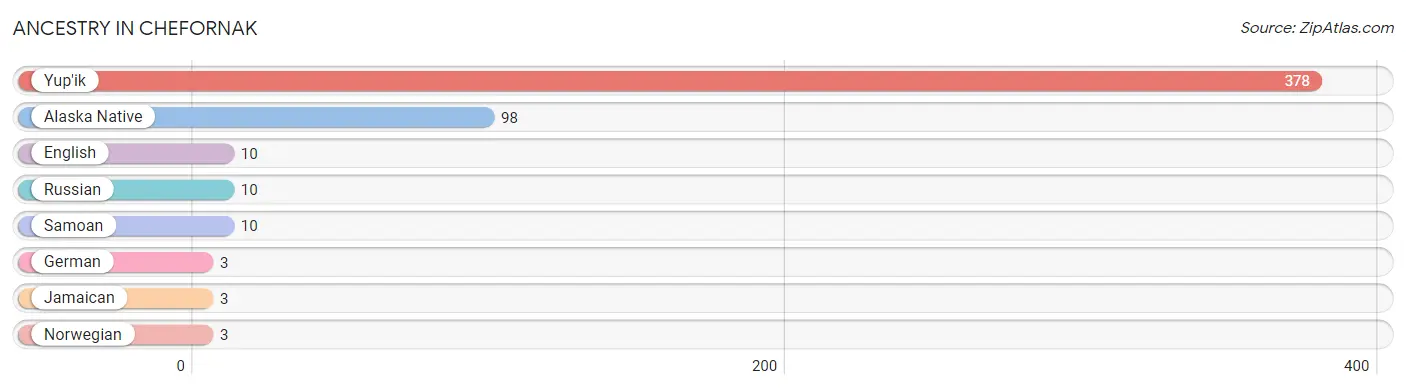
Ancestry in Chefornak
The most populous ancestries reported in Chefornak are Yup'ik (378 | 79.4%), Alaska Native (98 | 20.6%), English (10 | 2.1%), Russian (10 | 2.1%), and Samoan (10 | 2.1%), together accounting for 106.3% of all Chefornak residents.
| Ancestry | # Population | % Population |
| Alaska Native | 98 | 20.6% |
| English | 10 | 2.1% |
| German | 3 | 0.6% |
| Jamaican | 3 | 0.6% |
| Norwegian | 3 | 0.6% |
| Russian | 10 | 2.1% |
| Samoan | 10 | 2.1% |
| Yup'ik | 378 | 79.4% | View All 8 Rows |
Immigrants in Chefornak

| Immigration Origin | # Population | % Population | View All 0 Rows |
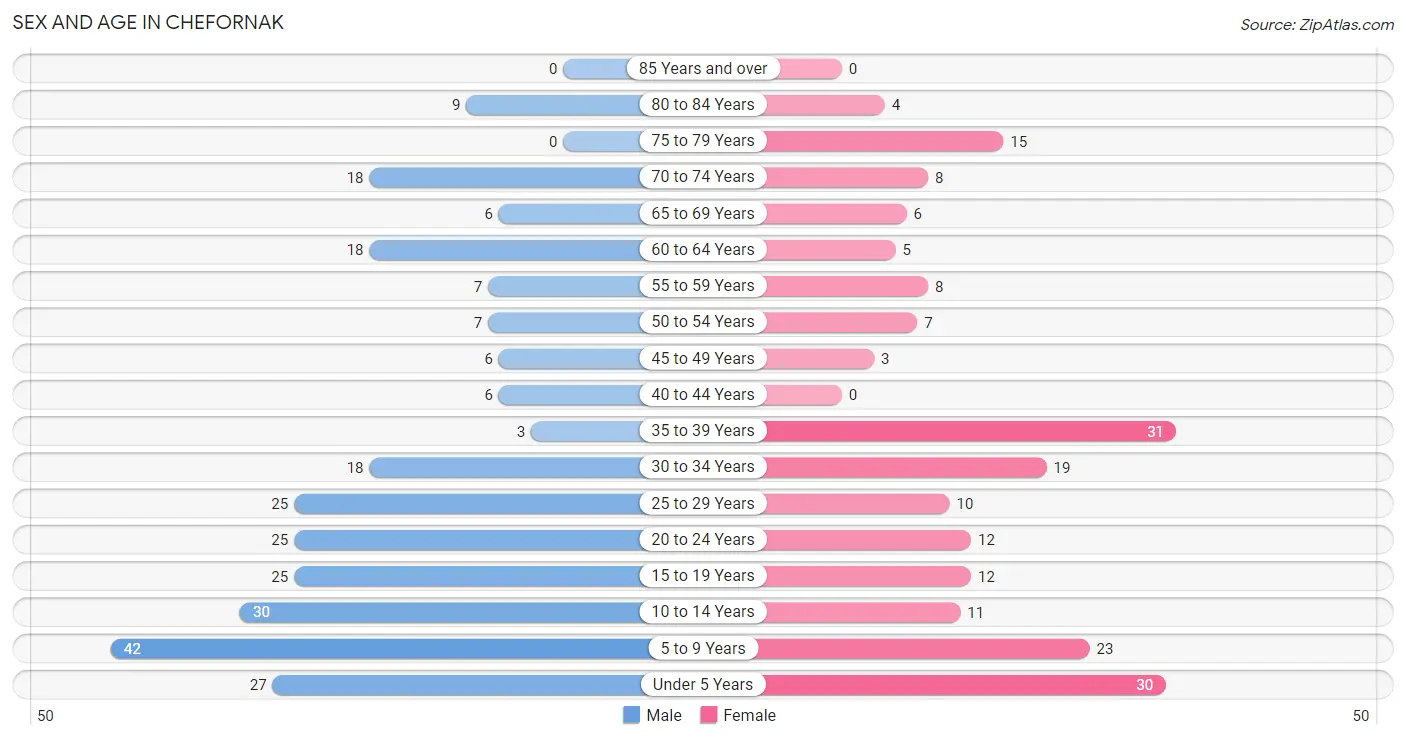
Sex and Age in Chefornak
Sex and Age in Chefornak
The most populous age groups in Chefornak are 5 to 9 Years (42 | 15.4%) for men and 35 to 39 Years (31 | 15.2%) for women.
| Age Bracket | Male | Female |
| Under 5 Years | 27 (9.9%) | 30 (14.7%) |
| 5 to 9 Years | 42 (15.4%) | 23 (11.3%) |
| 10 to 14 Years | 30 (11.0%) | 11 (5.4%) |
| 15 to 19 Years | 25 (9.2%) | 12 (5.9%) |
| 20 to 24 Years | 25 (9.2%) | 12 (5.9%) |
| 25 to 29 Years | 25 (9.2%) | 10 (4.9%) |
| 30 to 34 Years | 18 (6.6%) | 19 (9.3%) |
| 35 to 39 Years | 3 (1.1%) | 31 (15.2%) |
| 40 to 44 Years | 6 (2.2%) | 0 (0.0%) |
| 45 to 49 Years | 6 (2.2%) | 3 (1.5%) |
| 50 to 54 Years | 7 (2.6%) | 7 (3.4%) |
| 55 to 59 Years | 7 (2.6%) | 8 (3.9%) |
| 60 to 64 Years | 18 (6.6%) | 5 (2.5%) |
| 65 to 69 Years | 6 (2.2%) | 6 (2.9%) |
| 70 to 74 Years | 18 (6.6%) | 8 (3.9%) |
| 75 to 79 Years | 0 (0.0%) | 15 (7.3%) |
| 80 to 84 Years | 9 (3.3%) | 4 (2.0%) |
| 85 Years and over | 0 (0.0%) | 0 (0.0%) |
| Total | 272 (100.0%) | 204 (100.0%) |
Families and Households in Chefornak
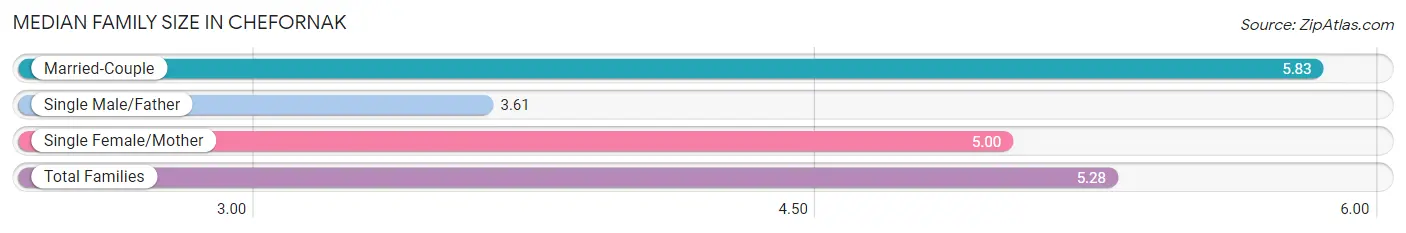
Median Family Size in Chefornak
The median family size in Chefornak is 5.28 persons per family, with married-couple families (59 | 67.8%) accounting for the largest median family size of 5.83 persons per family. On the other hand, single male/father families (18 | 20.7%) represent the smallest median family size with 3.61 persons per family.
| Family Type | # Families | Family Size |
| Married-Couple | 59 (67.8%) | 5.83 |
| Single Male/Father | 18 (20.7%) | 3.61 |
| Single Female/Mother | 10 (11.5%) | 5.00 |
| Total Families | 87 (100.0%) | 5.28 |
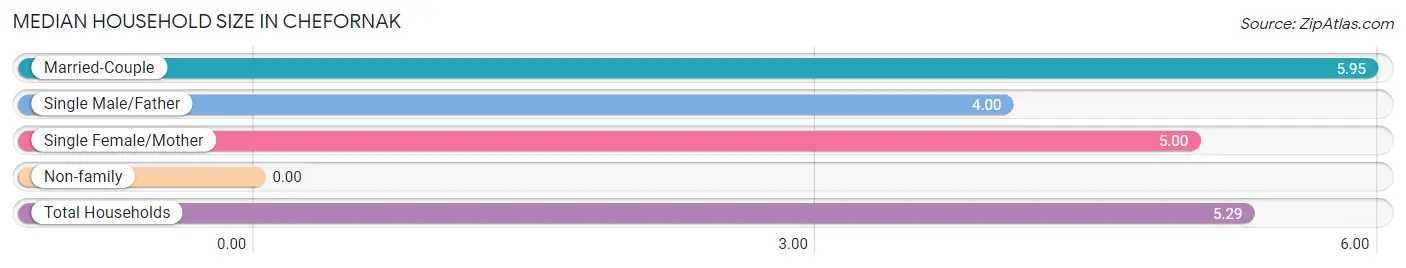
Median Household Size in Chefornak
| Household Type | # Households | Household Size |
| Married-Couple | 59 (65.6%) | 5.95 |
| Single Male/Father | 18 (20.0%) | 4.00 |
| Single Female/Mother | 10 (11.1%) | 5.00 |
| Non-family | 3 (3.3%) | - |
| Total Households | 90 (100.0%) | 5.29 |
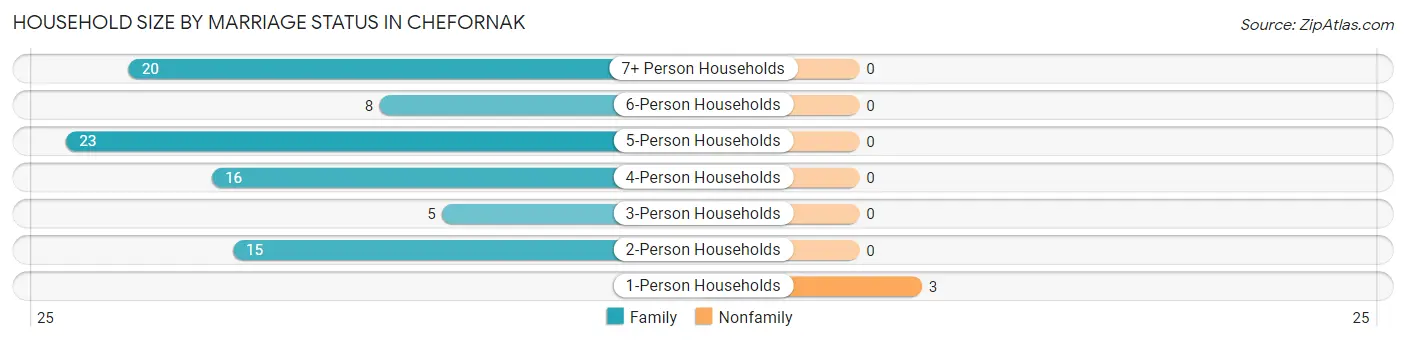
Household Size by Marriage Status in Chefornak
Out of a total of 90 households in Chefornak, 87 (96.7%) are family households, while 3 (3.3%) are nonfamily households. The most numerous type of family households are 5-person households, comprising 23, and the most common type of nonfamily households are 1-person households, comprising 3.
| Household Size | Family Households | Nonfamily Households |
| 1-Person Households | - | 3 (3.3%) |
| 2-Person Households | 15 (16.7%) | 0 (0.0%) |
| 3-Person Households | 5 (5.6%) | 0 (0.0%) |
| 4-Person Households | 16 (17.8%) | 0 (0.0%) |
| 5-Person Households | 23 (25.6%) | 0 (0.0%) |
| 6-Person Households | 8 (8.9%) | 0 (0.0%) |
| 7+ Person Households | 20 (22.2%) | 0 (0.0%) |
| Total | 87 (96.7%) | 3 (3.3%) |
Female Fertility in Chefornak
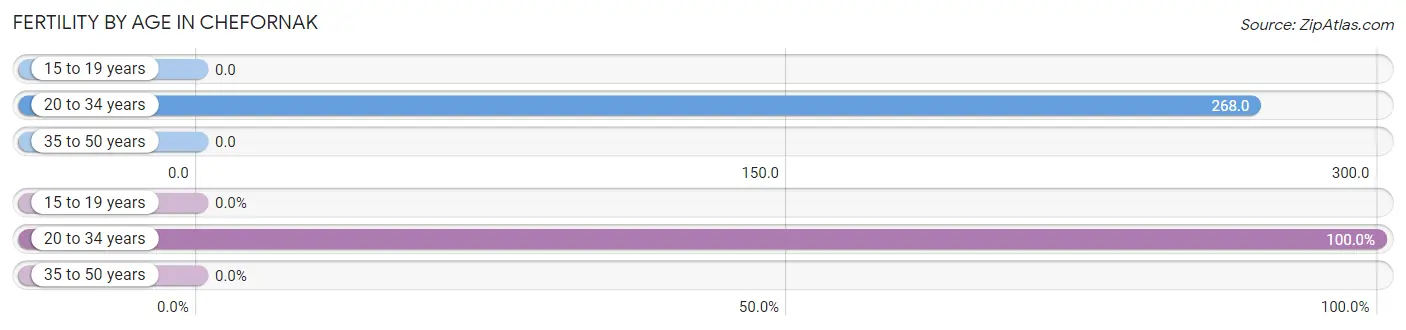
Fertility by Age in Chefornak
Average fertility rate in Chefornak is 126.0 births per 1,000 women. Women in the age bracket of 20 to 34 years have the highest fertility rate with 268.0 births per 1,000 women. Women in the age bracket of 20 to 34 years acount for 100.0% of all women with births.
| Age Bracket | Women with Births | Births / 1,000 Women |
| 15 to 19 years | 0 (0.0%) | 0.0 |
| 20 to 34 years | 11 (100.0%) | 268.0 |
| 35 to 50 years | 0 (0.0%) | 0.0 |
| Total | 11 (100.0%) | 126.0 |
Fertility by Age by Marriage Status in Chefornak
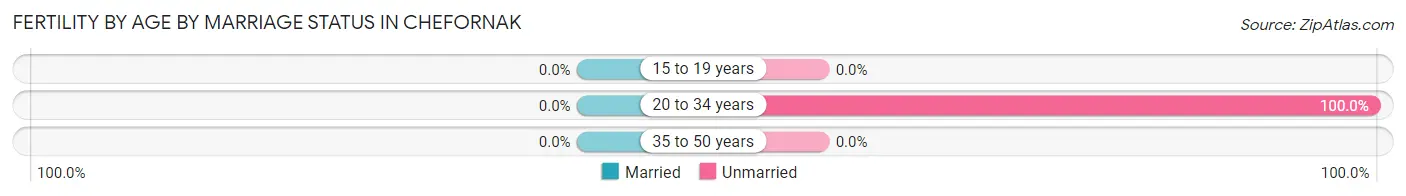
| Age Bracket | Married | Unmarried |
| 15 to 19 years | 0 (0.0%) | 0 (0.0%) |
| 20 to 34 years | 0 (0.0%) | 11 (100.0%) |
| 35 to 50 years | 0 (0.0%) | 0 (0.0%) |
| Total | 0 (0.0%) | 11 (100.0%) |
Fertility by Education in Chefornak
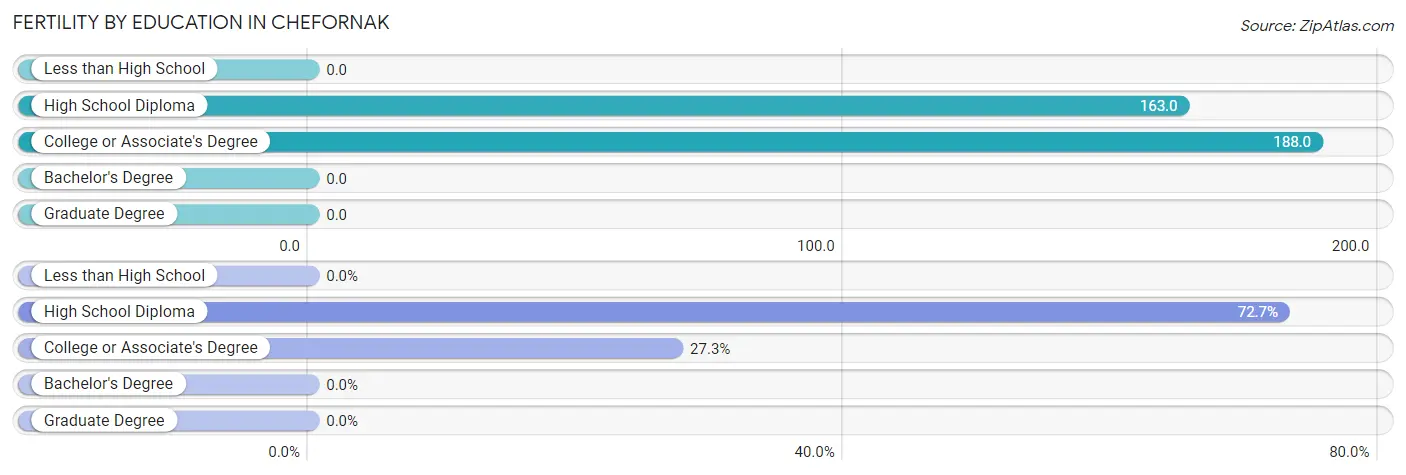
| Educational Attainment | Women with Births | Births / 1,000 Women |
| Less than High School | 0 (0.0%) | 0.0 |
| High School Diploma | 8 (72.7%) | 163.0 |
| College or Associate's Degree | 3 (27.3%) | 188.0 |
| Bachelor's Degree | 0 (0.0%) | 0.0 |
| Graduate Degree | 0 (0.0%) | 0.0 |
| Total | 11 (100.0%) | 126.0 |
Fertility by Education by Marriage Status in Chefornak
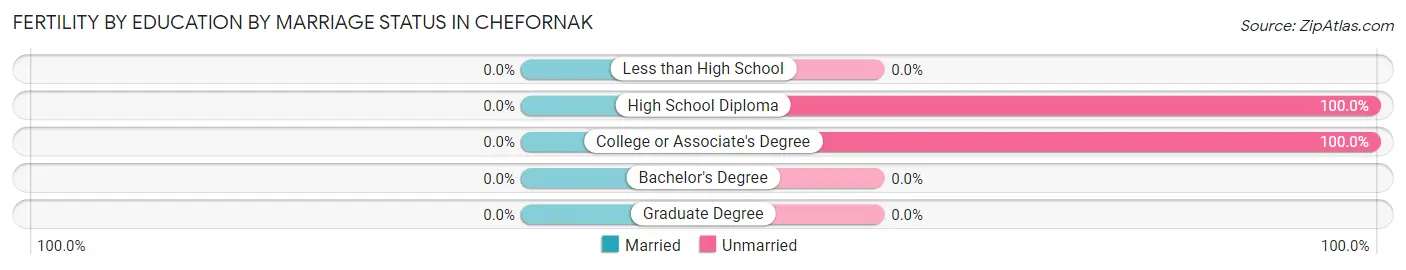
| Educational Attainment | Married | Unmarried |
| Less than High School | 0 (0.0%) | 0 (0.0%) |
| High School Diploma | 0 (0.0%) | 8 (100.0%) |
| College or Associate's Degree | 0 (0.0%) | 3 (100.0%) |
| Bachelor's Degree | 0 (0.0%) | 0 (0.0%) |
| Graduate Degree | 0 (0.0%) | 0 (0.0%) |
| Total | 0 (0.0%) | 11 (100.0%) |
Income in Chefornak
Income Overview in Chefornak
Per Capita Income in Chefornak is $12,776, while median incomes of families and households are $50,750 and $47,500 respectively.
| Characteristic | Number | Measure |
| Per Capita Income | 476 | $12,776 |
| Median Family Income | 87 | $50,750 |
| Mean Family Income | 87 | $67,468 |
| Median Household Income | 90 | $47,500 |
| Mean Household Income | 90 | $67,424 |
| Income Deficit | 87 | $15,022 |
| Wage / Income Gap (%) | 476 | 1.43% |
| Wage / Income Gap ($) | 476 | 98.57¢ per $1 |
| Gini / Inequality Index | 476 | 0.41 |
Earnings by Sex in Chefornak
Average Earnings in Chefornak are $14,531, $14,583 for men and $14,375 for women, a difference of 1.4%.
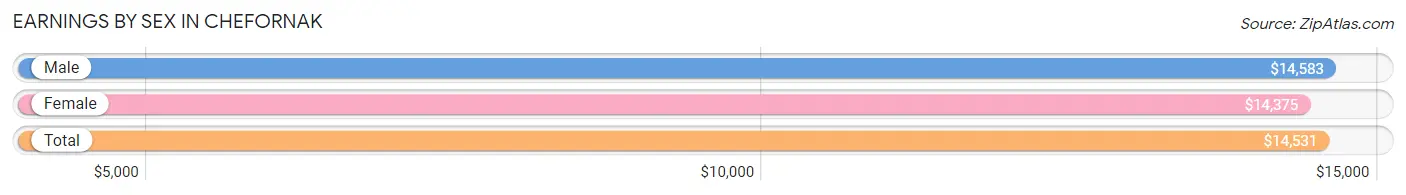
| Sex | Number | Average Earnings |
| Male | 92 (50.8%) | $14,583 |
| Female | 89 (49.2%) | $14,375 |
| Total | 181 (100.0%) | $14,531 |
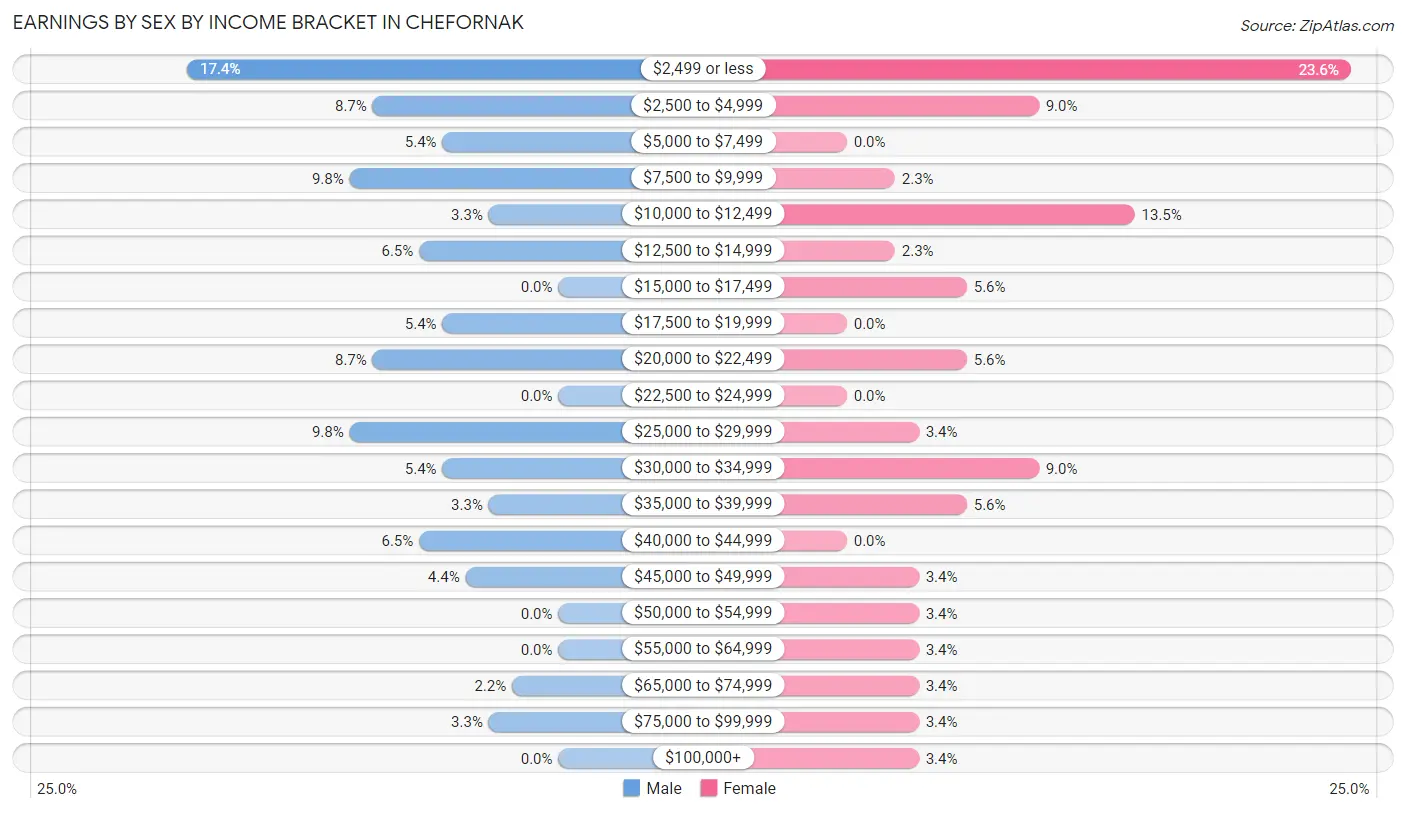
Earnings by Sex by Income Bracket in Chefornak
The most common earnings brackets in Chefornak are $2,499 or less for men (16 | 17.4%) and $2,499 or less for women (21 | 23.6%).
| Income | Male | Female |
| $2,499 or less | 16 (17.4%) | 21 (23.6%) |
| $2,500 to $4,999 | 8 (8.7%) | 8 (9.0%) |
| $5,000 to $7,499 | 5 (5.4%) | 0 (0.0%) |
| $7,500 to $9,999 | 9 (9.8%) | 2 (2.2%) |
| $10,000 to $12,499 | 3 (3.3%) | 12 (13.5%) |
| $12,500 to $14,999 | 6 (6.5%) | 2 (2.2%) |
| $15,000 to $17,499 | 0 (0.0%) | 5 (5.6%) |
| $17,500 to $19,999 | 5 (5.4%) | 0 (0.0%) |
| $20,000 to $22,499 | 8 (8.7%) | 5 (5.6%) |
| $22,500 to $24,999 | 0 (0.0%) | 0 (0.0%) |
| $25,000 to $29,999 | 9 (9.8%) | 3 (3.4%) |
| $30,000 to $34,999 | 5 (5.4%) | 8 (9.0%) |
| $35,000 to $39,999 | 3 (3.3%) | 5 (5.6%) |
| $40,000 to $44,999 | 6 (6.5%) | 0 (0.0%) |
| $45,000 to $49,999 | 4 (4.3%) | 3 (3.4%) |
| $50,000 to $54,999 | 0 (0.0%) | 3 (3.4%) |
| $55,000 to $64,999 | 0 (0.0%) | 3 (3.4%) |
| $65,000 to $74,999 | 2 (2.2%) | 3 (3.4%) |
| $75,000 to $99,999 | 3 (3.3%) | 3 (3.4%) |
| $100,000+ | 0 (0.0%) | 3 (3.4%) |
| Total | 92 (100.0%) | 89 (100.0%) |
Earnings by Sex by Educational Attainment in Chefornak
Average earnings in Chefornak are $21,563 for men and $22,000 for women, a difference of 2.0%. Men with an educational attainment of college or associate's degree enjoy the highest average annual earnings of $26,875, while those with less than high school education earn the least with $13,750. Women with an educational attainment of high school diploma earn the most with the average annual earnings of $30,833, while those with college or associate's degree education have the smallest earnings of $16,750.

| Educational Attainment | Male Income | Female Income |
| Less than High School | $13,750 | $0 |
| High School Diploma | $20,625 | $30,833 |
| College or Associate's Degree | $26,875 | $16,750 |
| Bachelor's Degree | - | - |
| Graduate Degree | - | - |
| Total | $21,563 | $22,000 |
Family Income in Chefornak
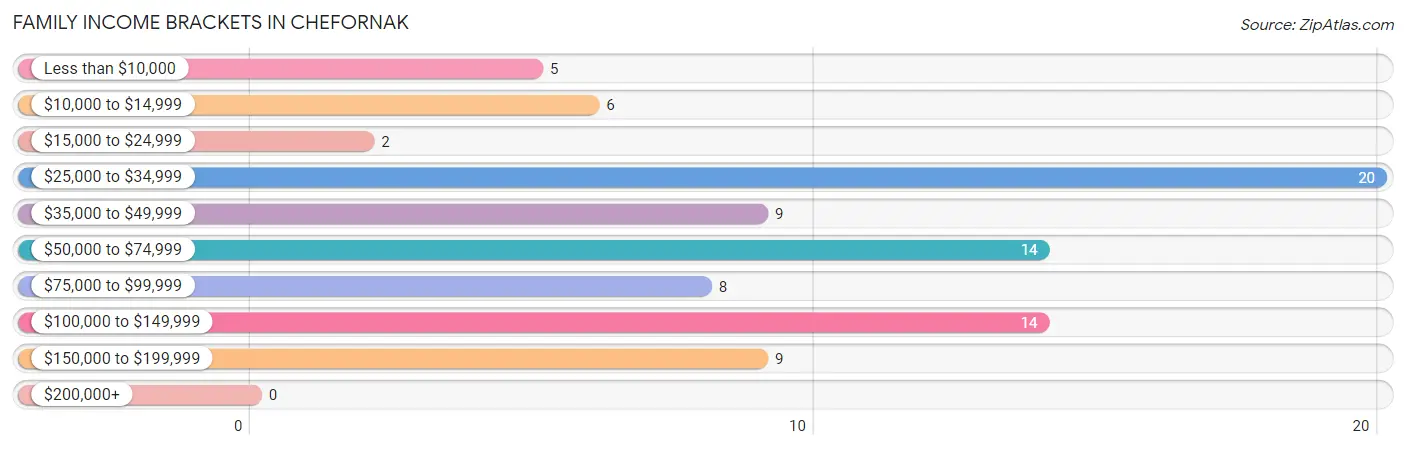
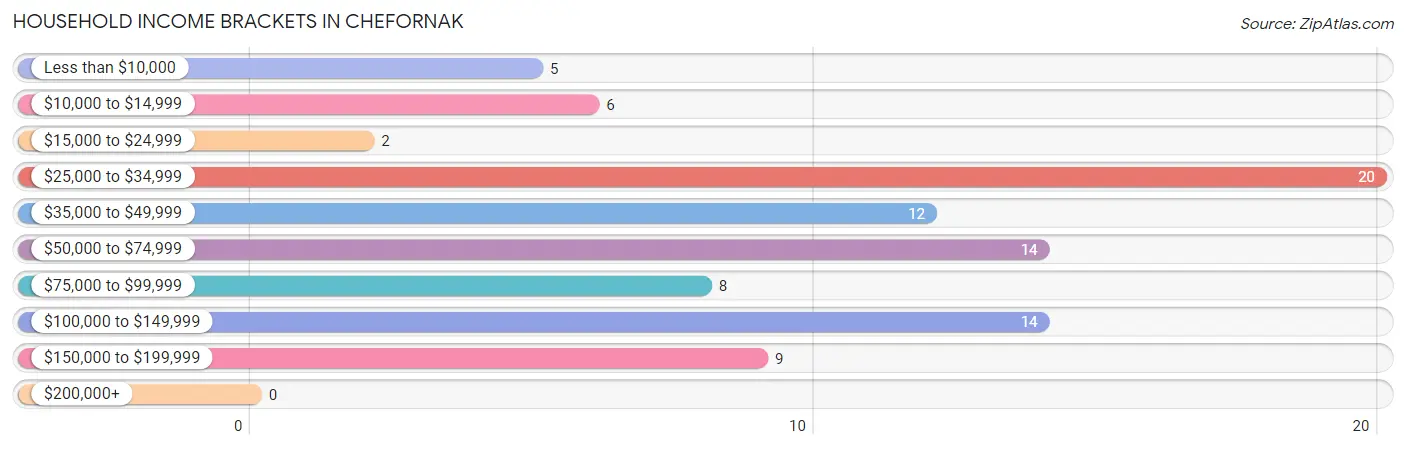
Family Income Brackets in Chefornak
According to the Chefornak family income data, there are 20 families falling into the $25,000 to $34,999 income range, which is the most common income bracket and makes up 23.0% of all families.
| Income Bracket | # Families | % Families |
| Less than $10,000 | 5 | 5.7% |
| $10,000 to $14,999 | 6 | 6.9% |
| $15,000 to $24,999 | 2 | 2.3% |
| $25,000 to $34,999 | 20 | 23.0% |
| $35,000 to $49,999 | 9 | 10.3% |
| $50,000 to $74,999 | 14 | 16.1% |
| $75,000 to $99,999 | 8 | 9.2% |
| $100,000 to $149,999 | 14 | 16.1% |
| $150,000 to $199,999 | 9 | 10.3% |
| $200,000+ | 0 | 0.0% |
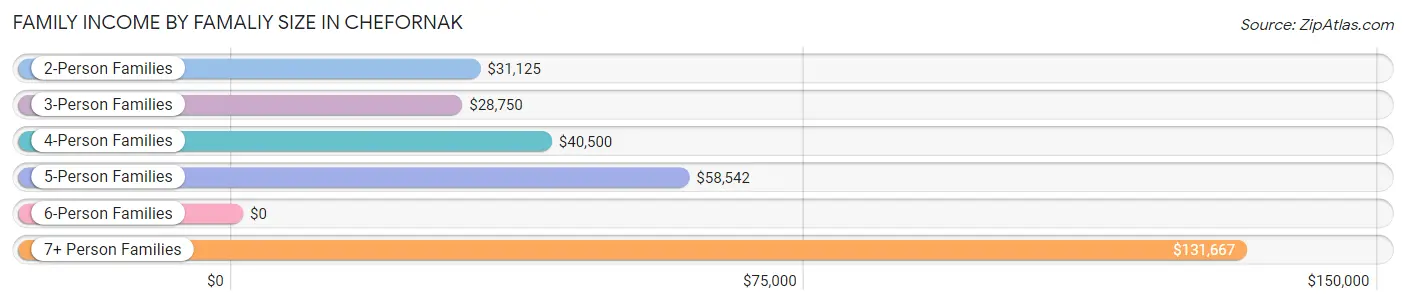
Family Income by Famaliy Size in Chefornak
7+ person families (20 | 23.0%) account for the highest median family income in Chefornak with $131,667 per family, while 7+ person families (20 | 23.0%) have the highest median income of $18,810 per family member.
| Income Bracket | # Families | Median Income |
| 2-Person Families | 15 (17.2%) | $31,125 |
| 3-Person Families | 7 (8.1%) | $28,750 |
| 4-Person Families | 14 (16.1%) | $40,500 |
| 5-Person Families | 29 (33.3%) | $58,542 |
| 6-Person Families | 2 (2.3%) | $0 |
| 7+ Person Families | 20 (23.0%) | $131,667 |
| Total | 87 (100.0%) | $50,750 |
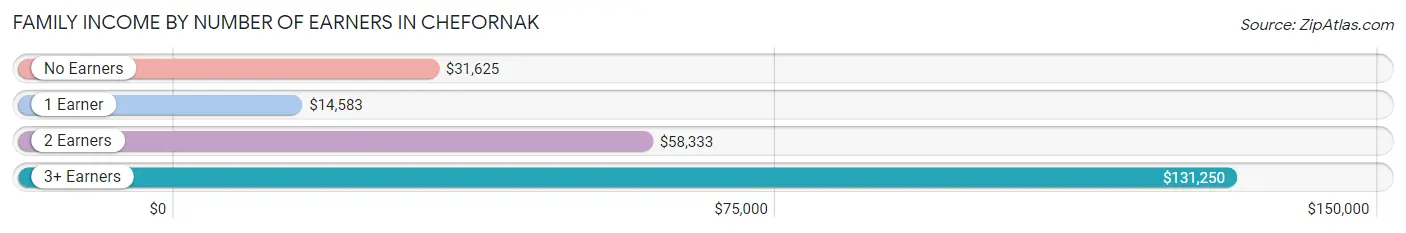
Family Income by Number of Earners in Chefornak
The median family income in Chefornak is $50,750, with families comprising 3+ earners (31) having the highest median family income of $131,250, while families with 1 earner (15) have the lowest median family income of $14,583, accounting for 35.6% and 17.2% of families, respectively.
| Number of Earners | # Families | Median Income |
| No Earners | 17 (19.5%) | $31,625 |
| 1 Earner | 15 (17.2%) | $14,583 |
| 2 Earners | 24 (27.6%) | $58,333 |
| 3+ Earners | 31 (35.6%) | $131,250 |
| Total | 87 (100.0%) | $50,750 |
Household Income in Chefornak
Household Income Brackets in Chefornak
With 20 households falling in the category, the $25,000 to $34,999 income range is the most frequent in Chefornak, accounting for 22.2% of all households.
| Income Bracket | # Households | % Households |
| Less than $10,000 | 5 | 5.6% |
| $10,000 to $14,999 | 6 | 6.7% |
| $15,000 to $24,999 | 2 | 2.2% |
| $25,000 to $34,999 | 20 | 22.2% |
| $35,000 to $49,999 | 12 | 13.3% |
| $50,000 to $74,999 | 14 | 15.6% |
| $75,000 to $99,999 | 8 | 8.9% |
| $100,000 to $149,999 | 14 | 15.6% |
| $150,000 to $199,999 | 9 | 10.0% |
| $200,000+ | 0 | 0.0% |
Household Income by Householder Age in Chefornak
The median household income in Chefornak is $47,500, with the highest median household income of $101,667 found in the 45 to 64 years age bracket for the primary householder. A total of 24 households (26.7%) fall into this category. Meanwhile, the 15 to 24 years age bracket for the primary householder has the lowest median household income of $0, with 2 households (2.2%) in this group.
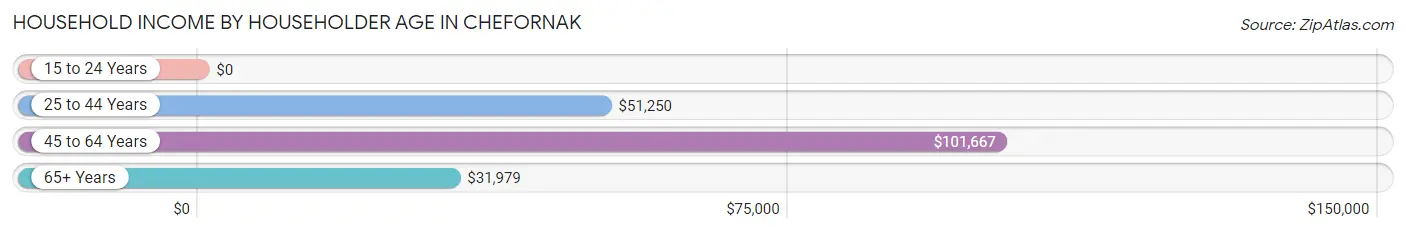
| Income Bracket | # Households | Median Income |
| 15 to 24 Years | 2 (2.2%) | $0 |
| 25 to 44 Years | 25 (27.8%) | $51,250 |
| 45 to 64 Years | 24 (26.7%) | $101,667 |
| 65+ Years | 39 (43.3%) | $31,979 |
| Total | 90 (100.0%) | $47,500 |
Poverty in Chefornak
Income Below Poverty by Sex and Age in Chefornak
With 18.8% poverty level for males and 24.5% for females among the residents of Chefornak, 18 to 24 year old males and 5 year old females are the most vulnerable to poverty, with 10 males (37.0%) and 9 females (75.0%) in their respective age groups living below the poverty level.
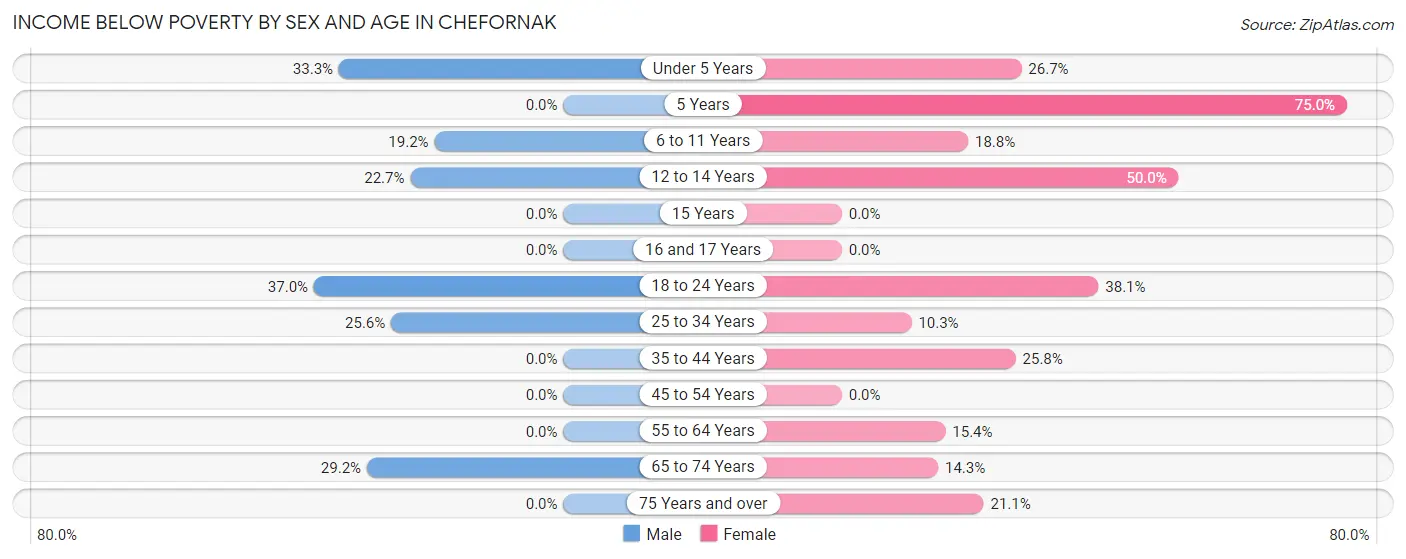
| Age Bracket | Male | Female |
| Under 5 Years | 9 (33.3%) | 8 (26.7%) |
| 5 Years | 0 (0.0%) | 9 (75.0%) |
| 6 to 11 Years | 9 (19.2%) | 3 (18.8%) |
| 12 to 14 Years | 5 (22.7%) | 3 (50.0%) |
| 15 Years | 0 (0.0%) | 0 (0.0%) |
| 16 and 17 Years | 0 (0.0%) | 0 (0.0%) |
| 18 to 24 Years | 10 (37.0%) | 8 (38.1%) |
| 25 to 34 Years | 11 (25.6%) | 3 (10.3%) |
| 35 to 44 Years | 0 (0.0%) | 8 (25.8%) |
| 45 to 54 Years | 0 (0.0%) | 0 (0.0%) |
| 55 to 64 Years | 0 (0.0%) | 2 (15.4%) |
| 65 to 74 Years | 7 (29.2%) | 2 (14.3%) |
| 75 Years and over | 0 (0.0%) | 4 (21.0%) |
| Total | 51 (18.8%) | 50 (24.5%) |
Income Above Poverty by Sex and Age in Chefornak
According to the poverty statistics in Chefornak, males aged 5 years and females aged 15 years are the age groups that are most secure financially, with 100.0% of males and 100.0% of females in these age groups living above the poverty line.
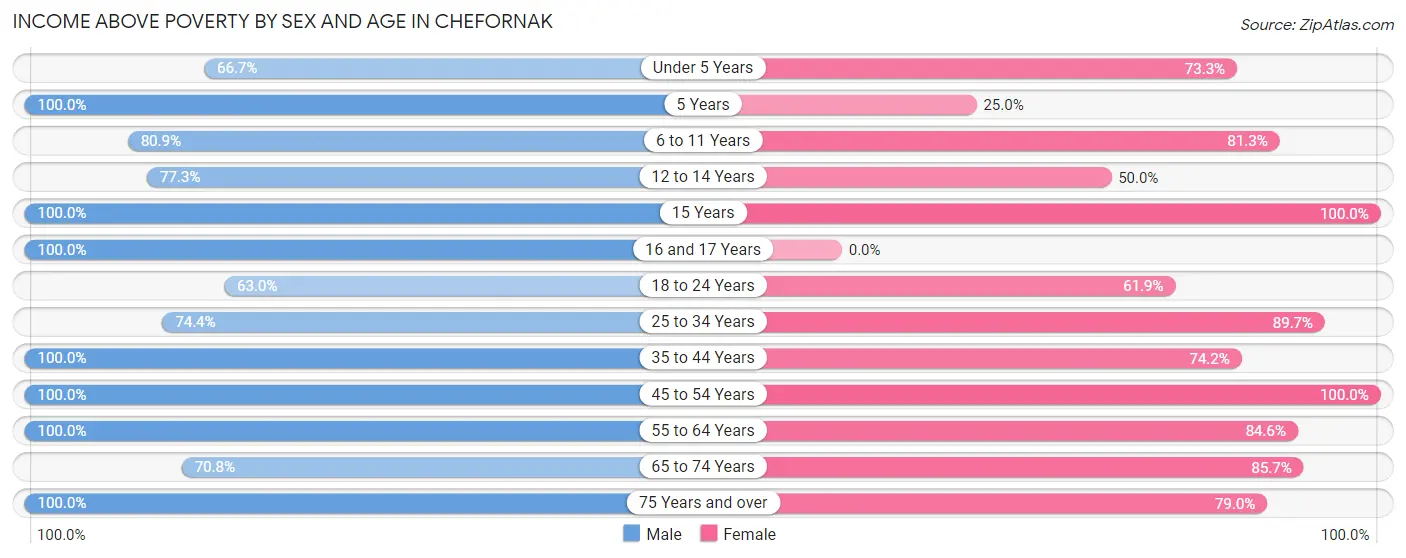
| Age Bracket | Male | Female |
| Under 5 Years | 18 (66.7%) | 22 (73.3%) |
| 5 Years | 3 (100.0%) | 3 (25.0%) |
| 6 to 11 Years | 38 (80.8%) | 13 (81.2%) |
| 12 to 14 Years | 17 (77.3%) | 3 (50.0%) |
| 15 Years | 8 (100.0%) | 3 (100.0%) |
| 16 and 17 Years | 15 (100.0%) | 0 (0.0%) |
| 18 to 24 Years | 17 (63.0%) | 13 (61.9%) |
| 25 to 34 Years | 32 (74.4%) | 26 (89.7%) |
| 35 to 44 Years | 9 (100.0%) | 23 (74.2%) |
| 45 to 54 Years | 13 (100.0%) | 10 (100.0%) |
| 55 to 64 Years | 25 (100.0%) | 11 (84.6%) |
| 65 to 74 Years | 17 (70.8%) | 12 (85.7%) |
| 75 Years and over | 9 (100.0%) | 15 (78.9%) |
| Total | 221 (81.2%) | 154 (75.5%) |
Income Below Poverty Among Married-Couple Families in Chefornak
The poverty statistics for married-couple families in Chefornak show that 17.0% or 10 of the total 59 families live below the poverty line. Families with 1 or 2 children have the highest poverty rate of 50.0%, comprising of 5 families. On the other hand, families with 3 or 4 children have the lowest poverty rate of 0.0%, which includes 0 families.
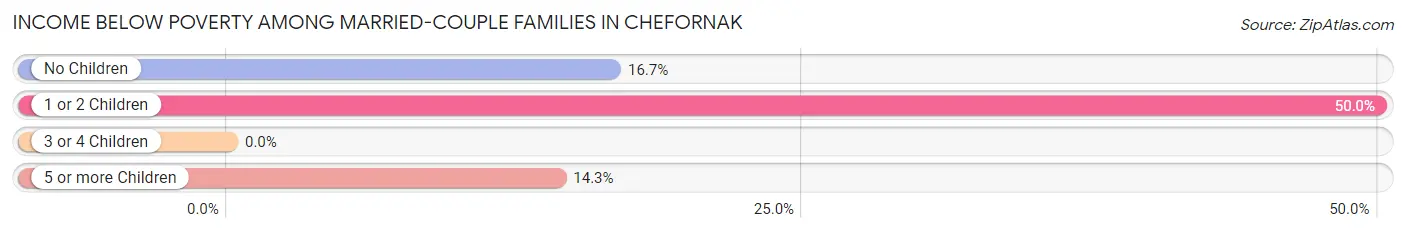
| Children | Above Poverty | Below Poverty |
| No Children | 15 (83.3%) | 3 (16.7%) |
| 1 or 2 Children | 5 (50.0%) | 5 (50.0%) |
| 3 or 4 Children | 17 (100.0%) | 0 (0.0%) |
| 5 or more Children | 12 (85.7%) | 2 (14.3%) |
| Total | 49 (83.1%) | 10 (17.0%) |
Income Below Poverty Among Single-Parent Households in Chefornak
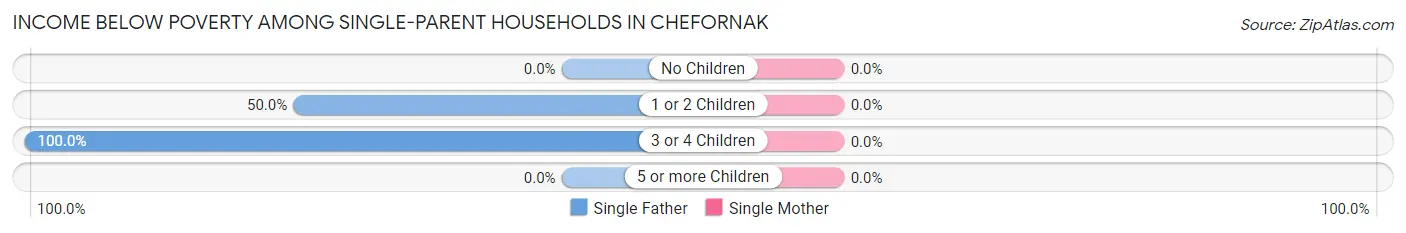
| Children | Single Father | Single Mother |
| No Children | 0 (0.0%) | 0 (0.0%) |
| 1 or 2 Children | 5 (50.0%) | 0 (0.0%) |
| 3 or 4 Children | 3 (100.0%) | 0 (0.0%) |
| 5 or more Children | 0 (0.0%) | 0 (0.0%) |
| Total | 8 (44.4%) | 0 (0.0%) |
Income Below Poverty Among Married-Couple vs Single-Parent Households in Chefornak
The poverty data for Chefornak shows that 10 of the married-couple family households (17.0%) and 8 of the single-parent households (28.6%) are living below the poverty level. Within the married-couple family households, those with 1 or 2 children have the highest poverty rate, with 5 households (50.0%) falling below the poverty line. Among the single-parent households, those with 3 or 4 children have the highest poverty rate, with 3 household (50.0%) living below poverty.
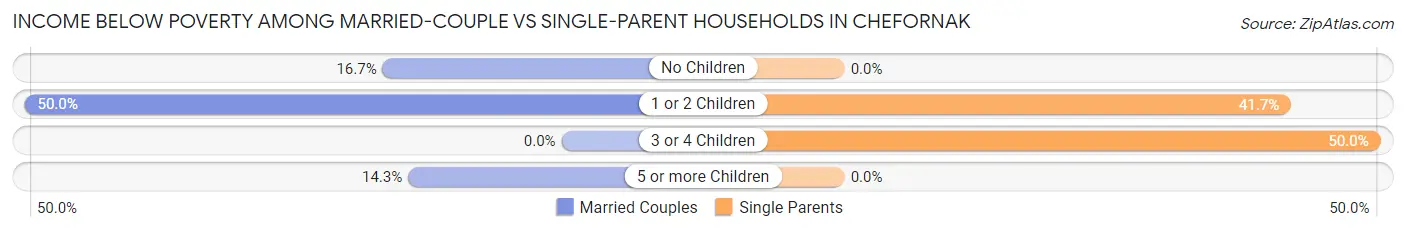
| Children | Married-Couple Families | Single-Parent Households |
| No Children | 3 (16.7%) | 0 (0.0%) |
| 1 or 2 Children | 5 (50.0%) | 5 (41.7%) |
| 3 or 4 Children | 0 (0.0%) | 3 (50.0%) |
| 5 or more Children | 2 (14.3%) | 0 (0.0%) |
| Total | 10 (17.0%) | 8 (28.6%) |
Employment Characteristics in Chefornak
Employment by Class of Employer in Chefornak
Among the 113 employed individuals in Chefornak, private company employees (48 | 42.5%), local government employees (30 | 26.6%), and state government employees (25 | 22.1%) make up the most common classes of employment.
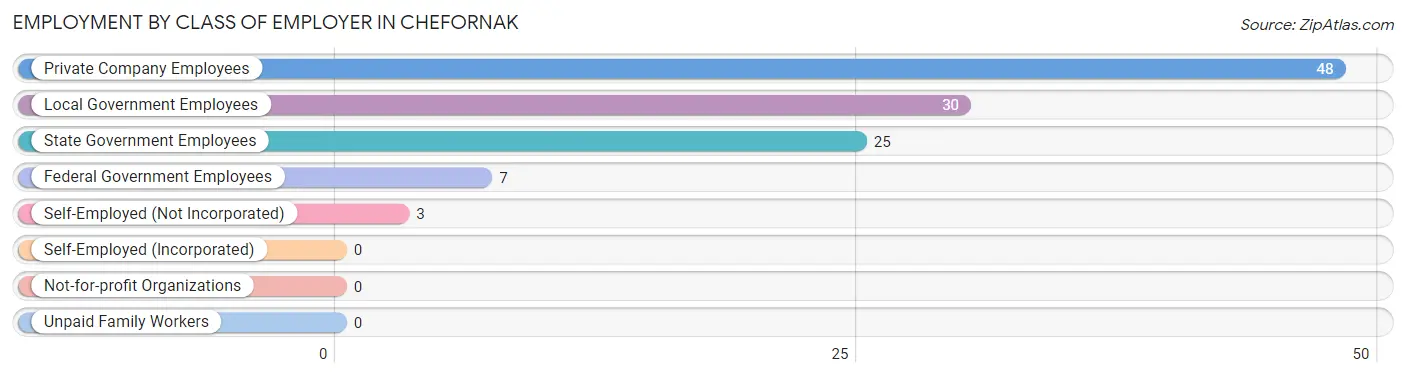
| Employer Class | # Employees | % Employees |
| Private Company Employees | 48 | 42.5% |
| Self-Employed (Incorporated) | 0 | 0.0% |
| Self-Employed (Not Incorporated) | 3 | 2.6% |
| Not-for-profit Organizations | 0 | 0.0% |
| Local Government Employees | 30 | 26.6% |
| State Government Employees | 25 | 22.1% |
| Federal Government Employees | 7 | 6.2% |
| Unpaid Family Workers | 0 | 0.0% |
| Total | 113 | 100.0% |
Employment Status by Age in Chefornak
According to the labor force statistics for Chefornak, out of the total population over 16 years of age (302), 53.6% or 162 individuals are in the labor force, with 27.8% or 45 of them unemployed. The age group with the highest labor force participation rate is 35 to 44 years, with 82.5% or 33 individuals in the labor force. Within the labor force, the 16 to 19 years age range has the highest percentage of unemployed individuals, with 62.5% or 5 of them being unemployed.
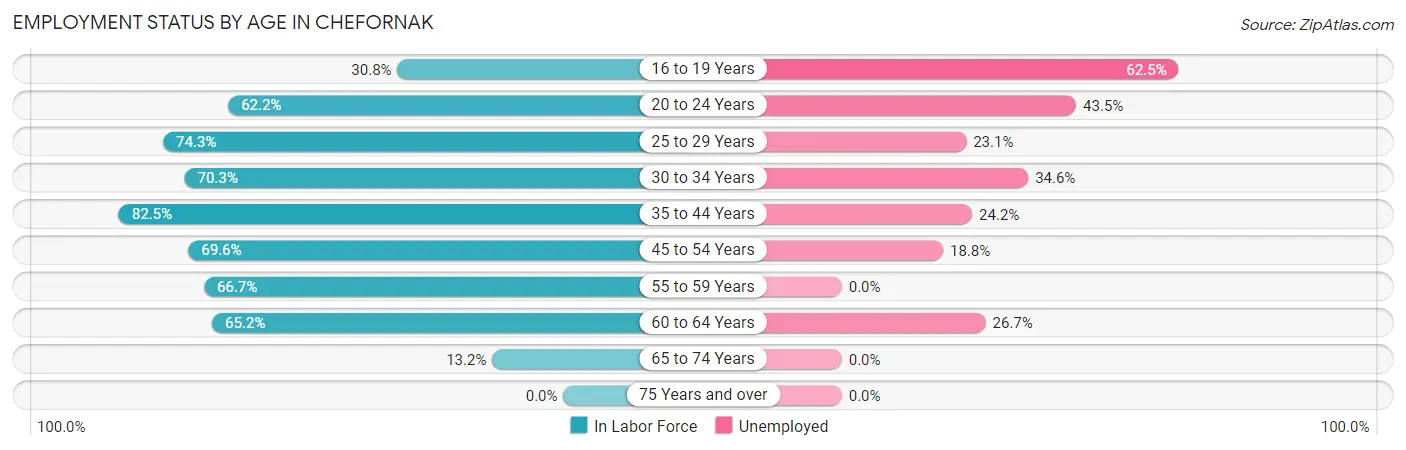
| Age Bracket | In Labor Force | Unemployed |
| 16 to 19 Years | 8 (30.8%) | 5 (62.5%) |
| 20 to 24 Years | 23 (62.2%) | 10 (43.5%) |
| 25 to 29 Years | 26 (74.3%) | 6 (23.1%) |
| 30 to 34 Years | 26 (70.3%) | 9 (34.6%) |
| 35 to 44 Years | 33 (82.5%) | 8 (24.2%) |
| 45 to 54 Years | 16 (69.6%) | 3 (18.8%) |
| 55 to 59 Years | 10 (66.7%) | 0 (0.0%) |
| 60 to 64 Years | 15 (65.2%) | 4 (26.7%) |
| 65 to 74 Years | 5 (13.2%) | 0 (0.0%) |
| 75 Years and over | 0 (0.0%) | 0 (0.0%) |
| Total | 162 (53.6%) | 45 (27.8%) |
Employment Status by Educational Attainment in Chefornak
According to labor force statistics for Chefornak, 72.8% of individuals (126) out of the total population between 25 and 64 years of age (173) are in the labor force, with 23.8% or 30 of them being unemployed. The group with the highest labor force participation rate are those with the educational attainment of less than high school, with 90.9% or 20 individuals in the labor force. Within the labor force, individuals with less than high school education have the highest percentage of unemployment, with 65.0% or 13 of them being unemployed.
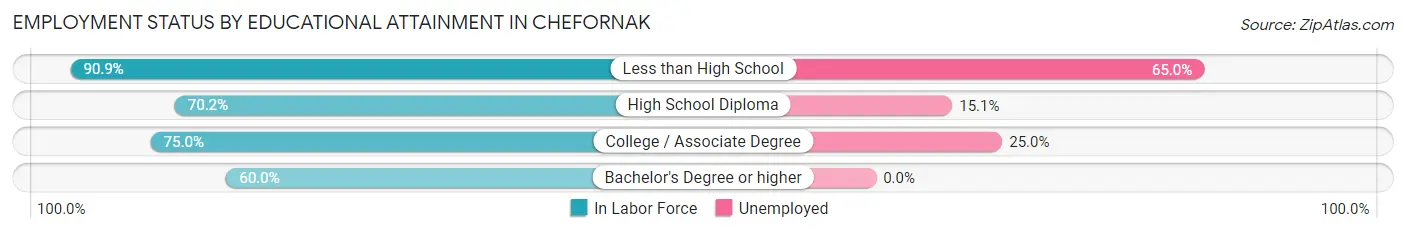
| Educational Attainment | In Labor Force | Unemployed |
| Less than High School | 20 (90.9%) | 14 (65.0%) |
| High School Diploma | 73 (70.2%) | 16 (15.1%) |
| College / Associate Degree | 24 (75.0%) | 8 (25.0%) |
| Bachelor's Degree or higher | 9 (60.0%) | 0 (0.0%) |
| Total | 126 (72.8%) | 41 (23.8%) |
Employment Occupations by Sex in Chefornak
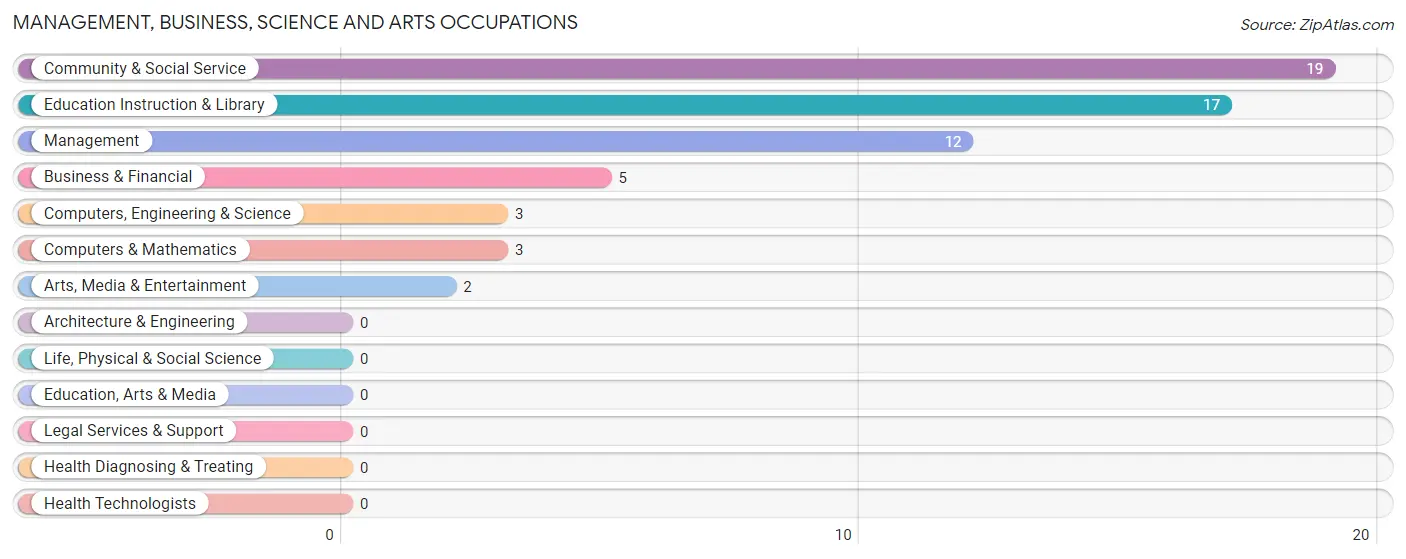
Management, Business, Science and Arts Occupations
The most common Management, Business, Science and Arts occupations in Chefornak are Community & Social Service (19 | 16.2%), Education Instruction & Library (17 | 14.5%), Management (12 | 10.3%), Business & Financial (5 | 4.3%), and Computers, Engineering & Science (3 | 2.6%).
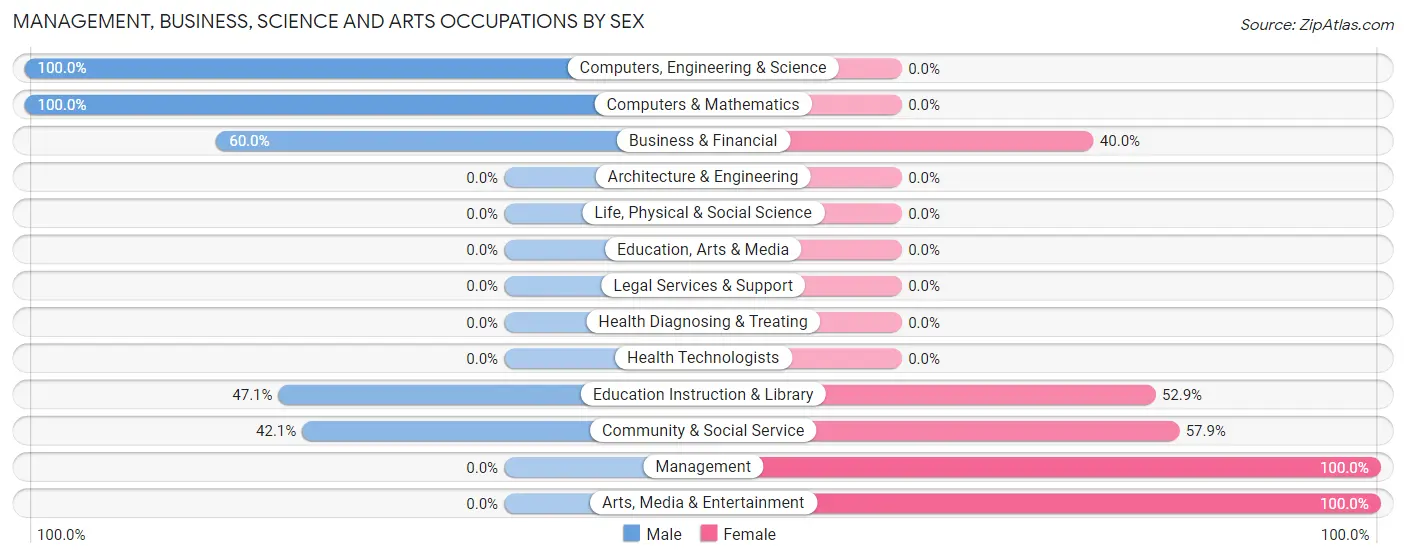
Management, Business, Science and Arts Occupations by Sex
Within the Management, Business, Science and Arts occupations in Chefornak, the most male-oriented occupations are Computers, Engineering & Science (100.0%), Computers & Mathematics (100.0%), and Business & Financial (60.0%), while the most female-oriented occupations are Management (100.0%), Arts, Media & Entertainment (100.0%), and Community & Social Service (57.9%).
| Occupation | Male | Female |
| Management | 0 (0.0%) | 12 (100.0%) |
| Business & Financial | 3 (60.0%) | 2 (40.0%) |
| Computers, Engineering & Science | 3 (100.0%) | 0 (0.0%) |
| Computers & Mathematics | 3 (100.0%) | 0 (0.0%) |
| Architecture & Engineering | 0 (0.0%) | 0 (0.0%) |
| Life, Physical & Social Science | 0 (0.0%) | 0 (0.0%) |
| Community & Social Service | 8 (42.1%) | 11 (57.9%) |
| Education, Arts & Media | 0 (0.0%) | 0 (0.0%) |
| Legal Services & Support | 0 (0.0%) | 0 (0.0%) |
| Education Instruction & Library | 8 (47.1%) | 9 (52.9%) |
| Arts, Media & Entertainment | 0 (0.0%) | 2 (100.0%) |
| Health Diagnosing & Treating | 0 (0.0%) | 0 (0.0%) |
| Health Technologists | 0 (0.0%) | 0 (0.0%) |
| Total (Category) | 14 (35.9%) | 25 (64.1%) |
| Total (Overall) | 58 (49.6%) | 59 (50.4%) |
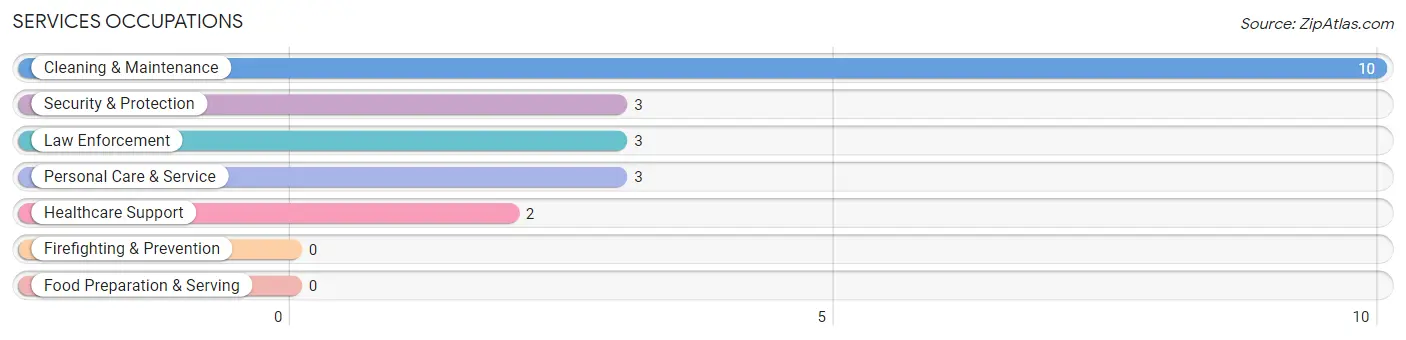
Services Occupations
The most common Services occupations in Chefornak are Cleaning & Maintenance (10 | 8.6%), Security & Protection (3 | 2.6%), Law Enforcement (3 | 2.6%), Personal Care & Service (3 | 2.6%), and Healthcare Support (2 | 1.7%).
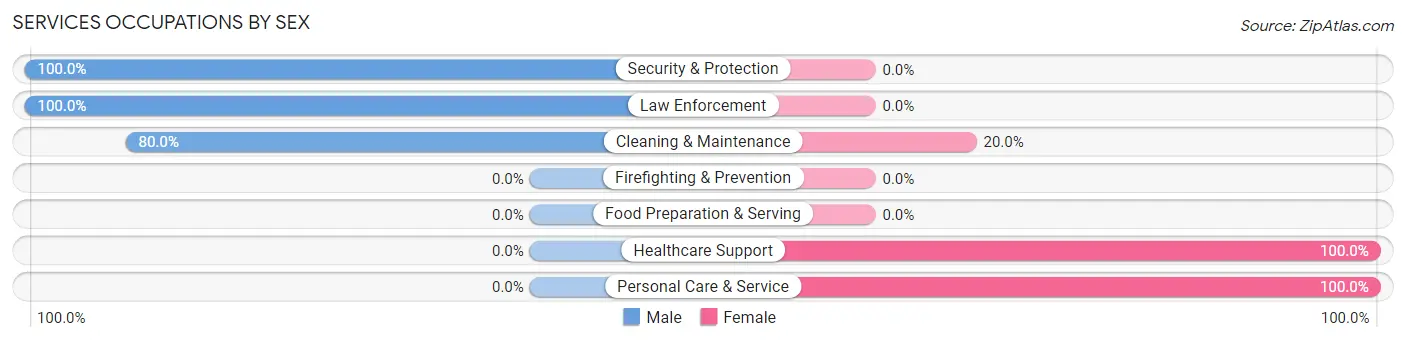
Services Occupations by Sex
Within the Services occupations in Chefornak, the most male-oriented occupations are Security & Protection (100.0%), Law Enforcement (100.0%), and Cleaning & Maintenance (80.0%), while the most female-oriented occupations are Healthcare Support (100.0%), Personal Care & Service (100.0%), and Cleaning & Maintenance (20.0%).
| Occupation | Male | Female |
| Healthcare Support | 0 (0.0%) | 2 (100.0%) |
| Security & Protection | 3 (100.0%) | 0 (0.0%) |
| Firefighting & Prevention | 0 (0.0%) | 0 (0.0%) |
| Law Enforcement | 3 (100.0%) | 0 (0.0%) |
| Food Preparation & Serving | 0 (0.0%) | 0 (0.0%) |
| Cleaning & Maintenance | 8 (80.0%) | 2 (20.0%) |
| Personal Care & Service | 0 (0.0%) | 3 (100.0%) |
| Total (Category) | 11 (61.1%) | 7 (38.9%) |
| Total (Overall) | 58 (49.6%) | 59 (50.4%) |
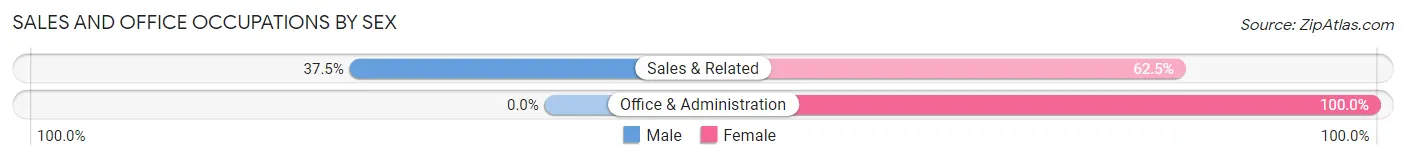
Sales and Office Occupations
The most common Sales and Office occupations in Chefornak are Office & Administration (22 | 18.8%), and Sales & Related (8 | 6.8%).

Sales and Office Occupations by Sex
| Occupation | Male | Female |
| Sales & Related | 3 (37.5%) | 5 (62.5%) |
| Office & Administration | 0 (0.0%) | 22 (100.0%) |
| Total (Category) | 3 (10.0%) | 27 (90.0%) |
| Total (Overall) | 58 (49.6%) | 59 (50.4%) |
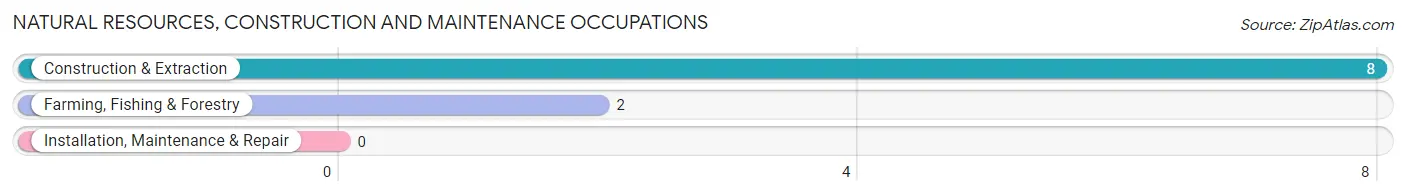
Natural Resources, Construction and Maintenance Occupations
The most common Natural Resources, Construction and Maintenance occupations in Chefornak are Construction & Extraction (8 | 6.8%), and Farming, Fishing & Forestry (2 | 1.7%).
Natural Resources, Construction and Maintenance Occupations by Sex
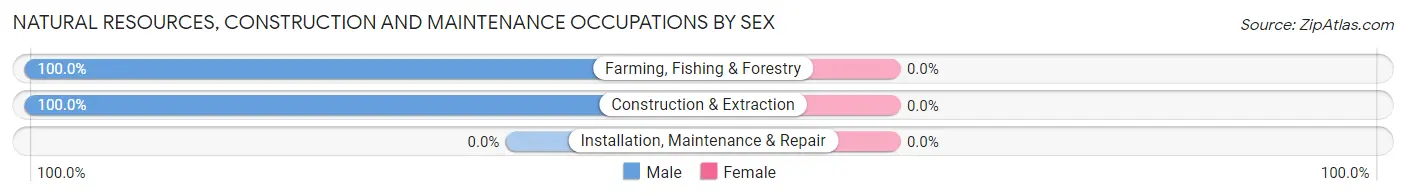
| Occupation | Male | Female |
| Farming, Fishing & Forestry | 2 (100.0%) | 0 (0.0%) |
| Construction & Extraction | 8 (100.0%) | 0 (0.0%) |
| Installation, Maintenance & Repair | 0 (0.0%) | 0 (0.0%) |
| Total (Category) | 10 (100.0%) | 0 (0.0%) |
| Total (Overall) | 58 (49.6%) | 59 (50.4%) |
Production, Transportation and Moving Occupations
The most common Production, Transportation and Moving occupations in Chefornak are Production (18 | 15.4%), and Transportation (2 | 1.7%).
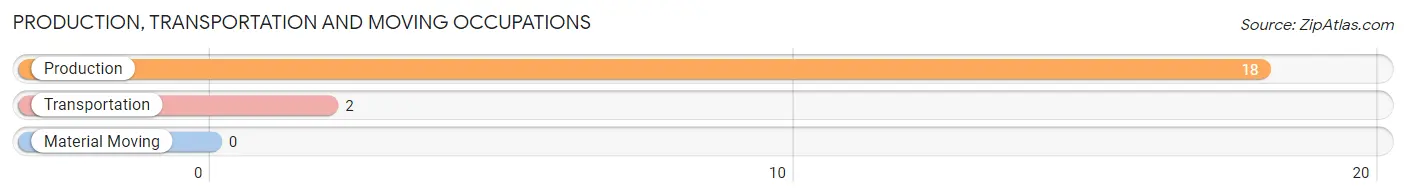
Production, Transportation and Moving Occupations by Sex
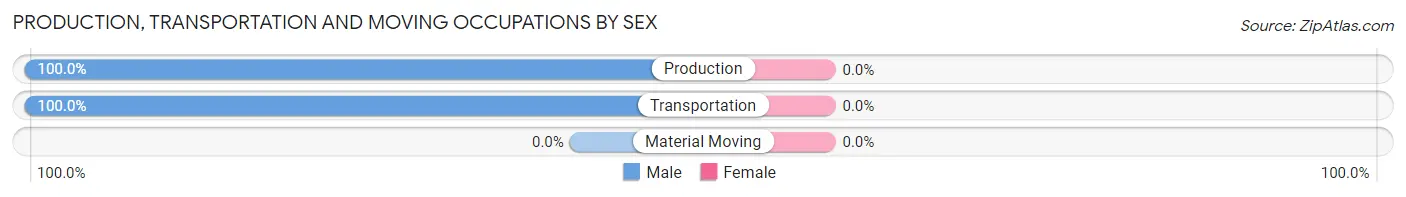
| Occupation | Male | Female |
| Production | 18 (100.0%) | 0 (0.0%) |
| Transportation | 2 (100.0%) | 0 (0.0%) |
| Material Moving | 0 (0.0%) | 0 (0.0%) |
| Total (Category) | 20 (100.0%) | 0 (0.0%) |
| Total (Overall) | 58 (49.6%) | 59 (50.4%) |
Employment Industries by Sex in Chefornak
Employment Industries in Chefornak
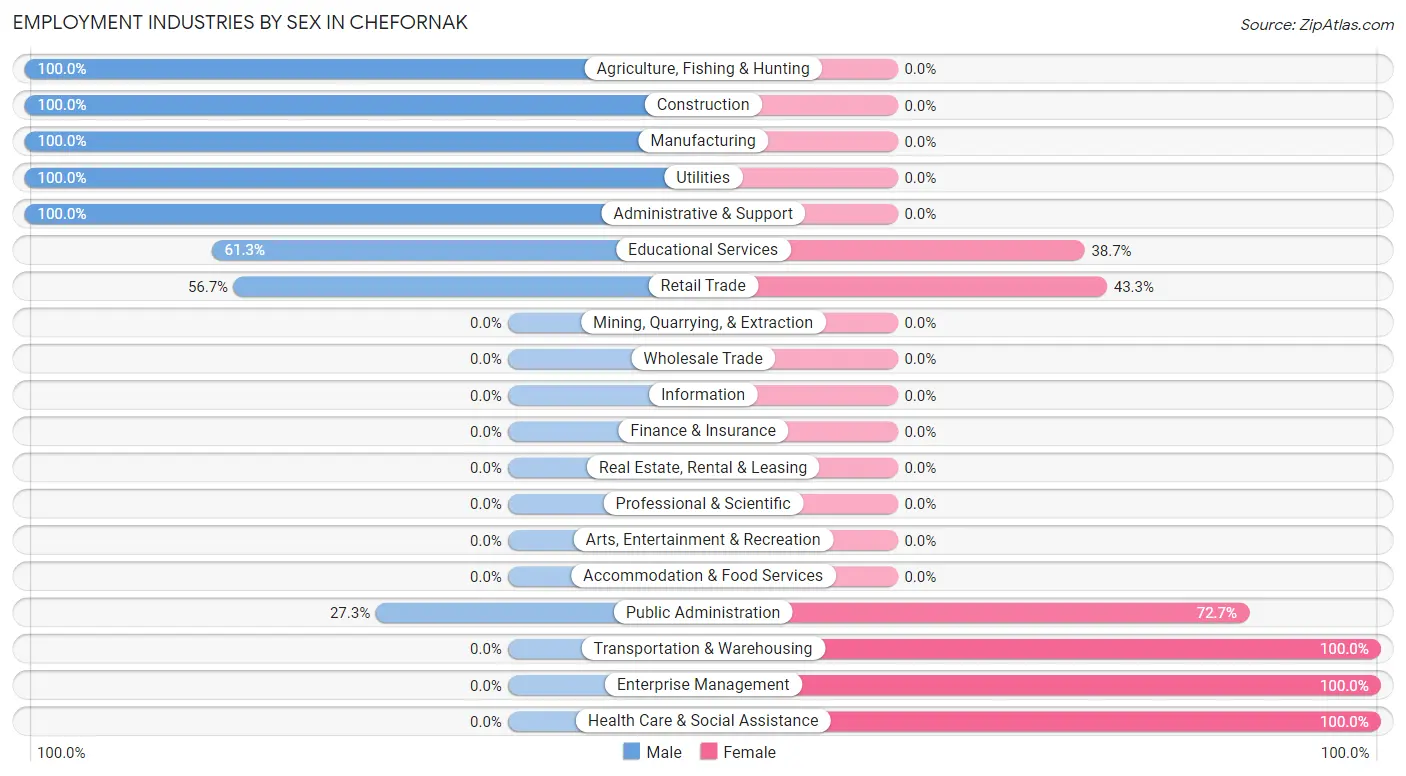
The major employment industries in Chefornak include Educational Services (31 | 26.5%), Retail Trade (30 | 25.6%), Transportation & Warehousing (14 | 12.0%), Public Administration (11 | 9.4%), and Health Care & Social Assistance (7 | 6.0%).
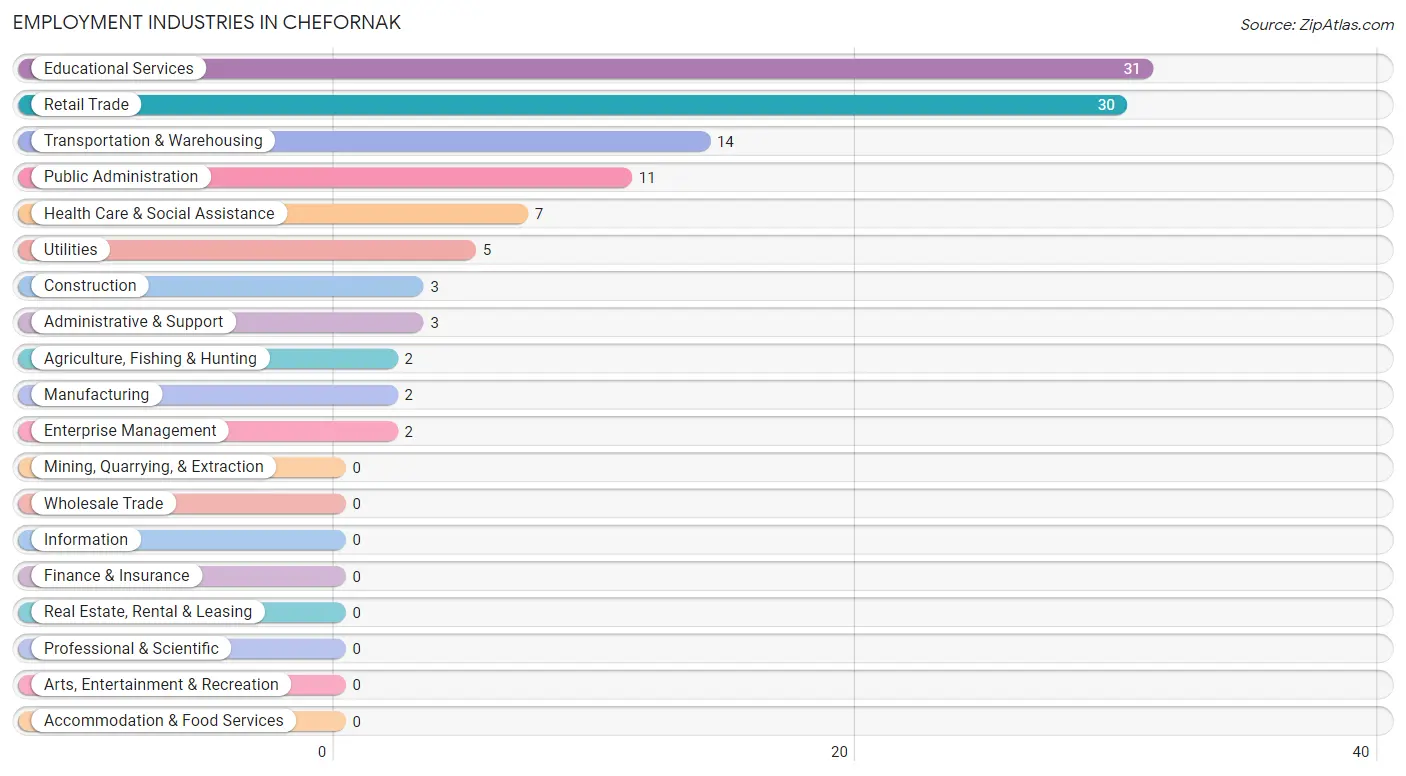
Employment Industries by Sex in Chefornak
The Chefornak industries that see more men than women are Agriculture, Fishing & Hunting (100.0%), Construction (100.0%), and Manufacturing (100.0%), whereas the industries that tend to have a higher number of women are Transportation & Warehousing (100.0%), Enterprise Management (100.0%), and Health Care & Social Assistance (100.0%).
| Industry | Male | Female |
| Agriculture, Fishing & Hunting | 2 (100.0%) | 0 (0.0%) |
| Mining, Quarrying, & Extraction | 0 (0.0%) | 0 (0.0%) |
| Construction | 3 (100.0%) | 0 (0.0%) |
| Manufacturing | 2 (100.0%) | 0 (0.0%) |
| Wholesale Trade | 0 (0.0%) | 0 (0.0%) |
| Retail Trade | 17 (56.7%) | 13 (43.3%) |
| Transportation & Warehousing | 0 (0.0%) | 14 (100.0%) |
| Utilities | 5 (100.0%) | 0 (0.0%) |
| Information | 0 (0.0%) | 0 (0.0%) |
| Finance & Insurance | 0 (0.0%) | 0 (0.0%) |
| Real Estate, Rental & Leasing | 0 (0.0%) | 0 (0.0%) |
| Professional & Scientific | 0 (0.0%) | 0 (0.0%) |
| Enterprise Management | 0 (0.0%) | 2 (100.0%) |
| Administrative & Support | 3 (100.0%) | 0 (0.0%) |
| Educational Services | 19 (61.3%) | 12 (38.7%) |
| Health Care & Social Assistance | 0 (0.0%) | 7 (100.0%) |
| Arts, Entertainment & Recreation | 0 (0.0%) | 0 (0.0%) |
| Accommodation & Food Services | 0 (0.0%) | 0 (0.0%) |
| Public Administration | 3 (27.3%) | 8 (72.7%) |
| Total | 58 (49.6%) | 59 (50.4%) |
Education in Chefornak
School Enrollment in Chefornak
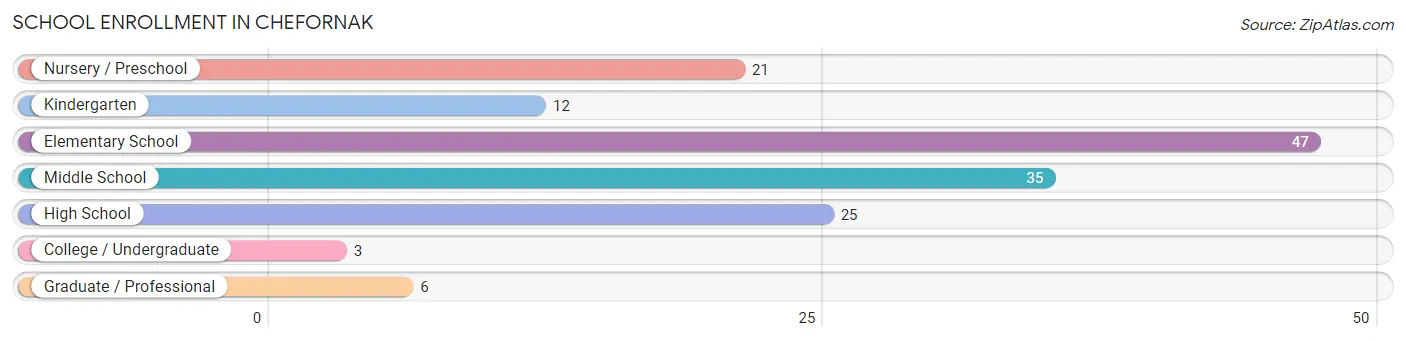
The most common levels of schooling among the 149 students in Chefornak are elementary school (47 | 31.5%), middle school (35 | 23.5%), and high school (25 | 16.8%).
| School Level | # Students | % Students |
| Nursery / Preschool | 21 | 14.1% |
| Kindergarten | 12 | 8.1% |
| Elementary School | 47 | 31.5% |
| Middle School | 35 | 23.5% |
| High School | 25 | 16.8% |
| College / Undergraduate | 3 | 2.0% |
| Graduate / Professional | 6 | 4.0% |
| Total | 149 | 100.0% |
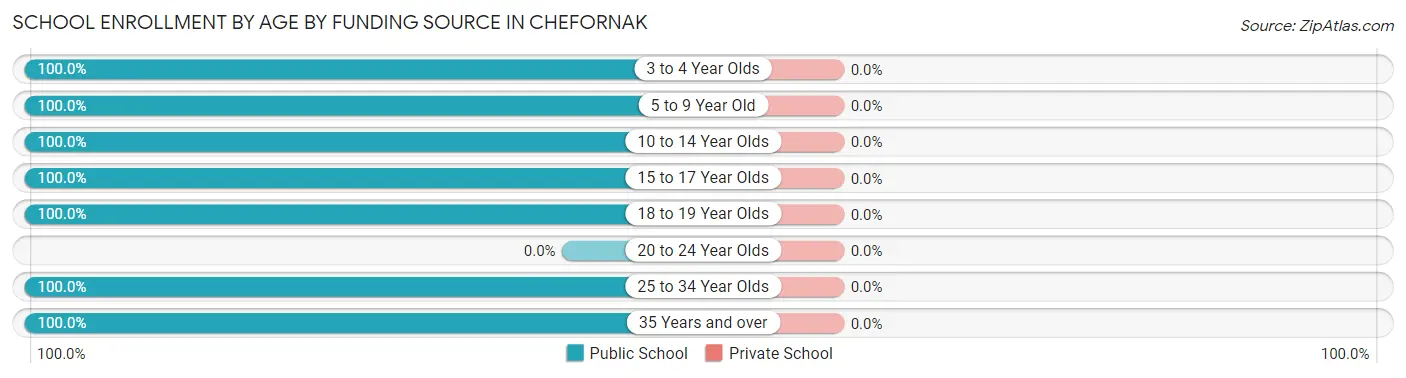
School Enrollment by Age by Funding Source in Chefornak
| Age Bracket | Public School | Private School |
| 3 to 4 Year Olds | 21 (100.0%) | 0 (0.0%) |
| 5 to 9 Year Old | 59 (100.0%) | 0 (0.0%) |
| 10 to 14 Year Olds | 38 (100.0%) | 0 (0.0%) |
| 15 to 17 Year Olds | 20 (100.0%) | 0 (0.0%) |
| 18 to 19 Year Olds | 2 (100.0%) | 0 (0.0%) |
| 20 to 24 Year Olds | 0 (0.0%) | 0 (0.0%) |
| 25 to 34 Year Olds | 3 (100.0%) | 0 (0.0%) |
| 35 Years and over | 6 (100.0%) | 0 (0.0%) |
| Total | 149 (100.0%) | 0 (0.0%) |
Educational Attainment by Field of Study in Chefornak
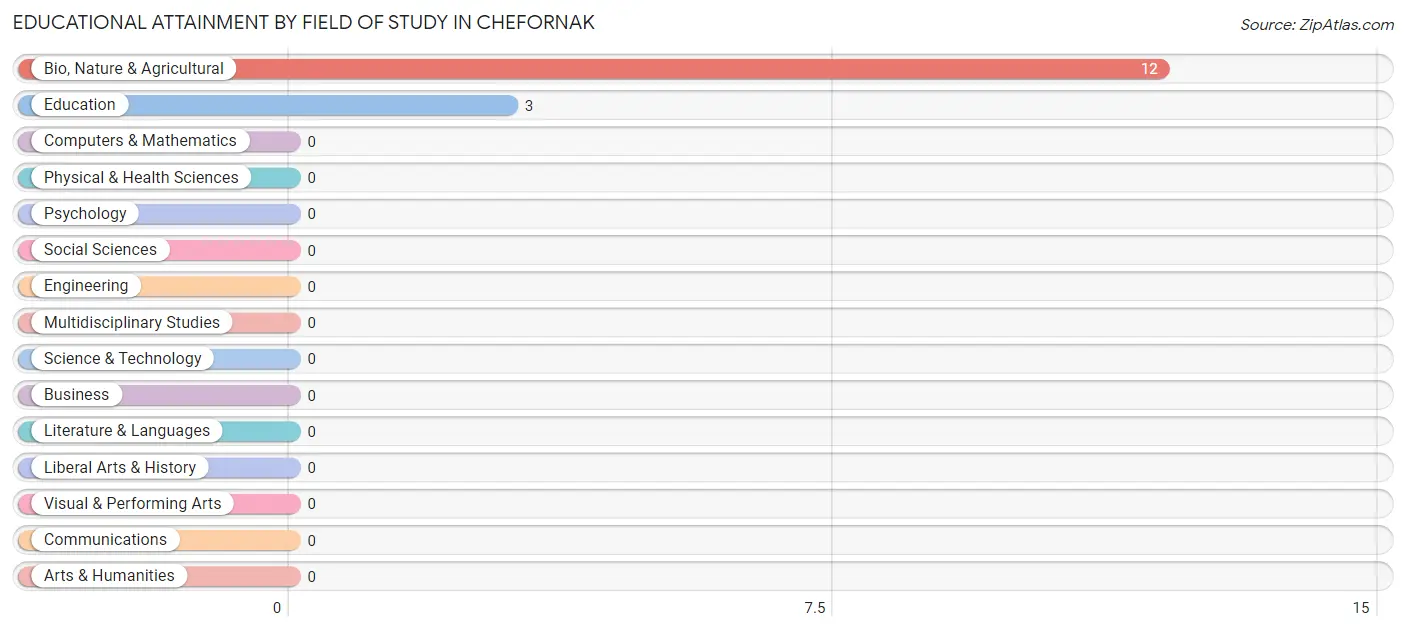
Bio, nature & agricultural (12 | 80.0%), and education (3 | 20.0%) are the most common fields of study among 15 individuals in Chefornak who have obtained a bachelor's degree or higher.
| Field of Study | # Graduates | % Graduates |
| Computers & Mathematics | 0 | 0.0% |
| Bio, Nature & Agricultural | 12 | 80.0% |
| Physical & Health Sciences | 0 | 0.0% |
| Psychology | 0 | 0.0% |
| Social Sciences | 0 | 0.0% |
| Engineering | 0 | 0.0% |
| Multidisciplinary Studies | 0 | 0.0% |
| Science & Technology | 0 | 0.0% |
| Business | 0 | 0.0% |
| Education | 3 | 20.0% |
| Literature & Languages | 0 | 0.0% |
| Liberal Arts & History | 0 | 0.0% |
| Visual & Performing Arts | 0 | 0.0% |
| Communications | 0 | 0.0% |
| Arts & Humanities | 0 | 0.0% |
| Total | 15 | 100.0% |
Transportation & Commute in Chefornak
Vehicle Availability by Sex in Chefornak
The most prevalent vehicle ownership categories in Chefornak are males with no vehicle (48, accounting for 88.9%) and females with no vehicle (51, making up 81.4%).
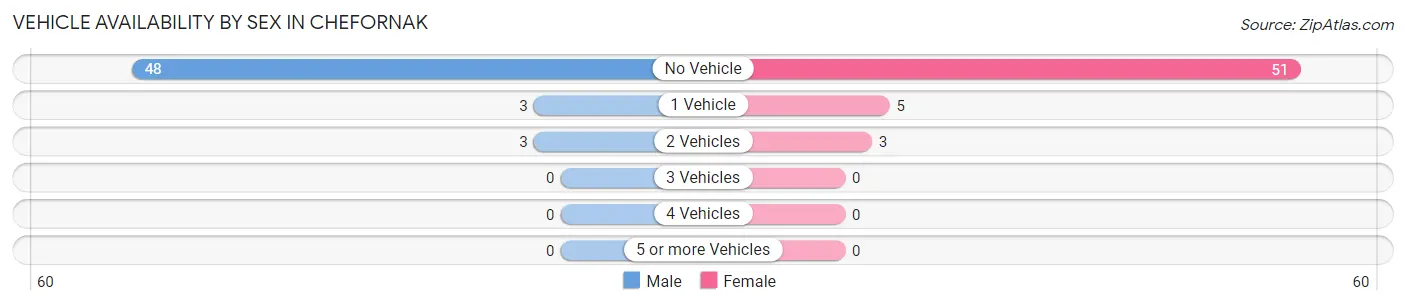
| Vehicles Available | Male | Female |
| No Vehicle | 48 (88.9%) | 51 (86.4%) |
| 1 Vehicle | 3 (5.6%) | 5 (8.5%) |
| 2 Vehicles | 3 (5.6%) | 3 (5.1%) |
| 3 Vehicles | 0 (0.0%) | 0 (0.0%) |
| 4 Vehicles | 0 (0.0%) | 0 (0.0%) |
| 5 or more Vehicles | 0 (0.0%) | 0 (0.0%) |
| Total | 54 (100.0%) | 59 (100.0%) |
Commute Time in Chefornak
The most frequently occuring commute durations in Chefornak are 5 to 9 minutes (73 commuters, 74.5%), less than 5 minutes (20 commuters, 20.4%), and 15 to 19 minutes (3 commuters, 3.1%).
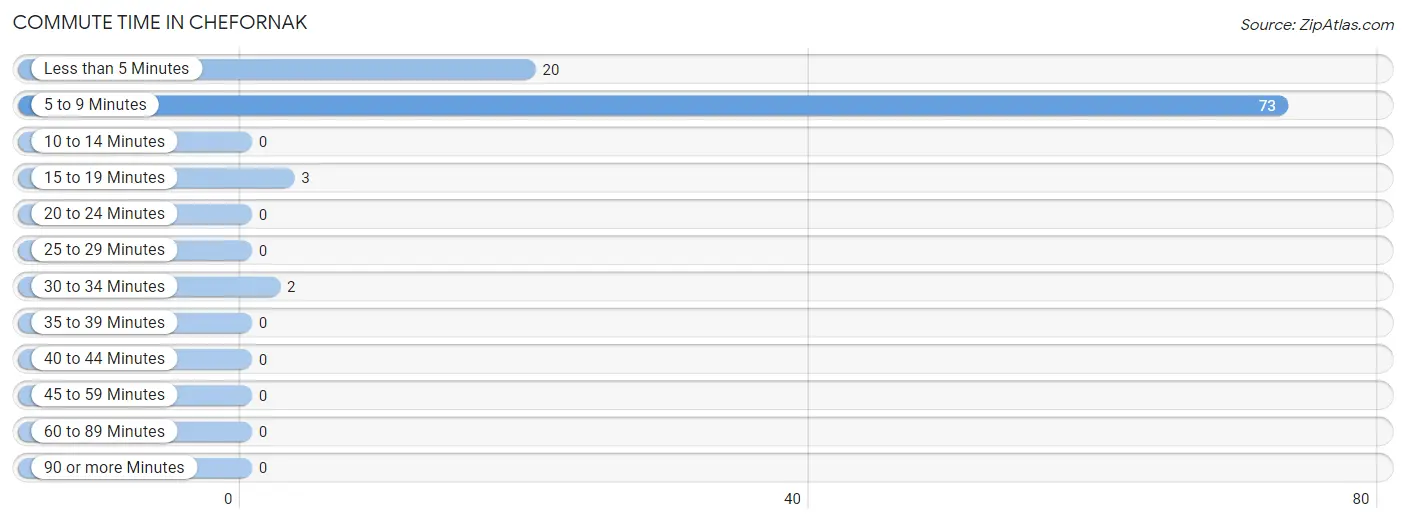
| Commute Time | # Commuters | % Commuters |
| Less than 5 Minutes | 20 | 20.4% |
| 5 to 9 Minutes | 73 | 74.5% |
| 10 to 14 Minutes | 0 | 0.0% |
| 15 to 19 Minutes | 3 | 3.1% |
| 20 to 24 Minutes | 0 | 0.0% |
| 25 to 29 Minutes | 0 | 0.0% |
| 30 to 34 Minutes | 2 | 2.0% |
| 35 to 39 Minutes | 0 | 0.0% |
| 40 to 44 Minutes | 0 | 0.0% |
| 45 to 59 Minutes | 0 | 0.0% |
| 60 to 89 Minutes | 0 | 0.0% |
| 90 or more Minutes | 0 | 0.0% |
Commute Time by Sex in Chefornak
The most common commute times in Chefornak are 5 to 9 minutes (33 commuters, 66.0%) for males and 5 to 9 minutes (40 commuters, 83.3%) for females.
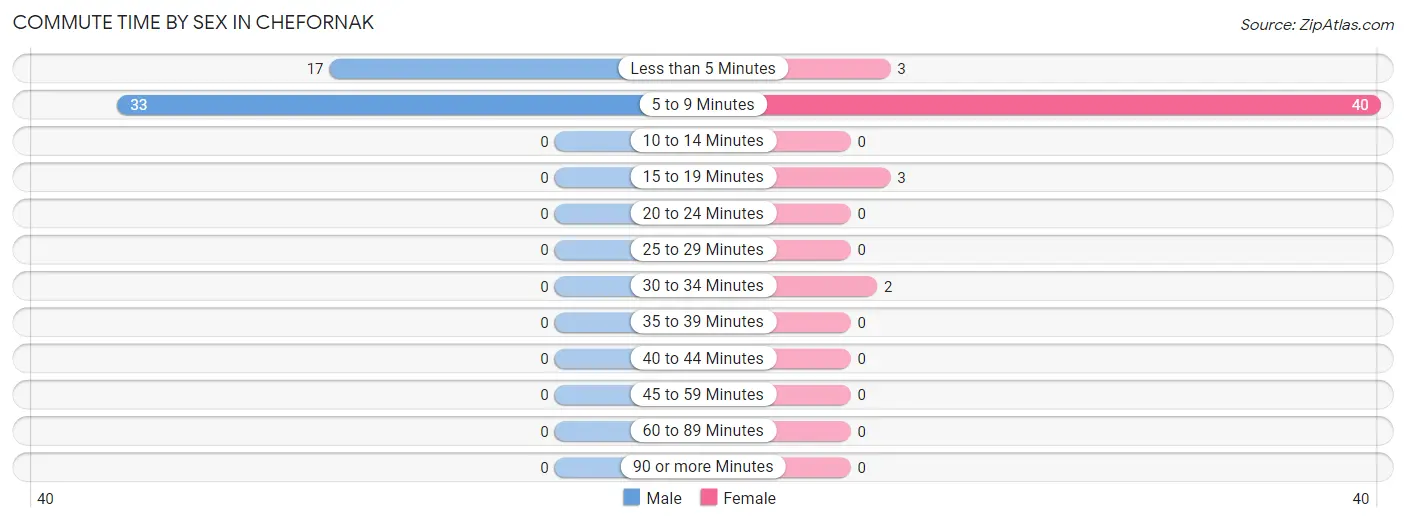
| Commute Time | Male | Female |
| Less than 5 Minutes | 17 (34.0%) | 3 (6.2%) |
| 5 to 9 Minutes | 33 (66.0%) | 40 (83.3%) |
| 10 to 14 Minutes | 0 (0.0%) | 0 (0.0%) |
| 15 to 19 Minutes | 0 (0.0%) | 3 (6.2%) |
| 20 to 24 Minutes | 0 (0.0%) | 0 (0.0%) |
| 25 to 29 Minutes | 0 (0.0%) | 0 (0.0%) |
| 30 to 34 Minutes | 0 (0.0%) | 2 (4.2%) |
| 35 to 39 Minutes | 0 (0.0%) | 0 (0.0%) |
| 40 to 44 Minutes | 0 (0.0%) | 0 (0.0%) |
| 45 to 59 Minutes | 0 (0.0%) | 0 (0.0%) |
| 60 to 89 Minutes | 0 (0.0%) | 0 (0.0%) |
| 90 or more Minutes | 0 (0.0%) | 0 (0.0%) |
Time of Departure to Work by Sex in Chefornak
The most frequent times of departure to work in Chefornak are 9:00 AM to 9:59 AM (21, 42.0%) for males and 9:00 AM to 9:59 AM (21, 43.8%) for females.
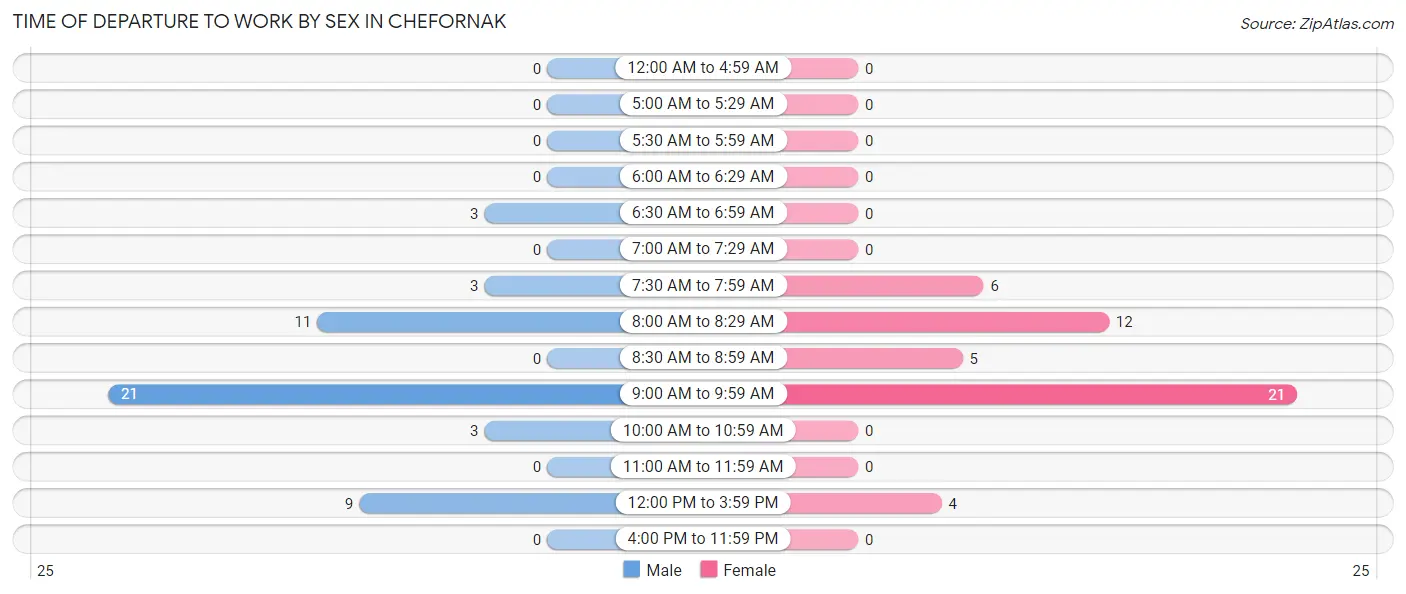
| Time of Departure | Male | Female |
| 12:00 AM to 4:59 AM | 0 (0.0%) | 0 (0.0%) |
| 5:00 AM to 5:29 AM | 0 (0.0%) | 0 (0.0%) |
| 5:30 AM to 5:59 AM | 0 (0.0%) | 0 (0.0%) |
| 6:00 AM to 6:29 AM | 0 (0.0%) | 0 (0.0%) |
| 6:30 AM to 6:59 AM | 3 (6.0%) | 0 (0.0%) |
| 7:00 AM to 7:29 AM | 0 (0.0%) | 0 (0.0%) |
| 7:30 AM to 7:59 AM | 3 (6.0%) | 6 (12.5%) |
| 8:00 AM to 8:29 AM | 11 (22.0%) | 12 (25.0%) |
| 8:30 AM to 8:59 AM | 0 (0.0%) | 5 (10.4%) |
| 9:00 AM to 9:59 AM | 21 (42.0%) | 21 (43.8%) |
| 10:00 AM to 10:59 AM | 3 (6.0%) | 0 (0.0%) |
| 11:00 AM to 11:59 AM | 0 (0.0%) | 0 (0.0%) |
| 12:00 PM to 3:59 PM | 9 (18.0%) | 4 (8.3%) |
| 4:00 PM to 11:59 PM | 0 (0.0%) | 0 (0.0%) |
| Total | 50 (100.0%) | 48 (100.0%) |
Housing Occupancy in Chefornak
Occupancy by Ownership in Chefornak
Of the total 90 dwellings in Chefornak, owner-occupied units account for 73 (81.1%), while renter-occupied units make up 17 (18.9%).
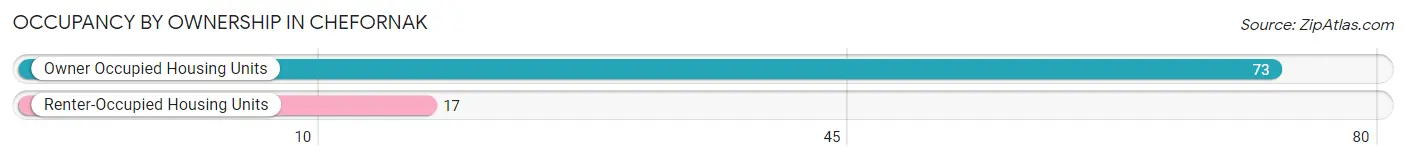
| Occupancy | # Housing Units | % Housing Units |
| Owner Occupied Housing Units | 73 | 81.1% |
| Renter-Occupied Housing Units | 17 | 18.9% |
| Total Occupied Housing Units | 90 | 100.0% |
Occupancy by Household Size in Chefornak
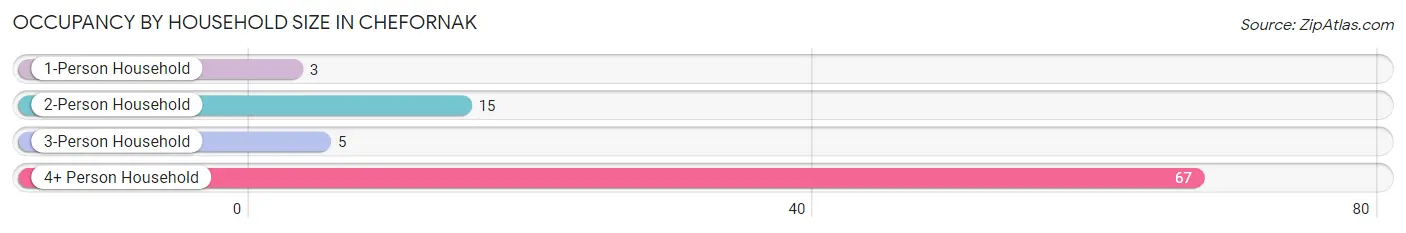
| Household Size | # Housing Units | % Housing Units |
| 1-Person Household | 3 | 3.3% |
| 2-Person Household | 15 | 16.7% |
| 3-Person Household | 5 | 5.6% |
| 4+ Person Household | 67 | 74.4% |
| Total Housing Units | 90 | 100.0% |
Occupancy by Ownership by Household Size in Chefornak
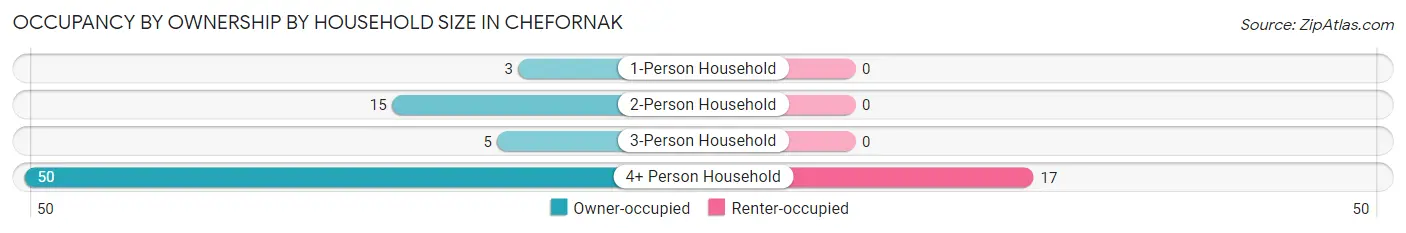
| Household Size | Owner-occupied | Renter-occupied |
| 1-Person Household | 3 (100.0%) | 0 (0.0%) |
| 2-Person Household | 15 (100.0%) | 0 (0.0%) |
| 3-Person Household | 5 (100.0%) | 0 (0.0%) |
| 4+ Person Household | 50 (74.6%) | 17 (25.4%) |
| Total Housing Units | 73 (81.1%) | 17 (18.9%) |
Occupancy by Educational Attainment in Chefornak
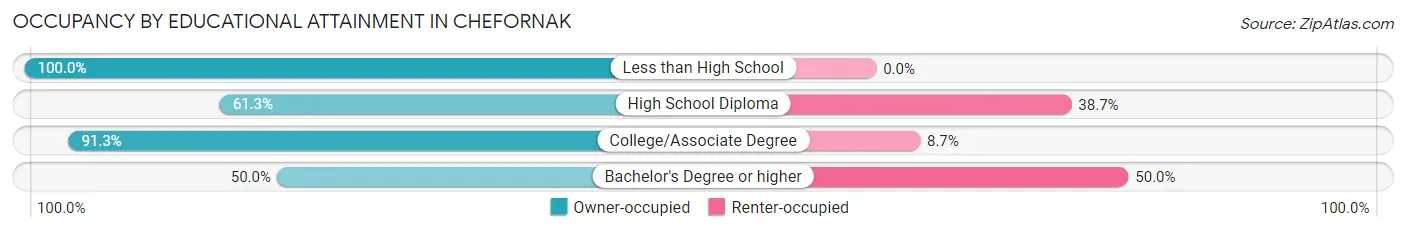
| Household Size | Owner-occupied | Renter-occupied |
| Less than High School | 30 (100.0%) | 0 (0.0%) |
| High School Diploma | 19 (61.3%) | 12 (38.7%) |
| College/Associate Degree | 21 (91.3%) | 2 (8.7%) |
| Bachelor's Degree or higher | 3 (50.0%) | 3 (50.0%) |
Occupancy by Age of Householder in Chefornak
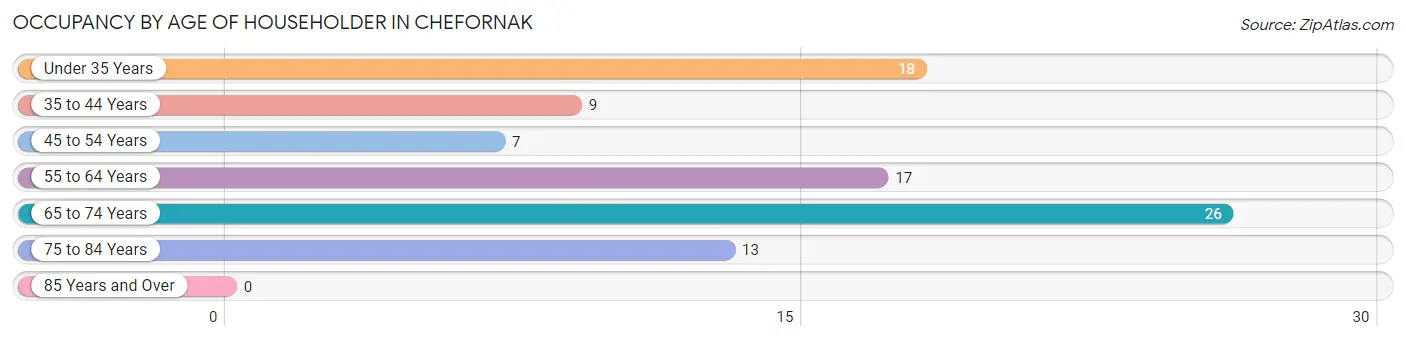
| Age Bracket | # Households | % Households |
| Under 35 Years | 18 | 20.0% |
| 35 to 44 Years | 9 | 10.0% |
| 45 to 54 Years | 7 | 7.8% |
| 55 to 64 Years | 17 | 18.9% |
| 65 to 74 Years | 26 | 28.9% |
| 75 to 84 Years | 13 | 14.4% |
| 85 Years and Over | 0 | 0.0% |
| Total | 90 | 100.0% |
Housing Finances in Chefornak
Median Income by Occupancy in Chefornak
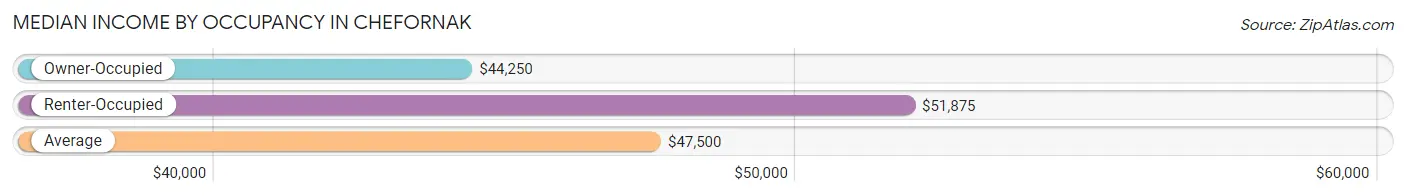
| Occupancy Type | # Households | Median Income |
| Owner-Occupied | 73 (81.1%) | $44,250 |
| Renter-Occupied | 17 (18.9%) | $51,875 |
| Average | 90 (100.0%) | $47,500 |
Occupancy by Householder Income Bracket in Chefornak
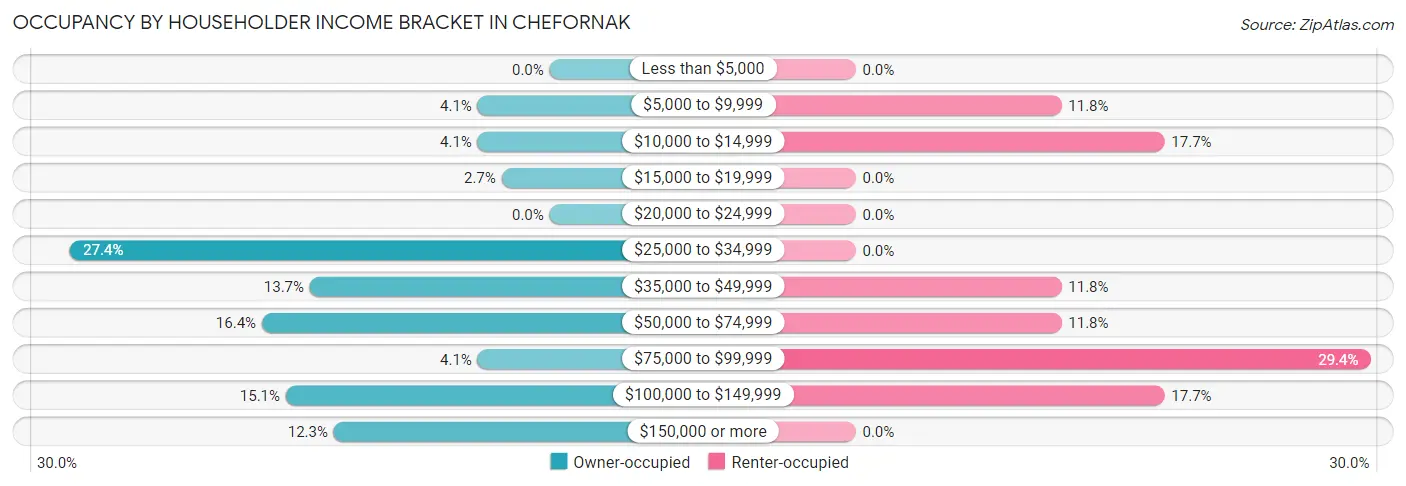
| Income Bracket | Owner-occupied | Renter-occupied |
| Less than $5,000 | 0 (0.0%) | 0 (0.0%) |
| $5,000 to $9,999 | 3 (4.1%) | 2 (11.8%) |
| $10,000 to $14,999 | 3 (4.1%) | 3 (17.6%) |
| $15,000 to $19,999 | 2 (2.7%) | 0 (0.0%) |
| $20,000 to $24,999 | 0 (0.0%) | 0 (0.0%) |
| $25,000 to $34,999 | 20 (27.4%) | 0 (0.0%) |
| $35,000 to $49,999 | 10 (13.7%) | 2 (11.8%) |
| $50,000 to $74,999 | 12 (16.4%) | 2 (11.8%) |
| $75,000 to $99,999 | 3 (4.1%) | 5 (29.4%) |
| $100,000 to $149,999 | 11 (15.1%) | 3 (17.6%) |
| $150,000 or more | 9 (12.3%) | 0 (0.0%) |
| Total | 73 (100.0%) | 17 (100.0%) |
Monthly Housing Cost Tiers in Chefornak
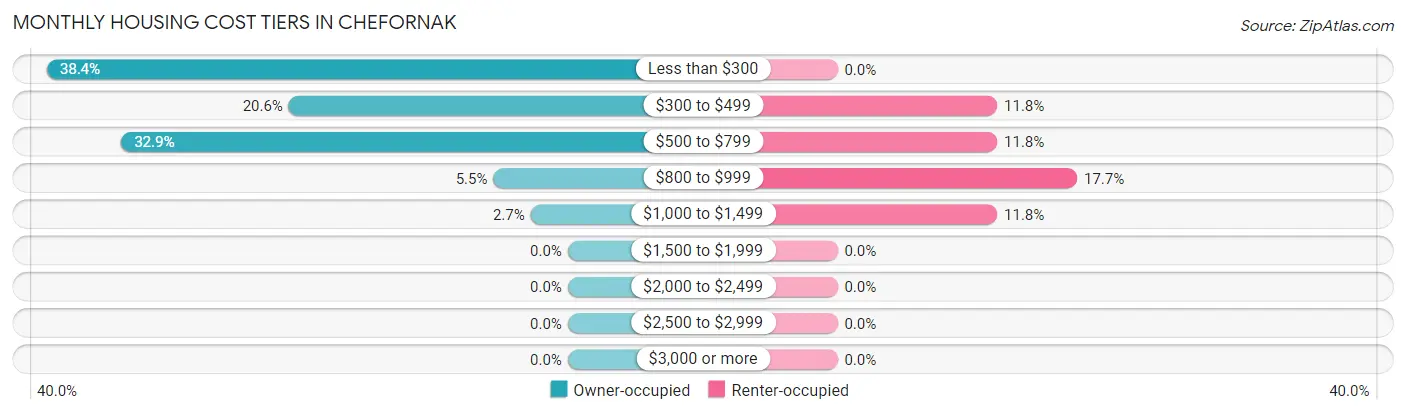
| Monthly Cost | Owner-occupied | Renter-occupied |
| Less than $300 | 28 (38.4%) | 0 (0.0%) |
| $300 to $499 | 15 (20.5%) | 2 (11.8%) |
| $500 to $799 | 24 (32.9%) | 2 (11.8%) |
| $800 to $999 | 4 (5.5%) | 3 (17.6%) |
| $1,000 to $1,499 | 2 (2.7%) | 2 (11.8%) |
| $1,500 to $1,999 | 0 (0.0%) | 0 (0.0%) |
| $2,000 to $2,499 | 0 (0.0%) | 0 (0.0%) |
| $2,500 to $2,999 | 0 (0.0%) | 0 (0.0%) |
| $3,000 or more | 0 (0.0%) | 0 (0.0%) |
| Total | 73 (100.0%) | 17 (100.0%) |
Physical Housing Characteristics in Chefornak
Housing Structures in Chefornak
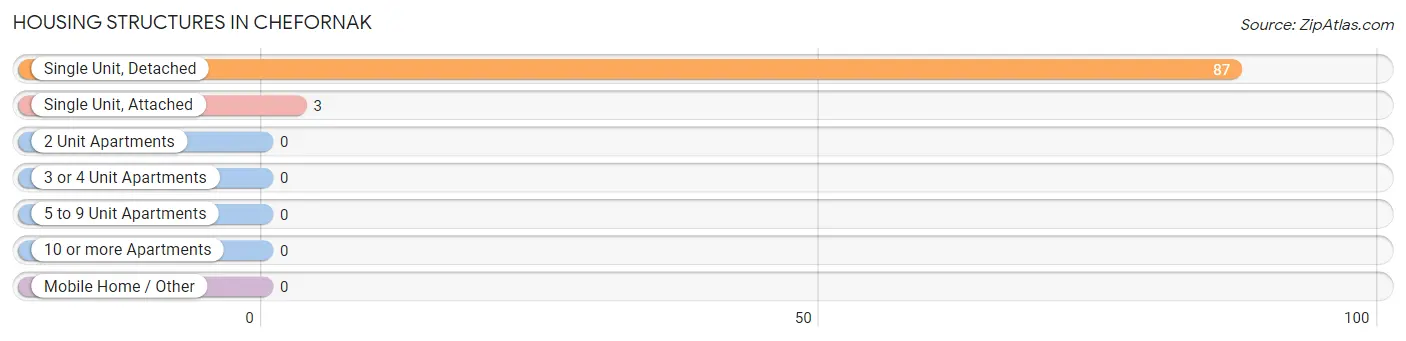
| Structure Type | # Housing Units | % Housing Units |
| Single Unit, Detached | 87 | 96.7% |
| Single Unit, Attached | 3 | 3.3% |
| 2 Unit Apartments | 0 | 0.0% |
| 3 or 4 Unit Apartments | 0 | 0.0% |
| 5 to 9 Unit Apartments | 0 | 0.0% |
| 10 or more Apartments | 0 | 0.0% |
| Mobile Home / Other | 0 | 0.0% |
| Total | 90 | 100.0% |
Housing Structures by Occupancy in Chefornak
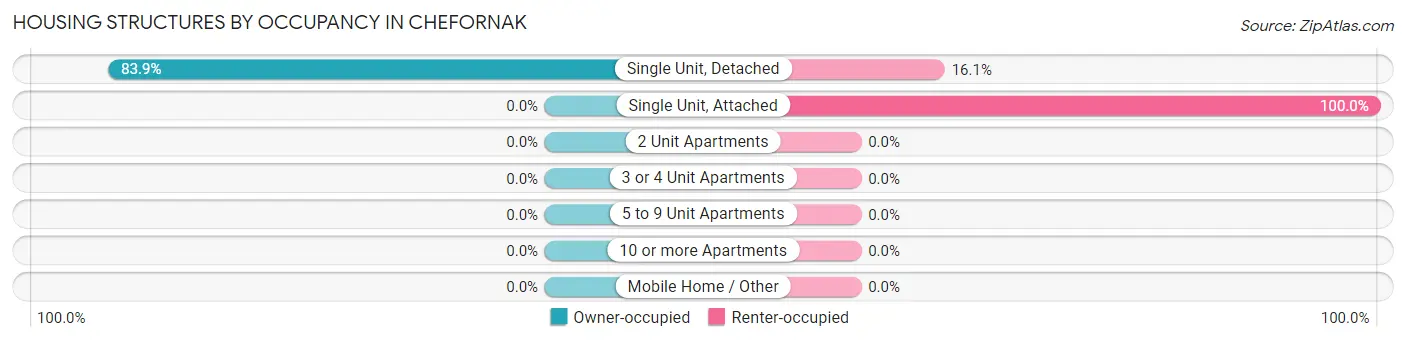
| Structure Type | Owner-occupied | Renter-occupied |
| Single Unit, Detached | 73 (83.9%) | 14 (16.1%) |
| Single Unit, Attached | 0 (0.0%) | 3 (100.0%) |
| 2 Unit Apartments | 0 (0.0%) | 0 (0.0%) |
| 3 or 4 Unit Apartments | 0 (0.0%) | 0 (0.0%) |
| 5 to 9 Unit Apartments | 0 (0.0%) | 0 (0.0%) |
| 10 or more Apartments | 0 (0.0%) | 0 (0.0%) |
| Mobile Home / Other | 0 (0.0%) | 0 (0.0%) |
| Total | 73 (81.1%) | 17 (18.9%) |
Housing Structures by Number of Rooms in Chefornak
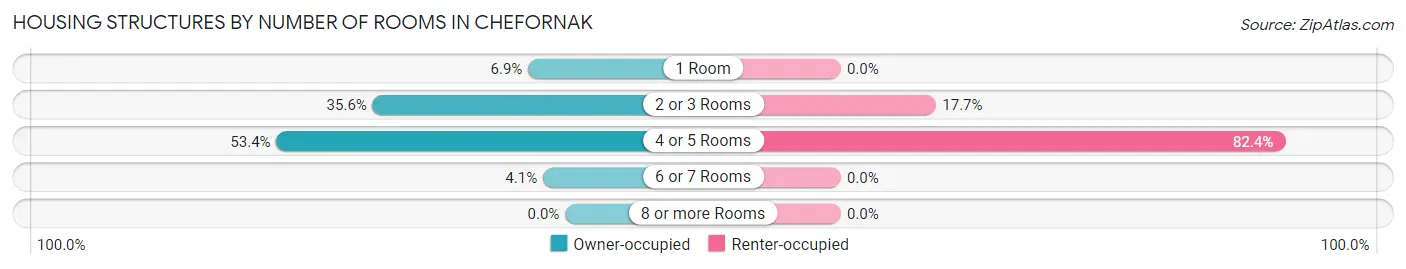
| Number of Rooms | Owner-occupied | Renter-occupied |
| 1 Room | 5 (6.9%) | 0 (0.0%) |
| 2 or 3 Rooms | 26 (35.6%) | 3 (17.6%) |
| 4 or 5 Rooms | 39 (53.4%) | 14 (82.4%) |
| 6 or 7 Rooms | 3 (4.1%) | 0 (0.0%) |
| 8 or more Rooms | 0 (0.0%) | 0 (0.0%) |
| Total | 73 (100.0%) | 17 (100.0%) |
Housing Structure by Heating Type in Chefornak
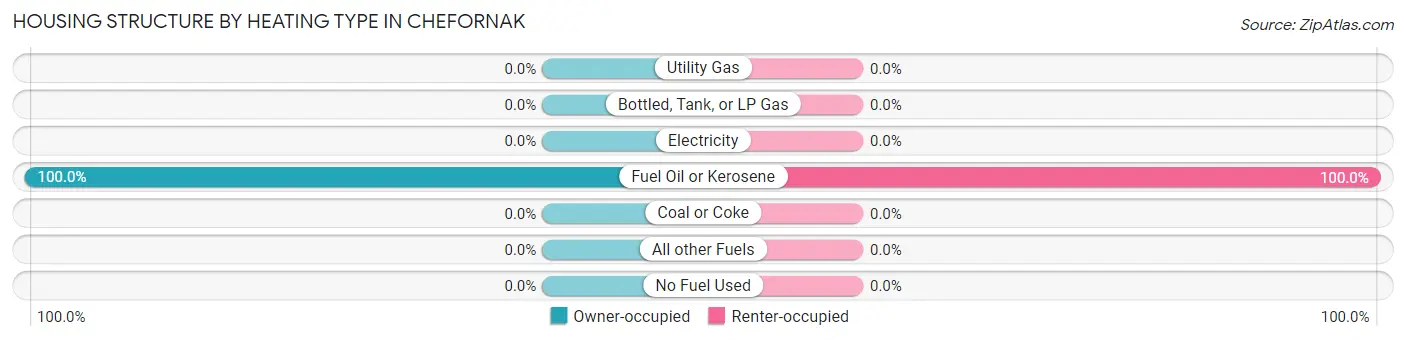
| Heating Type | Owner-occupied | Renter-occupied |
| Utility Gas | 0 (0.0%) | 0 (0.0%) |
| Bottled, Tank, or LP Gas | 0 (0.0%) | 0 (0.0%) |
| Electricity | 0 (0.0%) | 0 (0.0%) |
| Fuel Oil or Kerosene | 73 (100.0%) | 17 (100.0%) |
| Coal or Coke | 0 (0.0%) | 0 (0.0%) |
| All other Fuels | 0 (0.0%) | 0 (0.0%) |
| No Fuel Used | 0 (0.0%) | 0 (0.0%) |
| Total | 73 (100.0%) | 17 (100.0%) |
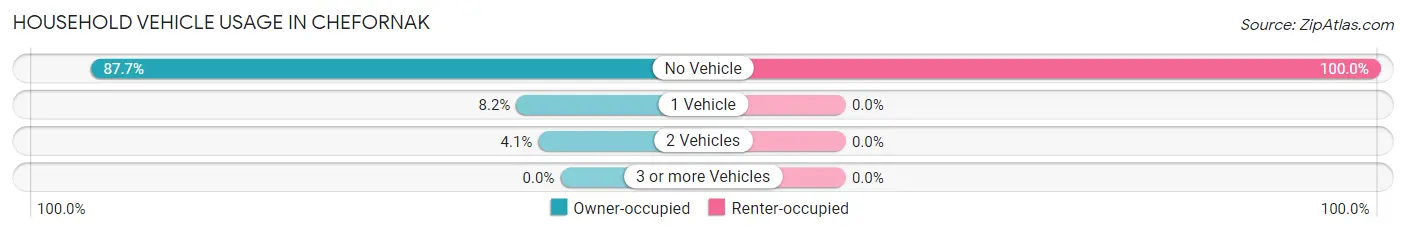
Household Vehicle Usage in Chefornak
| Vehicles per Household | Owner-occupied | Renter-occupied |
| No Vehicle | 64 (87.7%) | 17 (100.0%) |
| 1 Vehicle | 6 (8.2%) | 0 (0.0%) |
| 2 Vehicles | 3 (4.1%) | 0 (0.0%) |
| 3 or more Vehicles | 0 (0.0%) | 0 (0.0%) |
| Total | 73 (100.0%) | 17 (100.0%) |
Real Estate & Mortgages in Chefornak
Real Estate and Mortgage Overview in Chefornak
| Characteristic | Without Mortgage | With Mortgage |
| Housing Units | 73 | 0 |
| Median Property Value | - | - |
| Median Household Income | $44,250 | $0 |
| Monthly Housing Costs | $407 | $0 |
| Real Estate Taxes | - | - |
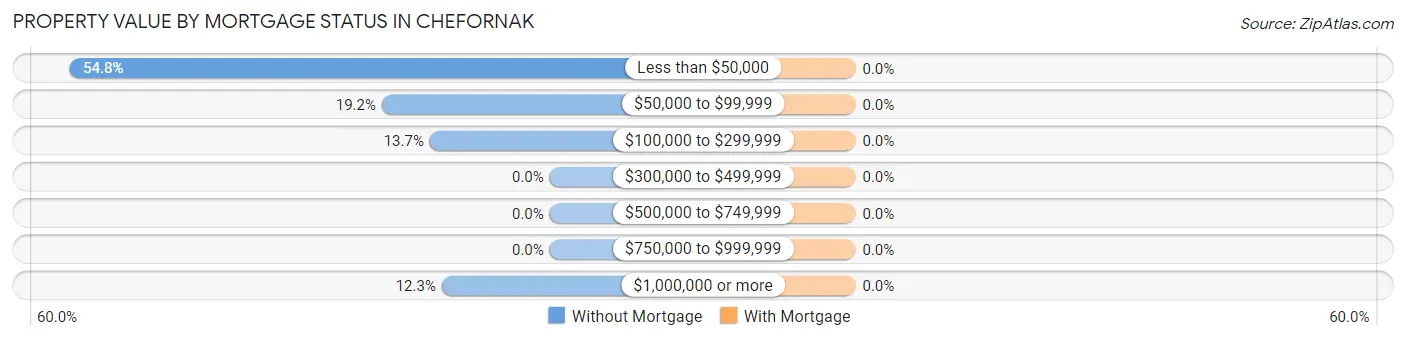
Property Value by Mortgage Status in Chefornak
| Property Value | Without Mortgage | With Mortgage |
| Less than $50,000 | 40 (54.8%) | 0 (0.0%) |
| $50,000 to $99,999 | 14 (19.2%) | 0 (0.0%) |
| $100,000 to $299,999 | 10 (13.7%) | 0 (0.0%) |
| $300,000 to $499,999 | 0 (0.0%) | 0 (0.0%) |
| $500,000 to $749,999 | 0 (0.0%) | 0 (0.0%) |
| $750,000 to $999,999 | 0 (0.0%) | 0 (0.0%) |
| $1,000,000 or more | 9 (12.3%) | 0 (0.0%) |
| Total | 73 (100.0%) | 0 (0.0%) |
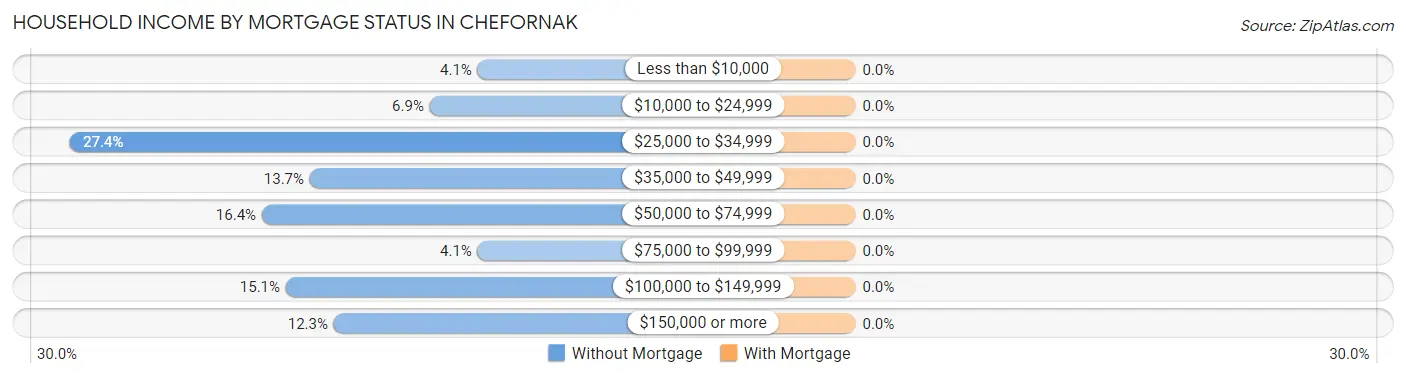
Household Income by Mortgage Status in Chefornak
| Household Income | Without Mortgage | With Mortgage |
| Less than $10,000 | 3 (4.1%) | 0 (0.0%) |
| $10,000 to $24,999 | 5 (6.9%) | 0 (0.0%) |
| $25,000 to $34,999 | 20 (27.4%) | 0 (0.0%) |
| $35,000 to $49,999 | 10 (13.7%) | 0 (0.0%) |
| $50,000 to $74,999 | 12 (16.4%) | 0 (0.0%) |
| $75,000 to $99,999 | 3 (4.1%) | 0 (0.0%) |
| $100,000 to $149,999 | 11 (15.1%) | 0 (0.0%) |
| $150,000 or more | 9 (12.3%) | 0 (0.0%) |
| Total | 73 (100.0%) | 0 (0.0%) |
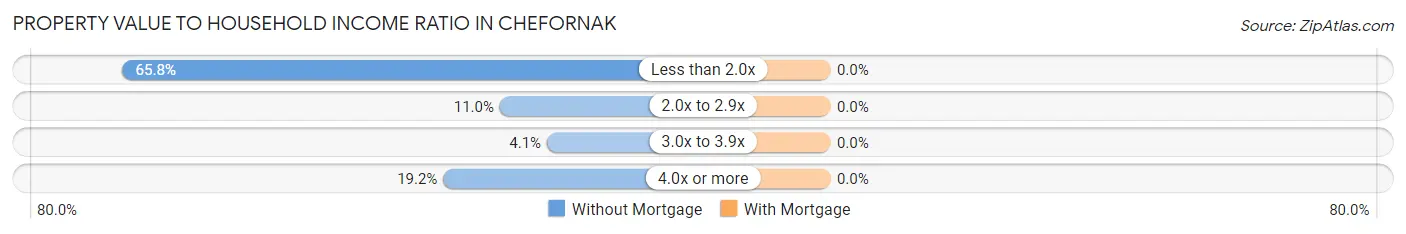
Property Value to Household Income Ratio in Chefornak
| Value-to-Income Ratio | Without Mortgage | With Mortgage |
| Less than 2.0x | 48 (65.7%) | 0 (0.0%) |
| 2.0x to 2.9x | 8 (11.0%) | 0 (0.0%) |
| 3.0x to 3.9x | 3 (4.1%) | 0 (0.0%) |
| 4.0x or more | 14 (19.2%) | 0 (0.0%) |
| Total | 73 (100.0%) | 0 (0.0%) |
Real Estate Taxes by Mortgage Status in Chefornak
| Property Taxes | Without Mortgage | With Mortgage |
| Less than $800 | 0 (0.0%) | 0 (0.0%) |
| $800 to $1,499 | 0 (0.0%) | 0 (0.0%) |
| $800 to $1,499 | 0 (0.0%) | 0 (0.0%) |
| Total | 73 (100.0%) | 0 (0.0%) |
Health & Disability in Chefornak
Health Insurance Coverage by Age in Chefornak
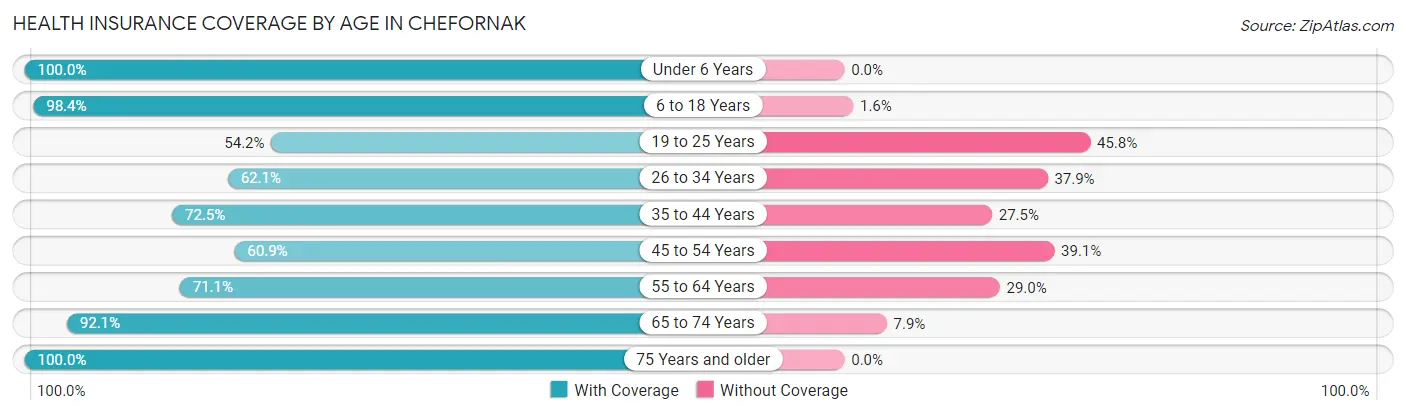
| Age Bracket | With Coverage | Without Coverage |
| Under 6 Years | 72 (100.0%) | 0 (0.0%) |
| 6 to 18 Years | 121 (98.4%) | 2 (1.6%) |
| 19 to 25 Years | 26 (54.2%) | 22 (45.8%) |
| 26 to 34 Years | 41 (62.1%) | 25 (37.9%) |
| 35 to 44 Years | 29 (72.5%) | 11 (27.5%) |
| 45 to 54 Years | 14 (60.9%) | 9 (39.1%) |
| 55 to 64 Years | 27 (71.1%) | 11 (28.9%) |
| 65 to 74 Years | 35 (92.1%) | 3 (7.9%) |
| 75 Years and older | 28 (100.0%) | 0 (0.0%) |
| Total | 393 (82.6%) | 83 (17.4%) |
Health Insurance Coverage by Citizenship Status in Chefornak
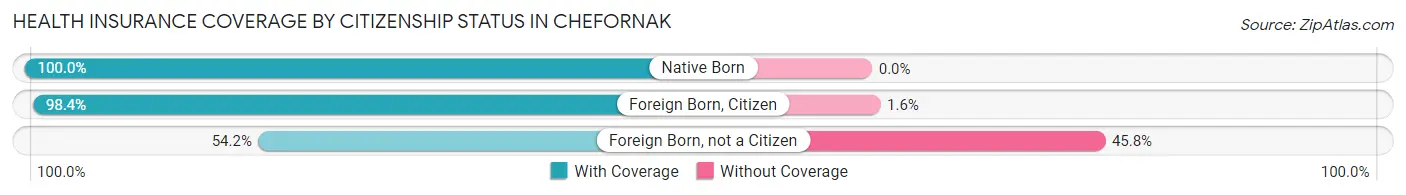
| Citizenship Status | With Coverage | Without Coverage |
| Native Born | 72 (100.0%) | 0 (0.0%) |
| Foreign Born, Citizen | 121 (98.4%) | 2 (1.6%) |
| Foreign Born, not a Citizen | 26 (54.2%) | 22 (45.8%) |
Health Insurance Coverage by Household Income in Chefornak
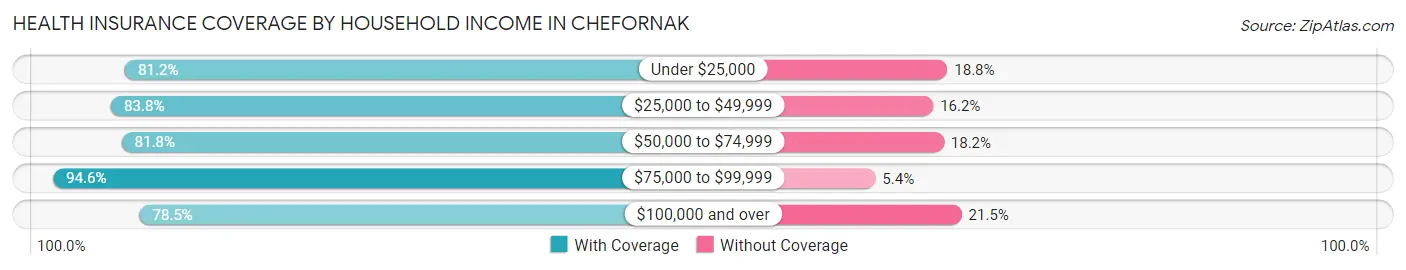
| Household Income | With Coverage | Without Coverage |
| Under $25,000 | 56 (81.2%) | 13 (18.8%) |
| $25,000 to $49,999 | 88 (83.8%) | 17 (16.2%) |
| $50,000 to $74,999 | 72 (81.8%) | 16 (18.2%) |
| $75,000 to $99,999 | 53 (94.6%) | 3 (5.4%) |
| $100,000 and over | 124 (78.5%) | 34 (21.5%) |
Public vs Private Health Insurance Coverage by Age in Chefornak
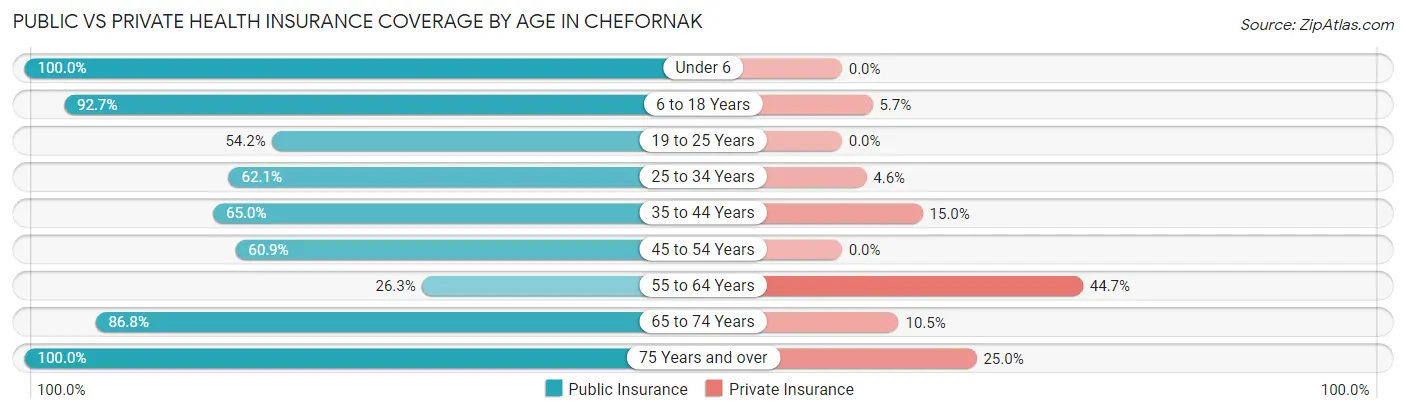
| Age Bracket | Public Insurance | Private Insurance |
| Under 6 | 72 (100.0%) | 0 (0.0%) |
| 6 to 18 Years | 114 (92.7%) | 7 (5.7%) |
| 19 to 25 Years | 26 (54.2%) | 0 (0.0%) |
| 25 to 34 Years | 41 (62.1%) | 3 (4.5%) |
| 35 to 44 Years | 26 (65.0%) | 6 (15.0%) |
| 45 to 54 Years | 14 (60.9%) | 0 (0.0%) |
| 55 to 64 Years | 10 (26.3%) | 17 (44.7%) |
| 65 to 74 Years | 33 (86.8%) | 4 (10.5%) |
| 75 Years and over | 28 (100.0%) | 7 (25.0%) |
| Total | 364 (76.5%) | 44 (9.2%) |
Disability Status by Sex by Age in Chefornak
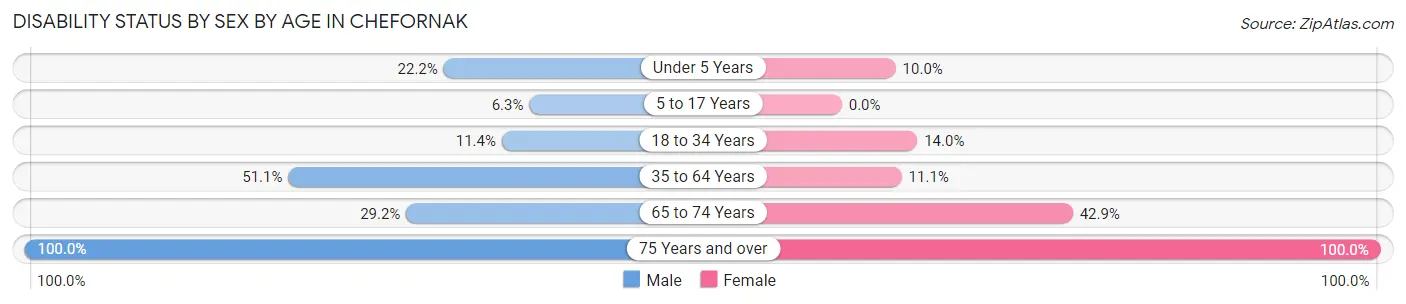
| Age Bracket | Male | Female |
| Under 5 Years | 6 (22.2%) | 3 (10.0%) |
| 5 to 17 Years | 6 (6.3%) | 0 (0.0%) |
| 18 to 34 Years | 8 (11.4%) | 7 (14.0%) |
| 35 to 64 Years | 24 (51.1%) | 6 (11.1%) |
| 65 to 74 Years | 7 (29.2%) | 6 (42.9%) |
| 75 Years and over | 9 (100.0%) | 19 (100.0%) |
Disability Class by Sex by Age in Chefornak
Disability Class: Hearing Difficulty
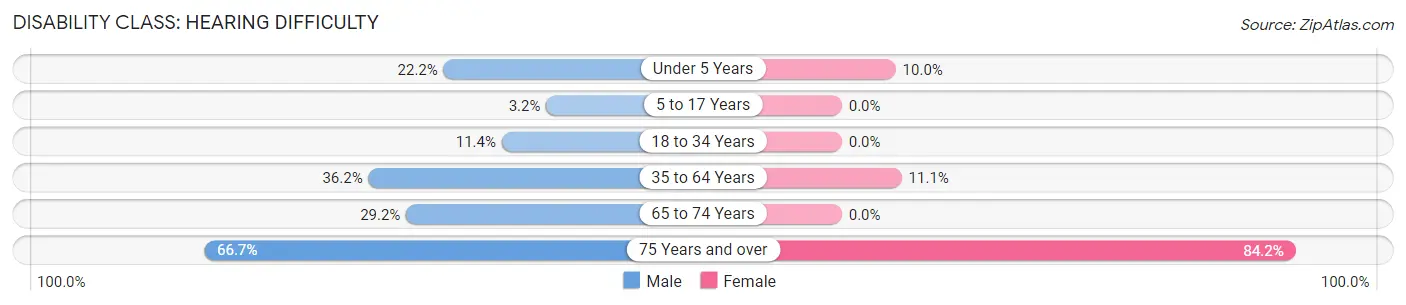
| Age Bracket | Male | Female |
| Under 5 Years | 6 (22.2%) | 3 (10.0%) |
| 5 to 17 Years | 3 (3.2%) | 0 (0.0%) |
| 18 to 34 Years | 8 (11.4%) | 0 (0.0%) |
| 35 to 64 Years | 17 (36.2%) | 6 (11.1%) |
| 65 to 74 Years | 7 (29.2%) | 0 (0.0%) |
| 75 Years and over | 6 (66.7%) | 16 (84.2%) |
Disability Class: Vision Difficulty
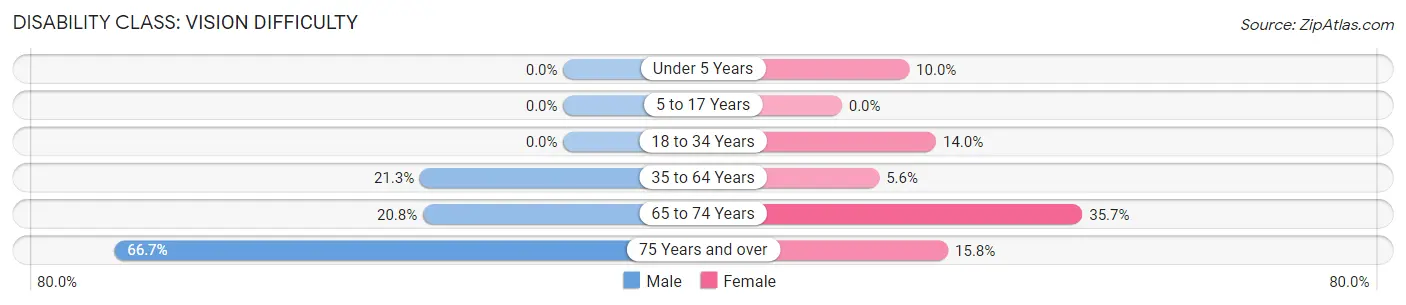
| Age Bracket | Male | Female |
| Under 5 Years | 0 (0.0%) | 3 (10.0%) |
| 5 to 17 Years | 0 (0.0%) | 0 (0.0%) |
| 18 to 34 Years | 0 (0.0%) | 7 (14.0%) |
| 35 to 64 Years | 10 (21.3%) | 3 (5.6%) |
| 65 to 74 Years | 5 (20.8%) | 5 (35.7%) |
| 75 Years and over | 6 (66.7%) | 3 (15.8%) |
Disability Class: Cognitive Difficulty
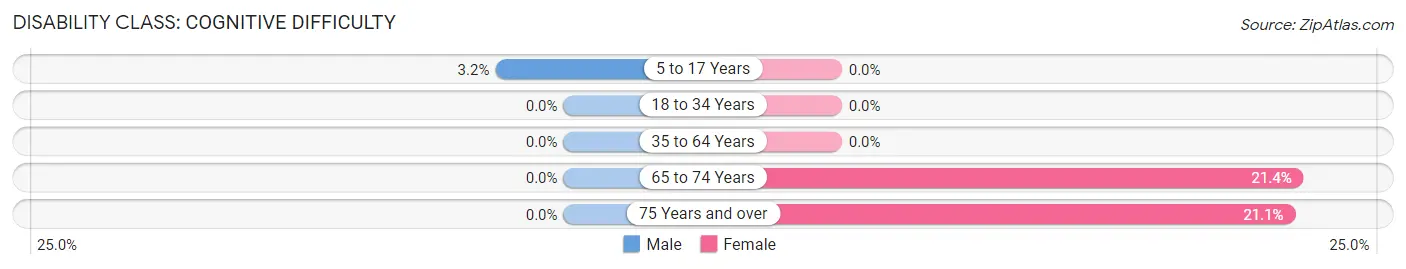
| Age Bracket | Male | Female |
| 5 to 17 Years | 3 (3.2%) | 0 (0.0%) |
| 18 to 34 Years | 0 (0.0%) | 0 (0.0%) |
| 35 to 64 Years | 0 (0.0%) | 0 (0.0%) |
| 65 to 74 Years | 0 (0.0%) | 3 (21.4%) |
| 75 Years and over | 0 (0.0%) | 4 (21.0%) |
Disability Class: Ambulatory Difficulty
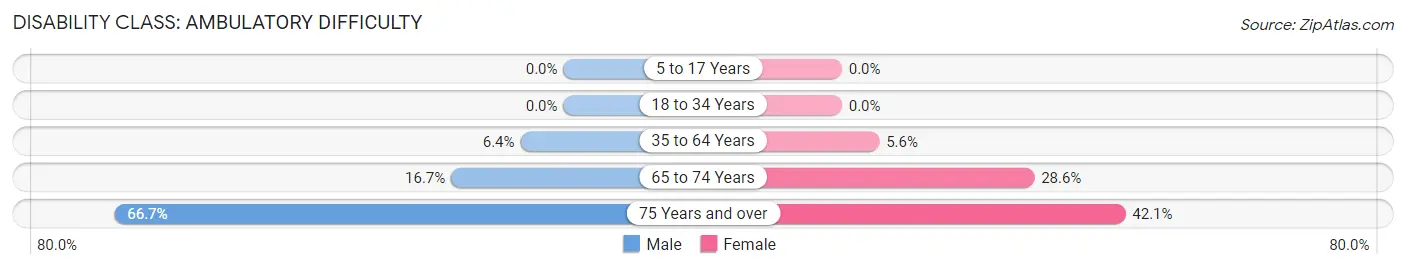
| Age Bracket | Male | Female |
| 5 to 17 Years | 0 (0.0%) | 0 (0.0%) |
| 18 to 34 Years | 0 (0.0%) | 0 (0.0%) |
| 35 to 64 Years | 3 (6.4%) | 3 (5.6%) |
| 65 to 74 Years | 4 (16.7%) | 4 (28.6%) |
| 75 Years and over | 6 (66.7%) | 8 (42.1%) |
Disability Class: Self-Care Difficulty
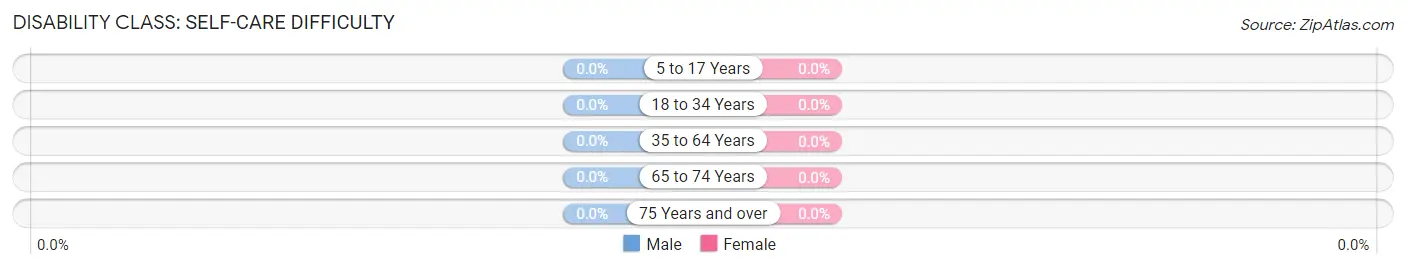
| Age Bracket | Male | Female |
| 5 to 17 Years | 0 (0.0%) | 0 (0.0%) |
| 18 to 34 Years | 0 (0.0%) | 0 (0.0%) |
| 35 to 64 Years | 0 (0.0%) | 0 (0.0%) |
| 65 to 74 Years | 0 (0.0%) | 0 (0.0%) |
| 75 Years and over | 0 (0.0%) | 0 (0.0%) |
Technology Access in Chefornak
Computing Device Access in Chefornak
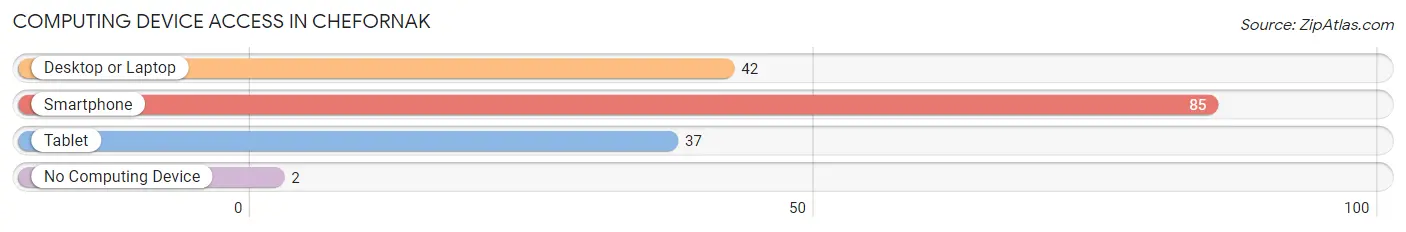
| Device Type | # Households | % Households |
| Desktop or Laptop | 42 | 46.7% |
| Smartphone | 85 | 94.4% |
| Tablet | 37 | 41.1% |
| No Computing Device | 2 | 2.2% |
| Total | 90 | 100.0% |
Internet Access in Chefornak
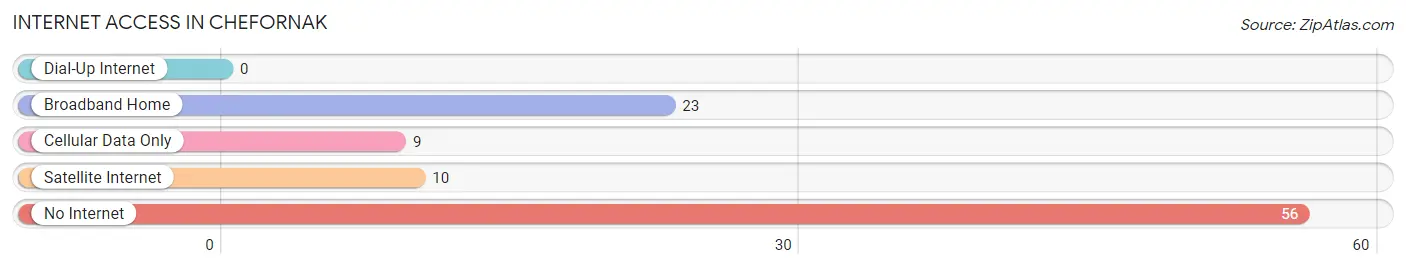
| Internet Type | # Households | % Households |
| Dial-Up Internet | 0 | 0.0% |
| Broadband Home | 23 | 25.6% |
| Cellular Data Only | 9 | 10.0% |
| Satellite Internet | 10 | 11.1% |
| No Internet | 56 | 62.2% |
| Total | 90 | 100.0% |
Chefornak Summary
Chefornak is a small village located in the western region of Alaska, United States. It is situated on the banks of the Kuskokwim River, about 40 miles east of Bethel. The village is home to the Yup’ik Eskimos, who have lived in the area for centuries.
History
Chefornak has a long and rich history. The Yup’ik Eskimos have lived in the area for centuries, and the village was first established in the late 1800s. The village was originally known as “Ch’aluk”, which means “place of the river” in Yup’ik. The village was later renamed “Chefornak”, which means “place of the fish” in Yup’ik.
The village was originally a trading post for the Yup’ik Eskimos, and it was also a popular fishing spot. In the early 1900s, the village was home to a salmon cannery, which provided employment for many of the villagers.
Geography
Chefornak is located in the western region of Alaska, about 40 miles east of Bethel. The village is situated on the banks of the Kuskokwim River, and it is surrounded by the Kuskokwim Mountains. The village is located in a tundra climate, with cold winters and mild summers.
The village is home to a variety of wildlife, including moose, caribou, and bears. The Kuskokwim River is also home to a variety of fish, including salmon, whitefish, and grayling.
Economy
The economy of Chefornak is largely based on subsistence fishing and hunting. The village is home to a salmon cannery, which provides employment for many of the villagers. The village also has a small store, which sells basic supplies and groceries.
The village is also home to a small airport, which provides transportation to and from the village. The airport is also used for medical evacuations and other emergency services.
Demographics
As of the 2010 census, the population of Chefornak was 545. The majority of the population is Yup’ik Eskimos, and the village is home to a variety of other ethnic groups, including Aleut, Athabascan, and Inupiat. The village is also home to a small number of non-Native Americans.
The village is served by the Chefornak School, which provides education for students in grades K-12. The school is operated by the Lower Kuskokwim School District.
Conclusion
Chefornak is a small village located in the western region of Alaska, United States. It is home to the Yup’ik Eskimos, who have lived in the area for centuries. The village is situated on the banks of the Kuskokwim River, and it is surrounded by the Kuskokwim Mountains. The economy of Chefornak is largely based on subsistence fishing and hunting, and the village is home to a salmon cannery. As of the 2010 census, the population of Chefornak was 545. The majority of the population is Yup’ik Eskimos, and the village is served by the Chefornak School.
Common Questions
What is the Total Population of Chefornak?
Total Population of Chefornak is 476.
What is the Total Male Population of Chefornak?
Total Male Population of Chefornak is 272.
What is the Total Female Population of Chefornak?
Total Female Population of Chefornak is 204.
What is the Ratio of Males per 100 Females in Chefornak?
There are 133.33 Males per 100 Females in Chefornak.
What is the Ratio of Females per 100 Males in Chefornak?
There are 75.00 Females per 100 Males in Chefornak.
What is the Median Population Age in Chefornak?
Median Population Age in Chefornak is 25.2 Years.
What is the Average Family Size in Chefornak
Average Family Size in Chefornak is 5.3 People.
What is the Average Household Size in Chefornak
Average Household Size in Chefornak is 5.3 People.
What is Per Capita Income in Chefornak?
Per Capita income in Chefornak is $12,776.
What is the Median Family Income in Chefornak?
Median Family Income in Chefornak is $50,750.
What is the Median Household income in Chefornak?
Median Household Income in Chefornak is $47,500.
What is Income or Wage Gap in Chefornak?
Income or Wage Gap in Chefornak is 1.4%.
Women in Chefornak earn 98.6 cents for every dollar earned by a man.
What is Family Income Deficit in Chefornak?
Family Income Deficit in Chefornak is $15,022.
Families that are below poverty line in Chefornak earn $15,022 less on average than the poverty threshold level.
What is Inequality or Gini Index in Chefornak?
Inequality or Gini Index in Chefornak is 0.41.
How Large is the Labor Force in Chefornak?
There are 162 People in the Labor Forcein in Chefornak.
What is the Percentage of People in the Labor Force in Chefornak?
53.6% of People are in the Labor Force in Chefornak.
What is the Unemployment Rate in Chefornak?
Unemployment Rate in Chefornak is 27.8%.