Yukon-Koyukuk Census Area, AK
Yukon-Koyukuk Census Area Map
Yukon-Koyukuk Census Area Overview
5,355
TOTAL POPULATION
2,841
MALE POPULATION
2,514
FEMALE POPULATION
113.01
MALES / 100 FEMALES
88.49
FEMALES / 100 MALES
35.8
MEDIAN AGE
3.2
AVG FAMILY SIZE
2.4
AVG HOUSEHOLD SIZE
$29,382
PER CAPITA INCOME
$59,458
AVG FAMILY INCOME
$47,826
AVG HOUSEHOLD INCOME
17.0%
WAGE / INCOME GAP [ % ]
83.0¢/ $1
WAGE / INCOME GAP [ $ ]
$9,661
FAMILY INCOME DEFICIT
0.46
INEQUALITY / GINI INDEX
2,670
LABOR FORCE [ PEOPLE ]
65.9%
PERCENT IN LABOR FORCE
11.1%
UNEMPLOYMENT RATE
Yukon-Koyukuk Census Area Area Codes
Race in Yukon-Koyukuk Census Area
The most populous races in Yukon-Koyukuk Census Area are Native / Alaskan (3,610 | 67.4%), White / Caucasian (1,239 | 23.1%), and Two or more Races (396 | 7.4%).
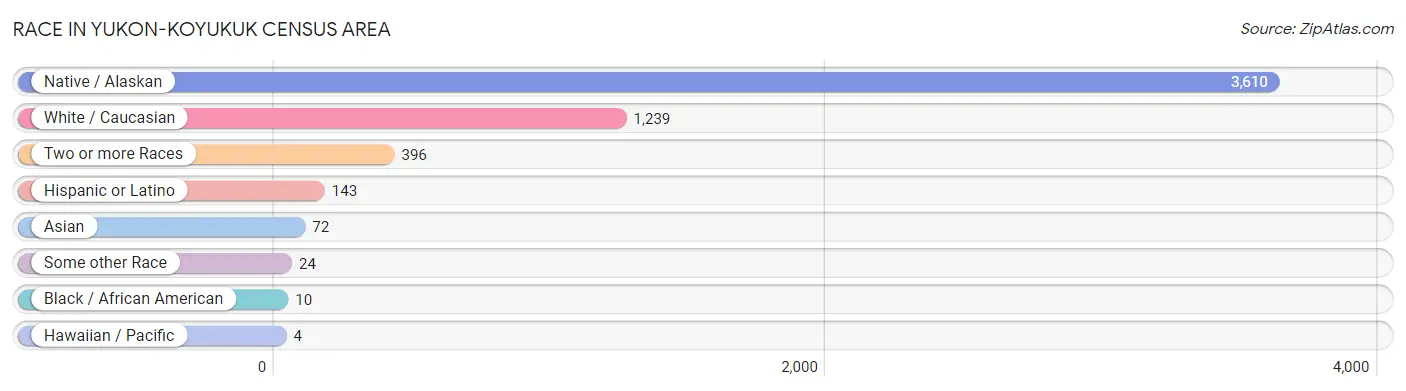
| Race | # Population | % Population |
| Asian | 72 | 1.3% |
| Black / African American | 10 | 0.2% |
| Hawaiian / Pacific | 4 | 0.1% |
| Hispanic or Latino | 143 | 2.7% |
| Native / Alaskan | 3,610 | 67.4% |
| White / Caucasian | 1,239 | 23.1% |
| Two or more Races | 396 | 7.4% |
| Some other Race | 24 | 0.4% |
| Total | 5,355 | 100.0% |
Ancestry in Yukon-Koyukuk Census Area
The most populous ancestries reported in Yukon-Koyukuk Census Area are Alaskan Athabascan (3,384 | 63.2%), German (500 | 9.3%), Alaska Native (173 | 3.2%), Inupiat (171 | 3.2%), and Irish (157 | 2.9%), together accounting for 81.9% of all Yukon-Koyukuk Census Area residents.
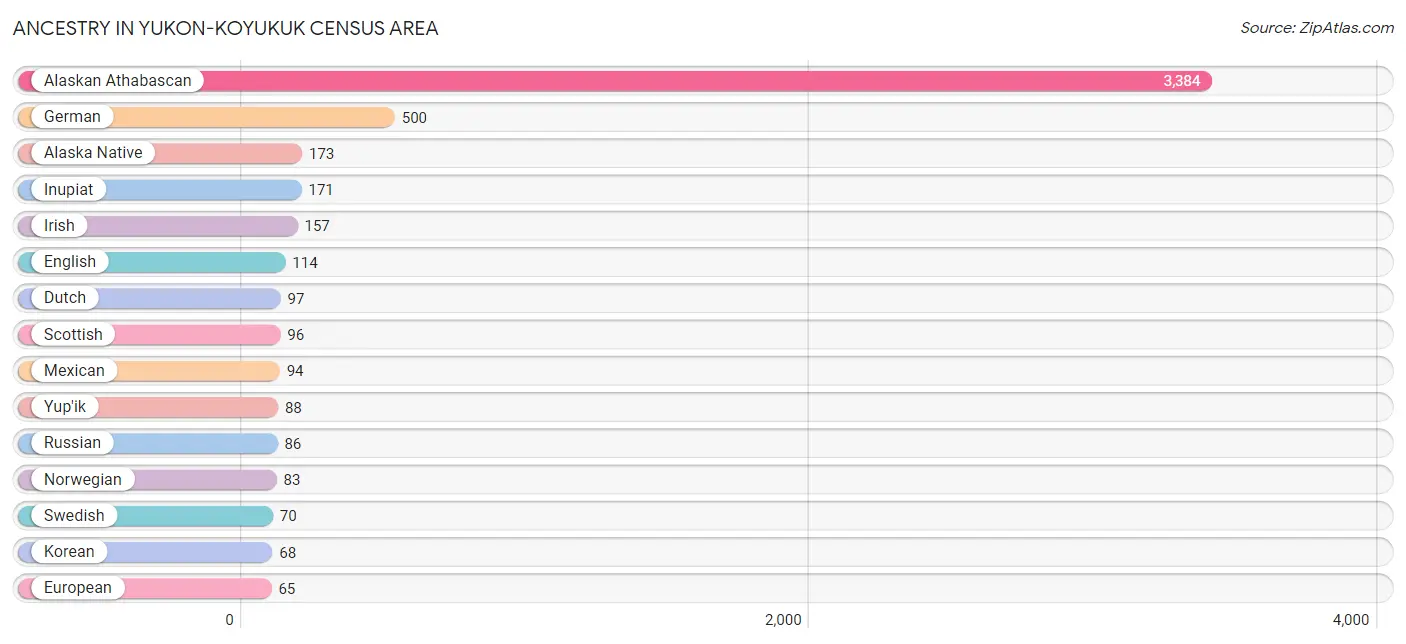
| Ancestry | # Population | % Population |
| African | 12 | 0.2% |
| Alaska Native | 173 | 3.2% |
| Alaskan Athabascan | 3,384 | 63.2% |
| Aleut | 19 | 0.4% |
| American | 31 | 0.6% |
| Apache | 3 | 0.1% |
| Austrian | 1 | 0.0% |
| Bhutanese | 4 | 0.1% |
| Blackfeet | 8 | 0.2% |
| British | 16 | 0.3% |
| Cajun | 1 | 0.0% |
| Canadian | 20 | 0.4% |
| Central American Indian | 1 | 0.0% |
| Cherokee | 15 | 0.3% |
| Chickasaw | 20 | 0.4% |
| Chippewa | 29 | 0.5% |
| Croatian | 2 | 0.0% |
| Czech | 12 | 0.2% |
| Danish | 33 | 0.6% |
| Dutch | 97 | 1.8% |
| Ecuadorian | 13 | 0.2% |
| English | 114 | 2.1% |
| European | 65 | 1.2% |
| Finnish | 25 | 0.5% |
| French | 58 | 1.1% |
| French American Indian | 6 | 0.1% |
| French Canadian | 24 | 0.4% |
| German | 500 | 9.3% |
| Hungarian | 8 | 0.2% |
| Indian (Asian) | 11 | 0.2% |
| Inupiat | 171 | 3.2% |
| Irish | 157 | 2.9% |
| Italian | 13 | 0.2% |
| Kiowa | 3 | 0.1% |
| Korean | 68 | 1.3% |
| Lithuanian | 7 | 0.1% |
| Luxembourger | 4 | 0.1% |
| Mexican | 94 | 1.8% |
| Northern European | 1 | 0.0% |
| Norwegian | 83 | 1.5% |
| Polish | 7 | 0.1% |
| Pueblo | 16 | 0.3% |
| Puerto Rican | 19 | 0.4% |
| Romanian | 6 | 0.1% |
| Russian | 86 | 1.6% |
| Samoan | 2 | 0.0% |
| Scandinavian | 2 | 0.0% |
| Scotch-Irish | 15 | 0.3% |
| Scottish | 96 | 1.8% |
| Shoshone | 32 | 0.6% |
| Sioux | 4 | 0.1% |
| Slovene | 1 | 0.0% |
| South American | 13 | 0.2% |
| South American Indian | 4 | 0.1% |
| Spaniard | 8 | 0.2% |
| Subsaharan African | 12 | 0.2% |
| Swedish | 70 | 1.3% |
| Swiss | 24 | 0.4% |
| Tlingit-Haida | 12 | 0.2% |
| Tongan | 5 | 0.1% |
| Ukrainian | 2 | 0.0% |
| Welsh | 14 | 0.3% |
| Yup'ik | 88 | 1.6% | View All 63 Rows |
Immigrants in Yukon-Koyukuk Census Area
The most numerous immigrant groups reported in Yukon-Koyukuk Census Area came from Asia (62 | 1.2%), Philippines (62 | 1.2%), South Eastern Asia (62 | 1.2%), Canada (24 | 0.4%), and Ecuador (13 | 0.2%), together accounting for 4.2% of all Yukon-Koyukuk Census Area residents.
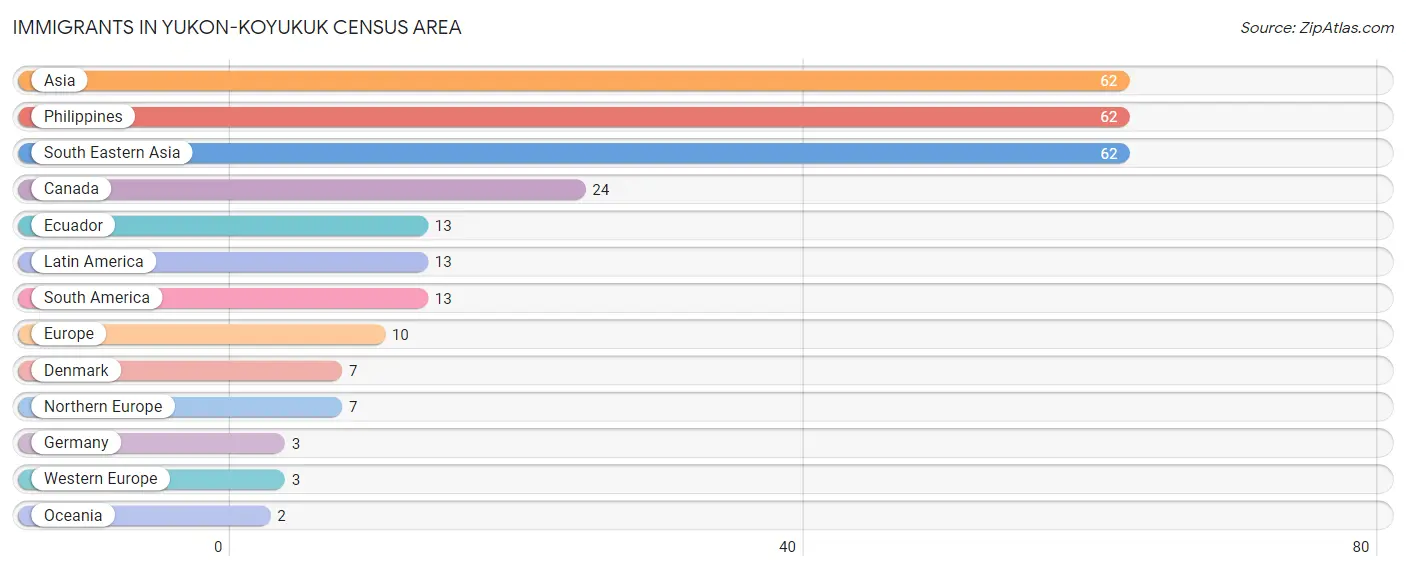
| Immigration Origin | # Population | % Population |
| Asia | 62 | 1.2% |
| Canada | 24 | 0.4% |
| Denmark | 7 | 0.1% |
| Ecuador | 13 | 0.2% |
| Europe | 10 | 0.2% |
| Germany | 3 | 0.1% |
| Latin America | 13 | 0.2% |
| Northern Europe | 7 | 0.1% |
| Oceania | 2 | 0.0% |
| Philippines | 62 | 1.2% |
| South America | 13 | 0.2% |
| South Eastern Asia | 62 | 1.2% |
| Western Europe | 3 | 0.1% | View All 13 Rows |
Sex and Age in Yukon-Koyukuk Census Area
Sex and Age in Yukon-Koyukuk Census Area
The most populous age groups in Yukon-Koyukuk Census Area are 5 to 9 Years (239 | 8.4%) for men and 5 to 9 Years (228 | 9.1%) for women.
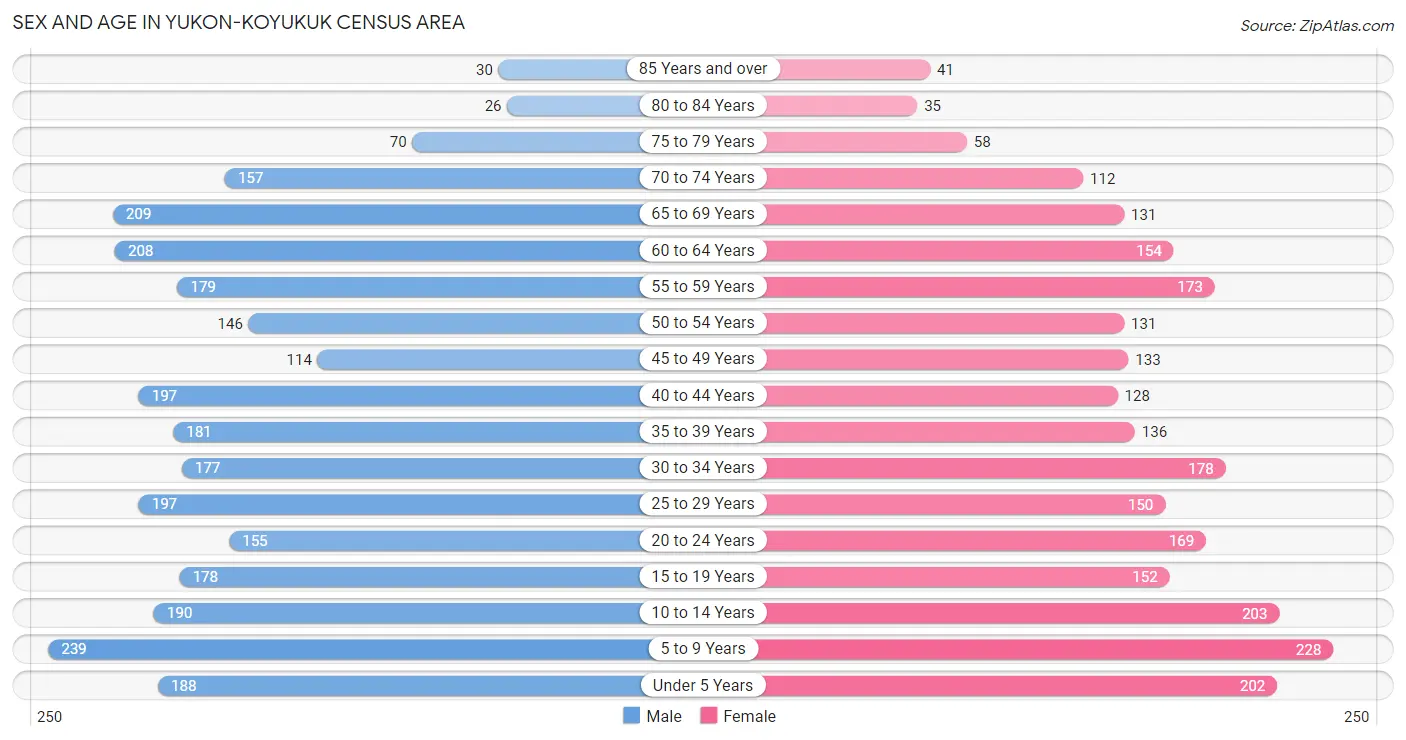
| Age Bracket | Male | Female |
| Under 5 Years | 188 (6.6%) | 202 (8.0%) |
| 5 to 9 Years | 239 (8.4%) | 228 (9.1%) |
| 10 to 14 Years | 190 (6.7%) | 203 (8.1%) |
| 15 to 19 Years | 178 (6.3%) | 152 (6.0%) |
| 20 to 24 Years | 155 (5.5%) | 169 (6.7%) |
| 25 to 29 Years | 197 (6.9%) | 150 (6.0%) |
| 30 to 34 Years | 177 (6.2%) | 178 (7.1%) |
| 35 to 39 Years | 181 (6.4%) | 136 (5.4%) |
| 40 to 44 Years | 197 (6.9%) | 128 (5.1%) |
| 45 to 49 Years | 114 (4.0%) | 133 (5.3%) |
| 50 to 54 Years | 146 (5.1%) | 131 (5.2%) |
| 55 to 59 Years | 179 (6.3%) | 173 (6.9%) |
| 60 to 64 Years | 208 (7.3%) | 154 (6.1%) |
| 65 to 69 Years | 209 (7.4%) | 131 (5.2%) |
| 70 to 74 Years | 157 (5.5%) | 112 (4.5%) |
| 75 to 79 Years | 70 (2.5%) | 58 (2.3%) |
| 80 to 84 Years | 26 (0.9%) | 35 (1.4%) |
| 85 Years and over | 30 (1.1%) | 41 (1.6%) |
| Total | 2,841 (100.0%) | 2,514 (100.0%) |
Families and Households in Yukon-Koyukuk Census Area
Median Family Size in Yukon-Koyukuk Census Area
The median family size in Yukon-Koyukuk Census Area is 3.16 persons per family, with married-couple families (541 | 48.1%) accounting for the largest median family size of 3.29 persons per family. On the other hand, single male/father families (181 | 16.1%) represent the smallest median family size with 2.65 persons per family.
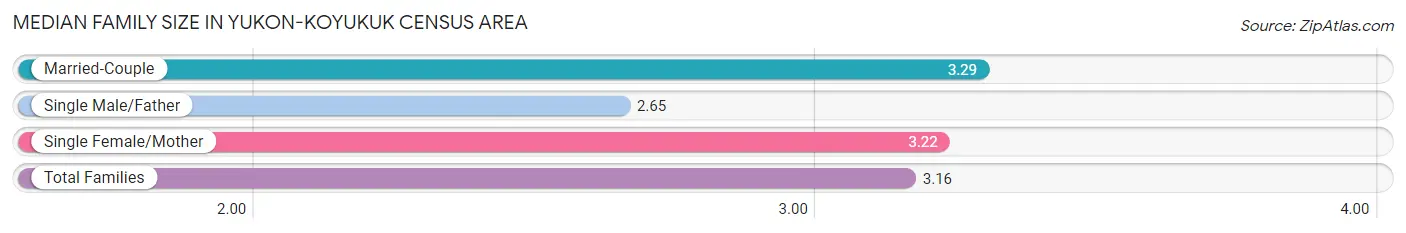
| Family Type | # Families | Family Size |
| Married-Couple | 541 (48.1%) | 3.29 |
| Single Male/Father | 181 (16.1%) | 2.65 |
| Single Female/Mother | 403 (35.8%) | 3.22 |
| Total Families | 1,125 (100.0%) | 3.16 |
Median Household Size in Yukon-Koyukuk Census Area
The median household size in Yukon-Koyukuk Census Area is 2.36 persons per household, with single female/mother households (403 | 19.4%) accounting for the largest median household size of 3.57 persons per household. non-family households (953 | 45.9%) represent the smallest median household size with 1.14 persons per household.
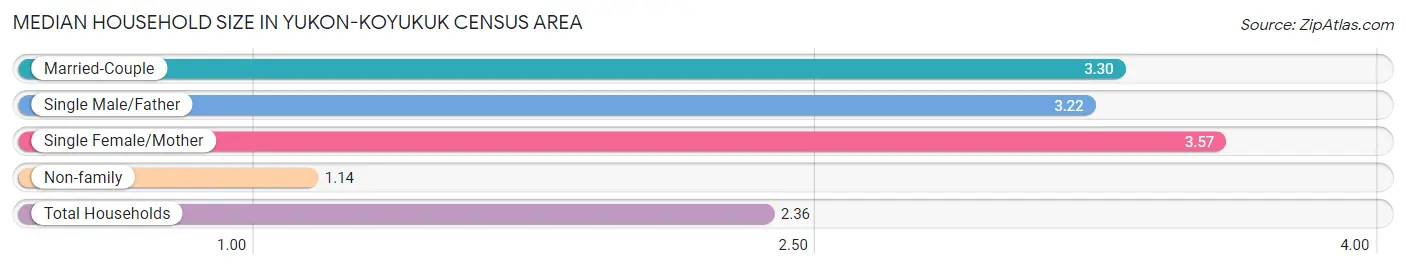
| Household Type | # Households | Household Size |
| Married-Couple | 541 (26.0%) | 3.30 |
| Single Male/Father | 181 (8.7%) | 3.22 |
| Single Female/Mother | 403 (19.4%) | 3.57 |
| Non-family | 953 (45.9%) | 1.14 |
| Total Households | 2,078 (100.0%) | 2.36 |
Household Size by Marriage Status in Yukon-Koyukuk Census Area
Out of a total of 2,078 households in Yukon-Koyukuk Census Area, 1,125 (54.1%) are family households, while 953 (45.9%) are nonfamily households. The most numerous type of family households are 2-person households, comprising 451, and the most common type of nonfamily households are 1-person households, comprising 807.
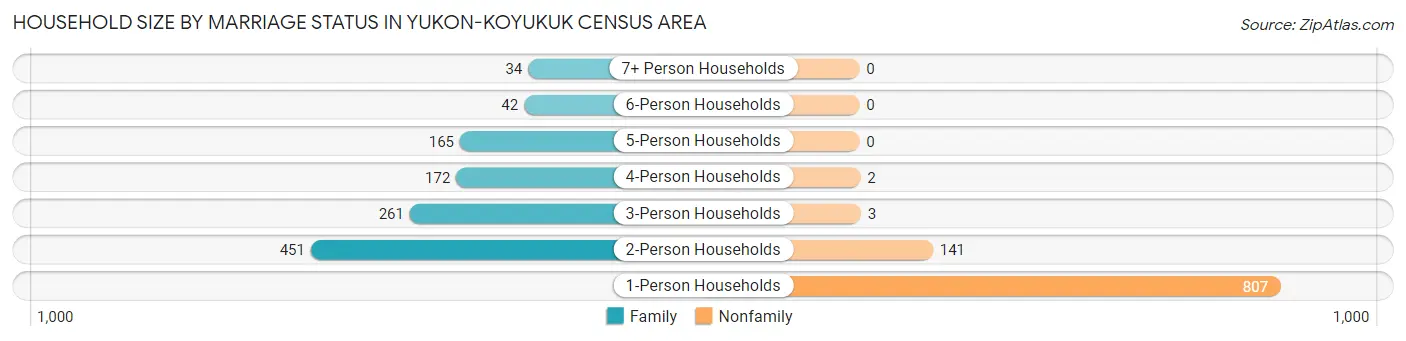
| Household Size | Family Households | Nonfamily Households |
| 1-Person Households | - | 807 (38.8%) |
| 2-Person Households | 451 (21.7%) | 141 (6.8%) |
| 3-Person Households | 261 (12.6%) | 3 (0.1%) |
| 4-Person Households | 172 (8.3%) | 2 (0.1%) |
| 5-Person Households | 165 (7.9%) | 0 (0.0%) |
| 6-Person Households | 42 (2.0%) | 0 (0.0%) |
| 7+ Person Households | 34 (1.6%) | 0 (0.0%) |
| Total | 1,125 (54.1%) | 953 (45.9%) |
Female Fertility in Yukon-Koyukuk Census Area
Fertility by Age in Yukon-Koyukuk Census Area
Average fertility rate in Yukon-Koyukuk Census Area is 78.0 births per 1,000 women. Women in the age bracket of 20 to 34 years have the highest fertility rate with 109.0 births per 1,000 women. Women in the age bracket of 20 to 34 years acount for 64.3% of all women with births.
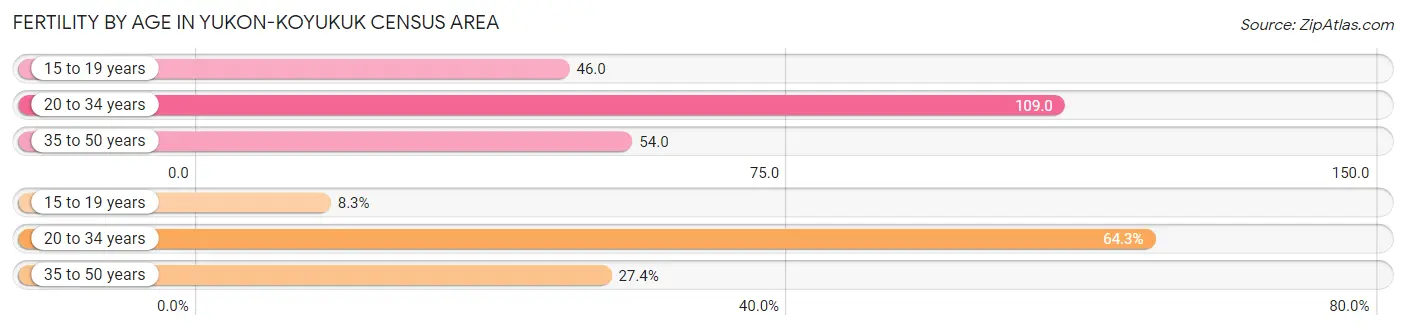
| Age Bracket | Women with Births | Births / 1,000 Women |
| 15 to 19 years | 7 (8.3%) | 46.0 |
| 20 to 34 years | 54 (64.3%) | 109.0 |
| 35 to 50 years | 23 (27.4%) | 54.0 |
| Total | 84 (100.0%) | 78.0 |
Fertility by Age by Marriage Status in Yukon-Koyukuk Census Area
17.9% of women with births (84) in Yukon-Koyukuk Census Area are married. The highest percentage of unmarried women with births falls into 15 to 19 years age bracket with 100.0% of them unmarried at the time of birth, while the lowest percentage of unmarried women with births belong to 20 to 34 years age bracket with 77.8% of them unmarried.
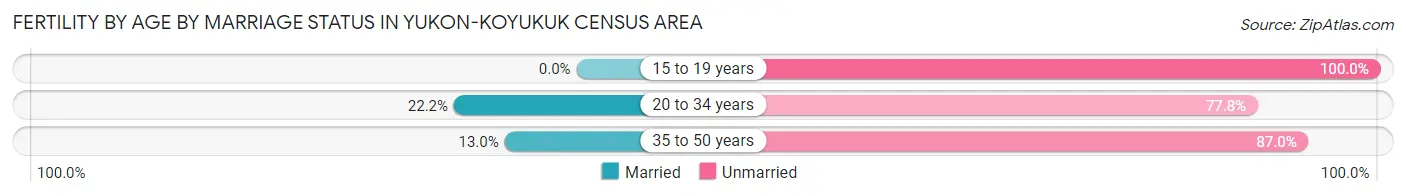
| Age Bracket | Married | Unmarried |
| 15 to 19 years | 0 (0.0%) | 7 (100.0%) |
| 20 to 34 years | 12 (22.2%) | 42 (77.8%) |
| 35 to 50 years | 3 (13.0%) | 20 (87.0%) |
| Total | 15 (17.9%) | 69 (82.1%) |
Fertility by Education in Yukon-Koyukuk Census Area
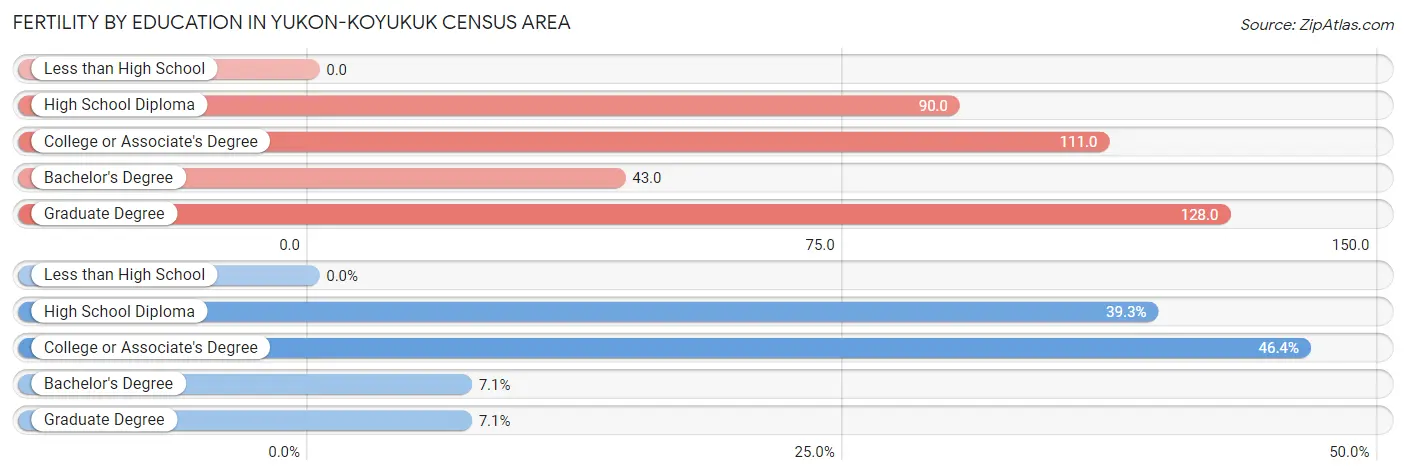
| Educational Attainment | Women with Births | Births / 1,000 Women |
| Less than High School | 0 (0.0%) | 0.0 |
| High School Diploma | 33 (39.3%) | 90.0 |
| College or Associate's Degree | 39 (46.4%) | 111.0 |
| Bachelor's Degree | 6 (7.1%) | 43.0 |
| Graduate Degree | 6 (7.1%) | 128.0 |
| Total | 84 (100.0%) | 78.0 |
Fertility by Education by Marriage Status in Yukon-Koyukuk Census Area
82.1% of women with births in Yukon-Koyukuk Census Area are unmarried. Women with the educational attainment of bachelor's degree are most likely to be married with 100.0% of them married at childbirth, while women with the educational attainment of graduate degree are least likely to be married with 100.0% of them unmarried at childbirth.
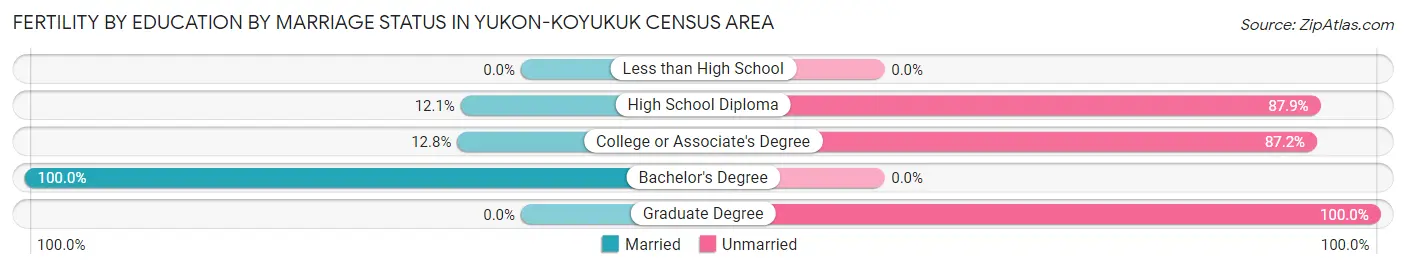
| Educational Attainment | Married | Unmarried |
| Less than High School | 0 (0.0%) | 0 (0.0%) |
| High School Diploma | 4 (12.1%) | 29 (87.9%) |
| College or Associate's Degree | 5 (12.8%) | 34 (87.2%) |
| Bachelor's Degree | 6 (100.0%) | 0 (0.0%) |
| Graduate Degree | 0 (0.0%) | 6 (100.0%) |
| Total | 15 (17.9%) | 69 (82.1%) |
Income in Yukon-Koyukuk Census Area
Income Overview in Yukon-Koyukuk Census Area
Per Capita Income in Yukon-Koyukuk Census Area is $29,382, while median incomes of families and households are $59,458 and $47,826 respectively.
| Characteristic | Number | Measure |
| Per Capita Income | 5,355 | $29,382 |
| Median Family Income | 1,125 | $59,458 |
| Mean Family Income | 1,125 | $75,387 |
| Median Household Income | 2,078 | $47,826 |
| Mean Household Income | 2,078 | $62,362 |
| Income Deficit | 1,125 | $9,661 |
| Wage / Income Gap (%) | 5,355 | 17.00% |
| Wage / Income Gap ($) | 5,355 | 83.00¢ per $1 |
| Gini / Inequality Index | 5,355 | 0.46 |
Earnings by Sex in Yukon-Koyukuk Census Area
Average Earnings in Yukon-Koyukuk Census Area are $27,434, $25,000 for men and $30,119 for women, a difference of 17.0%.
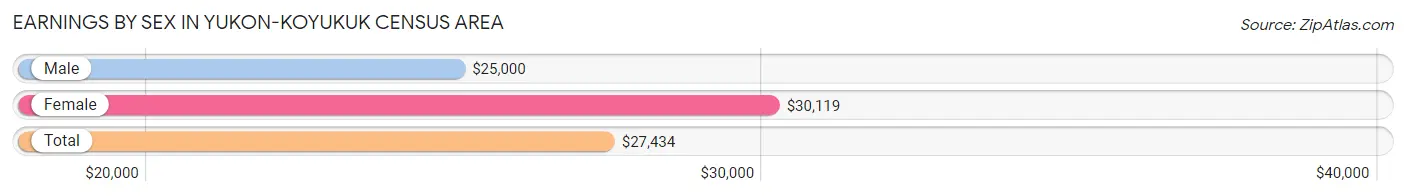
| Sex | Number | Average Earnings |
| Male | 1,612 (55.0%) | $25,000 |
| Female | 1,318 (45.0%) | $30,119 |
| Total | 2,930 (100.0%) | $27,434 |
Earnings by Sex by Income Bracket in Yukon-Koyukuk Census Area
The most common earnings brackets in Yukon-Koyukuk Census Area are $100,000+ for men (184 | 11.4%) and $55,000 to $64,999 for women (139 | 10.5%).
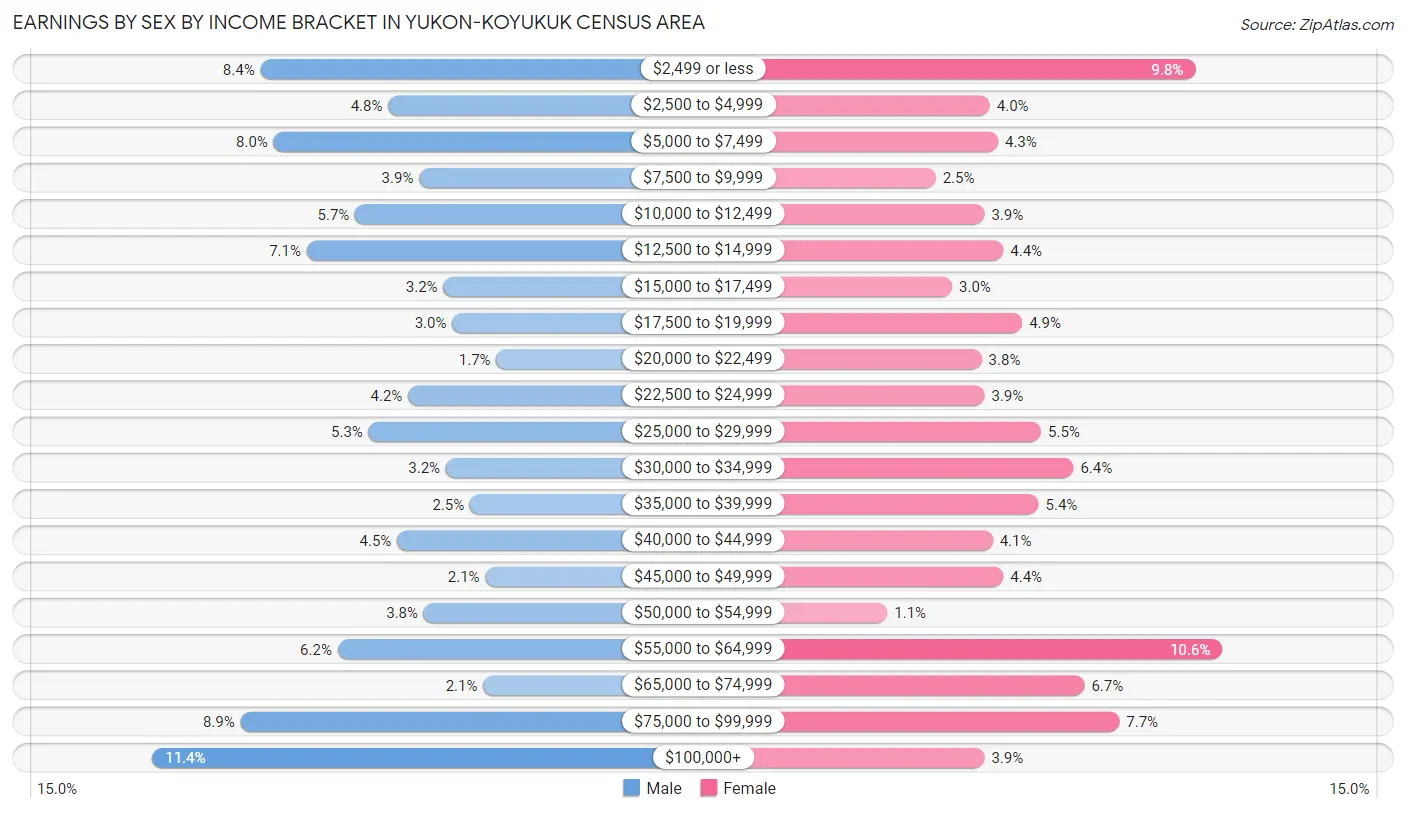
| Income | Male | Female |
| $2,499 or less | 135 (8.4%) | 129 (9.8%) |
| $2,500 to $4,999 | 77 (4.8%) | 53 (4.0%) |
| $5,000 to $7,499 | 129 (8.0%) | 56 (4.3%) |
| $7,500 to $9,999 | 63 (3.9%) | 33 (2.5%) |
| $10,000 to $12,499 | 92 (5.7%) | 51 (3.9%) |
| $12,500 to $14,999 | 114 (7.1%) | 58 (4.4%) |
| $15,000 to $17,499 | 52 (3.2%) | 39 (3.0%) |
| $17,500 to $19,999 | 48 (3.0%) | 65 (4.9%) |
| $20,000 to $22,499 | 28 (1.7%) | 50 (3.8%) |
| $22,500 to $24,999 | 68 (4.2%) | 51 (3.9%) |
| $25,000 to $29,999 | 86 (5.3%) | 72 (5.5%) |
| $30,000 to $34,999 | 51 (3.2%) | 84 (6.4%) |
| $35,000 to $39,999 | 40 (2.5%) | 71 (5.4%) |
| $40,000 to $44,999 | 73 (4.5%) | 54 (4.1%) |
| $45,000 to $49,999 | 33 (2.1%) | 58 (4.4%) |
| $50,000 to $54,999 | 61 (3.8%) | 15 (1.1%) |
| $55,000 to $64,999 | 100 (6.2%) | 139 (10.5%) |
| $65,000 to $74,999 | 34 (2.1%) | 88 (6.7%) |
| $75,000 to $99,999 | 144 (8.9%) | 101 (7.7%) |
| $100,000+ | 184 (11.4%) | 51 (3.9%) |
| Total | 1,612 (100.0%) | 1,318 (100.0%) |
Earnings by Sex by Educational Attainment in Yukon-Koyukuk Census Area
Average earnings in Yukon-Koyukuk Census Area are $27,070 for men and $33,456 for women, a difference of 19.1%. Men with an educational attainment of graduate degree enjoy the highest average annual earnings of $76,944, while those with less than high school education earn the least with $19,167. Women with an educational attainment of graduate degree earn the most with the average annual earnings of $80,536, while those with less than high school education have the smallest earnings of $15,000.
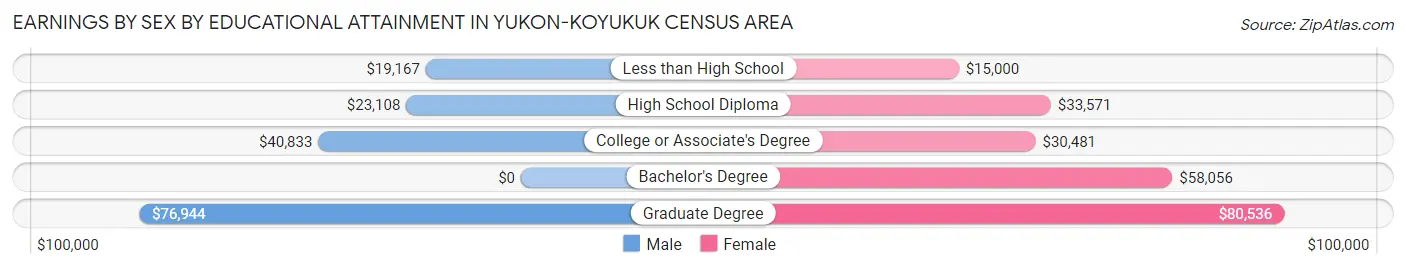
| Educational Attainment | Male Income | Female Income |
| Less than High School | $19,167 | $15,000 |
| High School Diploma | $23,108 | $33,571 |
| College or Associate's Degree | $40,833 | $30,481 |
| Bachelor's Degree | - | - |
| Graduate Degree | $76,944 | $80,536 |
| Total | $27,070 | $33,456 |
Family Income in Yukon-Koyukuk Census Area
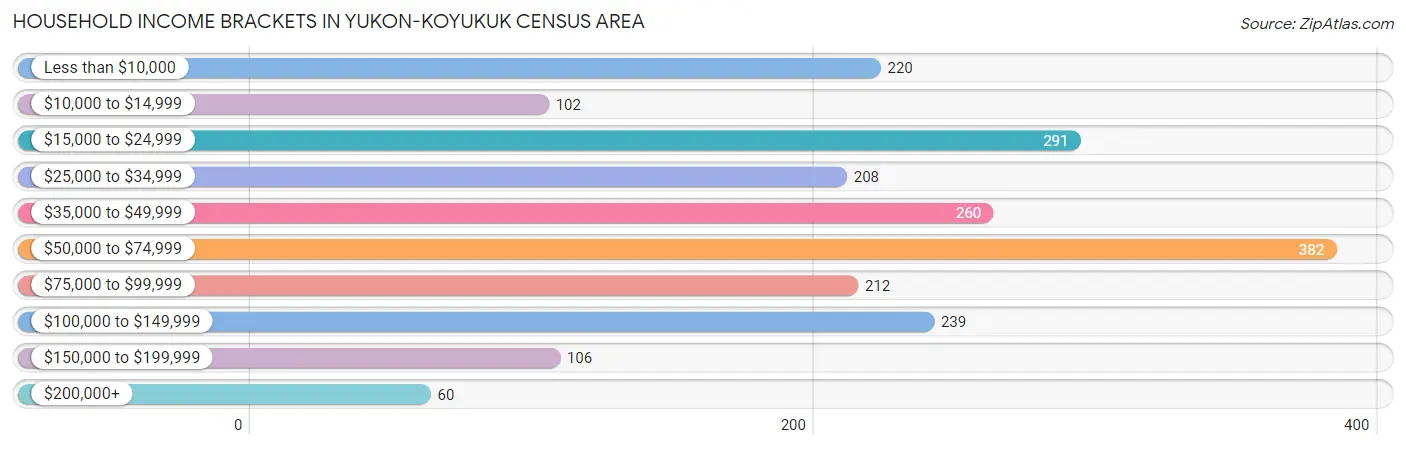
Family Income Brackets in Yukon-Koyukuk Census Area
According to the Yukon-Koyukuk Census Area family income data, there are 242 families falling into the $50,000 to $74,999 income range, which is the most common income bracket and makes up 21.5% of all families. Conversely, the $10,000 to $14,999 income bracket is the least frequent group with only 30 families (2.7%) belonging to this category.
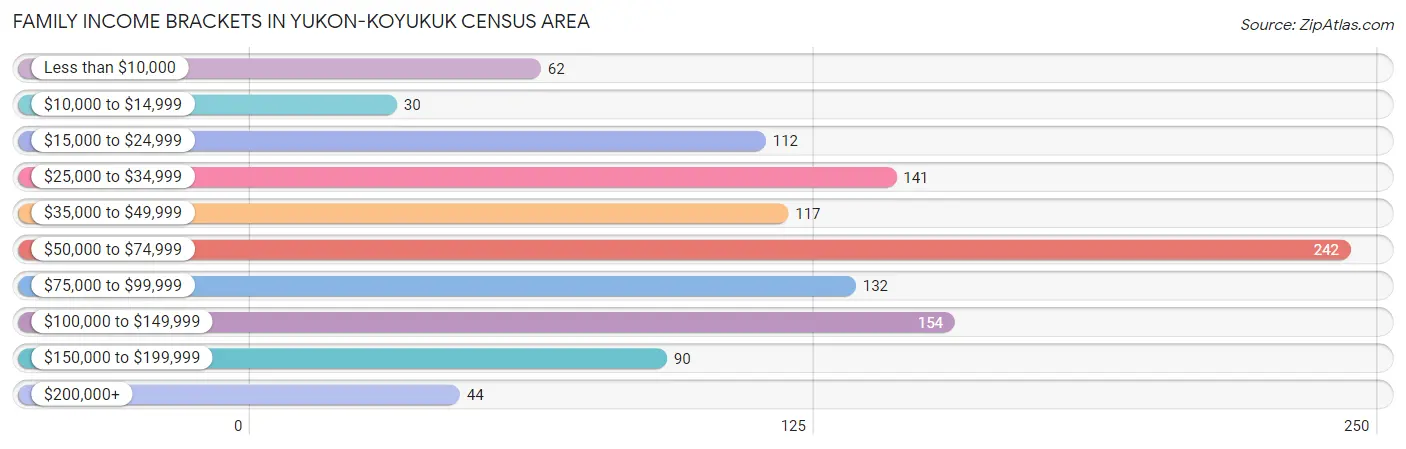
| Income Bracket | # Families | % Families |
| Less than $10,000 | 62 | 5.5% |
| $10,000 to $14,999 | 30 | 2.7% |
| $15,000 to $24,999 | 112 | 10.0% |
| $25,000 to $34,999 | 141 | 12.5% |
| $35,000 to $49,999 | 117 | 10.4% |
| $50,000 to $74,999 | 242 | 21.5% |
| $75,000 to $99,999 | 132 | 11.7% |
| $100,000 to $149,999 | 154 | 13.7% |
| $150,000 to $199,999 | 90 | 8.0% |
| $200,000+ | 44 | 3.9% |
Family Income by Famaliy Size in Yukon-Koyukuk Census Area
5-person families (131 | 11.6%) account for the highest median family income in Yukon-Koyukuk Census Area with $88,125 per family, while 2-person families (515 | 45.8%) have the highest median income of $28,892 per family member.
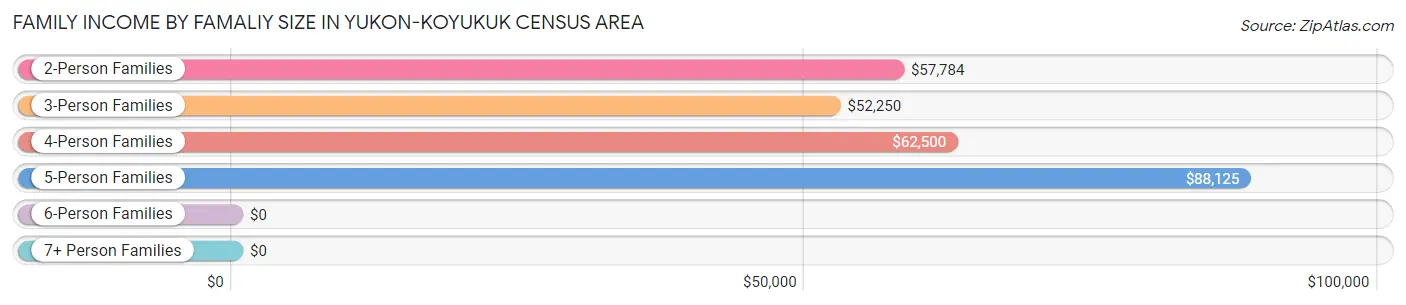
| Income Bracket | # Families | Median Income |
| 2-Person Families | 515 (45.8%) | $57,784 |
| 3-Person Families | 285 (25.3%) | $52,250 |
| 4-Person Families | 144 (12.8%) | $62,500 |
| 5-Person Families | 131 (11.6%) | $88,125 |
| 6-Person Families | 21 (1.9%) | $0 |
| 7+ Person Families | 29 (2.6%) | $0 |
| Total | 1,125 (100.0%) | $59,458 |
Family Income by Number of Earners in Yukon-Koyukuk Census Area
The median family income in Yukon-Koyukuk Census Area is $59,458, with families comprising 3+ earners (123) having the highest median family income of $95,417, while families with no earners (168) have the lowest median family income of $26,500, accounting for 10.9% and 14.9% of families, respectively.
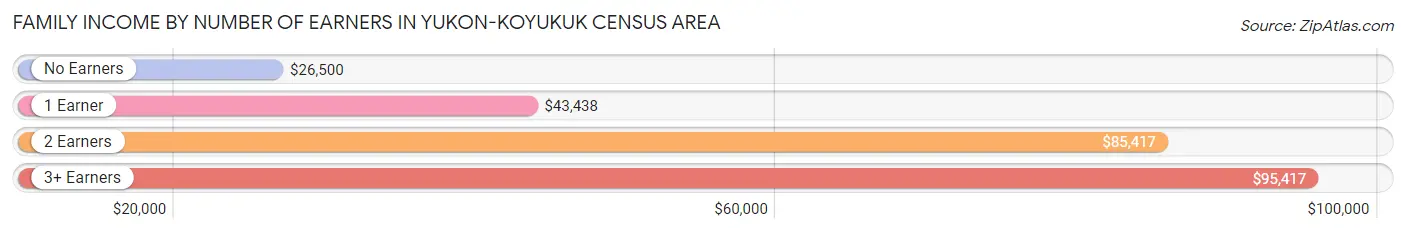
| Number of Earners | # Families | Median Income |
| No Earners | 168 (14.9%) | $26,500 |
| 1 Earner | 445 (39.6%) | $43,438 |
| 2 Earners | 389 (34.6%) | $85,417 |
| 3+ Earners | 123 (10.9%) | $95,417 |
| Total | 1,125 (100.0%) | $59,458 |
Household Income in Yukon-Koyukuk Census Area
Household Income Brackets in Yukon-Koyukuk Census Area
With 382 households falling in the category, the $50,000 to $74,999 income range is the most frequent in Yukon-Koyukuk Census Area, accounting for 18.4% of all households. In contrast, only 60 households (2.9%) fall into the $200,000+ income bracket, making it the least populous group.
| Income Bracket | # Households | % Households |
| Less than $10,000 | 220 | 10.6% |
| $10,000 to $14,999 | 102 | 4.9% |
| $15,000 to $24,999 | 291 | 14.0% |
| $25,000 to $34,999 | 208 | 10.0% |
| $35,000 to $49,999 | 260 | 12.5% |
| $50,000 to $74,999 | 382 | 18.4% |
| $75,000 to $99,999 | 212 | 10.2% |
| $100,000 to $149,999 | 239 | 11.5% |
| $150,000 to $199,999 | 106 | 5.1% |
| $200,000+ | 60 | 2.9% |
Household Income by Householder Age in Yukon-Koyukuk Census Area
The median household income in Yukon-Koyukuk Census Area is $47,826, with the highest median household income of $70,893 found in the 15 to 24 years age bracket for the primary householder. A total of 76 households (3.7%) fall into this category. Meanwhile, the 65+ years age bracket for the primary householder has the lowest median household income of $33,882, with 575 households (27.7%) in this group.
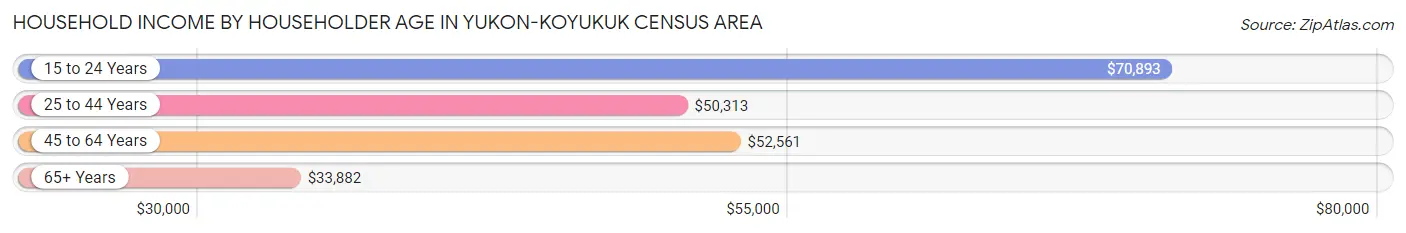
| Income Bracket | # Households | Median Income |
| 15 to 24 Years | 76 (3.7%) | $70,893 |
| 25 to 44 Years | 655 (31.5%) | $50,313 |
| 45 to 64 Years | 772 (37.1%) | $52,561 |
| 65+ Years | 575 (27.7%) | $33,882 |
| Total | 2,078 (100.0%) | $47,826 |
Poverty in Yukon-Koyukuk Census Area
Income Below Poverty by Sex and Age in Yukon-Koyukuk Census Area
With 22.8% poverty level for males and 23.1% for females among the residents of Yukon-Koyukuk Census Area, 6 to 11 year old males and under 5 year old females are the most vulnerable to poverty, with 96 males (37.8%) and 113 females (55.9%) in their respective age groups living below the poverty level.
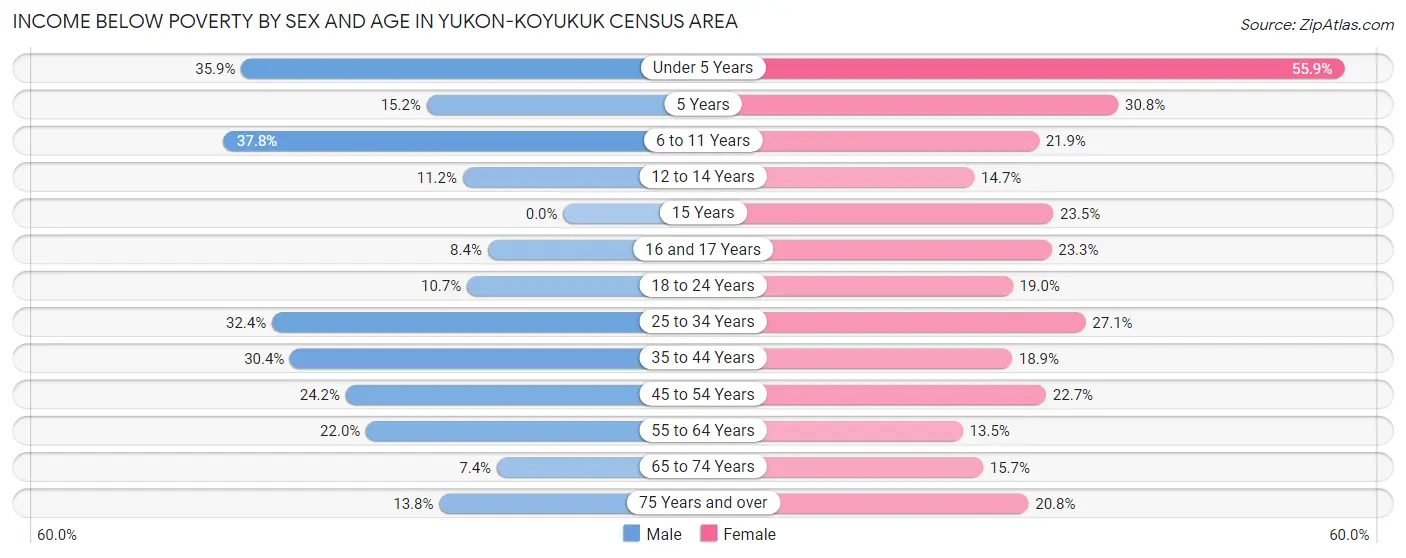
| Age Bracket | Male | Female |
| Under 5 Years | 66 (35.9%) | 113 (55.9%) |
| 5 Years | 7 (15.2%) | 16 (30.8%) |
| 6 to 11 Years | 96 (37.8%) | 59 (21.9%) |
| 12 to 14 Years | 14 (11.2%) | 14 (14.7%) |
| 15 Years | 0 (0.0%) | 8 (23.5%) |
| 16 and 17 Years | 8 (8.4%) | 14 (23.3%) |
| 18 to 24 Years | 22 (10.7%) | 43 (19.0%) |
| 25 to 34 Years | 121 (32.4%) | 89 (27.1%) |
| 35 to 44 Years | 115 (30.4%) | 50 (18.9%) |
| 45 to 54 Years | 63 (24.2%) | 60 (22.7%) |
| 55 to 64 Years | 85 (22.0%) | 44 (13.5%) |
| 65 to 74 Years | 27 (7.4%) | 38 (15.7%) |
| 75 Years and over | 17 (13.8%) | 27 (20.8%) |
| Total | 641 (22.8%) | 575 (23.1%) |
Income Above Poverty by Sex and Age in Yukon-Koyukuk Census Area
According to the poverty statistics in Yukon-Koyukuk Census Area, males aged 15 years and females aged 55 to 64 years are the age groups that are most secure financially, with 100.0% of males and 86.5% of females in these age groups living above the poverty line.
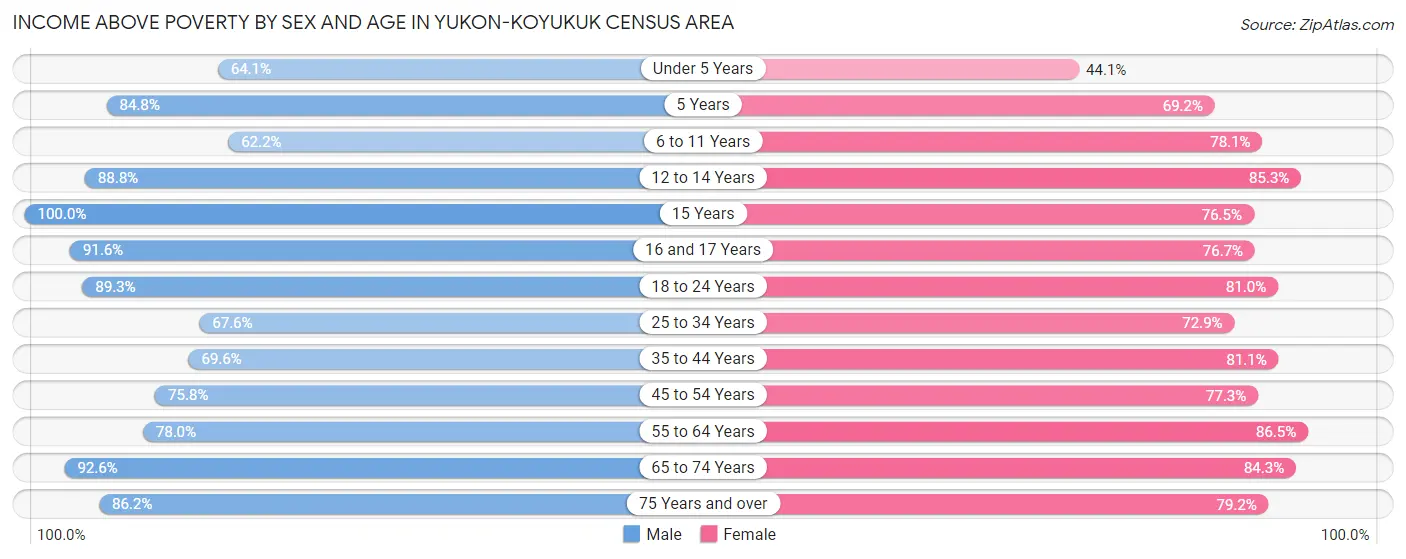
| Age Bracket | Male | Female |
| Under 5 Years | 118 (64.1%) | 89 (44.1%) |
| 5 Years | 39 (84.8%) | 36 (69.2%) |
| 6 to 11 Years | 158 (62.2%) | 210 (78.1%) |
| 12 to 14 Years | 111 (88.8%) | 81 (85.3%) |
| 15 Years | 20 (100.0%) | 26 (76.5%) |
| 16 and 17 Years | 87 (91.6%) | 46 (76.7%) |
| 18 to 24 Years | 183 (89.3%) | 183 (81.0%) |
| 25 to 34 Years | 252 (67.6%) | 239 (72.9%) |
| 35 to 44 Years | 263 (69.6%) | 214 (81.1%) |
| 45 to 54 Years | 197 (75.8%) | 204 (77.3%) |
| 55 to 64 Years | 302 (78.0%) | 283 (86.5%) |
| 65 to 74 Years | 338 (92.6%) | 204 (84.3%) |
| 75 Years and over | 106 (86.2%) | 103 (79.2%) |
| Total | 2,174 (77.2%) | 1,918 (76.9%) |
Income Below Poverty Among Married-Couple Families in Yukon-Koyukuk Census Area
The poverty statistics for married-couple families in Yukon-Koyukuk Census Area show that 8.3% or 45 of the total 541 families live below the poverty line. Families with 5 or more children have the highest poverty rate of 33.3%, comprising of 2 families. On the other hand, families with 1 or 2 children have the lowest poverty rate of 3.9%, which includes 5 families.
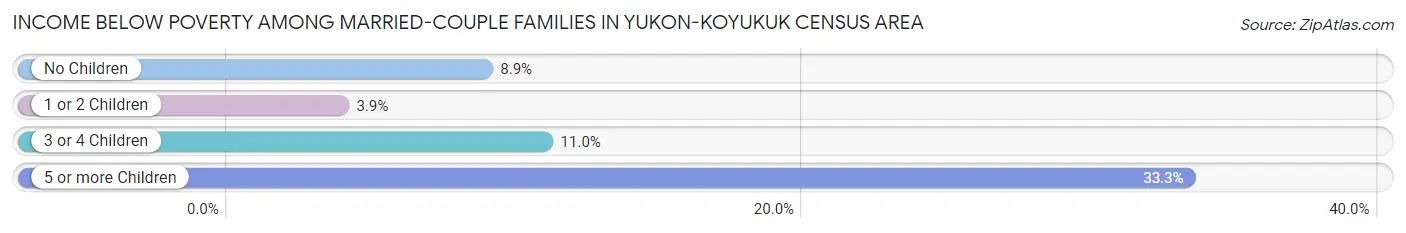
| Children | Above Poverty | Below Poverty |
| No Children | 287 (91.1%) | 28 (8.9%) |
| 1 or 2 Children | 124 (96.1%) | 5 (3.9%) |
| 3 or 4 Children | 81 (89.0%) | 10 (11.0%) |
| 5 or more Children | 4 (66.7%) | 2 (33.3%) |
| Total | 496 (91.7%) | 45 (8.3%) |
Income Below Poverty Among Single-Parent Households in Yukon-Koyukuk Census Area
According to the poverty data in Yukon-Koyukuk Census Area, 25.4% or 46 single-father households and 28.5% or 115 single-mother households are living below the poverty line. Among single-father households, those with 5 or more children have the highest poverty rate, with 5 households (100.0%) experiencing poverty. Likewise, among single-mother households, those with 5 or more children have the highest poverty rate, with 4 households (57.1%) falling below the poverty line.
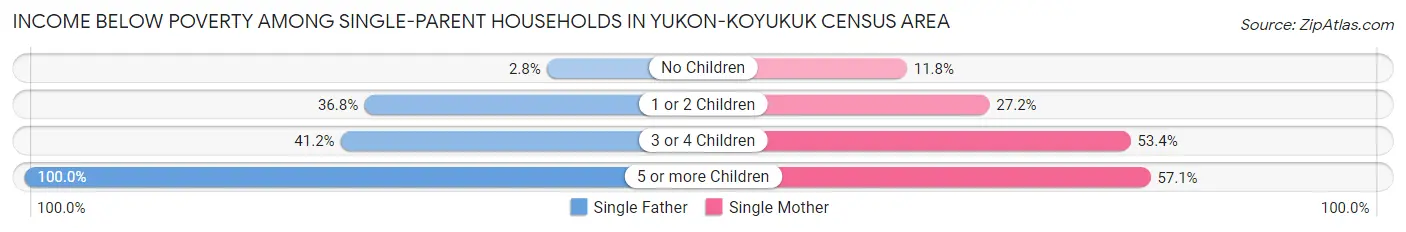
| Children | Single Father | Single Mother |
| No Children | 2 (2.8%) | 12 (11.8%) |
| 1 or 2 Children | 32 (36.8%) | 60 (27.2%) |
| 3 or 4 Children | 7 (41.2%) | 39 (53.4%) |
| 5 or more Children | 5 (100.0%) | 4 (57.1%) |
| Total | 46 (25.4%) | 115 (28.5%) |
Income Below Poverty Among Married-Couple vs Single-Parent Households in Yukon-Koyukuk Census Area
The poverty data for Yukon-Koyukuk Census Area shows that 45 of the married-couple family households (8.3%) and 161 of the single-parent households (27.6%) are living below the poverty level. Within the married-couple family households, those with 5 or more children have the highest poverty rate, with 2 households (33.3%) falling below the poverty line. Among the single-parent households, those with 5 or more children have the highest poverty rate, with 9 household (75.0%) living below poverty.
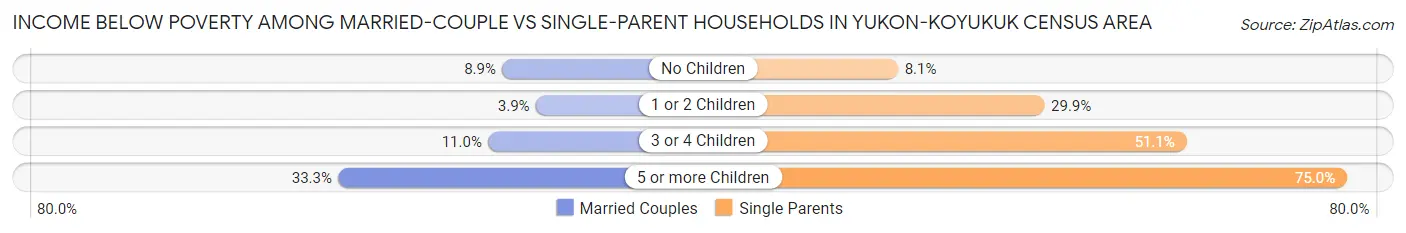
| Children | Married-Couple Families | Single-Parent Households |
| No Children | 28 (8.9%) | 14 (8.1%) |
| 1 or 2 Children | 5 (3.9%) | 92 (29.9%) |
| 3 or 4 Children | 10 (11.0%) | 46 (51.1%) |
| 5 or more Children | 2 (33.3%) | 9 (75.0%) |
| Total | 45 (8.3%) | 161 (27.6%) |
Employment Characteristics in Yukon-Koyukuk Census Area
Employment by Class of Employer in Yukon-Koyukuk Census Area
Among the 2,257 employed individuals in Yukon-Koyukuk Census Area, private company employees (692 | 30.7%), local government employees (643 | 28.5%), and state government employees (337 | 14.9%) make up the most common classes of employment.
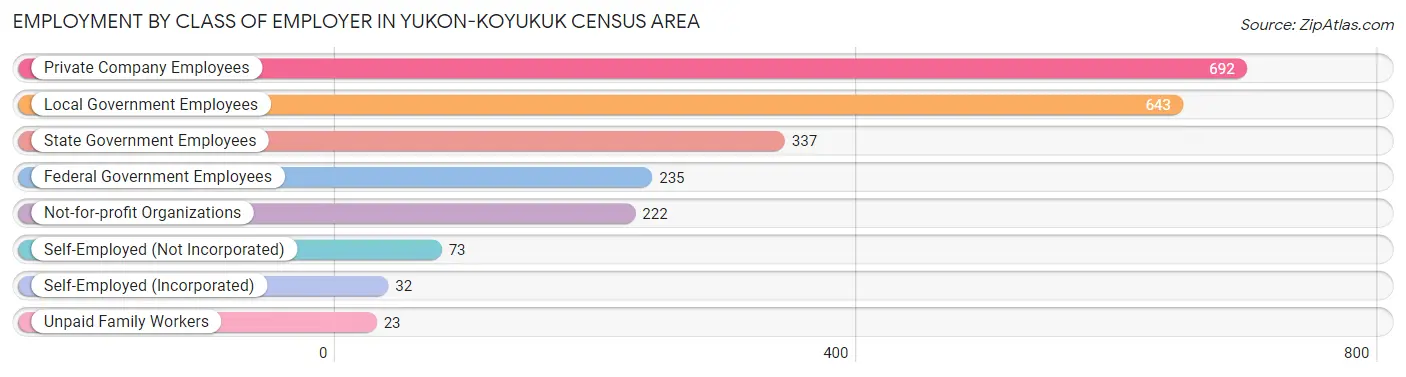
| Employer Class | # Employees | % Employees |
| Private Company Employees | 692 | 30.7% |
| Self-Employed (Incorporated) | 32 | 1.4% |
| Self-Employed (Not Incorporated) | 73 | 3.2% |
| Not-for-profit Organizations | 222 | 9.8% |
| Local Government Employees | 643 | 28.5% |
| State Government Employees | 337 | 14.9% |
| Federal Government Employees | 235 | 10.4% |
| Unpaid Family Workers | 23 | 1.0% |
| Total | 2,257 | 100.0% |
Employment Status by Age in Yukon-Koyukuk Census Area
According to the labor force statistics for Yukon-Koyukuk Census Area, out of the total population over 16 years of age (4,051), 65.9% or 2,670 individuals are in the labor force, with 11.1% or 296 of them unemployed. The age group with the highest labor force participation rate is 20 to 24 years, with 84.3% or 273 individuals in the labor force. Within the labor force, the 35 to 44 years age range has the highest percentage of unemployed individuals, with 15.1% or 76 of them being unemployed.
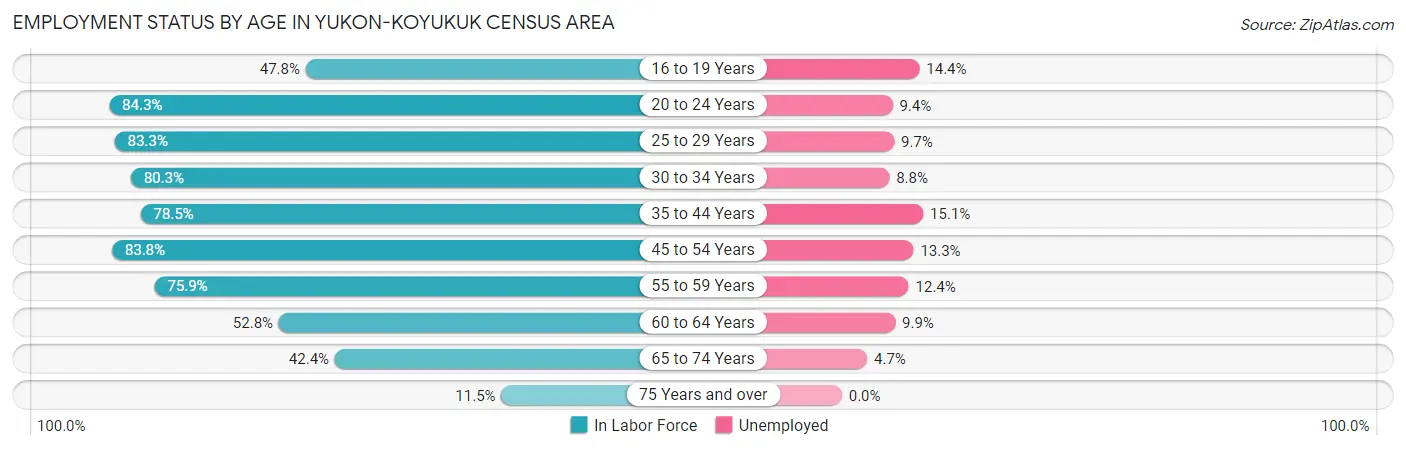
| Age Bracket | In Labor Force | Unemployed |
| 16 to 19 Years | 132 (47.8%) | 19 (14.4%) |
| 20 to 24 Years | 273 (84.3%) | 26 (9.4%) |
| 25 to 29 Years | 289 (83.3%) | 28 (9.7%) |
| 30 to 34 Years | 285 (80.3%) | 25 (8.8%) |
| 35 to 44 Years | 504 (78.5%) | 76 (15.1%) |
| 45 to 54 Years | 439 (83.8%) | 58 (13.3%) |
| 55 to 59 Years | 267 (75.9%) | 33 (12.4%) |
| 60 to 64 Years | 191 (52.8%) | 19 (9.9%) |
| 65 to 74 Years | 258 (42.4%) | 12 (4.7%) |
| 75 Years and over | 30 (11.5%) | 0 (0.0%) |
| Total | 2,670 (65.9%) | 296 (11.1%) |
Employment Status by Educational Attainment in Yukon-Koyukuk Census Area
According to labor force statistics for Yukon-Koyukuk Census Area, 76.5% of individuals (1,975) out of the total population between 25 and 64 years of age (2,582) are in the labor force, with 12.1% or 239 of them being unemployed. The group with the highest labor force participation rate are those with the educational attainment of bachelor's degree or higher, with 89.1% or 287 individuals in the labor force. Within the labor force, individuals with less than high school education have the highest percentage of unemployment, with 24.1% or 34 of them being unemployed.
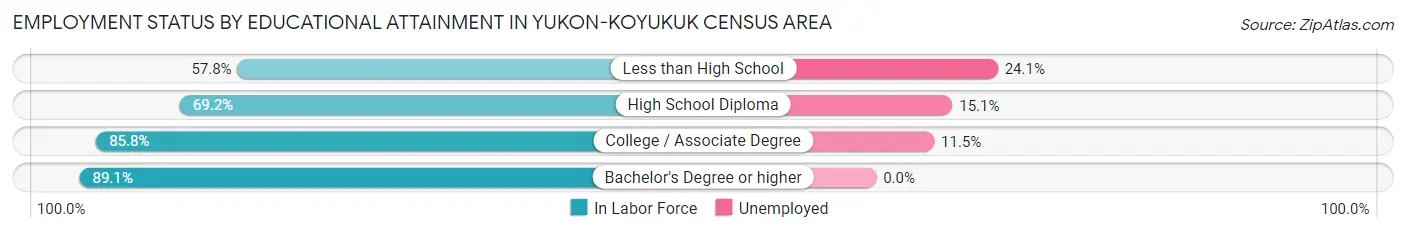
| Educational Attainment | In Labor Force | Unemployed |
| Less than High School | 141 (57.8%) | 59 (24.1%) |
| High School Diploma | 763 (69.2%) | 166 (15.1%) |
| College / Associate Degree | 784 (85.8%) | 105 (11.5%) |
| Bachelor's Degree or higher | 287 (89.1%) | 0 (0.0%) |
| Total | 1,975 (76.5%) | 312 (12.1%) |
Employment Occupations by Sex in Yukon-Koyukuk Census Area
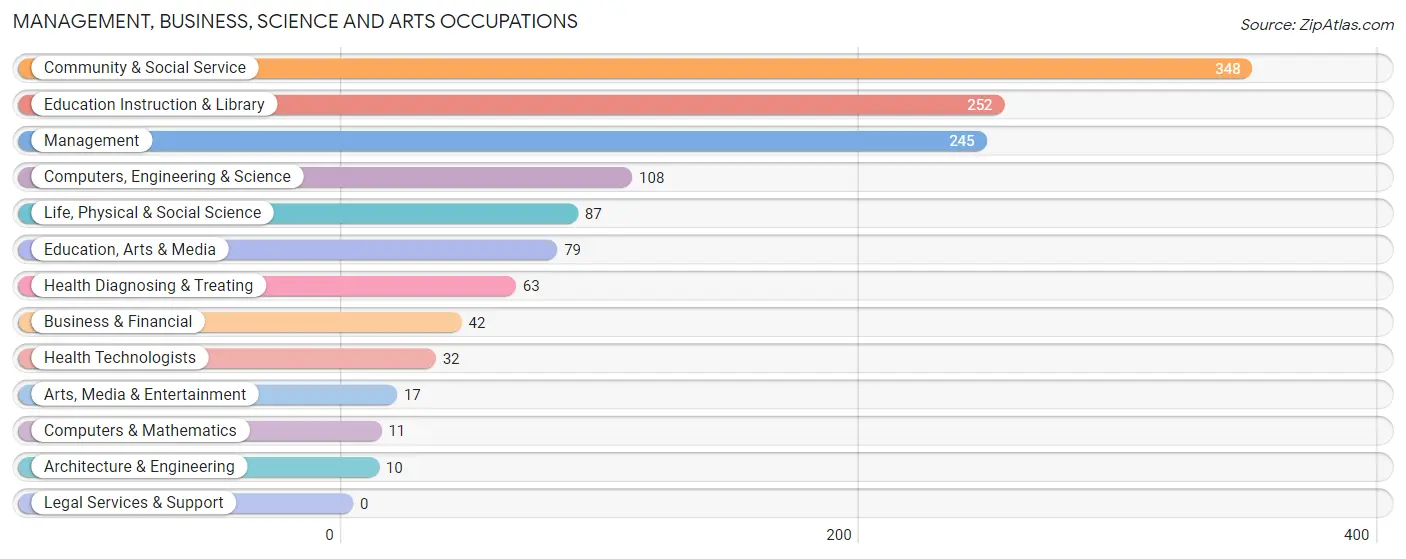
Management, Business, Science and Arts Occupations
The most common Management, Business, Science and Arts occupations in Yukon-Koyukuk Census Area are Community & Social Service (348 | 14.8%), Education Instruction & Library (252 | 10.7%), Management (245 | 10.4%), Computers, Engineering & Science (108 | 4.6%), and Life, Physical & Social Science (87 | 3.7%).
Management, Business, Science and Arts Occupations by Sex
Within the Management, Business, Science and Arts occupations in Yukon-Koyukuk Census Area, the most male-oriented occupations are Computers & Mathematics (100.0%), Architecture & Engineering (100.0%), and Computers, Engineering & Science (86.1%), while the most female-oriented occupations are Health Technologists (93.8%), Business & Financial (88.1%), and Education, Arts & Media (82.3%).
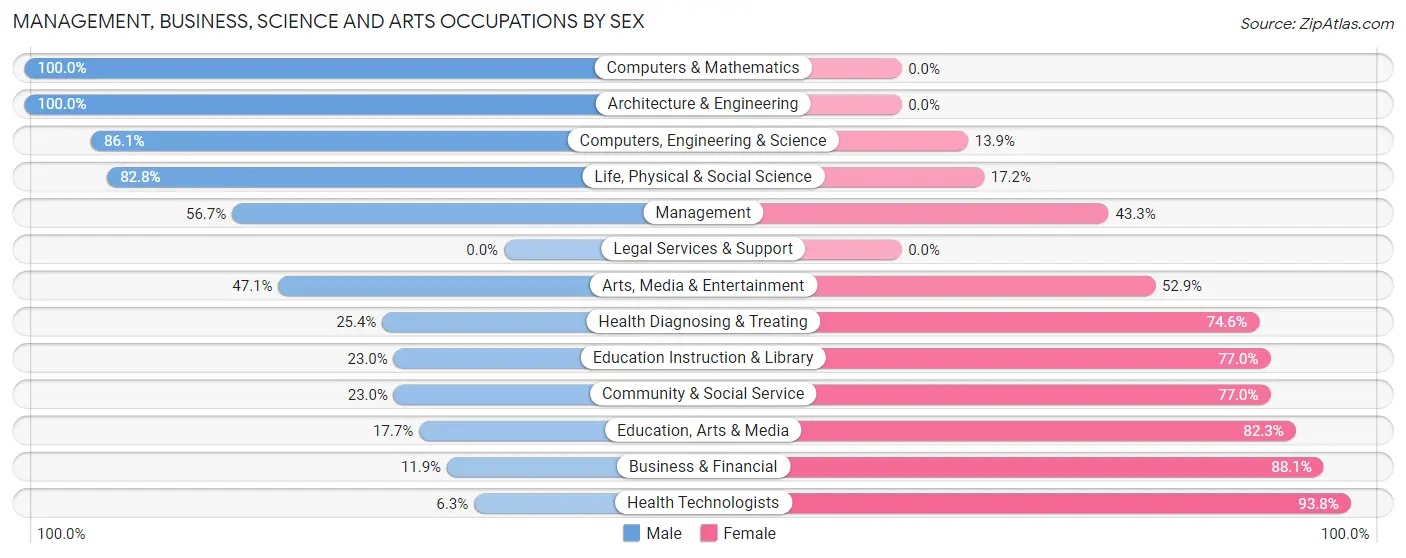
| Occupation | Male | Female |
| Management | 139 (56.7%) | 106 (43.3%) |
| Business & Financial | 5 (11.9%) | 37 (88.1%) |
| Computers, Engineering & Science | 93 (86.1%) | 15 (13.9%) |
| Computers & Mathematics | 11 (100.0%) | 0 (0.0%) |
| Architecture & Engineering | 10 (100.0%) | 0 (0.0%) |
| Life, Physical & Social Science | 72 (82.8%) | 15 (17.2%) |
| Community & Social Service | 80 (23.0%) | 268 (77.0%) |
| Education, Arts & Media | 14 (17.7%) | 65 (82.3%) |
| Legal Services & Support | 0 (0.0%) | 0 (0.0%) |
| Education Instruction & Library | 58 (23.0%) | 194 (77.0%) |
| Arts, Media & Entertainment | 8 (47.1%) | 9 (52.9%) |
| Health Diagnosing & Treating | 16 (25.4%) | 47 (74.6%) |
| Health Technologists | 2 (6.2%) | 30 (93.8%) |
| Total (Category) | 333 (41.3%) | 473 (58.7%) |
| Total (Overall) | 1,240 (52.6%) | 1,118 (47.4%) |
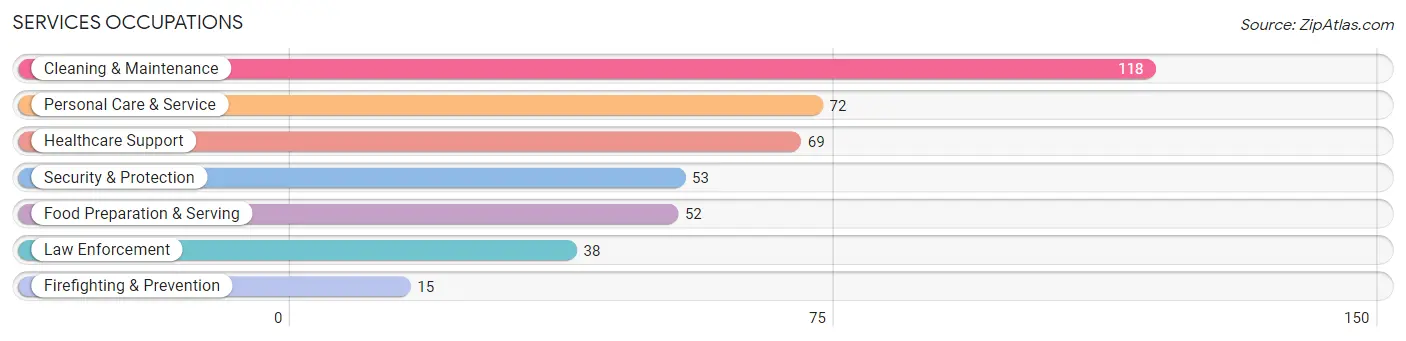
Services Occupations
The most common Services occupations in Yukon-Koyukuk Census Area are Cleaning & Maintenance (118 | 5.0%), Personal Care & Service (72 | 3.0%), Healthcare Support (69 | 2.9%), Security & Protection (53 | 2.2%), and Food Preparation & Serving (52 | 2.2%).
Services Occupations by Sex
Within the Services occupations in Yukon-Koyukuk Census Area, the most male-oriented occupations are Firefighting & Prevention (100.0%), Security & Protection (90.6%), and Law Enforcement (86.8%), while the most female-oriented occupations are Healthcare Support (97.1%), Food Preparation & Serving (80.8%), and Personal Care & Service (66.7%).
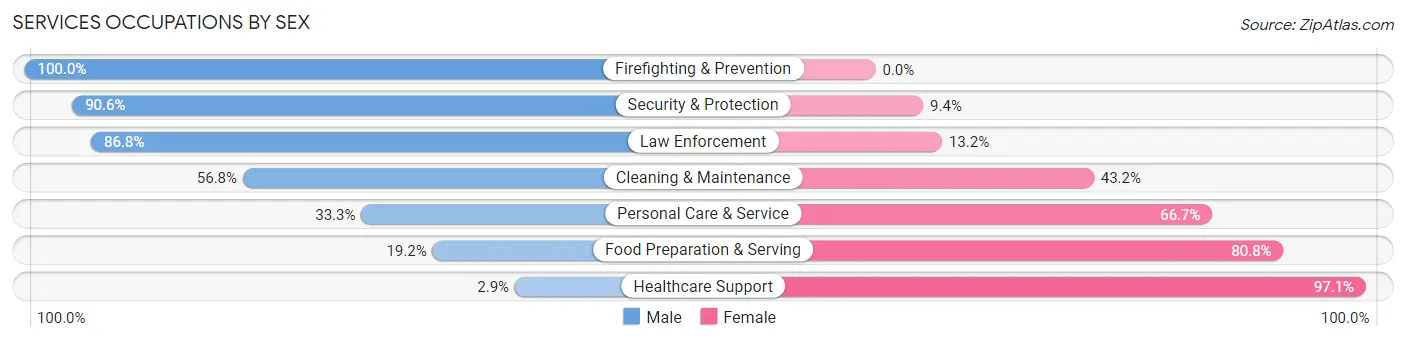
| Occupation | Male | Female |
| Healthcare Support | 2 (2.9%) | 67 (97.1%) |
| Security & Protection | 48 (90.6%) | 5 (9.4%) |
| Firefighting & Prevention | 15 (100.0%) | 0 (0.0%) |
| Law Enforcement | 33 (86.8%) | 5 (13.2%) |
| Food Preparation & Serving | 10 (19.2%) | 42 (80.8%) |
| Cleaning & Maintenance | 67 (56.8%) | 51 (43.2%) |
| Personal Care & Service | 24 (33.3%) | 48 (66.7%) |
| Total (Category) | 151 (41.5%) | 213 (58.5%) |
| Total (Overall) | 1,240 (52.6%) | 1,118 (47.4%) |
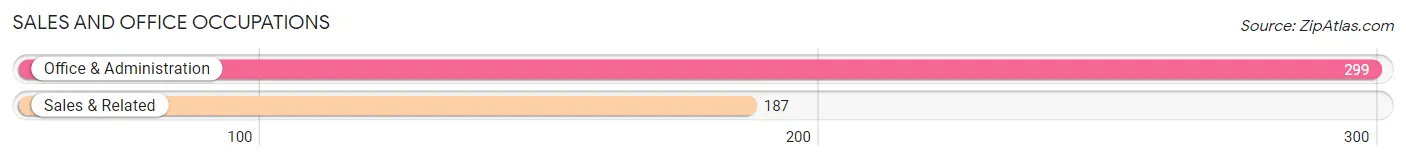
Sales and Office Occupations
The most common Sales and Office occupations in Yukon-Koyukuk Census Area are Office & Administration (299 | 12.7%), and Sales & Related (187 | 7.9%).
Sales and Office Occupations by Sex
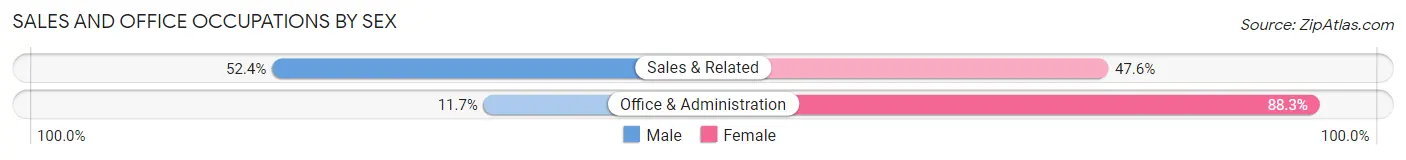
| Occupation | Male | Female |
| Sales & Related | 98 (52.4%) | 89 (47.6%) |
| Office & Administration | 35 (11.7%) | 264 (88.3%) |
| Total (Category) | 133 (27.4%) | 353 (72.6%) |
| Total (Overall) | 1,240 (52.6%) | 1,118 (47.4%) |
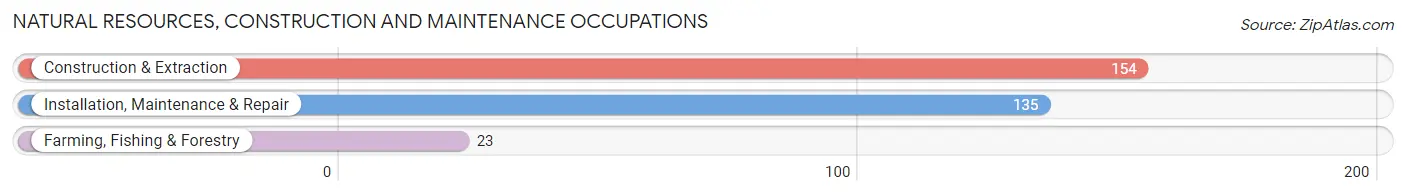
Natural Resources, Construction and Maintenance Occupations
The most common Natural Resources, Construction and Maintenance occupations in Yukon-Koyukuk Census Area are Construction & Extraction (154 | 6.5%), Installation, Maintenance & Repair (135 | 5.7%), and Farming, Fishing & Forestry (23 | 1.0%).
Natural Resources, Construction and Maintenance Occupations by Sex
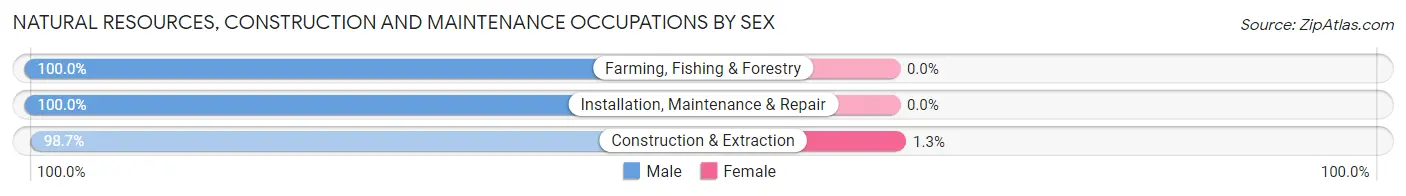
| Occupation | Male | Female |
| Farming, Fishing & Forestry | 23 (100.0%) | 0 (0.0%) |
| Construction & Extraction | 152 (98.7%) | 2 (1.3%) |
| Installation, Maintenance & Repair | 135 (100.0%) | 0 (0.0%) |
| Total (Category) | 310 (99.4%) | 2 (0.6%) |
| Total (Overall) | 1,240 (52.6%) | 1,118 (47.4%) |
Production, Transportation and Moving Occupations
The most common Production, Transportation and Moving occupations in Yukon-Koyukuk Census Area are Production (233 | 9.9%), Material Moving (112 | 4.8%), and Transportation (45 | 1.9%).
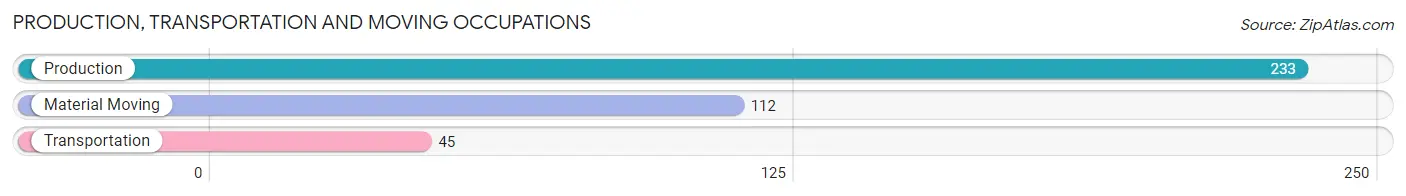
Production, Transportation and Moving Occupations by Sex
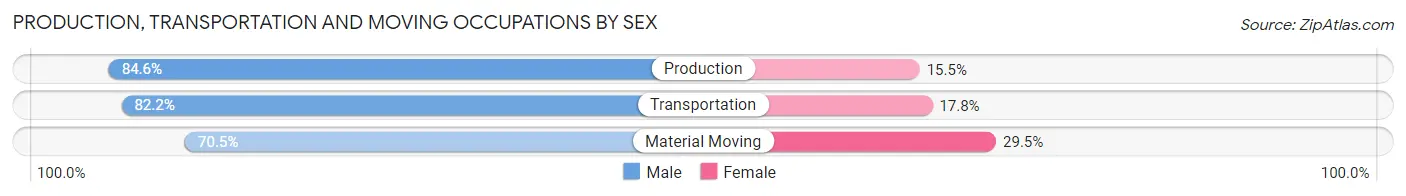
| Occupation | Male | Female |
| Production | 197 (84.6%) | 36 (15.4%) |
| Transportation | 37 (82.2%) | 8 (17.8%) |
| Material Moving | 79 (70.5%) | 33 (29.5%) |
| Total (Category) | 313 (80.3%) | 77 (19.7%) |
| Total (Overall) | 1,240 (52.6%) | 1,118 (47.4%) |
Employment Industries by Sex in Yukon-Koyukuk Census Area
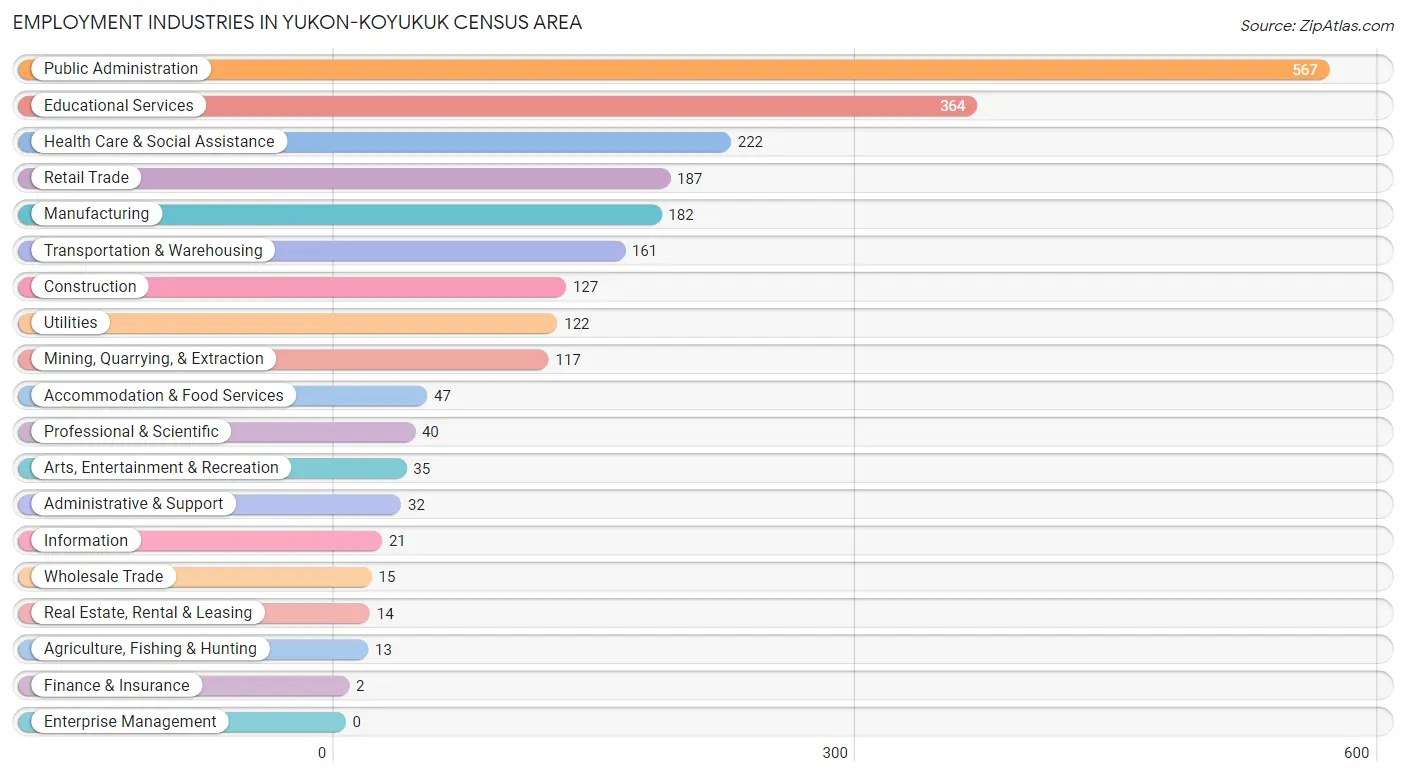
Employment Industries in Yukon-Koyukuk Census Area
The major employment industries in Yukon-Koyukuk Census Area include Public Administration (567 | 24.0%), Educational Services (364 | 15.4%), Health Care & Social Assistance (222 | 9.4%), Retail Trade (187 | 7.9%), and Manufacturing (182 | 7.7%).
Employment Industries by Sex in Yukon-Koyukuk Census Area
The Yukon-Koyukuk Census Area industries that see more men than women are Mining, Quarrying, & Extraction (100.0%), Information (100.0%), and Manufacturing (87.9%), whereas the industries that tend to have a higher number of women are Finance & Insurance (100.0%), Health Care & Social Assistance (90.5%), and Wholesale Trade (73.3%).
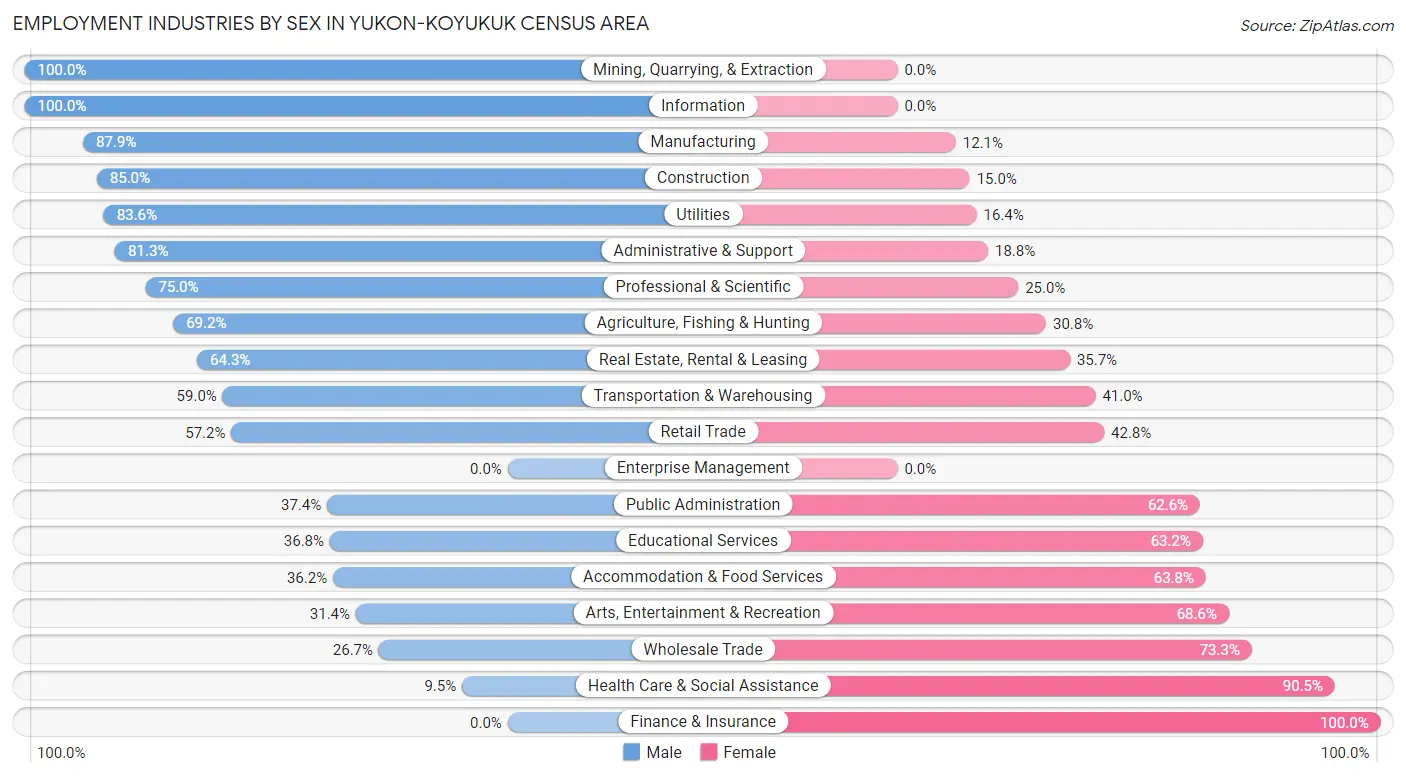
| Industry | Male | Female |
| Agriculture, Fishing & Hunting | 9 (69.2%) | 4 (30.8%) |
| Mining, Quarrying, & Extraction | 117 (100.0%) | 0 (0.0%) |
| Construction | 108 (85.0%) | 19 (15.0%) |
| Manufacturing | 160 (87.9%) | 22 (12.1%) |
| Wholesale Trade | 4 (26.7%) | 11 (73.3%) |
| Retail Trade | 107 (57.2%) | 80 (42.8%) |
| Transportation & Warehousing | 95 (59.0%) | 66 (41.0%) |
| Utilities | 102 (83.6%) | 20 (16.4%) |
| Information | 21 (100.0%) | 0 (0.0%) |
| Finance & Insurance | 0 (0.0%) | 2 (100.0%) |
| Real Estate, Rental & Leasing | 9 (64.3%) | 5 (35.7%) |
| Professional & Scientific | 30 (75.0%) | 10 (25.0%) |
| Enterprise Management | 0 (0.0%) | 0 (0.0%) |
| Administrative & Support | 26 (81.2%) | 6 (18.8%) |
| Educational Services | 134 (36.8%) | 230 (63.2%) |
| Health Care & Social Assistance | 21 (9.5%) | 201 (90.5%) |
| Arts, Entertainment & Recreation | 11 (31.4%) | 24 (68.6%) |
| Accommodation & Food Services | 17 (36.2%) | 30 (63.8%) |
| Public Administration | 212 (37.4%) | 355 (62.6%) |
| Total | 1,240 (52.6%) | 1,118 (47.4%) |
Education in Yukon-Koyukuk Census Area
School Enrollment in Yukon-Koyukuk Census Area
The most common levels of schooling among the 1,319 students in Yukon-Koyukuk Census Area are elementary school (349 | 26.5%), high school (322 | 24.4%), and middle school (294 | 22.3%).
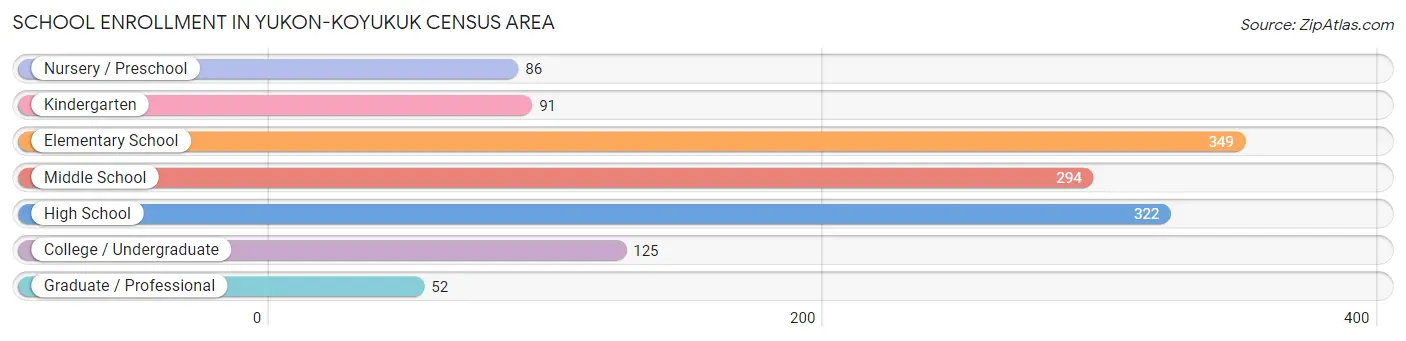
| School Level | # Students | % Students |
| Nursery / Preschool | 86 | 6.5% |
| Kindergarten | 91 | 6.9% |
| Elementary School | 349 | 26.5% |
| Middle School | 294 | 22.3% |
| High School | 322 | 24.4% |
| College / Undergraduate | 125 | 9.5% |
| Graduate / Professional | 52 | 3.9% |
| Total | 1,319 | 100.0% |
School Enrollment by Age by Funding Source in Yukon-Koyukuk Census Area
Out of a total of 1,319 students who are enrolled in schools in Yukon-Koyukuk Census Area, 63 (4.8%) attend a private institution, while the remaining 1,256 (95.2%) are enrolled in public schools. The age group of 5 to 9 year old has the highest likelihood of being enrolled in private schools, with 31 (6.8% in the age bracket) enrolled. Conversely, the age group of 3 to 4 year olds has the lowest likelihood of being enrolled in a private school, with 73 (100.0% in the age bracket) attending a public institution.
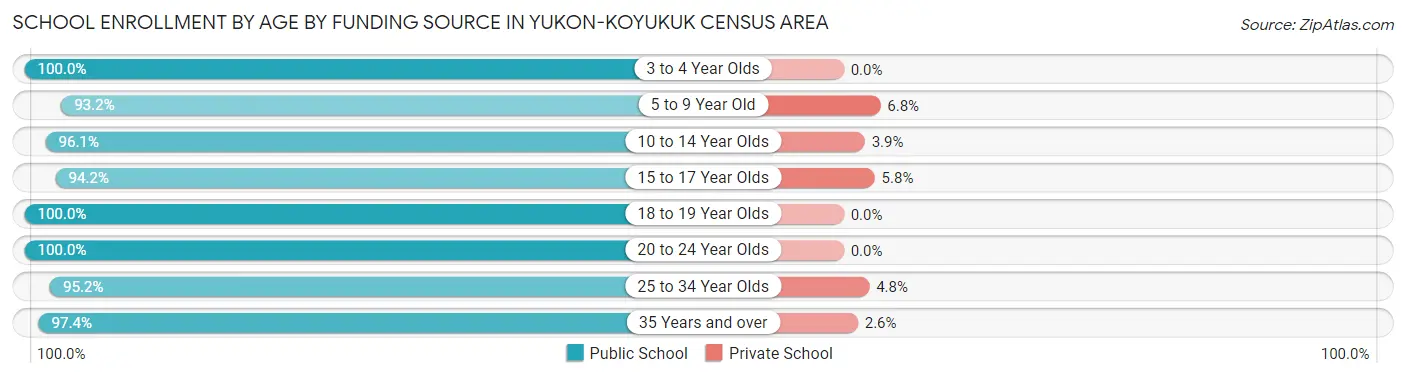
| Age Bracket | Public School | Private School |
| 3 to 4 Year Olds | 73 (100.0%) | 0 (0.0%) |
| 5 to 9 Year Old | 423 (93.2%) | 31 (6.8%) |
| 10 to 14 Year Olds | 368 (96.1%) | 15 (3.9%) |
| 15 to 17 Year Olds | 196 (94.2%) | 12 (5.8%) |
| 18 to 19 Year Olds | 25 (100.0%) | 0 (0.0%) |
| 20 to 24 Year Olds | 37 (100.0%) | 0 (0.0%) |
| 25 to 34 Year Olds | 60 (95.2%) | 3 (4.8%) |
| 35 Years and over | 74 (97.4%) | 2 (2.6%) |
| Total | 1,256 (95.2%) | 63 (4.8%) |
Educational Attainment by Field of Study in Yukon-Koyukuk Census Area
Education (183 | 34.2%), bio, nature & agricultural (69 | 12.9%), physical & health sciences (57 | 10.6%), business (41 | 7.7%), and science & technology (34 | 6.4%) are the most common fields of study among 535 individuals in Yukon-Koyukuk Census Area who have obtained a bachelor's degree or higher.
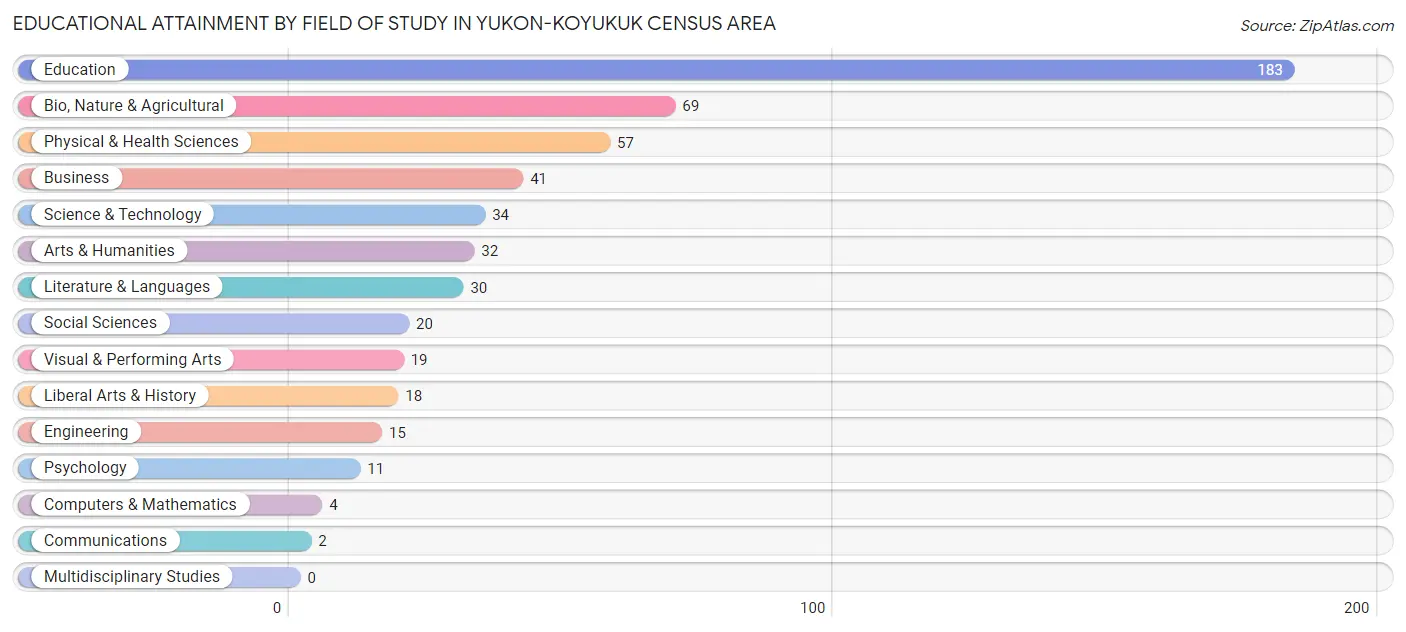
| Field of Study | # Graduates | % Graduates |
| Computers & Mathematics | 4 | 0.7% |
| Bio, Nature & Agricultural | 69 | 12.9% |
| Physical & Health Sciences | 57 | 10.6% |
| Psychology | 11 | 2.1% |
| Social Sciences | 20 | 3.7% |
| Engineering | 15 | 2.8% |
| Multidisciplinary Studies | 0 | 0.0% |
| Science & Technology | 34 | 6.4% |
| Business | 41 | 7.7% |
| Education | 183 | 34.2% |
| Literature & Languages | 30 | 5.6% |
| Liberal Arts & History | 18 | 3.4% |
| Visual & Performing Arts | 19 | 3.5% |
| Communications | 2 | 0.4% |
| Arts & Humanities | 32 | 6.0% |
| Total | 535 | 100.0% |
Transportation & Commute in Yukon-Koyukuk Census Area
Vehicle Availability by Sex in Yukon-Koyukuk Census Area
The most prevalent vehicle ownership categories in Yukon-Koyukuk Census Area are males with no vehicle (337, accounting for 40.4%) and females with no vehicle (392, making up 34.1%).
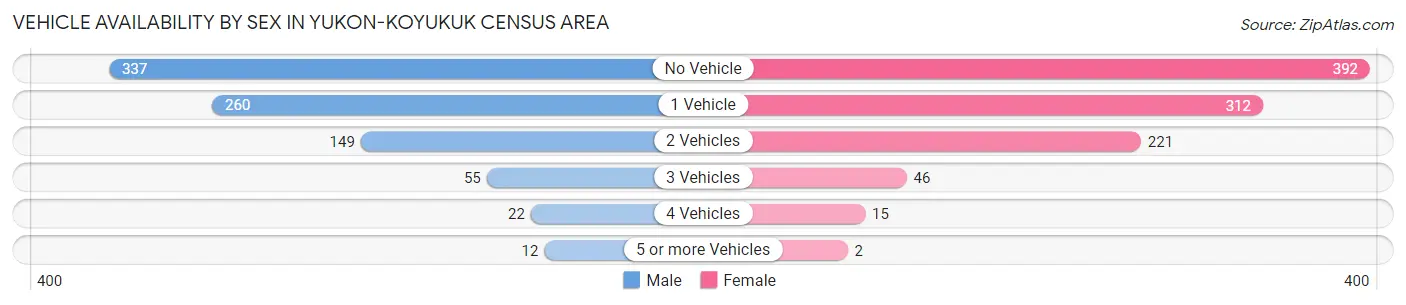
| Vehicles Available | Male | Female |
| No Vehicle | 337 (40.4%) | 392 (39.7%) |
| 1 Vehicle | 260 (31.1%) | 312 (31.6%) |
| 2 Vehicles | 149 (17.8%) | 221 (22.4%) |
| 3 Vehicles | 55 (6.6%) | 46 (4.7%) |
| 4 Vehicles | 22 (2.6%) | 15 (1.5%) |
| 5 or more Vehicles | 12 (1.4%) | 2 (0.2%) |
| Total | 835 (100.0%) | 988 (100.0%) |
Commute Time in Yukon-Koyukuk Census Area
The most frequently occuring commute durations in Yukon-Koyukuk Census Area are less than 5 minutes (754 commuters, 36.0%), 5 to 9 minutes (739 commuters, 35.2%), and 10 to 14 minutes (346 commuters, 16.5%).
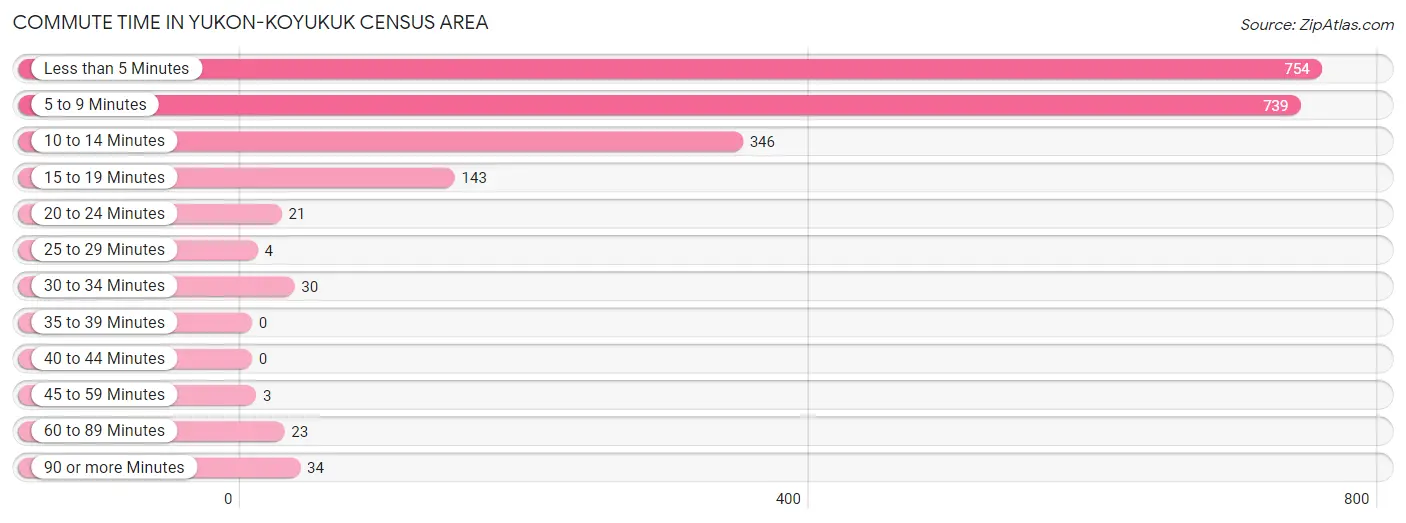
| Commute Time | # Commuters | % Commuters |
| Less than 5 Minutes | 754 | 36.0% |
| 5 to 9 Minutes | 739 | 35.2% |
| 10 to 14 Minutes | 346 | 16.5% |
| 15 to 19 Minutes | 143 | 6.8% |
| 20 to 24 Minutes | 21 | 1.0% |
| 25 to 29 Minutes | 4 | 0.2% |
| 30 to 34 Minutes | 30 | 1.4% |
| 35 to 39 Minutes | 0 | 0.0% |
| 40 to 44 Minutes | 0 | 0.0% |
| 45 to 59 Minutes | 3 | 0.1% |
| 60 to 89 Minutes | 23 | 1.1% |
| 90 or more Minutes | 34 | 1.6% |
Commute Time by Sex in Yukon-Koyukuk Census Area
The most common commute times in Yukon-Koyukuk Census Area are 5 to 9 minutes (403 commuters, 36.7%) for males and less than 5 minutes (423 commuters, 42.3%) for females.
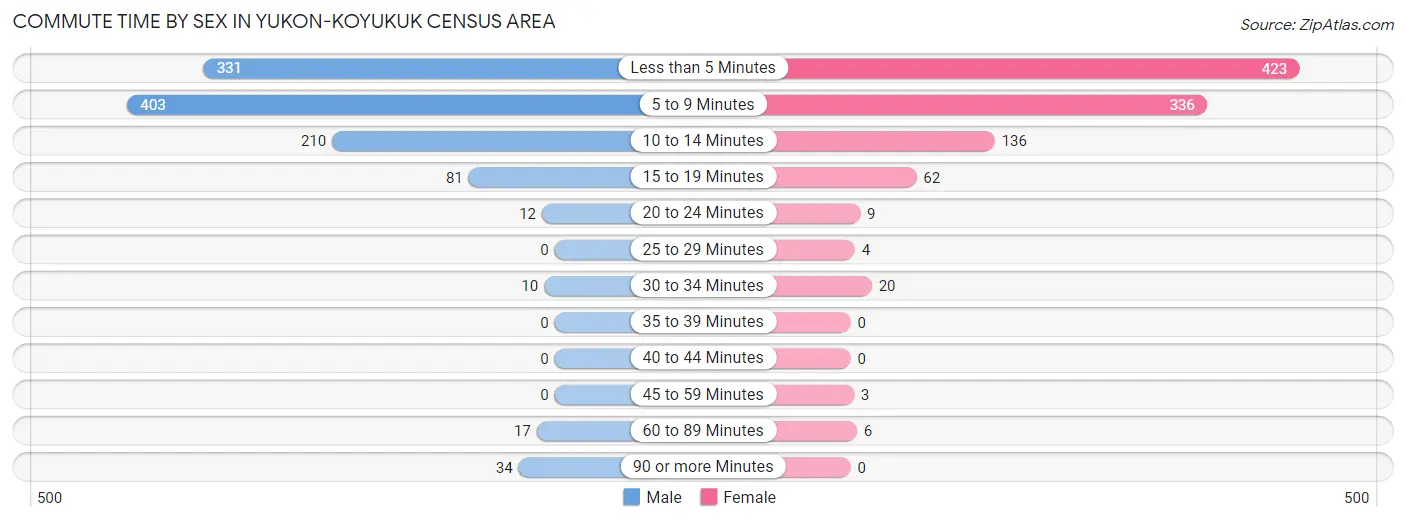
| Commute Time | Male | Female |
| Less than 5 Minutes | 331 (30.1%) | 423 (42.3%) |
| 5 to 9 Minutes | 403 (36.7%) | 336 (33.6%) |
| 10 to 14 Minutes | 210 (19.1%) | 136 (13.6%) |
| 15 to 19 Minutes | 81 (7.4%) | 62 (6.2%) |
| 20 to 24 Minutes | 12 (1.1%) | 9 (0.9%) |
| 25 to 29 Minutes | 0 (0.0%) | 4 (0.4%) |
| 30 to 34 Minutes | 10 (0.9%) | 20 (2.0%) |
| 35 to 39 Minutes | 0 (0.0%) | 0 (0.0%) |
| 40 to 44 Minutes | 0 (0.0%) | 0 (0.0%) |
| 45 to 59 Minutes | 0 (0.0%) | 3 (0.3%) |
| 60 to 89 Minutes | 17 (1.5%) | 6 (0.6%) |
| 90 or more Minutes | 34 (3.1%) | 0 (0.0%) |
Time of Departure to Work by Sex in Yukon-Koyukuk Census Area
The most frequent times of departure to work in Yukon-Koyukuk Census Area are 7:30 AM to 7:59 AM (175, 15.9%) for males and 7:30 AM to 7:59 AM (336, 33.6%) for females.
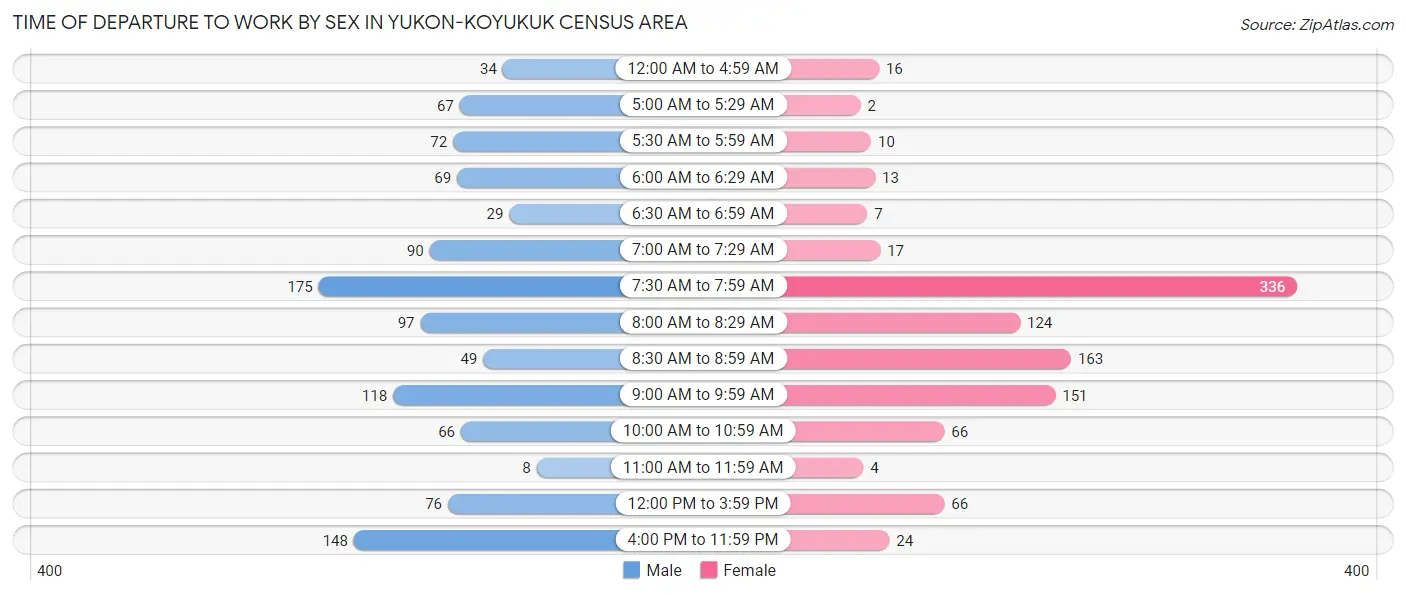
| Time of Departure | Male | Female |
| 12:00 AM to 4:59 AM | 34 (3.1%) | 16 (1.6%) |
| 5:00 AM to 5:29 AM | 67 (6.1%) | 2 (0.2%) |
| 5:30 AM to 5:59 AM | 72 (6.6%) | 10 (1.0%) |
| 6:00 AM to 6:29 AM | 69 (6.3%) | 13 (1.3%) |
| 6:30 AM to 6:59 AM | 29 (2.6%) | 7 (0.7%) |
| 7:00 AM to 7:29 AM | 90 (8.2%) | 17 (1.7%) |
| 7:30 AM to 7:59 AM | 175 (15.9%) | 336 (33.6%) |
| 8:00 AM to 8:29 AM | 97 (8.8%) | 124 (12.4%) |
| 8:30 AM to 8:59 AM | 49 (4.5%) | 163 (16.3%) |
| 9:00 AM to 9:59 AM | 118 (10.7%) | 151 (15.1%) |
| 10:00 AM to 10:59 AM | 66 (6.0%) | 66 (6.6%) |
| 11:00 AM to 11:59 AM | 8 (0.7%) | 4 (0.4%) |
| 12:00 PM to 3:59 PM | 76 (6.9%) | 66 (6.6%) |
| 4:00 PM to 11:59 PM | 148 (13.5%) | 24 (2.4%) |
| Total | 1,098 (100.0%) | 999 (100.0%) |
Housing Occupancy in Yukon-Koyukuk Census Area
Occupancy by Ownership in Yukon-Koyukuk Census Area
Of the total 2,078 dwellings in Yukon-Koyukuk Census Area, owner-occupied units account for 1,504 (72.4%), while renter-occupied units make up 574 (27.6%).
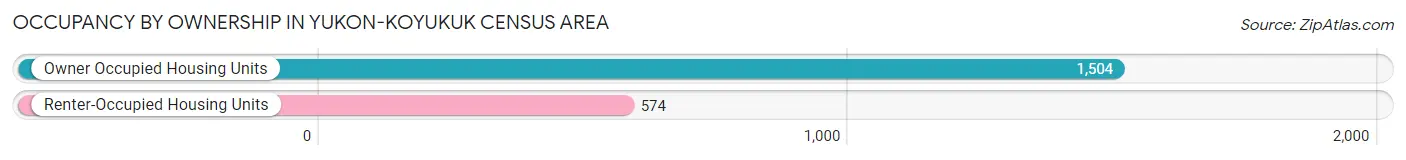
| Occupancy | # Housing Units | % Housing Units |
| Owner Occupied Housing Units | 1,504 | 72.4% |
| Renter-Occupied Housing Units | 574 | 27.6% |
| Total Occupied Housing Units | 2,078 | 100.0% |
Occupancy by Household Size in Yukon-Koyukuk Census Area
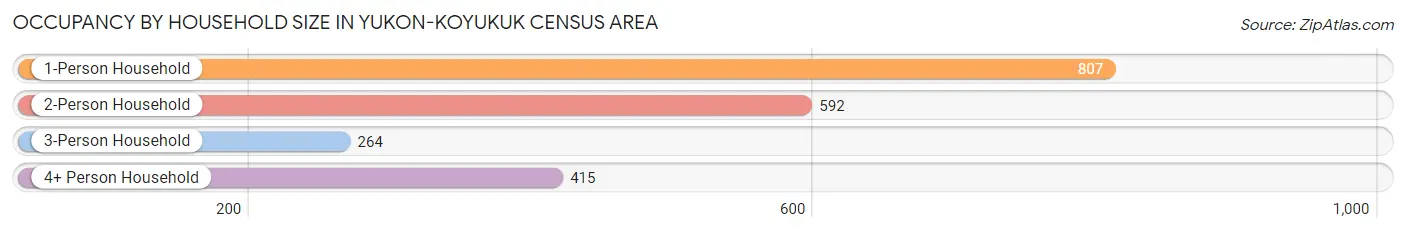
| Household Size | # Housing Units | % Housing Units |
| 1-Person Household | 807 | 38.8% |
| 2-Person Household | 592 | 28.5% |
| 3-Person Household | 264 | 12.7% |
| 4+ Person Household | 415 | 20.0% |
| Total Housing Units | 2,078 | 100.0% |
Occupancy by Ownership by Household Size in Yukon-Koyukuk Census Area
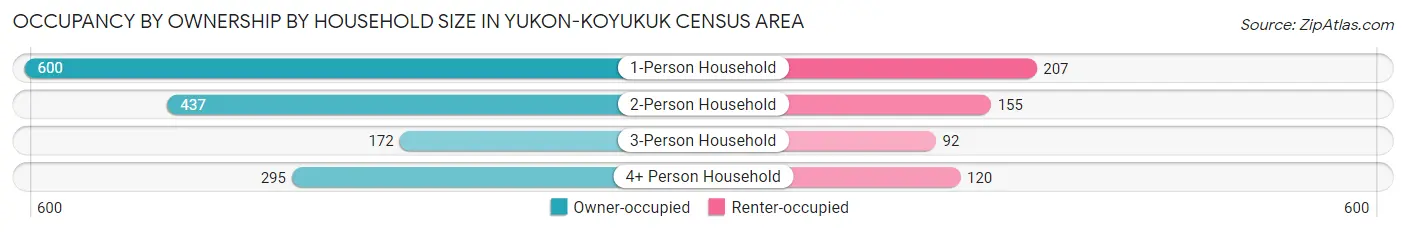
| Household Size | Owner-occupied | Renter-occupied |
| 1-Person Household | 600 (74.4%) | 207 (25.7%) |
| 2-Person Household | 437 (73.8%) | 155 (26.2%) |
| 3-Person Household | 172 (65.1%) | 92 (34.8%) |
| 4+ Person Household | 295 (71.1%) | 120 (28.9%) |
| Total Housing Units | 1,504 (72.4%) | 574 (27.6%) |
Occupancy by Educational Attainment in Yukon-Koyukuk Census Area
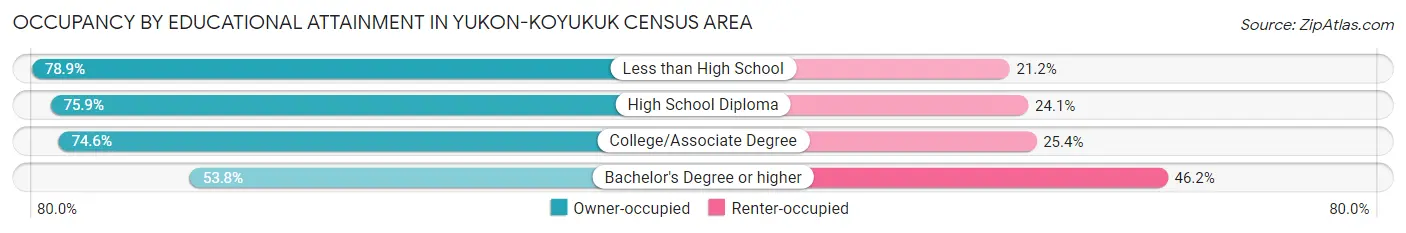
| Household Size | Owner-occupied | Renter-occupied |
| Less than High School | 246 (78.8%) | 66 (21.1%) |
| High School Diploma | 557 (75.9%) | 177 (24.1%) |
| College/Associate Degree | 523 (74.6%) | 178 (25.4%) |
| Bachelor's Degree or higher | 178 (53.8%) | 153 (46.2%) |
Occupancy by Age of Householder in Yukon-Koyukuk Census Area
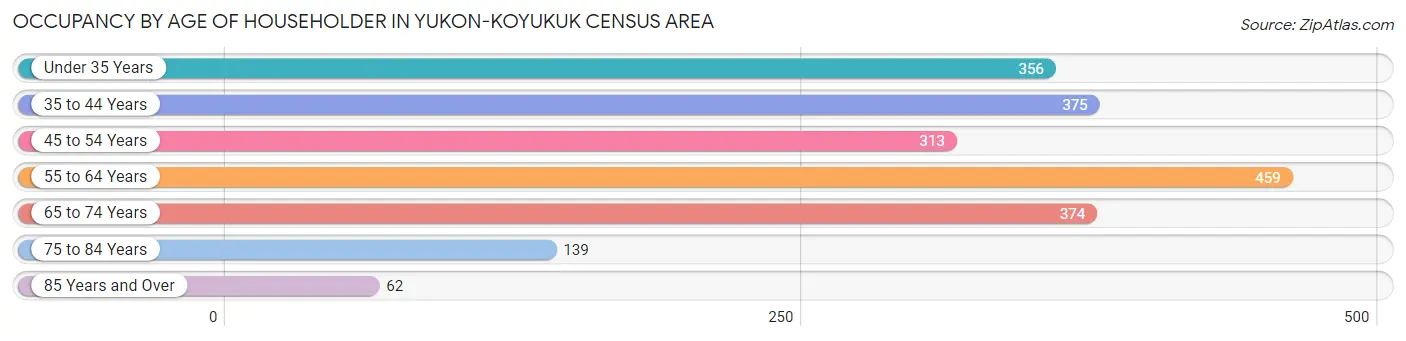
| Age Bracket | # Households | % Households |
| Under 35 Years | 356 | 17.1% |
| 35 to 44 Years | 375 | 18.0% |
| 45 to 54 Years | 313 | 15.1% |
| 55 to 64 Years | 459 | 22.1% |
| 65 to 74 Years | 374 | 18.0% |
| 75 to 84 Years | 139 | 6.7% |
| 85 Years and Over | 62 | 3.0% |
| Total | 2,078 | 100.0% |
Housing Finances in Yukon-Koyukuk Census Area
Median Income by Occupancy in Yukon-Koyukuk Census Area
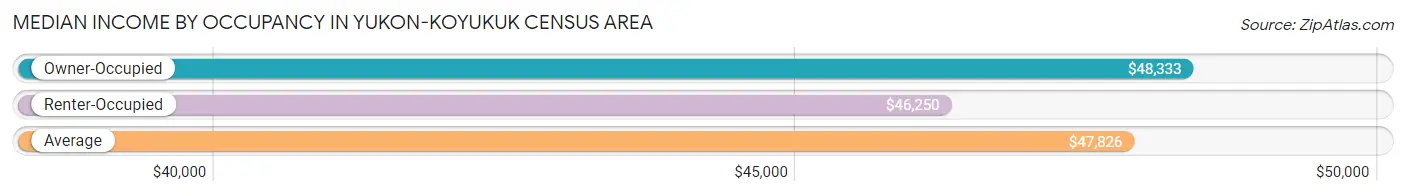
| Occupancy Type | # Households | Median Income |
| Owner-Occupied | 1,504 (72.4%) | $48,333 |
| Renter-Occupied | 574 (27.6%) | $46,250 |
| Average | 2,078 (100.0%) | $47,826 |
Occupancy by Householder Income Bracket in Yukon-Koyukuk Census Area
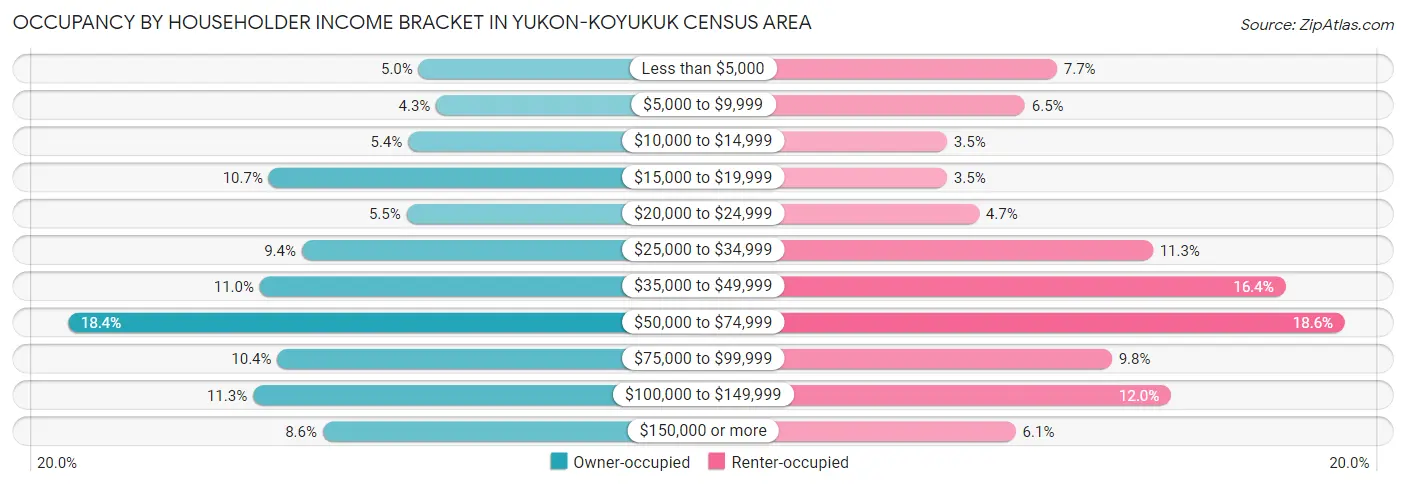
| Income Bracket | Owner-occupied | Renter-occupied |
| Less than $5,000 | 75 (5.0%) | 44 (7.7%) |
| $5,000 to $9,999 | 65 (4.3%) | 37 (6.5%) |
| $10,000 to $14,999 | 81 (5.4%) | 20 (3.5%) |
| $15,000 to $19,999 | 161 (10.7%) | 20 (3.5%) |
| $20,000 to $24,999 | 82 (5.4%) | 27 (4.7%) |
| $25,000 to $34,999 | 142 (9.4%) | 65 (11.3%) |
| $35,000 to $49,999 | 166 (11.0%) | 94 (16.4%) |
| $50,000 to $74,999 | 276 (18.3%) | 107 (18.6%) |
| $75,000 to $99,999 | 156 (10.4%) | 56 (9.8%) |
| $100,000 to $149,999 | 170 (11.3%) | 69 (12.0%) |
| $150,000 or more | 130 (8.6%) | 35 (6.1%) |
| Total | 1,504 (100.0%) | 574 (100.0%) |
Monthly Housing Cost Tiers in Yukon-Koyukuk Census Area
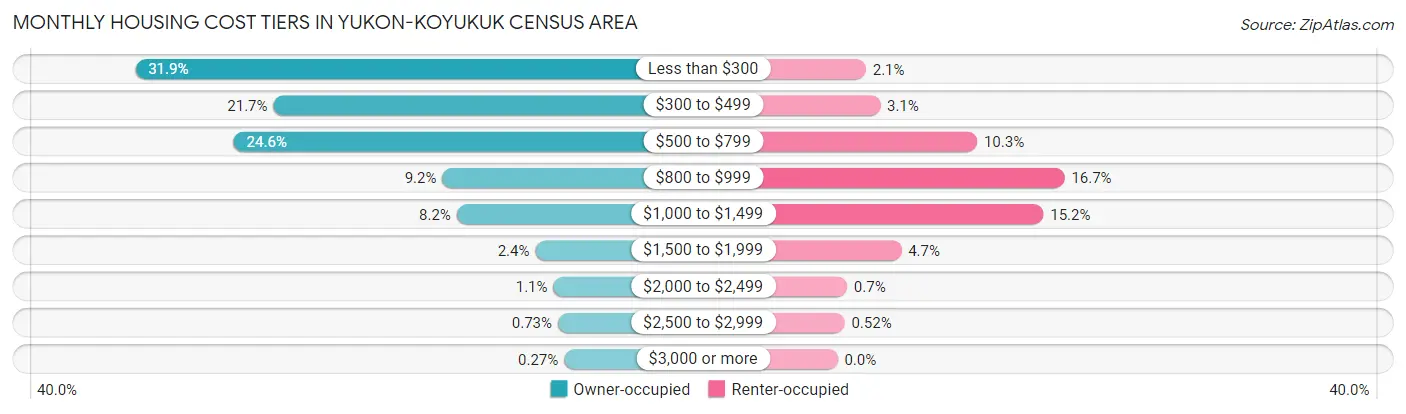
| Monthly Cost | Owner-occupied | Renter-occupied |
| Less than $300 | 479 (31.9%) | 12 (2.1%) |
| $300 to $499 | 326 (21.7%) | 18 (3.1%) |
| $500 to $799 | 370 (24.6%) | 59 (10.3%) |
| $800 to $999 | 139 (9.2%) | 96 (16.7%) |
| $1,000 to $1,499 | 123 (8.2%) | 87 (15.2%) |
| $1,500 to $1,999 | 36 (2.4%) | 27 (4.7%) |
| $2,000 to $2,499 | 16 (1.1%) | 4 (0.7%) |
| $2,500 to $2,999 | 11 (0.7%) | 3 (0.5%) |
| $3,000 or more | 4 (0.3%) | 0 (0.0%) |
| Total | 1,504 (100.0%) | 574 (100.0%) |
Physical Housing Characteristics in Yukon-Koyukuk Census Area
Housing Structures in Yukon-Koyukuk Census Area
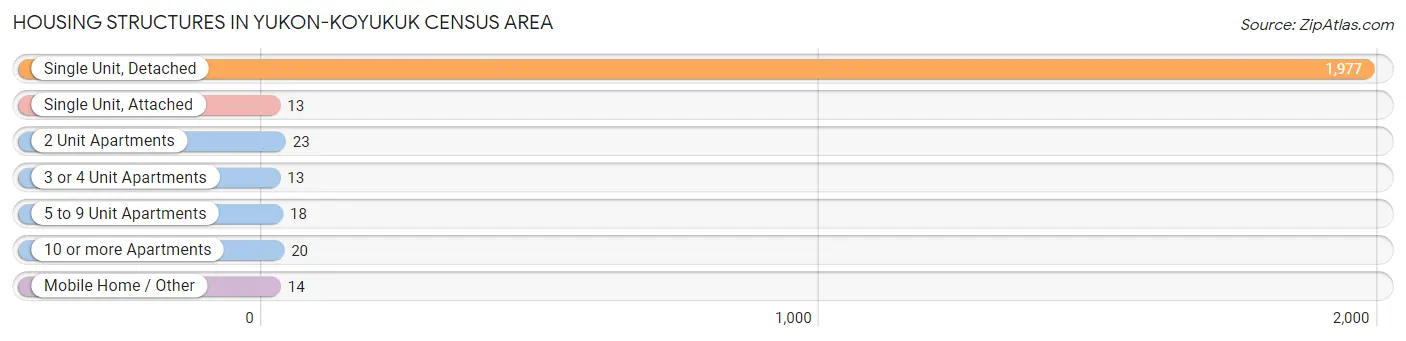
| Structure Type | # Housing Units | % Housing Units |
| Single Unit, Detached | 1,977 | 95.1% |
| Single Unit, Attached | 13 | 0.6% |
| 2 Unit Apartments | 23 | 1.1% |
| 3 or 4 Unit Apartments | 13 | 0.6% |
| 5 to 9 Unit Apartments | 18 | 0.9% |
| 10 or more Apartments | 20 | 1.0% |
| Mobile Home / Other | 14 | 0.7% |
| Total | 2,078 | 100.0% |
Housing Structures by Occupancy in Yukon-Koyukuk Census Area
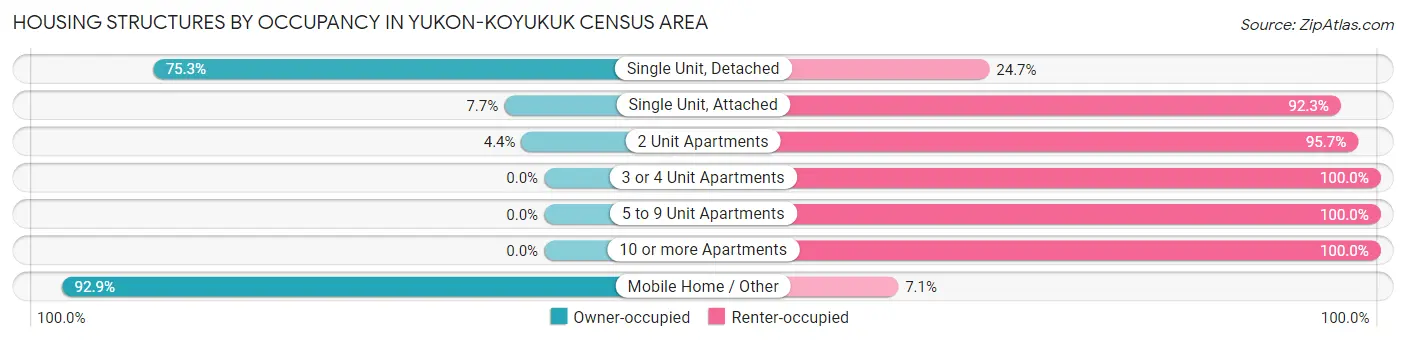
| Structure Type | Owner-occupied | Renter-occupied |
| Single Unit, Detached | 1,489 (75.3%) | 488 (24.7%) |
| Single Unit, Attached | 1 (7.7%) | 12 (92.3%) |
| 2 Unit Apartments | 1 (4.3%) | 22 (95.7%) |
| 3 or 4 Unit Apartments | 0 (0.0%) | 13 (100.0%) |
| 5 to 9 Unit Apartments | 0 (0.0%) | 18 (100.0%) |
| 10 or more Apartments | 0 (0.0%) | 20 (100.0%) |
| Mobile Home / Other | 13 (92.9%) | 1 (7.1%) |
| Total | 1,504 (72.4%) | 574 (27.6%) |
Housing Structures by Number of Rooms in Yukon-Koyukuk Census Area
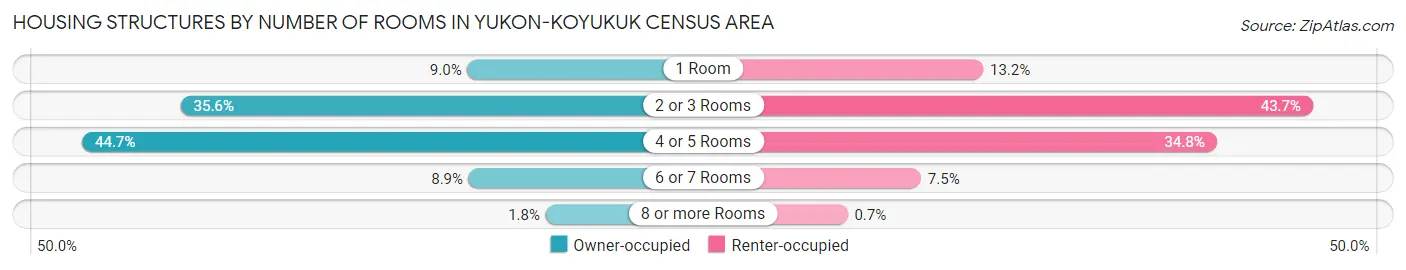
| Number of Rooms | Owner-occupied | Renter-occupied |
| 1 Room | 136 (9.0%) | 76 (13.2%) |
| 2 or 3 Rooms | 535 (35.6%) | 251 (43.7%) |
| 4 or 5 Rooms | 672 (44.7%) | 200 (34.8%) |
| 6 or 7 Rooms | 134 (8.9%) | 43 (7.5%) |
| 8 or more Rooms | 27 (1.8%) | 4 (0.7%) |
| Total | 1,504 (100.0%) | 574 (100.0%) |
Housing Structure by Heating Type in Yukon-Koyukuk Census Area
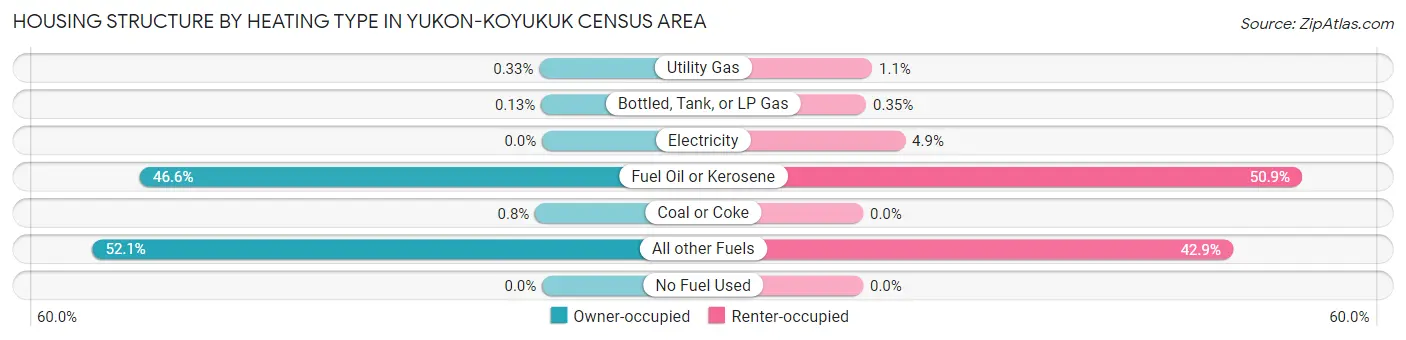
| Heating Type | Owner-occupied | Renter-occupied |
| Utility Gas | 5 (0.3%) | 6 (1.1%) |
| Bottled, Tank, or LP Gas | 2 (0.1%) | 2 (0.4%) |
| Electricity | 0 (0.0%) | 28 (4.9%) |
| Fuel Oil or Kerosene | 701 (46.6%) | 292 (50.9%) |
| Coal or Coke | 12 (0.8%) | 0 (0.0%) |
| All other Fuels | 784 (52.1%) | 246 (42.9%) |
| No Fuel Used | 0 (0.0%) | 0 (0.0%) |
| Total | 1,504 (100.0%) | 574 (100.0%) |
Household Vehicle Usage in Yukon-Koyukuk Census Area
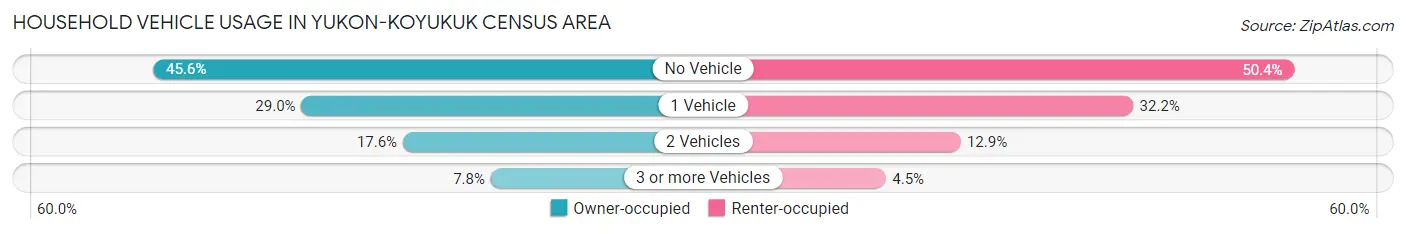
| Vehicles per Household | Owner-occupied | Renter-occupied |
| No Vehicle | 686 (45.6%) | 289 (50.3%) |
| 1 Vehicle | 436 (29.0%) | 185 (32.2%) |
| 2 Vehicles | 265 (17.6%) | 74 (12.9%) |
| 3 or more Vehicles | 117 (7.8%) | 26 (4.5%) |
| Total | 1,504 (100.0%) | 574 (100.0%) |
Real Estate & Mortgages in Yukon-Koyukuk Census Area
Real Estate and Mortgage Overview in Yukon-Koyukuk Census Area
| Characteristic | Without Mortgage | With Mortgage |
| Housing Units | 1,275 | 229 |
| Median Property Value | $76,600 | $161,300 |
| Median Household Income | $43,125 | $31 |
| Monthly Housing Costs | $395 | $4 |
| Real Estate Taxes | - | - |
Property Value by Mortgage Status in Yukon-Koyukuk Census Area
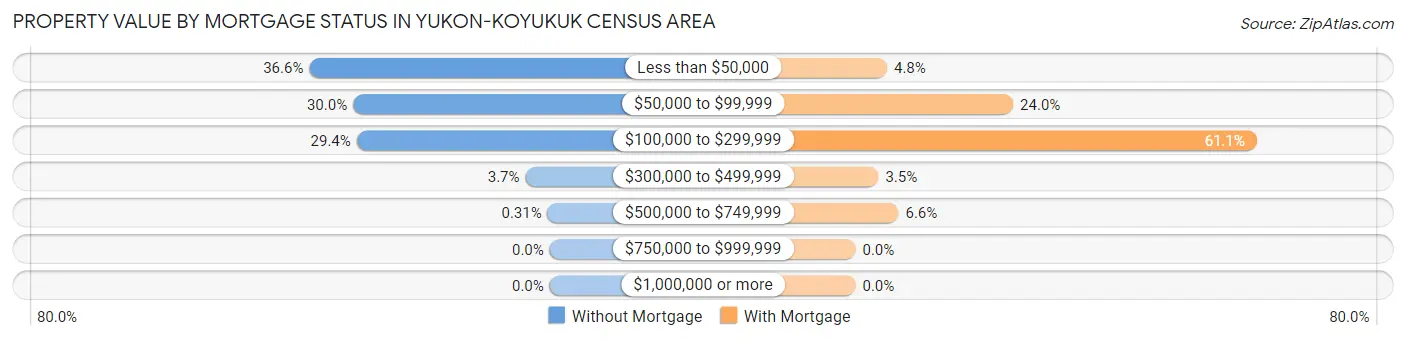
| Property Value | Without Mortgage | With Mortgage |
| Less than $50,000 | 467 (36.6%) | 11 (4.8%) |
| $50,000 to $99,999 | 382 (30.0%) | 55 (24.0%) |
| $100,000 to $299,999 | 375 (29.4%) | 140 (61.1%) |
| $300,000 to $499,999 | 47 (3.7%) | 8 (3.5%) |
| $500,000 to $749,999 | 4 (0.3%) | 15 (6.6%) |
| $750,000 to $999,999 | 0 (0.0%) | 0 (0.0%) |
| $1,000,000 or more | 0 (0.0%) | 0 (0.0%) |
| Total | 1,275 (100.0%) | 229 (100.0%) |
Household Income by Mortgage Status in Yukon-Koyukuk Census Area
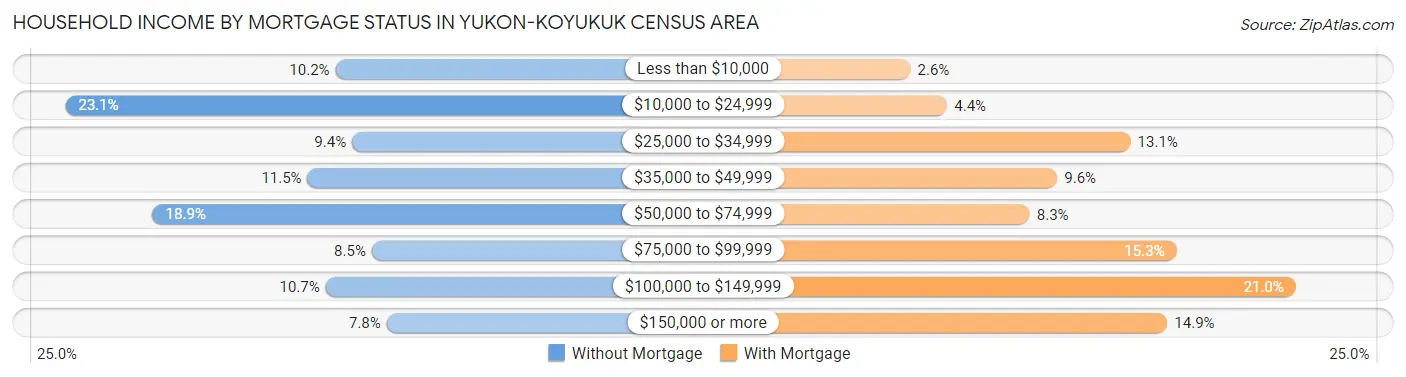
| Household Income | Without Mortgage | With Mortgage |
| Less than $10,000 | 130 (10.2%) | 6 (2.6%) |
| $10,000 to $24,999 | 294 (23.1%) | 10 (4.4%) |
| $25,000 to $34,999 | 120 (9.4%) | 30 (13.1%) |
| $35,000 to $49,999 | 147 (11.5%) | 22 (9.6%) |
| $50,000 to $74,999 | 241 (18.9%) | 19 (8.3%) |
| $75,000 to $99,999 | 108 (8.5%) | 35 (15.3%) |
| $100,000 to $149,999 | 136 (10.7%) | 48 (21.0%) |
| $150,000 or more | 99 (7.8%) | 34 (14.8%) |
| Total | 1,275 (100.0%) | 229 (100.0%) |
Property Value to Household Income Ratio in Yukon-Koyukuk Census Area
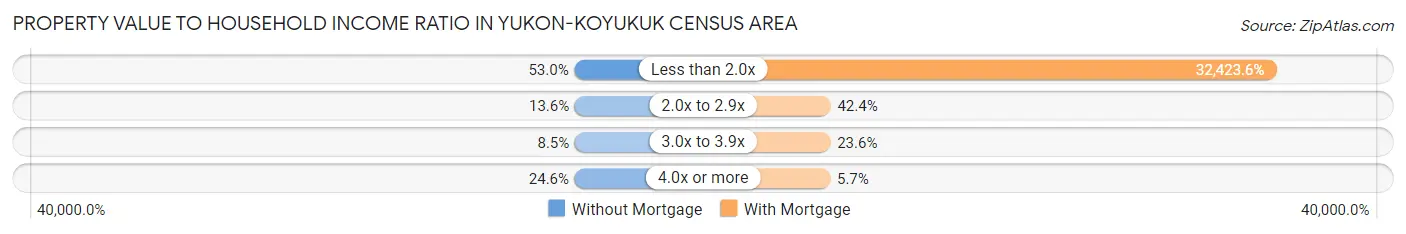
| Value-to-Income Ratio | Without Mortgage | With Mortgage |
| Less than 2.0x | 676 (53.0%) | 74,250 (32,423.6%) |
| 2.0x to 2.9x | 173 (13.6%) | 97 (42.4%) |
| 3.0x to 3.9x | 108 (8.5%) | 54 (23.6%) |
| 4.0x or more | 314 (24.6%) | 13 (5.7%) |
| Total | 1,275 (100.0%) | 229 (100.0%) |
Real Estate Taxes by Mortgage Status in Yukon-Koyukuk Census Area
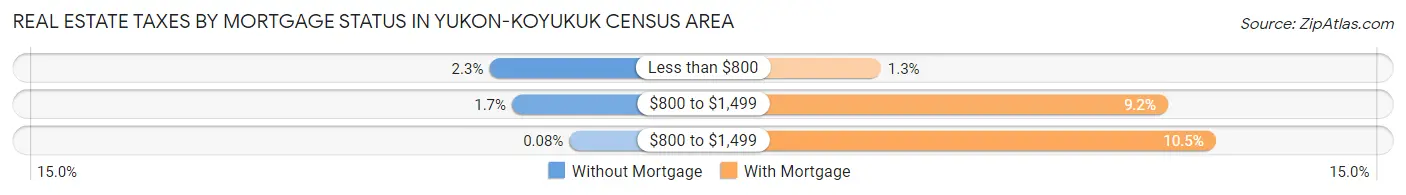
| Property Taxes | Without Mortgage | With Mortgage |
| Less than $800 | 29 (2.3%) | 3 (1.3%) |
| $800 to $1,499 | 21 (1.7%) | 21 (9.2%) |
| $800 to $1,499 | 1 (0.1%) | 24 (10.5%) |
| Total | 1,275 (100.0%) | 229 (100.0%) |
Health & Disability in Yukon-Koyukuk Census Area
Health Insurance Coverage by Age in Yukon-Koyukuk Census Area
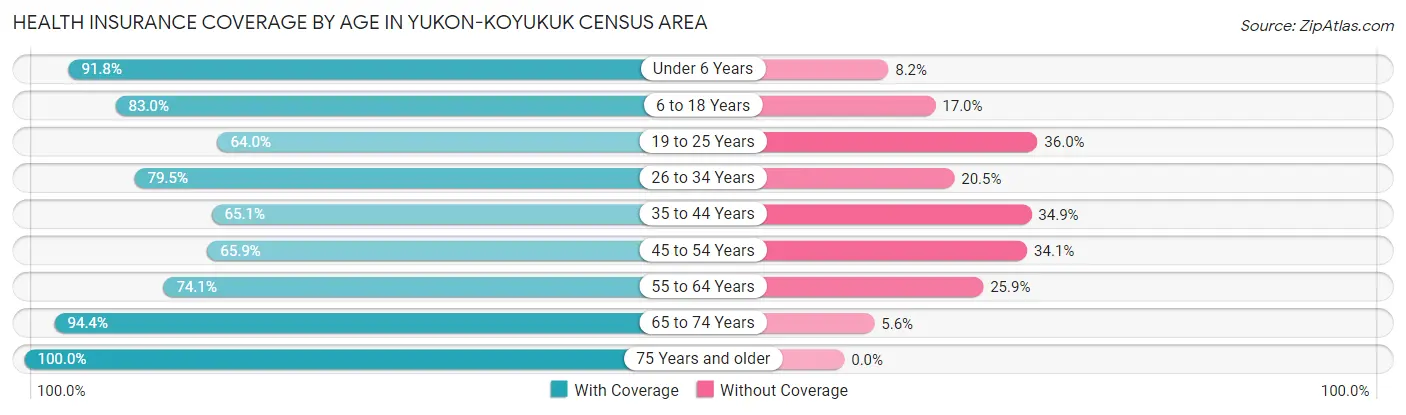
| Age Bracket | With Coverage | Without Coverage |
| Under 6 Years | 448 (91.8%) | 40 (8.2%) |
| 6 to 18 Years | 851 (83.0%) | 174 (17.0%) |
| 19 to 25 Years | 263 (64.0%) | 148 (36.0%) |
| 26 to 34 Years | 531 (79.5%) | 137 (20.5%) |
| 35 to 44 Years | 418 (65.1%) | 224 (34.9%) |
| 45 to 54 Years | 344 (65.9%) | 178 (34.1%) |
| 55 to 64 Years | 529 (74.1%) | 185 (25.9%) |
| 65 to 74 Years | 573 (94.4%) | 34 (5.6%) |
| 75 Years and older | 253 (100.0%) | 0 (0.0%) |
| Total | 4,210 (79.0%) | 1,120 (21.0%) |
Health Insurance Coverage by Citizenship Status in Yukon-Koyukuk Census Area
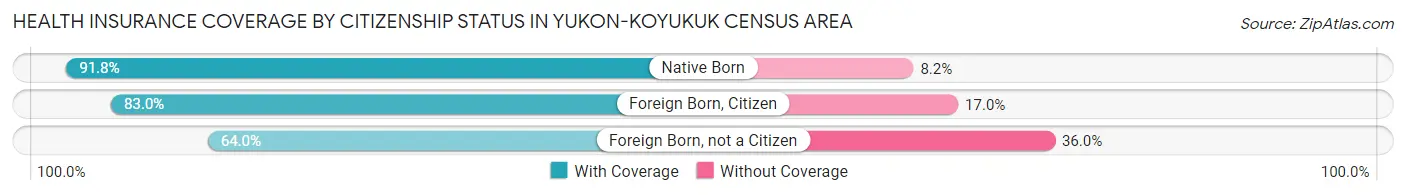
| Citizenship Status | With Coverage | Without Coverage |
| Native Born | 448 (91.8%) | 40 (8.2%) |
| Foreign Born, Citizen | 851 (83.0%) | 174 (17.0%) |
| Foreign Born, not a Citizen | 263 (64.0%) | 148 (36.0%) |
Health Insurance Coverage by Household Income in Yukon-Koyukuk Census Area
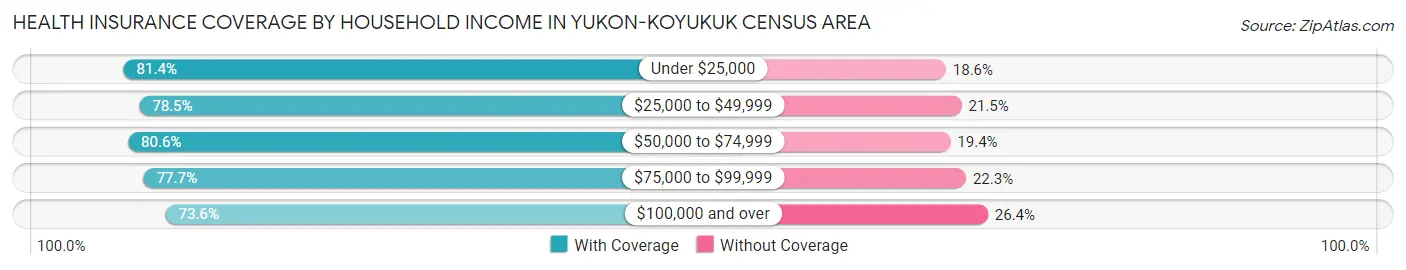
| Household Income | With Coverage | Without Coverage |
| Under $25,000 | 737 (81.4%) | 168 (18.6%) |
| $25,000 to $49,999 | 905 (78.5%) | 248 (21.5%) |
| $50,000 to $74,999 | 818 (80.6%) | 197 (19.4%) |
| $75,000 to $99,999 | 494 (77.7%) | 142 (22.3%) |
| $100,000 and over | 874 (73.6%) | 314 (26.4%) |
Public vs Private Health Insurance Coverage by Age in Yukon-Koyukuk Census Area
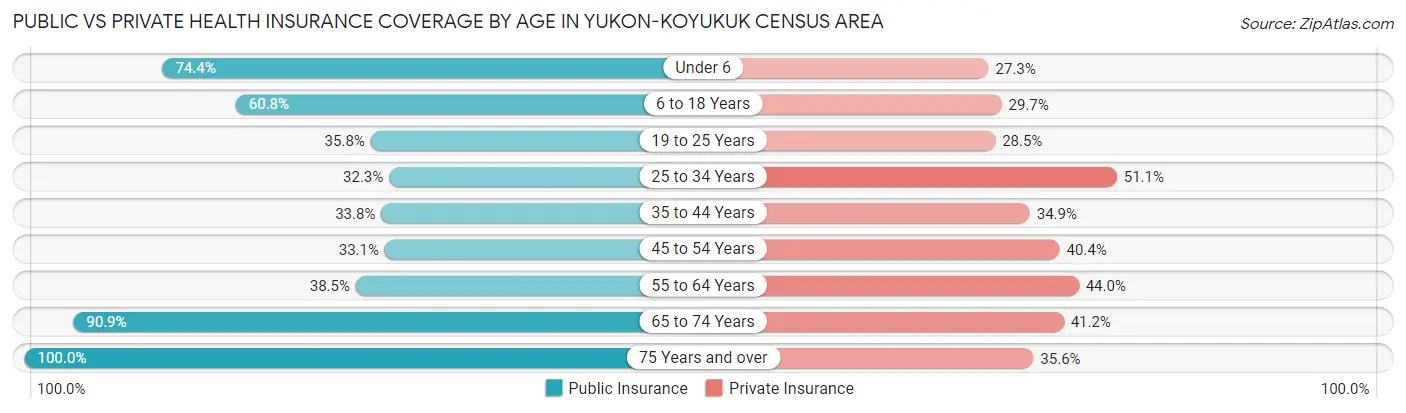
| Age Bracket | Public Insurance | Private Insurance |
| Under 6 | 363 (74.4%) | 133 (27.3%) |
| 6 to 18 Years | 623 (60.8%) | 304 (29.7%) |
| 19 to 25 Years | 147 (35.8%) | 117 (28.5%) |
| 25 to 34 Years | 216 (32.3%) | 341 (51.0%) |
| 35 to 44 Years | 217 (33.8%) | 224 (34.9%) |
| 45 to 54 Years | 173 (33.1%) | 211 (40.4%) |
| 55 to 64 Years | 275 (38.5%) | 314 (44.0%) |
| 65 to 74 Years | 552 (90.9%) | 250 (41.2%) |
| 75 Years and over | 253 (100.0%) | 90 (35.6%) |
| Total | 2,819 (52.9%) | 1,984 (37.2%) |
Disability Status by Sex by Age in Yukon-Koyukuk Census Area
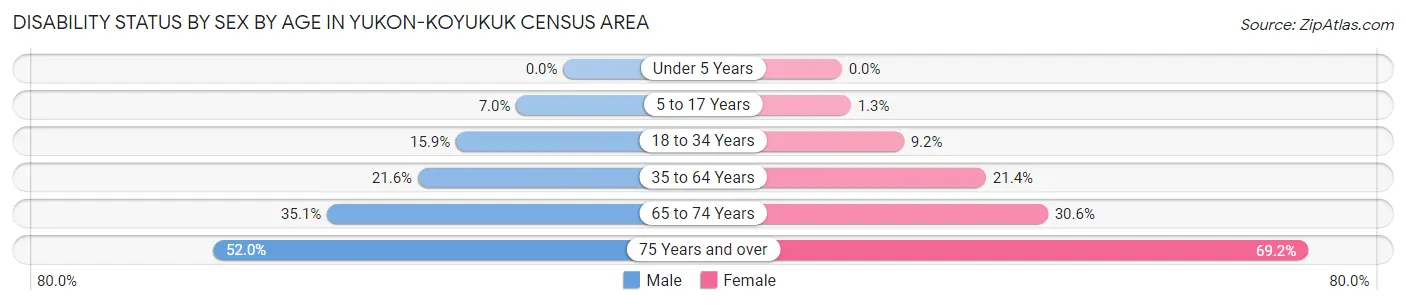
| Age Bracket | Male | Female |
| Under 5 Years | 0 (0.0%) | 0 (0.0%) |
| 5 to 17 Years | 38 (7.0%) | 7 (1.3%) |
| 18 to 34 Years | 92 (15.9%) | 51 (9.2%) |
| 35 to 64 Years | 221 (21.6%) | 183 (21.4%) |
| 65 to 74 Years | 128 (35.1%) | 74 (30.6%) |
| 75 Years and over | 64 (52.0%) | 90 (69.2%) |
Disability Class by Sex by Age in Yukon-Koyukuk Census Area
Disability Class: Hearing Difficulty
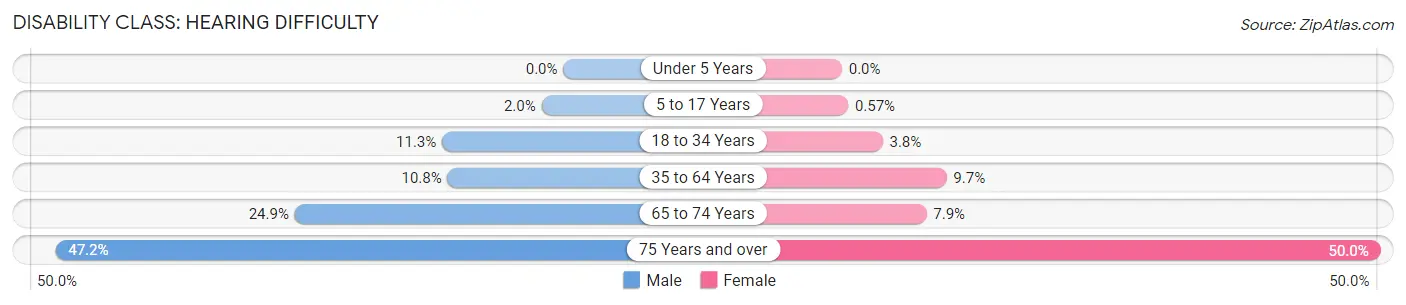
| Age Bracket | Male | Female |
| Under 5 Years | 0 (0.0%) | 0 (0.0%) |
| 5 to 17 Years | 11 (2.0%) | 3 (0.6%) |
| 18 to 34 Years | 65 (11.3%) | 21 (3.8%) |
| 35 to 64 Years | 110 (10.7%) | 83 (9.7%) |
| 65 to 74 Years | 91 (24.9%) | 19 (7.9%) |
| 75 Years and over | 58 (47.1%) | 65 (50.0%) |
Disability Class: Vision Difficulty
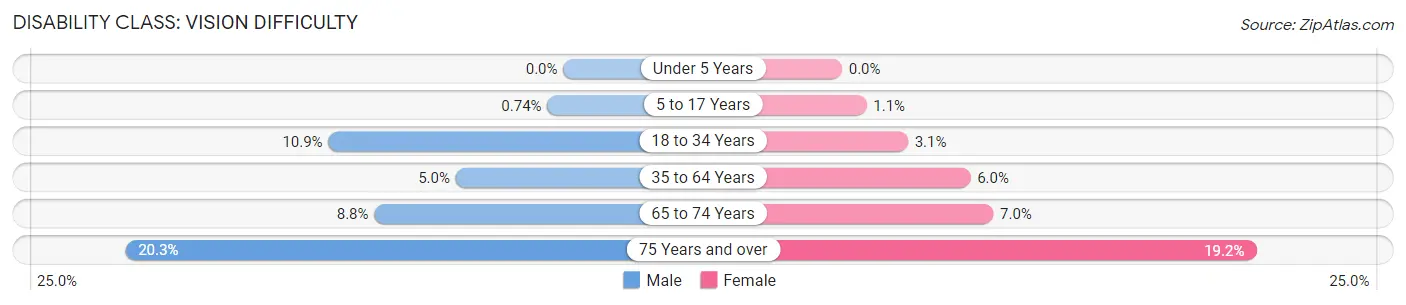
| Age Bracket | Male | Female |
| Under 5 Years | 0 (0.0%) | 0 (0.0%) |
| 5 to 17 Years | 4 (0.7%) | 6 (1.1%) |
| 18 to 34 Years | 63 (10.9%) | 17 (3.1%) |
| 35 to 64 Years | 51 (5.0%) | 51 (6.0%) |
| 65 to 74 Years | 32 (8.8%) | 17 (7.0%) |
| 75 Years and over | 25 (20.3%) | 25 (19.2%) |
Disability Class: Cognitive Difficulty
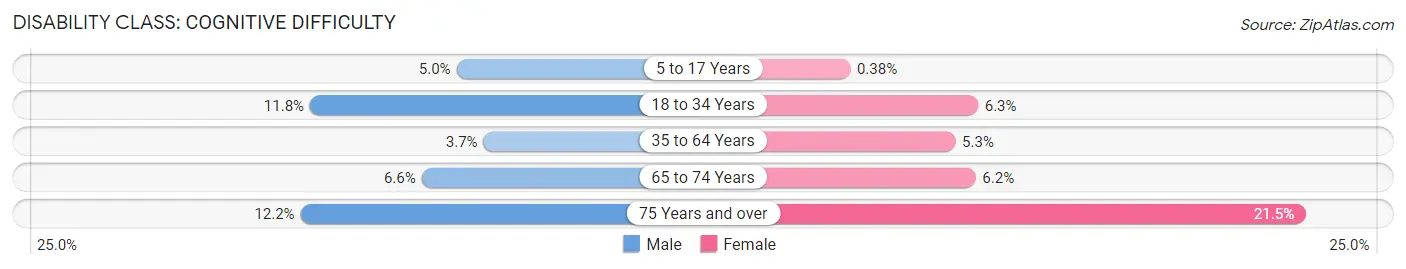
| Age Bracket | Male | Female |
| 5 to 17 Years | 27 (5.0%) | 2 (0.4%) |
| 18 to 34 Years | 68 (11.8%) | 35 (6.3%) |
| 35 to 64 Years | 38 (3.7%) | 45 (5.3%) |
| 65 to 74 Years | 24 (6.6%) | 15 (6.2%) |
| 75 Years and over | 15 (12.2%) | 28 (21.5%) |
Disability Class: Ambulatory Difficulty
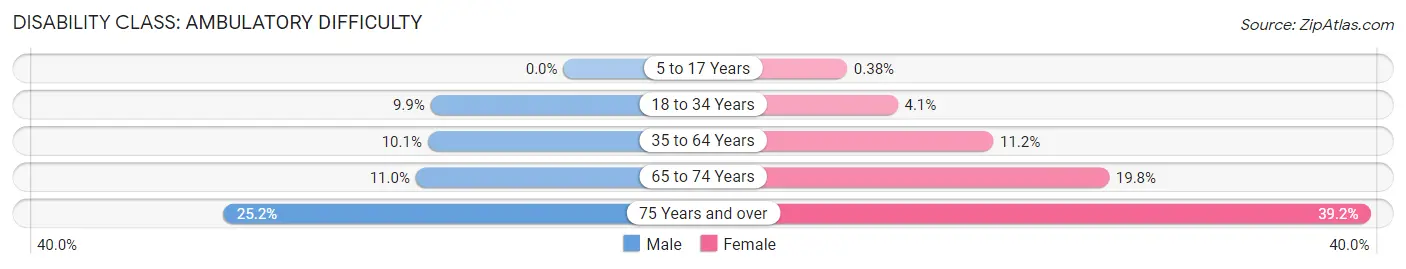
| Age Bracket | Male | Female |
| 5 to 17 Years | 0 (0.0%) | 2 (0.4%) |
| 18 to 34 Years | 57 (9.9%) | 23 (4.1%) |
| 35 to 64 Years | 103 (10.1%) | 96 (11.2%) |
| 65 to 74 Years | 40 (11.0%) | 48 (19.8%) |
| 75 Years and over | 31 (25.2%) | 51 (39.2%) |
Disability Class: Self-Care Difficulty
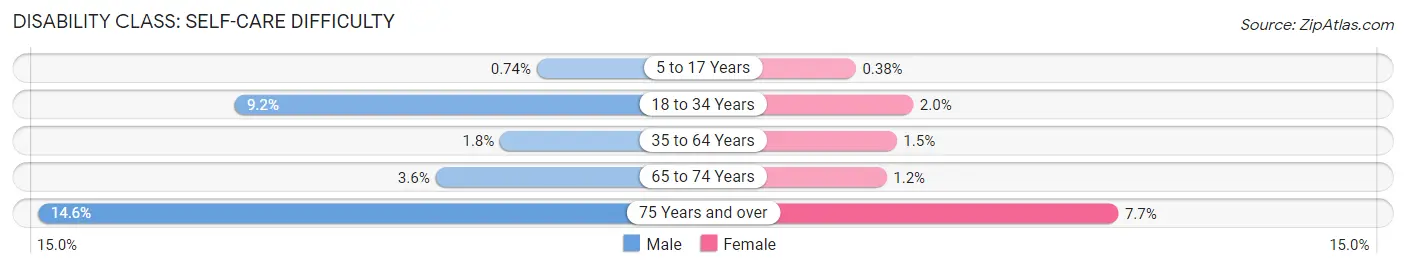
| Age Bracket | Male | Female |
| 5 to 17 Years | 4 (0.7%) | 2 (0.4%) |
| 18 to 34 Years | 53 (9.2%) | 11 (2.0%) |
| 35 to 64 Years | 18 (1.8%) | 13 (1.5%) |
| 65 to 74 Years | 13 (3.6%) | 3 (1.2%) |
| 75 Years and over | 18 (14.6%) | 10 (7.7%) |
Technology Access in Yukon-Koyukuk Census Area
Computing Device Access in Yukon-Koyukuk Census Area
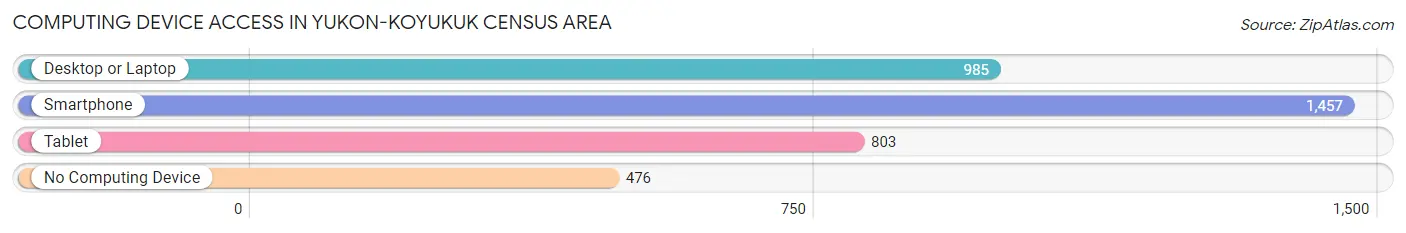
| Device Type | # Households | % Households |
| Desktop or Laptop | 985 | 47.4% |
| Smartphone | 1,457 | 70.1% |
| Tablet | 803 | 38.6% |
| No Computing Device | 476 | 22.9% |
| Total | 2,078 | 100.0% |
Internet Access in Yukon-Koyukuk Census Area
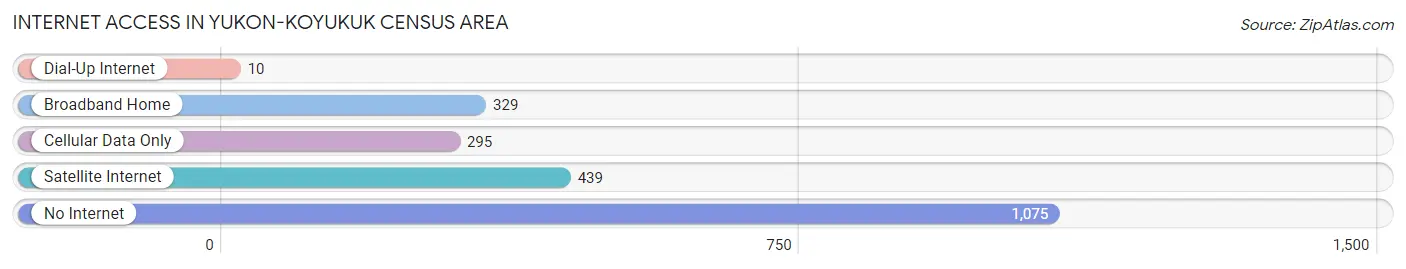
| Internet Type | # Households | % Households |
| Dial-Up Internet | 10 | 0.5% |
| Broadband Home | 329 | 15.8% |
| Cellular Data Only | 295 | 14.2% |
| Satellite Internet | 439 | 21.1% |
| No Internet | 1,075 | 51.7% |
| Total | 2,078 | 100.0% |
Yukon-Koyukuk Census Area Summary
Yukon-Koyukuk Census Area, Alaska is located in the northernmost part of the United States. It is the largest and most sparsely populated of Alaska’s boroughs and census areas, covering an area of over 145,000 square miles. The population of the census area was 7,017 as of the 2010 census, making it the least populous of Alaska’s boroughs and census areas.
History
The area now known as Yukon-Koyukuk Census Area has been inhabited by indigenous peoples for thousands of years. The area was first explored by Europeans in the late 18th century, when Russian fur traders began to explore the region. In 1867, the United States purchased Alaska from Russia, and the area became part of the Alaska Territory. In 1912, the Alaska Territory was divided into boroughs and census areas, and the area now known as Yukon-Koyukuk Census Area was established.
Geography
Yukon-Koyukuk Census Area is located in the northernmost part of the United States, and is bordered by the Northwest Territories of Canada to the east, the Yukon Territory of Canada to the north, and the state of Alaska to the west and south. The area is mountainous and heavily forested, and is home to numerous rivers, lakes, and glaciers. The highest point in the census area is Mount Chamberlin, which has an elevation of 9,020 feet.
Economy
The economy of Yukon-Koyukuk Census Area is largely based on subsistence activities, such as hunting, fishing, and trapping. The area is also home to several small mining operations, as well as some tourism. The area is also home to several oil and gas fields, which provide jobs and revenue for the area.
Demographics
As of the 2010 census, the population of Yukon-Koyukuk Census Area was 7,017. The population is largely Native American, with the majority of the population being Alaska Native. The area is also home to a small population of non-Native Americans, primarily of European descent. The median household income in the area is $41,944, and the median age is 37.7 years.
Yukon-Koyukuk Census Area is a remote and sparsely populated area of Alaska, but it is home to a diverse population of Native Americans and non-Native Americans. The area is largely dependent on subsistence activities and natural resource extraction, but it is also home to some tourism and other economic activities. The area is home to some of the most spectacular scenery in Alaska, and is a great place to explore and experience the unique culture and history of the region.
Common Questions
What is the Total Population of Yukon-Koyukuk Census Area?
Total Population of Yukon-Koyukuk Census Area is 5,355.
What is the Total Male Population of Yukon-Koyukuk Census Area?
Total Male Population of Yukon-Koyukuk Census Area is 2,841.
What is the Total Female Population of Yukon-Koyukuk Census Area?
Total Female Population of Yukon-Koyukuk Census Area is 2,514.
What is the Ratio of Males per 100 Females in Yukon-Koyukuk Census Area?
There are 113.01 Males per 100 Females in Yukon-Koyukuk Census Area.
What is the Ratio of Females per 100 Males in Yukon-Koyukuk Census Area?
There are 88.49 Females per 100 Males in Yukon-Koyukuk Census Area.
What is the Median Population Age in Yukon-Koyukuk Census Area?
Median Population Age in Yukon-Koyukuk Census Area is 35.8 Years.
What is the Average Family Size in Yukon-Koyukuk Census Area
Average Family Size in Yukon-Koyukuk Census Area is 3.2 People.
What is the Average Household Size in Yukon-Koyukuk Census Area
Average Household Size in Yukon-Koyukuk Census Area is 2.4 People.
What is Per Capita Income in Yukon-Koyukuk Census Area?
Per Capita income in Yukon-Koyukuk Census Area is $29,382.
What is the Median Family Income in Yukon-Koyukuk Census Area?
Median Family Income in Yukon-Koyukuk Census Area is $59,458.
What is the Median Household income in Yukon-Koyukuk Census Area?
Median Household Income in Yukon-Koyukuk Census Area is $47,826.
What is Income or Wage Gap in Yukon-Koyukuk Census Area?
Income or Wage Gap in Yukon-Koyukuk Census Area is 17.0%.
Women in Yukon-Koyukuk Census Area earn 83.0 cents for every dollar earned by a man.
What is Family Income Deficit in Yukon-Koyukuk Census Area?
Family Income Deficit in Yukon-Koyukuk Census Area is $9,661.
Families that are below poverty line in Yukon-Koyukuk Census Area earn $9,661 less on average than the poverty threshold level.
What is Inequality or Gini Index in Yukon-Koyukuk Census Area?
Inequality or Gini Index in Yukon-Koyukuk Census Area is 0.46.
How Large is the Labor Force in Yukon-Koyukuk Census Area?
There are 2,670 People in the Labor Forcein in Yukon-Koyukuk Census Area.
What is the Percentage of People in the Labor Force in Yukon-Koyukuk Census Area?
65.9% of People are in the Labor Force in Yukon-Koyukuk Census Area.
What is the Unemployment Rate in Yukon-Koyukuk Census Area?
Unemployment Rate in Yukon-Koyukuk Census Area is 11.1%.