Skagway Municipality, AK
Skagway Municipality Overview
1,303
TOTAL POPULATION
537
MALE POPULATION
766
FEMALE POPULATION
70.10
MALES / 100 FEMALES
142.64
FEMALES / 100 MALES
38.6
MEDIAN AGE
3.6
AVG FAMILY SIZE
2.6
AVG HOUSEHOLD SIZE
$46,771
PER CAPITA INCOME
$110,833
AVG FAMILY INCOME
$79,583
AVG HOUSEHOLD INCOME
32.3%
WAGE / INCOME GAP [ % ]
67.7¢/ $1
WAGE / INCOME GAP [ $ ]
0.35
INEQUALITY / GINI INDEX
872
LABOR FORCE [ PEOPLE ]
78.6%
PERCENT IN LABOR FORCE
11.0%
UNEMPLOYMENT RATE
Skagway Municipality Area Codes
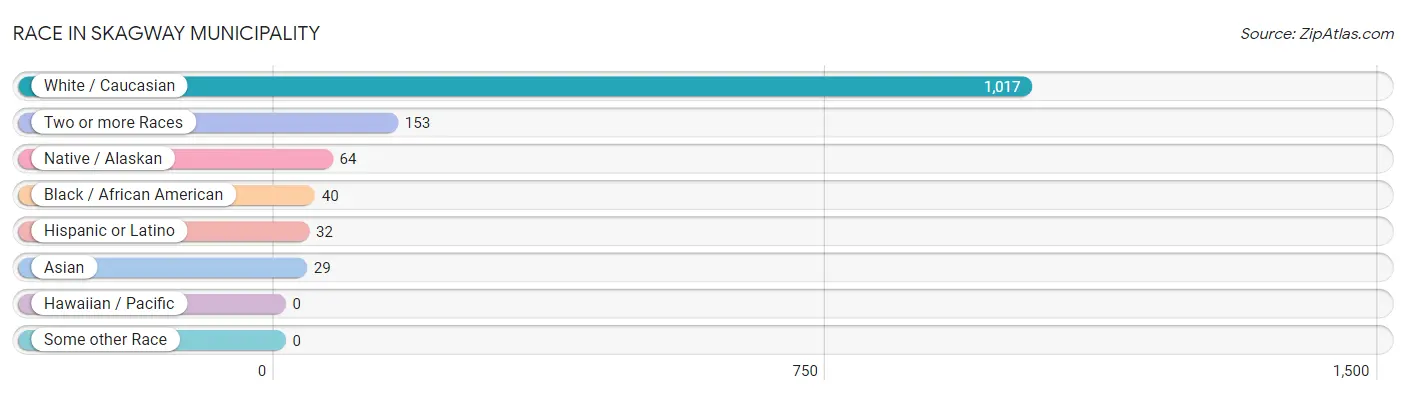
Race in Skagway Municipality
The most populous races in Skagway Municipality are White / Caucasian (1,017 | 78.0%), Two or more Races (153 | 11.7%), and Native / Alaskan (64 | 4.9%).
| Race | # Population | % Population |
| Asian | 29 | 2.2% |
| Black / African American | 40 | 3.1% |
| Hawaiian / Pacific | 0 | 0.0% |
| Hispanic or Latino | 32 | 2.5% |
| Native / Alaskan | 64 | 4.9% |
| White / Caucasian | 1,017 | 78.0% |
| Two or more Races | 153 | 11.7% |
| Some other Race | 0 | 0.0% |
| Total | 1,303 | 100.0% |
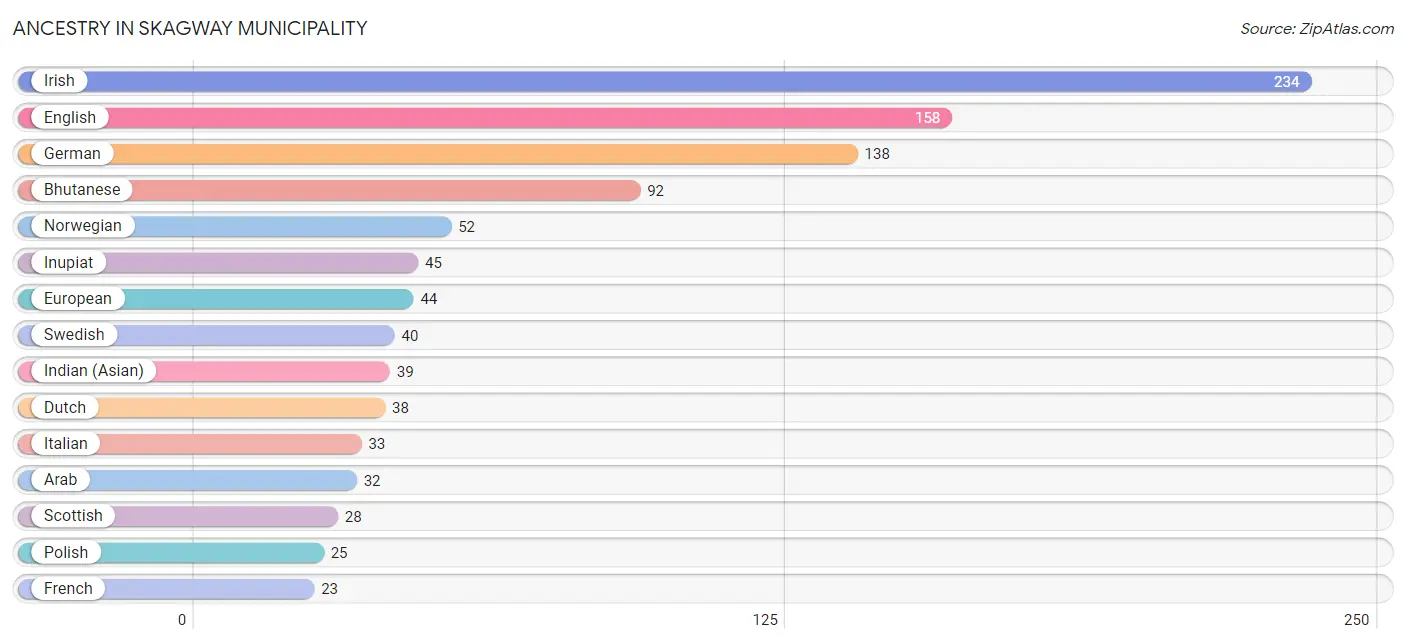
Ancestry in Skagway Municipality
The most populous ancestries reported in Skagway Municipality are Irish (234 | 18.0%), English (158 | 12.1%), German (138 | 10.6%), Bhutanese (92 | 7.1%), and Norwegian (52 | 4.0%), together accounting for 51.7% of all Skagway Municipality residents.
| Ancestry | # Population | % Population |
| African | 2 | 0.2% |
| Alaska Native | 5 | 0.4% |
| Aleut | 8 | 0.6% |
| American | 9 | 0.7% |
| Arab | 32 | 2.5% |
| Armenian | 2 | 0.2% |
| Belgian | 2 | 0.2% |
| Bhutanese | 92 | 7.1% |
| British | 6 | 0.5% |
| Bulgarian | 3 | 0.2% |
| Canadian | 1 | 0.1% |
| Chickasaw | 1 | 0.1% |
| Cree | 4 | 0.3% |
| Croatian | 2 | 0.2% |
| Czech | 10 | 0.8% |
| Czechoslovakian | 6 | 0.5% |
| Danish | 5 | 0.4% |
| Dutch | 38 | 2.9% |
| English | 158 | 12.1% |
| European | 44 | 3.4% |
| Finnish | 6 | 0.5% |
| French | 23 | 1.8% |
| French Canadian | 7 | 0.5% |
| German | 138 | 10.6% |
| Indian (Asian) | 39 | 3.0% |
| Inupiat | 45 | 3.5% |
| Iranian | 3 | 0.2% |
| Irish | 234 | 18.0% |
| Italian | 33 | 2.5% |
| Jamaican | 4 | 0.3% |
| Korean | 22 | 1.7% |
| Lithuanian | 2 | 0.2% |
| Mexican | 19 | 1.5% |
| Moroccan | 3 | 0.2% |
| Northern European | 4 | 0.3% |
| Norwegian | 52 | 4.0% |
| Pennsylvania German | 1 | 0.1% |
| Peruvian | 4 | 0.3% |
| Polish | 25 | 1.9% |
| Portuguese | 7 | 0.5% |
| Russian | 4 | 0.3% |
| Scandinavian | 14 | 1.1% |
| Scotch-Irish | 14 | 1.1% |
| Scottish | 28 | 2.1% |
| Slovene | 14 | 1.1% |
| South American | 4 | 0.3% |
| Spaniard | 9 | 0.7% |
| Subsaharan African | 2 | 0.2% |
| Swedish | 40 | 3.1% |
| Swiss | 7 | 0.5% |
| Tlingit-Haida | 14 | 1.1% |
| Welsh | 1 | 0.1% |
| Yugoslavian | 4 | 0.3% | View All 53 Rows |
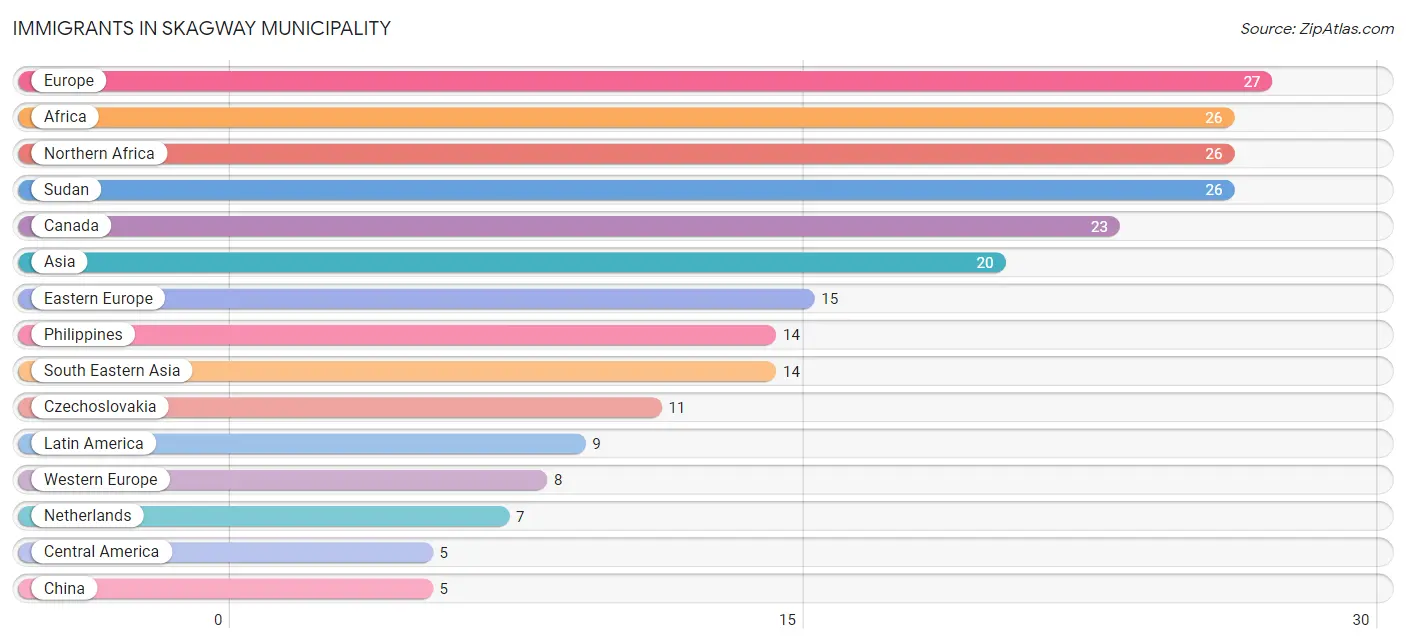
Immigrants in Skagway Municipality
The most numerous immigrant groups reported in Skagway Municipality came from Europe (27 | 2.1%), Africa (26 | 2.0%), Northern Africa (26 | 2.0%), Sudan (26 | 2.0%), and Canada (23 | 1.8%), together accounting for 9.8% of all Skagway Municipality residents.
| Immigration Origin | # Population | % Population |
| Africa | 26 | 2.0% |
| Asia | 20 | 1.5% |
| Belarus | 1 | 0.1% |
| Bulgaria | 3 | 0.2% |
| Canada | 23 | 1.8% |
| Caribbean | 4 | 0.3% |
| Central America | 5 | 0.4% |
| China | 5 | 0.4% |
| Czechoslovakia | 11 | 0.8% |
| Eastern Asia | 5 | 0.4% |
| Eastern Europe | 15 | 1.1% |
| Europe | 27 | 2.1% |
| Germany | 1 | 0.1% |
| Jamaica | 4 | 0.3% |
| Latin America | 9 | 0.7% |
| Mexico | 5 | 0.4% |
| Netherlands | 7 | 0.5% |
| Northern Africa | 26 | 2.0% |
| Northern Europe | 2 | 0.2% |
| Philippines | 14 | 1.1% |
| South Eastern Asia | 14 | 1.1% |
| Sudan | 26 | 2.0% |
| Sweden | 2 | 0.2% |
| Turkey | 1 | 0.1% |
| Western Asia | 1 | 0.1% |
| Western Europe | 8 | 0.6% | View All 26 Rows |
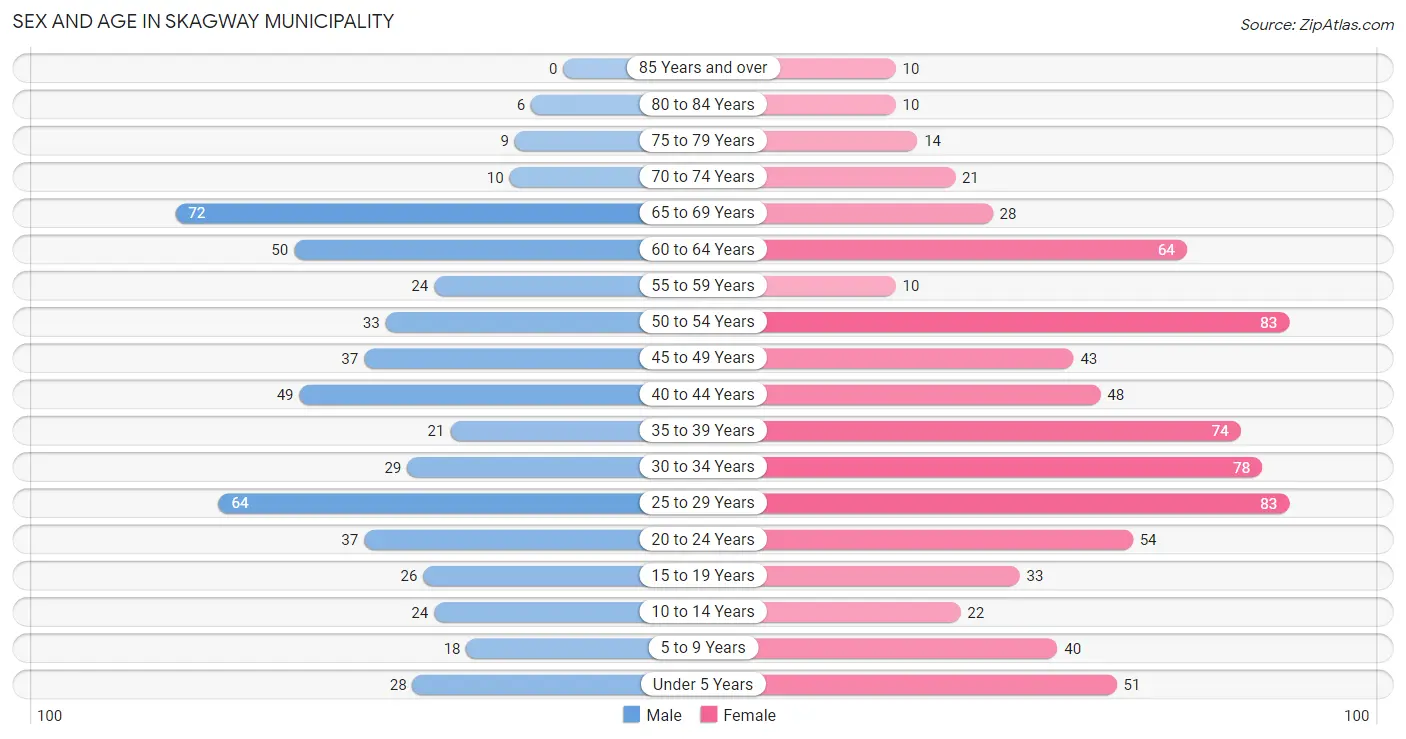
Sex and Age in Skagway Municipality
Sex and Age in Skagway Municipality
The most populous age groups in Skagway Municipality are 65 to 69 Years (72 | 13.4%) for men and 25 to 29 Years (83 | 10.8%) for women.
| Age Bracket | Male | Female |
| Under 5 Years | 28 (5.2%) | 51 (6.7%) |
| 5 to 9 Years | 18 (3.4%) | 40 (5.2%) |
| 10 to 14 Years | 24 (4.5%) | 22 (2.9%) |
| 15 to 19 Years | 26 (4.8%) | 33 (4.3%) |
| 20 to 24 Years | 37 (6.9%) | 54 (7.0%) |
| 25 to 29 Years | 64 (11.9%) | 83 (10.8%) |
| 30 to 34 Years | 29 (5.4%) | 78 (10.2%) |
| 35 to 39 Years | 21 (3.9%) | 74 (9.7%) |
| 40 to 44 Years | 49 (9.1%) | 48 (6.3%) |
| 45 to 49 Years | 37 (6.9%) | 43 (5.6%) |
| 50 to 54 Years | 33 (6.1%) | 83 (10.8%) |
| 55 to 59 Years | 24 (4.5%) | 10 (1.3%) |
| 60 to 64 Years | 50 (9.3%) | 64 (8.4%) |
| 65 to 69 Years | 72 (13.4%) | 28 (3.7%) |
| 70 to 74 Years | 10 (1.9%) | 21 (2.7%) |
| 75 to 79 Years | 9 (1.7%) | 14 (1.8%) |
| 80 to 84 Years | 6 (1.1%) | 10 (1.3%) |
| 85 Years and over | 0 (0.0%) | 10 (1.3%) |
| Total | 537 (100.0%) | 766 (100.0%) |
Families and Households in Skagway Municipality
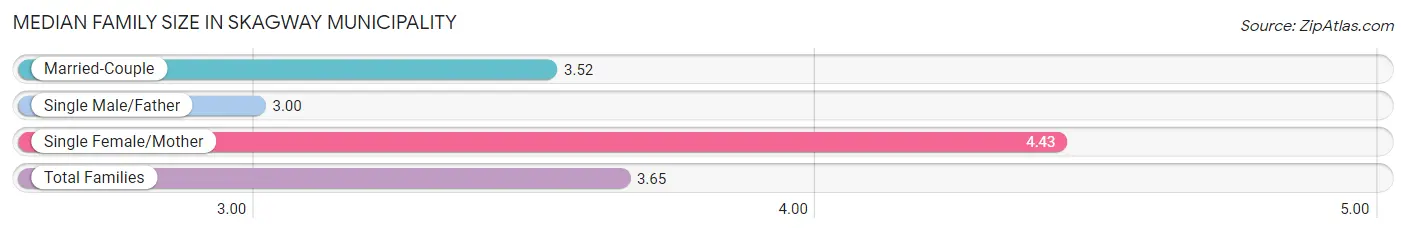
Median Family Size in Skagway Municipality
The median family size in Skagway Municipality is 3.65 persons per family, with single female/mother families (35 | 18.0%) accounting for the largest median family size of 4.43 persons per family. On the other hand, single male/father families (10 | 5.1%) represent the smallest median family size with 3.00 persons per family.
| Family Type | # Families | Family Size |
| Married-Couple | 149 (76.8%) | 3.52 |
| Single Male/Father | 10 (5.1%) | 3.00 |
| Single Female/Mother | 35 (18.0%) | 4.43 |
| Total Families | 194 (100.0%) | 3.65 |
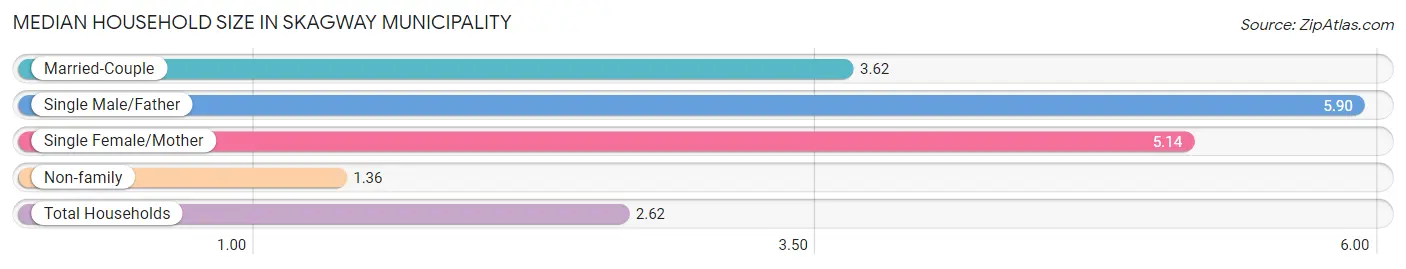
Median Household Size in Skagway Municipality
The median household size in Skagway Municipality is 2.62 persons per household, with single male/father households (10 | 2.4%) accounting for the largest median household size of 5.9 persons per household. non-family households (216 | 52.7%) represent the smallest median household size with 1.36 persons per household.
| Household Type | # Households | Household Size |
| Married-Couple | 149 (36.3%) | 3.62 |
| Single Male/Father | 10 (2.4%) | 5.90 |
| Single Female/Mother | 35 (8.5%) | 5.14 |
| Non-family | 216 (52.7%) | 1.36 |
| Total Households | 410 (100.0%) | 2.62 |
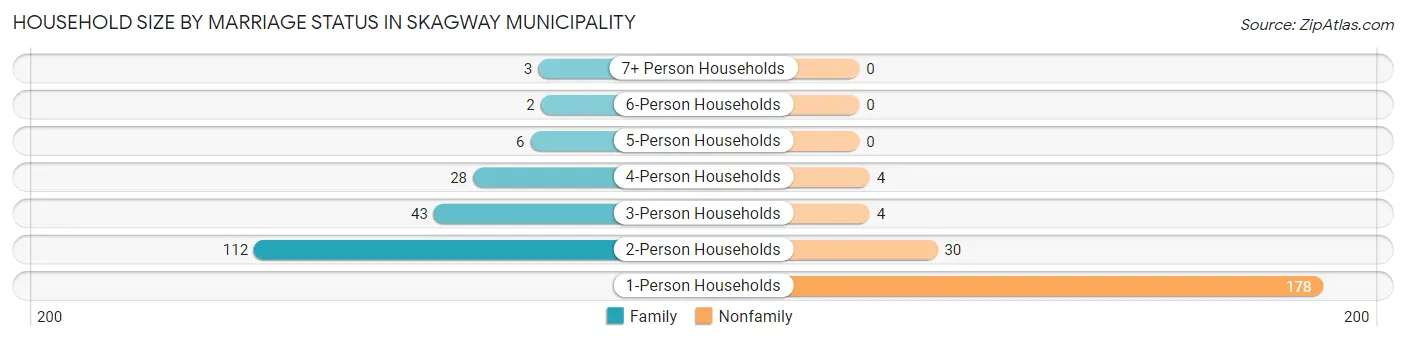
Household Size by Marriage Status in Skagway Municipality
Out of a total of 410 households in Skagway Municipality, 194 (47.3%) are family households, while 216 (52.7%) are nonfamily households. The most numerous type of family households are 2-person households, comprising 112, and the most common type of nonfamily households are 1-person households, comprising 178.
| Household Size | Family Households | Nonfamily Households |
| 1-Person Households | - | 178 (43.4%) |
| 2-Person Households | 112 (27.3%) | 30 (7.3%) |
| 3-Person Households | 43 (10.5%) | 4 (1.0%) |
| 4-Person Households | 28 (6.8%) | 4 (1.0%) |
| 5-Person Households | 6 (1.5%) | 0 (0.0%) |
| 6-Person Households | 2 (0.5%) | 0 (0.0%) |
| 7+ Person Households | 3 (0.7%) | 0 (0.0%) |
| Total | 194 (47.3%) | 216 (52.7%) |
Female Fertility in Skagway Municipality
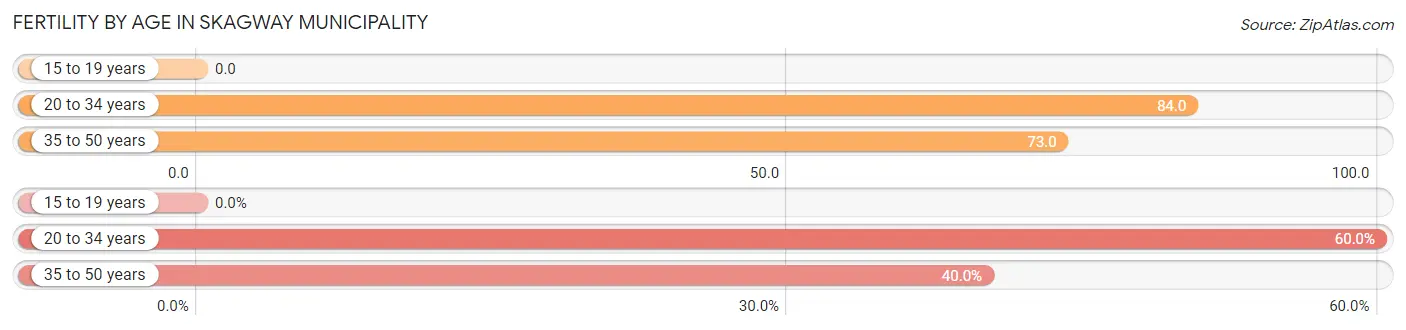
Fertility by Age in Skagway Municipality
Average fertility rate in Skagway Municipality is 73.0 births per 1,000 women. Women in the age bracket of 20 to 34 years have the highest fertility rate with 84.0 births per 1,000 women. Women in the age bracket of 20 to 34 years acount for 60.0% of all women with births.
| Age Bracket | Women with Births | Births / 1,000 Women |
| 15 to 19 years | 0 (0.0%) | 0.0 |
| 20 to 34 years | 18 (60.0%) | 84.0 |
| 35 to 50 years | 12 (40.0%) | 73.0 |
| Total | 30 (100.0%) | 73.0 |
Fertility by Age by Marriage Status in Skagway Municipality
43.3% of women with births (30) in Skagway Municipality are married. The highest percentage of unmarried women with births falls into 20 to 34 years age bracket with 94.4% of them unmarried at the time of birth, while the lowest percentage of unmarried women with births belong to 35 to 50 years age bracket with 0.0% of them unmarried.
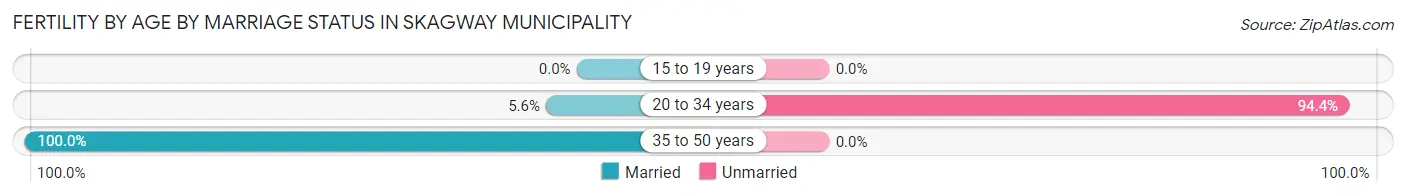
| Age Bracket | Married | Unmarried |
| 15 to 19 years | 0 (0.0%) | 0 (0.0%) |
| 20 to 34 years | 1 (5.6%) | 17 (94.4%) |
| 35 to 50 years | 12 (100.0%) | 0 (0.0%) |
| Total | 13 (43.3%) | 17 (56.7%) |
Fertility by Education in Skagway Municipality
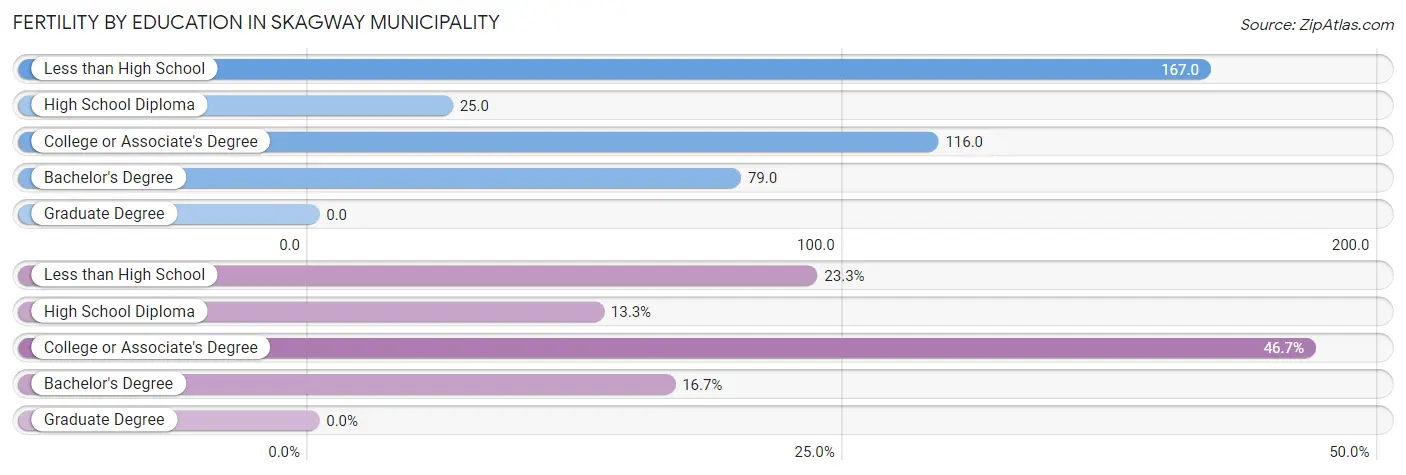
| Educational Attainment | Women with Births | Births / 1,000 Women |
| Less than High School | 7 (23.3%) | 167.0 |
| High School Diploma | 4 (13.3%) | 25.0 |
| College or Associate's Degree | 14 (46.7%) | 116.0 |
| Bachelor's Degree | 5 (16.7%) | 79.0 |
| Graduate Degree | 0 (0.0%) | 0.0 |
| Total | 30 (100.0%) | 73.0 |
Fertility by Education by Marriage Status in Skagway Municipality
56.7% of women with births in Skagway Municipality are unmarried. Women with the educational attainment of high school diploma are most likely to be married with 100.0% of them married at childbirth, while women with the educational attainment of less than high school are least likely to be married with 100.0% of them unmarried at childbirth.
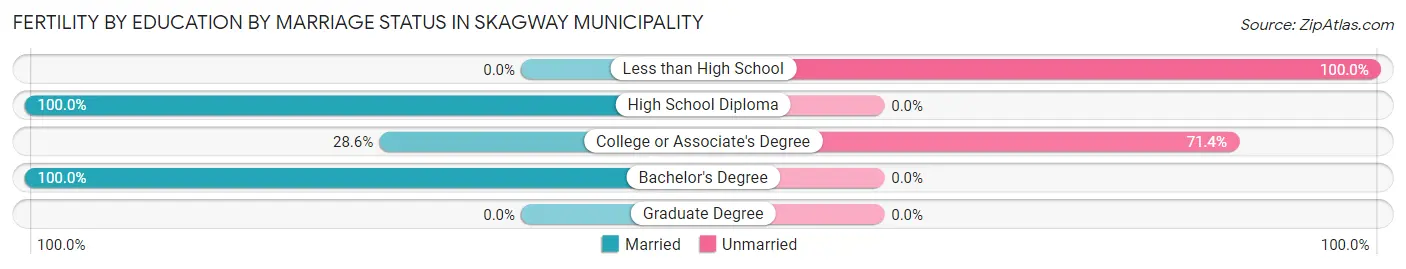
| Educational Attainment | Married | Unmarried |
| Less than High School | 0 (0.0%) | 7 (100.0%) |
| High School Diploma | 4 (100.0%) | 0 (0.0%) |
| College or Associate's Degree | 4 (28.6%) | 10 (71.4%) |
| Bachelor's Degree | 5 (100.0%) | 0 (0.0%) |
| Graduate Degree | 0 (0.0%) | 0 (0.0%) |
| Total | 13 (43.3%) | 17 (56.7%) |
Income in Skagway Municipality
Income Overview in Skagway Municipality
Per Capita Income in Skagway Municipality is $46,771, while median incomes of families and households are $110,833 and $79,583 respectively.
| Characteristic | Number | Measure |
| Per Capita Income | 1,303 | $46,771 |
| Median Family Income | 194 | $110,833 |
| Mean Family Income | 194 | $119,386 |
| Median Household Income | 410 | $79,583 |
| Mean Household Income | 410 | $91,563 |
| Income Deficit | 194 | $0 |
| Wage / Income Gap (%) | 1,303 | 32.32% |
| Wage / Income Gap ($) | 1,303 | 67.68¢ per $1 |
| Gini / Inequality Index | 1,303 | 0.35 |
Earnings by Sex in Skagway Municipality
Average Earnings in Skagway Municipality are $48,750, $37,857 for men and $55,932 for women, a difference of 32.3%.
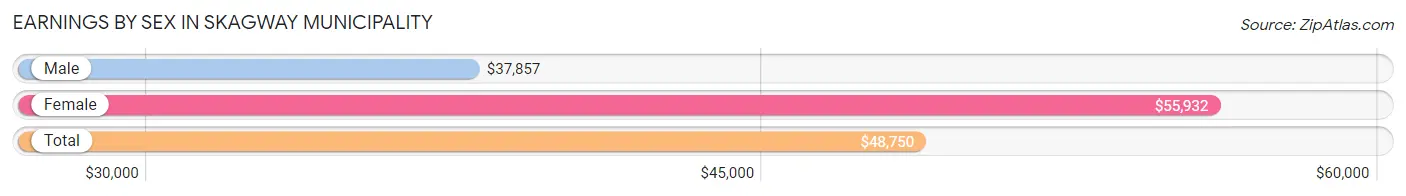
| Sex | Number | Average Earnings |
| Male | 360 (42.1%) | $37,857 |
| Female | 496 (57.9%) | $55,932 |
| Total | 856 (100.0%) | $48,750 |
Earnings by Sex by Income Bracket in Skagway Municipality
The most common earnings brackets in Skagway Municipality are $100,000+ for men (54 | 15.0%) and $55,000 to $64,999 for women (122 | 24.6%).
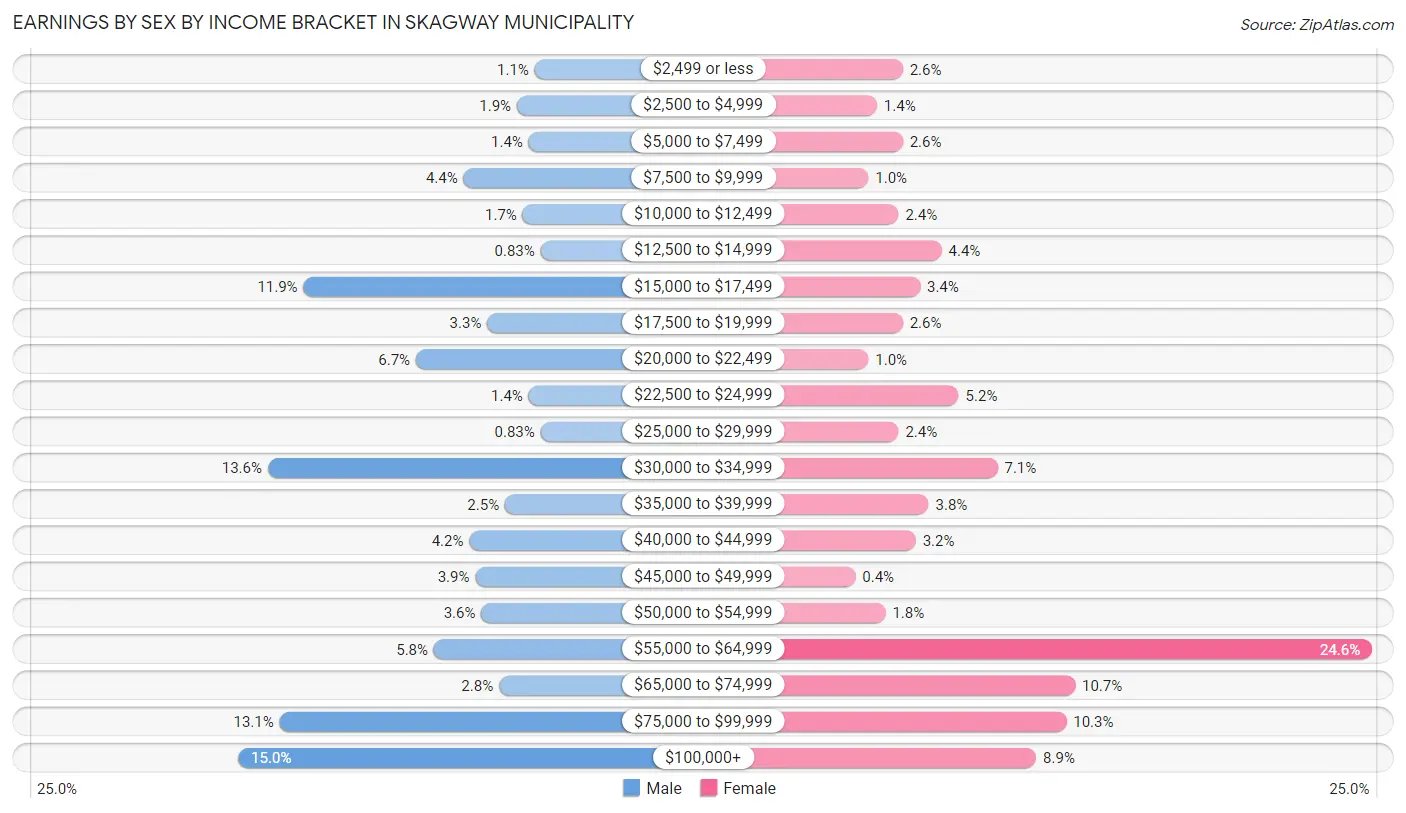
| Income | Male | Female |
| $2,499 or less | 4 (1.1%) | 13 (2.6%) |
| $2,500 to $4,999 | 7 (1.9%) | 7 (1.4%) |
| $5,000 to $7,499 | 5 (1.4%) | 13 (2.6%) |
| $7,500 to $9,999 | 16 (4.4%) | 5 (1.0%) |
| $10,000 to $12,499 | 6 (1.7%) | 12 (2.4%) |
| $12,500 to $14,999 | 3 (0.8%) | 22 (4.4%) |
| $15,000 to $17,499 | 43 (11.9%) | 17 (3.4%) |
| $17,500 to $19,999 | 12 (3.3%) | 13 (2.6%) |
| $20,000 to $22,499 | 24 (6.7%) | 5 (1.0%) |
| $22,500 to $24,999 | 5 (1.4%) | 26 (5.2%) |
| $25,000 to $29,999 | 3 (0.8%) | 12 (2.4%) |
| $30,000 to $34,999 | 49 (13.6%) | 35 (7.1%) |
| $35,000 to $39,999 | 9 (2.5%) | 19 (3.8%) |
| $40,000 to $44,999 | 15 (4.2%) | 16 (3.2%) |
| $45,000 to $49,999 | 14 (3.9%) | 2 (0.4%) |
| $50,000 to $54,999 | 13 (3.6%) | 9 (1.8%) |
| $55,000 to $64,999 | 21 (5.8%) | 122 (24.6%) |
| $65,000 to $74,999 | 10 (2.8%) | 53 (10.7%) |
| $75,000 to $99,999 | 47 (13.1%) | 51 (10.3%) |
| $100,000+ | 54 (15.0%) | 44 (8.9%) |
| Total | 360 (100.0%) | 496 (100.0%) |
Earnings by Sex by Educational Attainment in Skagway Municipality
Average earnings in Skagway Municipality are $44,688 for men and $57,097 for women, a difference of 21.7%. Men with an educational attainment of college or associate's degree enjoy the highest average annual earnings of $53,750, while those with high school diploma education earn the least with $32,941. Women with an educational attainment of graduate degree earn the most with the average annual earnings of $110,268, while those with college or associate's degree education have the smallest earnings of $30,250.
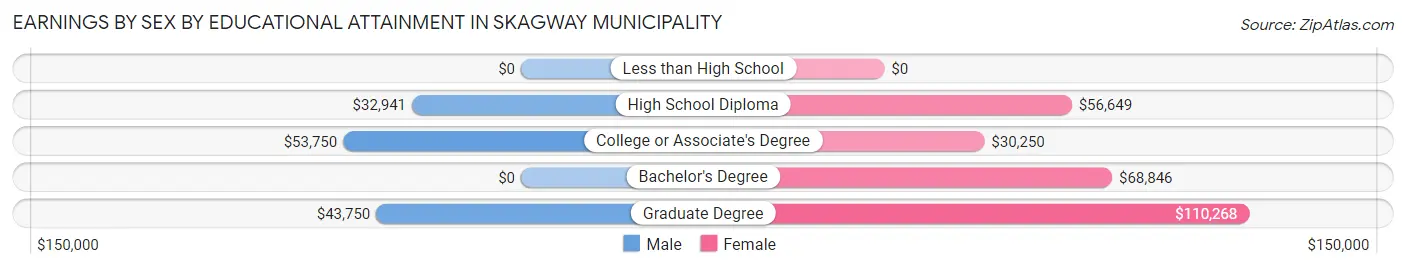
| Educational Attainment | Male Income | Female Income |
| Less than High School | - | - |
| High School Diploma | $32,941 | $56,649 |
| College or Associate's Degree | $53,750 | $30,250 |
| Bachelor's Degree | - | - |
| Graduate Degree | $43,750 | $110,268 |
| Total | $44,688 | $57,097 |
Family Income in Skagway Municipality
Family Income Brackets in Skagway Municipality
According to the Skagway Municipality family income data, there are 55 families falling into the $100,000 to $149,999 income range, which is the most common income bracket and makes up 28.3% of all families.
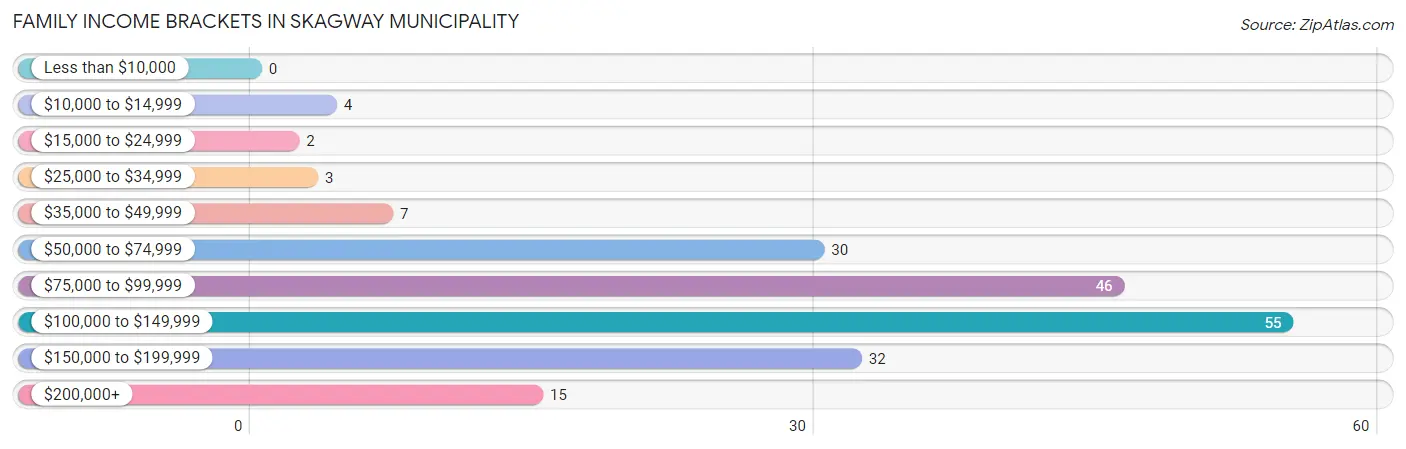
| Income Bracket | # Families | % Families |
| Less than $10,000 | 0 | 0.0% |
| $10,000 to $14,999 | 4 | 2.1% |
| $15,000 to $24,999 | 2 | 1.0% |
| $25,000 to $34,999 | 3 | 1.5% |
| $35,000 to $49,999 | 7 | 3.6% |
| $50,000 to $74,999 | 30 | 15.5% |
| $75,000 to $99,999 | 46 | 23.7% |
| $100,000 to $149,999 | 55 | 28.4% |
| $150,000 to $199,999 | 32 | 16.5% |
| $200,000+ | 15 | 7.7% |
Family Income by Famaliy Size in Skagway Municipality
4-person families (25 | 12.9%) account for the highest median family income in Skagway Municipality with $137,917 per family, while 2-person families (118 | 60.8%) have the highest median income of $52,084 per family member.
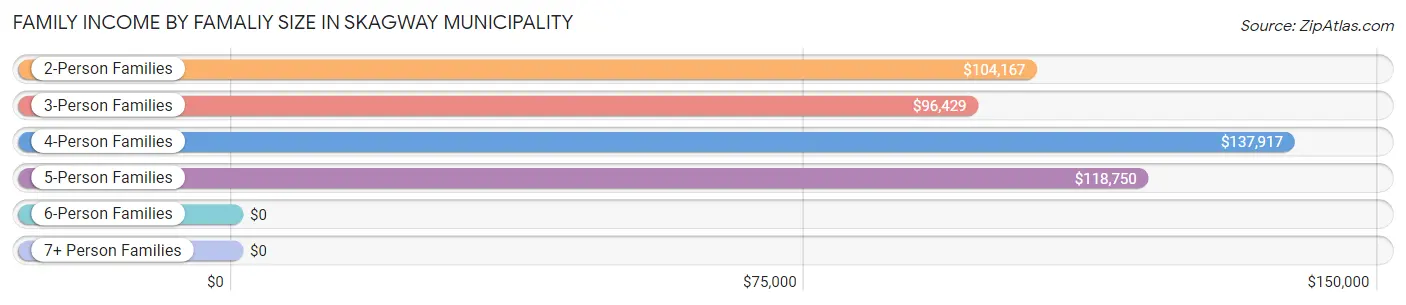
| Income Bracket | # Families | Median Income |
| 2-Person Families | 118 (60.8%) | $104,167 |
| 3-Person Families | 44 (22.7%) | $96,429 |
| 4-Person Families | 25 (12.9%) | $137,917 |
| 5-Person Families | 4 (2.1%) | $118,750 |
| 6-Person Families | 2 (1.0%) | $0 |
| 7+ Person Families | 1 (0.5%) | $0 |
| Total | 194 (100.0%) | $110,833 |
Family Income by Number of Earners in Skagway Municipality
The median family income in Skagway Municipality is $110,833, with families comprising 2 earners (105) having the highest median family income of $130,625, while families with no earners (19) have the lowest median family income of $78,750, accounting for 54.1% and 9.8% of families, respectively.
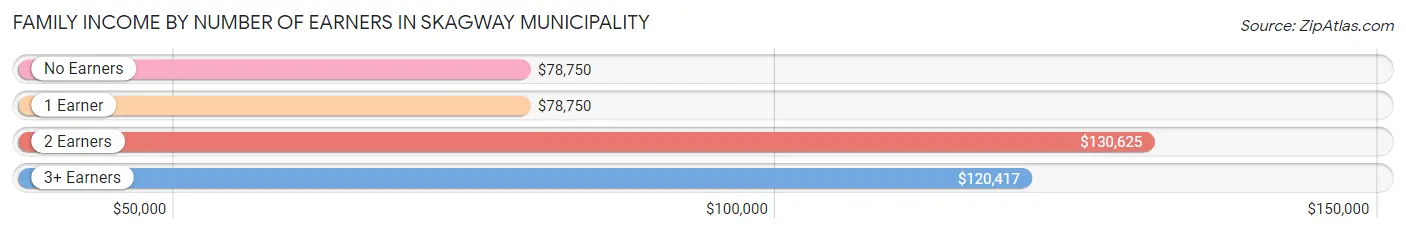
| Number of Earners | # Families | Median Income |
| No Earners | 19 (9.8%) | $78,750 |
| 1 Earner | 59 (30.4%) | $78,750 |
| 2 Earners | 105 (54.1%) | $130,625 |
| 3+ Earners | 11 (5.7%) | $120,417 |
| Total | 194 (100.0%) | $110,833 |
Household Income in Skagway Municipality
Household Income Brackets in Skagway Municipality
With 88 households falling in the category, the $100,000 to $149,999 income range is the most frequent in Skagway Municipality, accounting for 21.5% of all households. In contrast, only 5 households (1.2%) fall into the less than $10,000 income bracket, making it the least populous group.
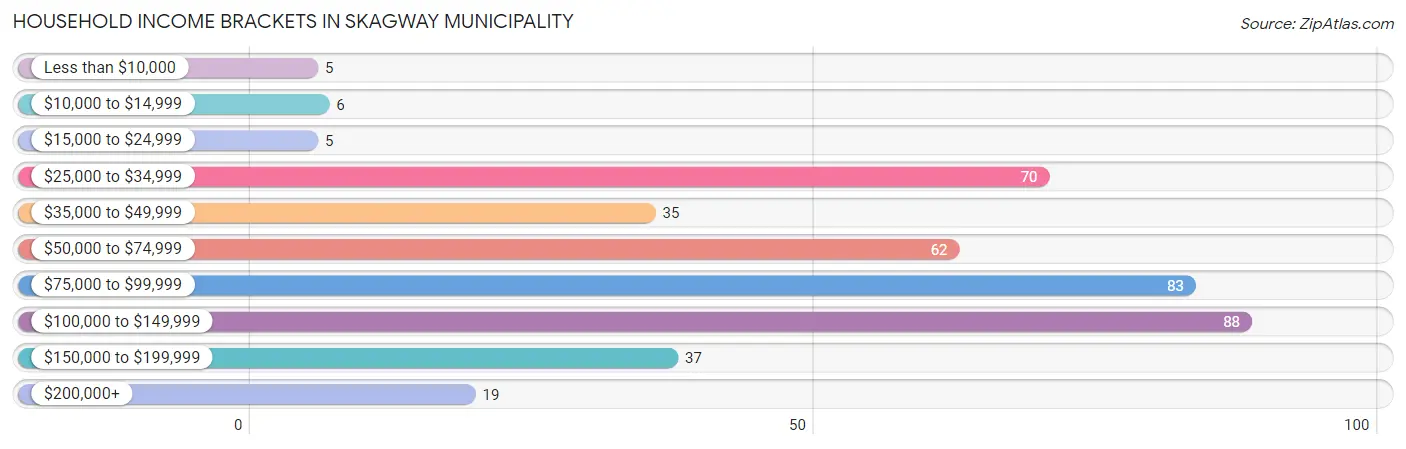
| Income Bracket | # Households | % Households |
| Less than $10,000 | 5 | 1.2% |
| $10,000 to $14,999 | 6 | 1.5% |
| $15,000 to $24,999 | 5 | 1.2% |
| $25,000 to $34,999 | 70 | 17.1% |
| $35,000 to $49,999 | 35 | 8.5% |
| $50,000 to $74,999 | 62 | 15.1% |
| $75,000 to $99,999 | 83 | 20.2% |
| $100,000 to $149,999 | 88 | 21.5% |
| $150,000 to $199,999 | 37 | 9.0% |
| $200,000+ | 19 | 4.6% |
Household Income by Householder Age in Skagway Municipality
The median household income in Skagway Municipality is $79,583, with the highest median household income of $91,250 found in the 25 to 44 years age bracket for the primary householder. A total of 111 households (27.1%) fall into this category. Meanwhile, the 15 to 24 years age bracket for the primary householder has the lowest median household income of $0, with 22 households (5.4%) in this group.
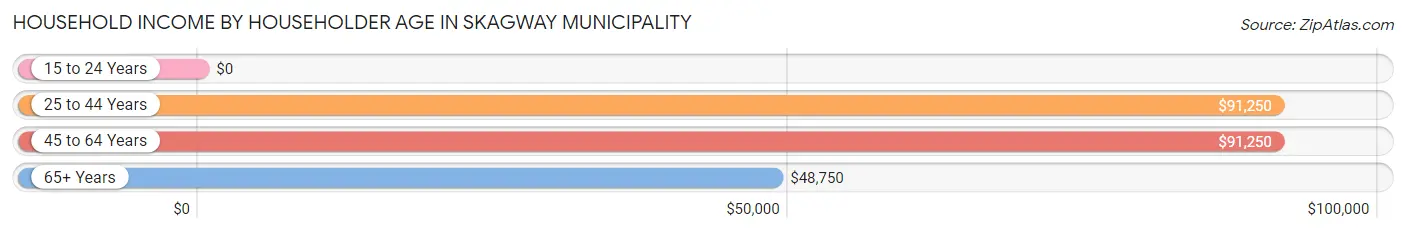
| Income Bracket | # Households | Median Income |
| 15 to 24 Years | 22 (5.4%) | $0 |
| 25 to 44 Years | 111 (27.1%) | $91,250 |
| 45 to 64 Years | 142 (34.6%) | $91,250 |
| 65+ Years | 135 (32.9%) | $48,750 |
| Total | 410 (100.0%) | $79,583 |
Poverty in Skagway Municipality
Income Below Poverty by Sex and Age in Skagway Municipality
With 4.5% poverty level for males and 7.4% for females among the residents of Skagway Municipality, 25 to 34 year old males and 18 to 24 year old females are the most vulnerable to poverty, with 13 males (14.0%) and 19 females (26.0%) in their respective age groups living below the poverty level.
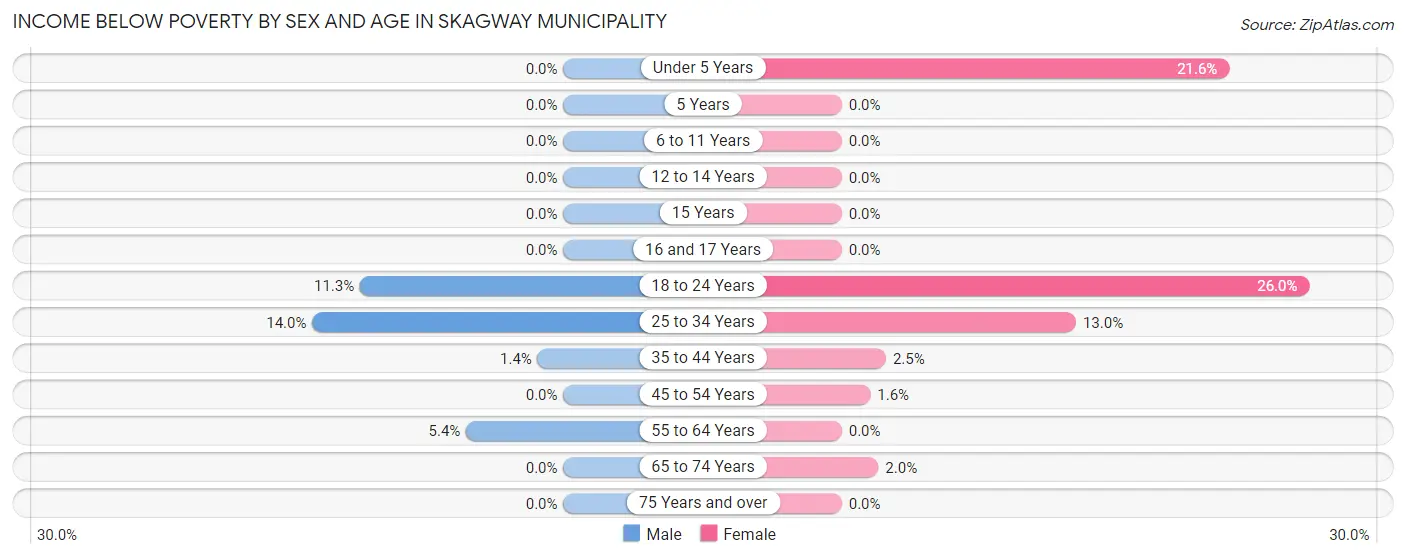
| Age Bracket | Male | Female |
| Under 5 Years | 0 (0.0%) | 11 (21.6%) |
| 5 Years | 0 (0.0%) | 0 (0.0%) |
| 6 to 11 Years | 0 (0.0%) | 0 (0.0%) |
| 12 to 14 Years | 0 (0.0%) | 0 (0.0%) |
| 15 Years | 0 (0.0%) | 0 (0.0%) |
| 16 and 17 Years | 0 (0.0%) | 0 (0.0%) |
| 18 to 24 Years | 6 (11.3%) | 19 (26.0%) |
| 25 to 34 Years | 13 (14.0%) | 21 (13.0%) |
| 35 to 44 Years | 1 (1.4%) | 3 (2.5%) |
| 45 to 54 Years | 0 (0.0%) | 2 (1.6%) |
| 55 to 64 Years | 4 (5.4%) | 0 (0.0%) |
| 65 to 74 Years | 0 (0.0%) | 1 (2.0%) |
| 75 Years and over | 0 (0.0%) | 0 (0.0%) |
| Total | 24 (4.5%) | 57 (7.4%) |
Income Above Poverty by Sex and Age in Skagway Municipality
According to the poverty statistics in Skagway Municipality, males aged under 5 years and females aged 5 years are the age groups that are most secure financially, with 100.0% of males and 100.0% of females in these age groups living above the poverty line.
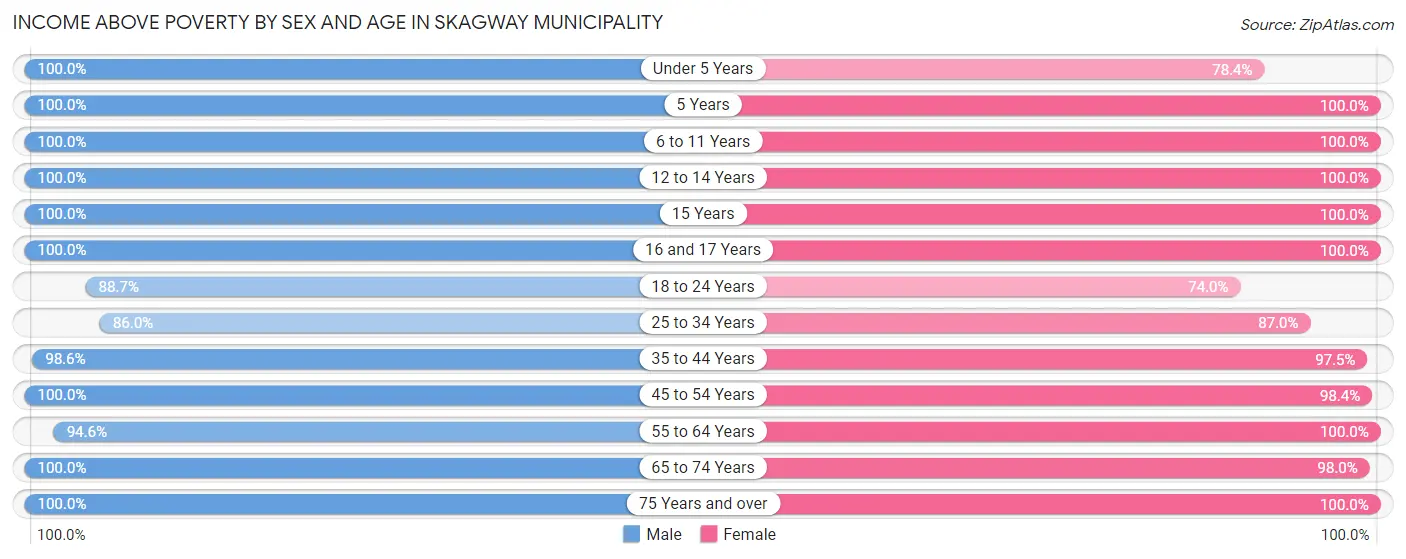
| Age Bracket | Male | Female |
| Under 5 Years | 28 (100.0%) | 40 (78.4%) |
| 5 Years | 3 (100.0%) | 7 (100.0%) |
| 6 to 11 Years | 28 (100.0%) | 33 (100.0%) |
| 12 to 14 Years | 11 (100.0%) | 22 (100.0%) |
| 15 Years | 6 (100.0%) | 4 (100.0%) |
| 16 and 17 Years | 4 (100.0%) | 10 (100.0%) |
| 18 to 24 Years | 47 (88.7%) | 54 (74.0%) |
| 25 to 34 Years | 80 (86.0%) | 140 (87.0%) |
| 35 to 44 Years | 69 (98.6%) | 119 (97.5%) |
| 45 to 54 Years | 70 (100.0%) | 124 (98.4%) |
| 55 to 64 Years | 70 (94.6%) | 74 (100.0%) |
| 65 to 74 Years | 82 (100.0%) | 48 (98.0%) |
| 75 Years and over | 15 (100.0%) | 34 (100.0%) |
| Total | 513 (95.5%) | 709 (92.6%) |
Income Below Poverty Among Married-Couple Families in Skagway Municipality
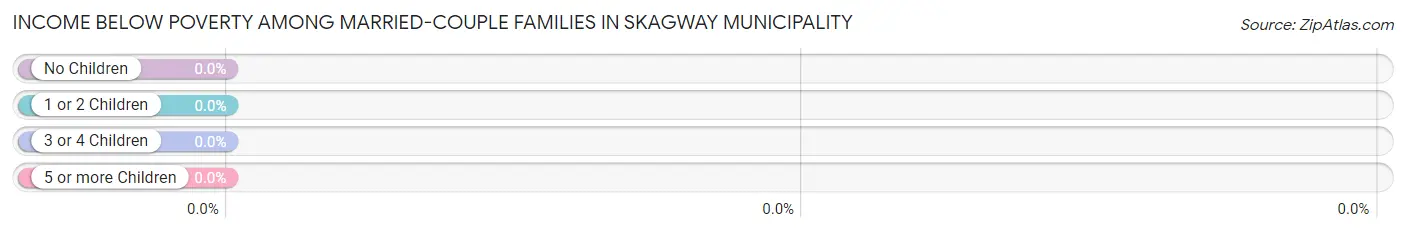
| Children | Above Poverty | Below Poverty |
| No Children | 105 (100.0%) | 0 (0.0%) |
| 1 or 2 Children | 40 (100.0%) | 0 (0.0%) |
| 3 or 4 Children | 3 (100.0%) | 0 (0.0%) |
| 5 or more Children | 1 (100.0%) | 0 (0.0%) |
| Total | 149 (100.0%) | 0 (0.0%) |
Income Below Poverty Among Single-Parent Households in Skagway Municipality
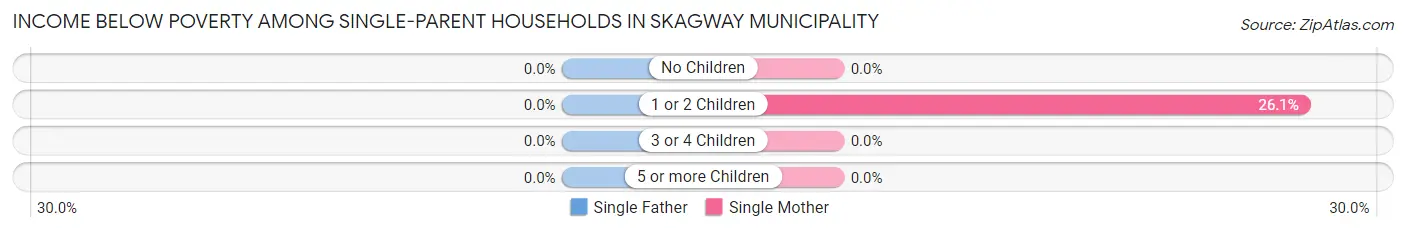
| Children | Single Father | Single Mother |
| No Children | 0 (0.0%) | 0 (0.0%) |
| 1 or 2 Children | 0 (0.0%) | 6 (26.1%) |
| 3 or 4 Children | 0 (0.0%) | 0 (0.0%) |
| 5 or more Children | 0 (0.0%) | 0 (0.0%) |
| Total | 0 (0.0%) | 6 (17.1%) |
Income Below Poverty Among Married-Couple vs Single-Parent Households in Skagway Municipality
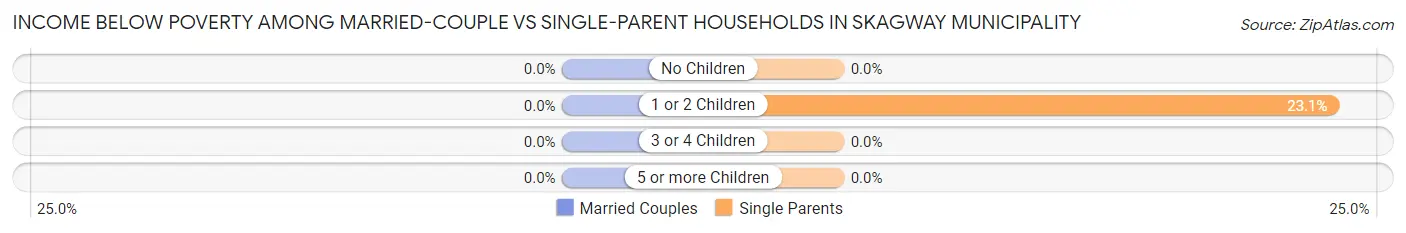
| Children | Married-Couple Families | Single-Parent Households |
| No Children | 0 (0.0%) | 0 (0.0%) |
| 1 or 2 Children | 0 (0.0%) | 6 (23.1%) |
| 3 or 4 Children | 0 (0.0%) | 0 (0.0%) |
| 5 or more Children | 0 (0.0%) | 0 (0.0%) |
| Total | 0 (0.0%) | 6 (13.3%) |
Employment Characteristics in Skagway Municipality
Employment by Class of Employer in Skagway Municipality
Among the 767 employed individuals in Skagway Municipality, private company employees (381 | 49.7%), local government employees (134 | 17.5%), and federal government employees (70 | 9.1%) make up the most common classes of employment.
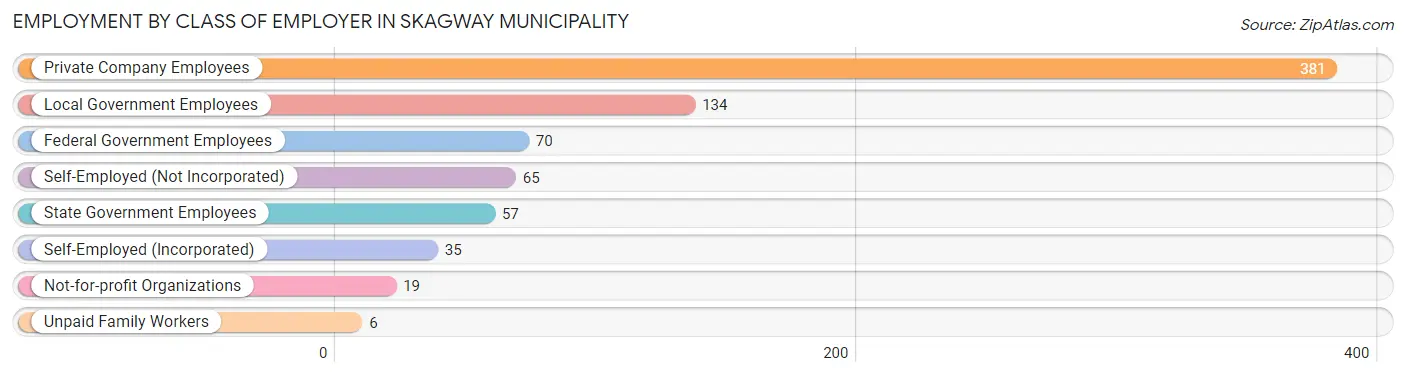
| Employer Class | # Employees | % Employees |
| Private Company Employees | 381 | 49.7% |
| Self-Employed (Incorporated) | 35 | 4.6% |
| Self-Employed (Not Incorporated) | 65 | 8.5% |
| Not-for-profit Organizations | 19 | 2.5% |
| Local Government Employees | 134 | 17.5% |
| State Government Employees | 57 | 7.4% |
| Federal Government Employees | 70 | 9.1% |
| Unpaid Family Workers | 6 | 0.8% |
| Total | 767 | 100.0% |
Employment Status by Age in Skagway Municipality
According to the labor force statistics for Skagway Municipality, out of the total population over 16 years of age (1,110), 78.6% or 872 individuals are in the labor force, with 11.0% or 96 of them unemployed. The age group with the highest labor force participation rate is 30 to 34 years, with 100.0% or 107 individuals in the labor force. Within the labor force, the 45 to 54 years age range has the highest percentage of unemployed individuals, with 27.0% or 50 of them being unemployed.
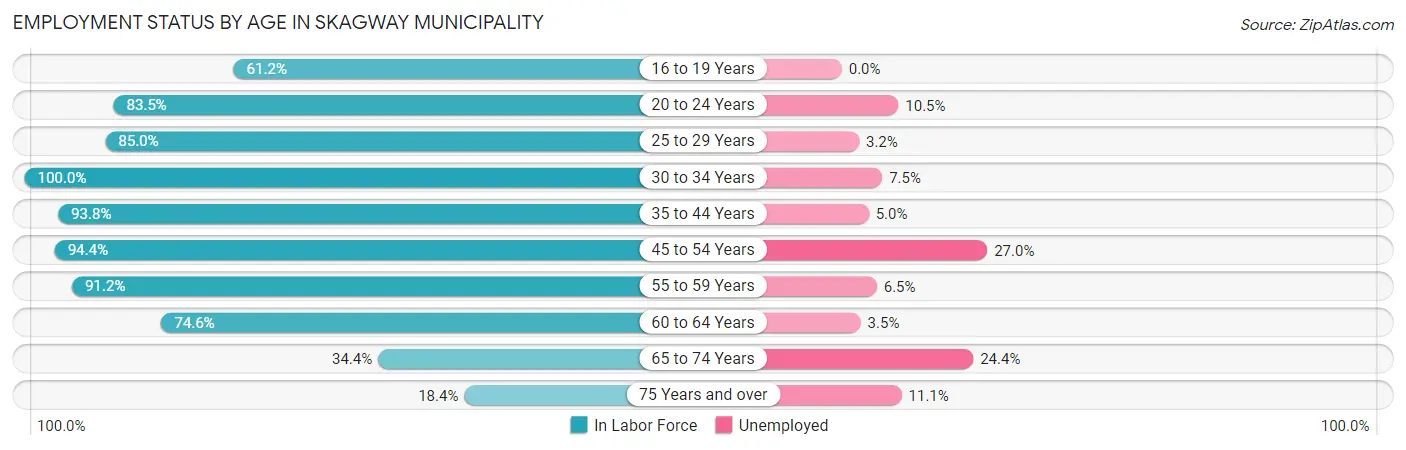
| Age Bracket | In Labor Force | Unemployed |
| 16 to 19 Years | 30 (61.2%) | 0 (0.0%) |
| 20 to 24 Years | 76 (83.5%) | 8 (10.5%) |
| 25 to 29 Years | 125 (85.0%) | 4 (3.2%) |
| 30 to 34 Years | 107 (100.0%) | 8 (7.5%) |
| 35 to 44 Years | 180 (93.8%) | 9 (5.0%) |
| 45 to 54 Years | 185 (94.4%) | 50 (27.0%) |
| 55 to 59 Years | 31 (91.2%) | 2 (6.5%) |
| 60 to 64 Years | 85 (74.6%) | 3 (3.5%) |
| 65 to 74 Years | 45 (34.4%) | 11 (24.4%) |
| 75 Years and over | 9 (18.4%) | 1 (11.1%) |
| Total | 872 (78.6%) | 96 (11.0%) |
Employment Status by Educational Attainment in Skagway Municipality
According to labor force statistics for Skagway Municipality, 90.3% of individuals (713) out of the total population between 25 and 64 years of age (790) are in the labor force, with 10.7% or 76 of them being unemployed. The group with the highest labor force participation rate are those with the educational attainment of high school diploma, with 92.4% or 268 individuals in the labor force. Within the labor force, individuals with college / associate degree education have the highest percentage of unemployment, with 26.5% or 59 of them being unemployed.
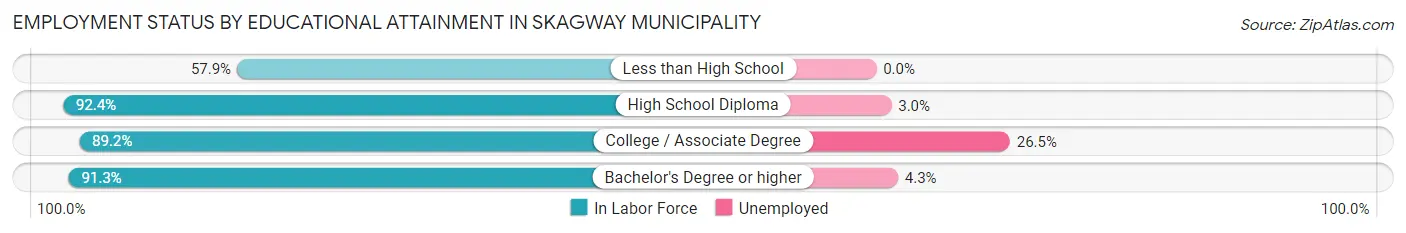
| Educational Attainment | In Labor Force | Unemployed |
| Less than High School | 11 (57.9%) | 0 (0.0%) |
| High School Diploma | 268 (92.4%) | 9 (3.0%) |
| College / Associate Degree | 223 (89.2%) | 66 (26.5%) |
| Bachelor's Degree or higher | 211 (91.3%) | 10 (4.3%) |
| Total | 713 (90.3%) | 85 (10.7%) |
Employment Occupations by Sex in Skagway Municipality
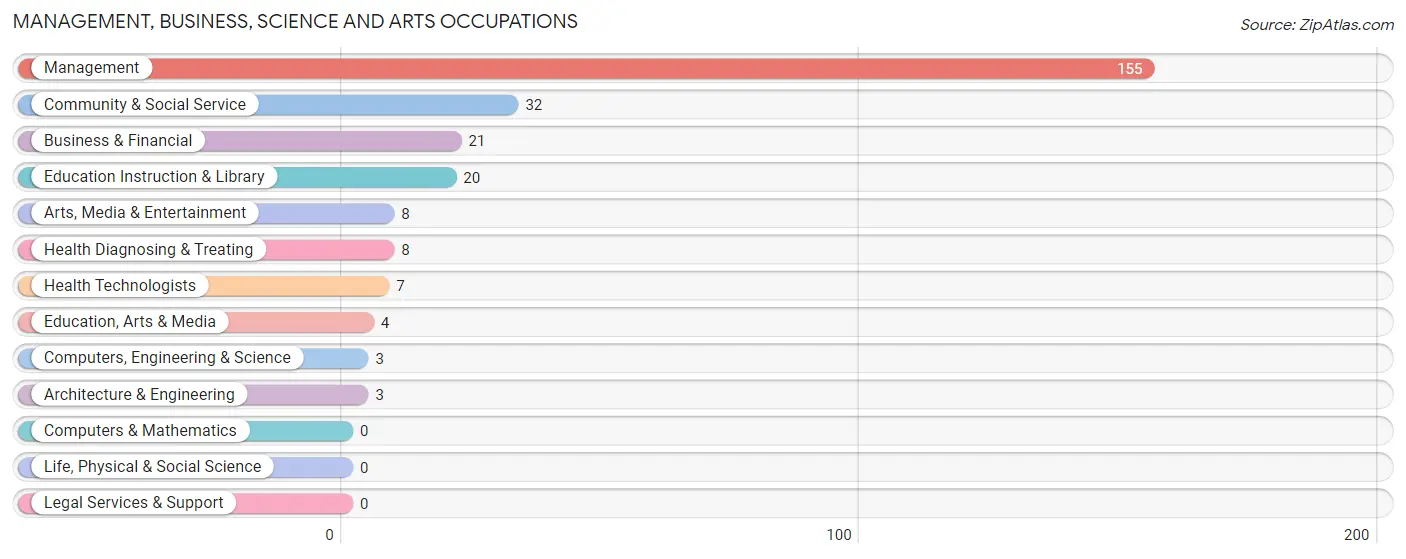
Management, Business, Science and Arts Occupations
The most common Management, Business, Science and Arts occupations in Skagway Municipality are Management (155 | 20.0%), Community & Social Service (32 | 4.1%), Business & Financial (21 | 2.7%), Education Instruction & Library (20 | 2.6%), and Arts, Media & Entertainment (8 | 1.0%).
Management, Business, Science and Arts Occupations by Sex
Within the Management, Business, Science and Arts occupations in Skagway Municipality, the most male-oriented occupations are Education, Arts & Media (50.0%), Management (39.4%), and Business & Financial (38.1%), while the most female-oriented occupations are Computers, Engineering & Science (100.0%), Architecture & Engineering (100.0%), and Health Diagnosing & Treating (100.0%).
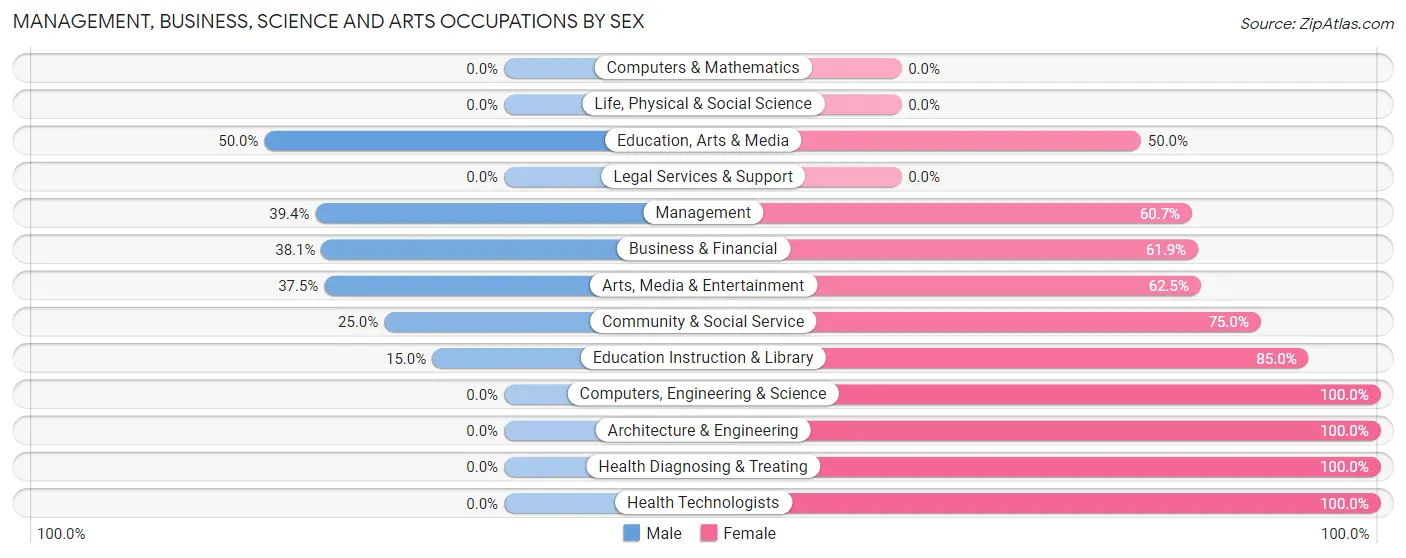
| Occupation | Male | Female |
| Management | 61 (39.4%) | 94 (60.7%) |
| Business & Financial | 8 (38.1%) | 13 (61.9%) |
| Computers, Engineering & Science | 0 (0.0%) | 3 (100.0%) |
| Computers & Mathematics | 0 (0.0%) | 0 (0.0%) |
| Architecture & Engineering | 0 (0.0%) | 3 (100.0%) |
| Life, Physical & Social Science | 0 (0.0%) | 0 (0.0%) |
| Community & Social Service | 8 (25.0%) | 24 (75.0%) |
| Education, Arts & Media | 2 (50.0%) | 2 (50.0%) |
| Legal Services & Support | 0 (0.0%) | 0 (0.0%) |
| Education Instruction & Library | 3 (15.0%) | 17 (85.0%) |
| Arts, Media & Entertainment | 3 (37.5%) | 5 (62.5%) |
| Health Diagnosing & Treating | 0 (0.0%) | 8 (100.0%) |
| Health Technologists | 0 (0.0%) | 7 (100.0%) |
| Total (Category) | 77 (35.2%) | 142 (64.8%) |
| Total (Overall) | 332 (42.7%) | 445 (57.3%) |
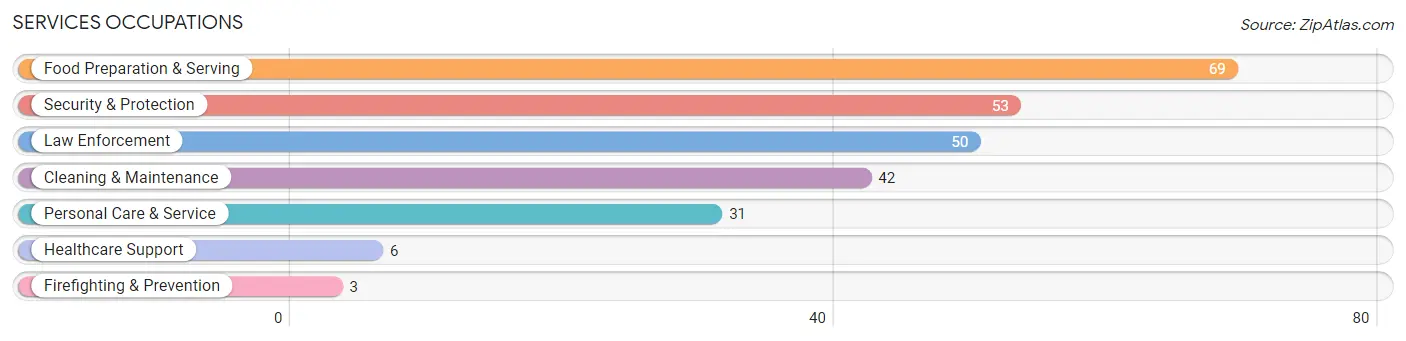
Services Occupations
The most common Services occupations in Skagway Municipality are Food Preparation & Serving (69 | 8.9%), Security & Protection (53 | 6.8%), Law Enforcement (50 | 6.4%), Cleaning & Maintenance (42 | 5.4%), and Personal Care & Service (31 | 4.0%).
Services Occupations by Sex
Within the Services occupations in Skagway Municipality, the most male-oriented occupations are Cleaning & Maintenance (73.8%), Food Preparation & Serving (60.9%), and Firefighting & Prevention (33.3%), while the most female-oriented occupations are Law Enforcement (94.0%), Security & Protection (92.4%), and Healthcare Support (83.3%).
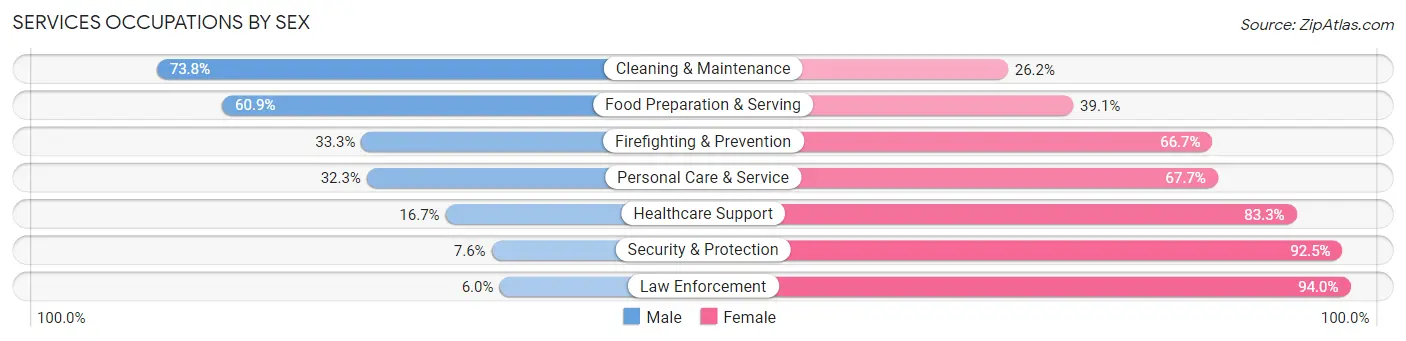
| Occupation | Male | Female |
| Healthcare Support | 1 (16.7%) | 5 (83.3%) |
| Security & Protection | 4 (7.5%) | 49 (92.4%) |
| Firefighting & Prevention | 1 (33.3%) | 2 (66.7%) |
| Law Enforcement | 3 (6.0%) | 47 (94.0%) |
| Food Preparation & Serving | 42 (60.9%) | 27 (39.1%) |
| Cleaning & Maintenance | 31 (73.8%) | 11 (26.2%) |
| Personal Care & Service | 10 (32.3%) | 21 (67.7%) |
| Total (Category) | 88 (43.8%) | 113 (56.2%) |
| Total (Overall) | 332 (42.7%) | 445 (57.3%) |
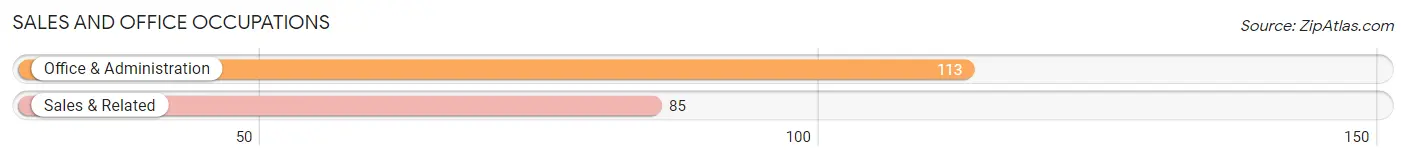
Sales and Office Occupations
The most common Sales and Office occupations in Skagway Municipality are Office & Administration (113 | 14.5%), and Sales & Related (85 | 10.9%).
Sales and Office Occupations by Sex
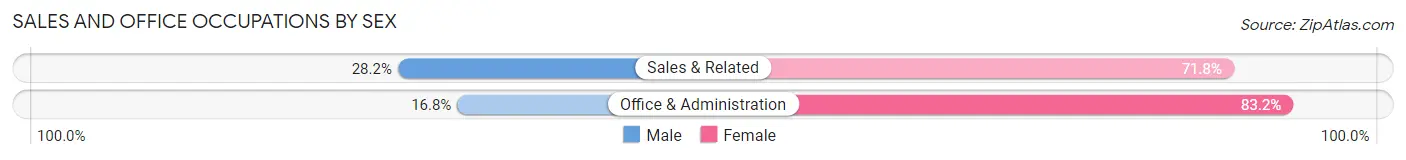
| Occupation | Male | Female |
| Sales & Related | 24 (28.2%) | 61 (71.8%) |
| Office & Administration | 19 (16.8%) | 94 (83.2%) |
| Total (Category) | 43 (21.7%) | 155 (78.3%) |
| Total (Overall) | 332 (42.7%) | 445 (57.3%) |
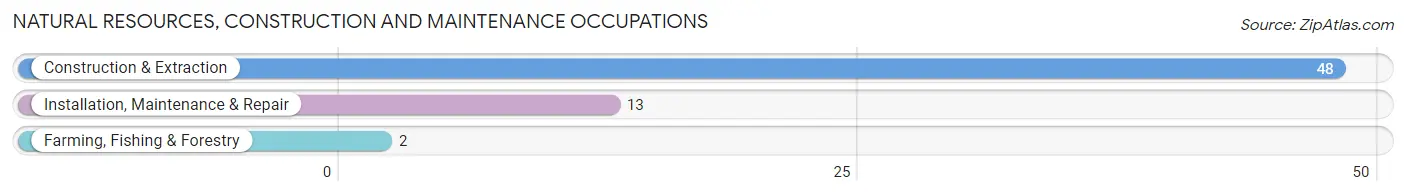
Natural Resources, Construction and Maintenance Occupations
The most common Natural Resources, Construction and Maintenance occupations in Skagway Municipality are Construction & Extraction (48 | 6.2%), Installation, Maintenance & Repair (13 | 1.7%), and Farming, Fishing & Forestry (2 | 0.3%).
Natural Resources, Construction and Maintenance Occupations by Sex
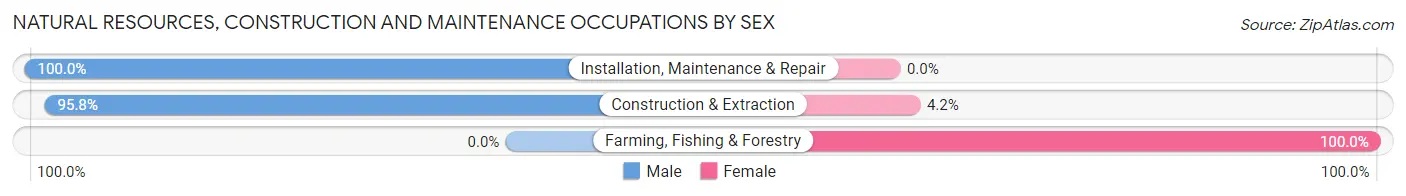
| Occupation | Male | Female |
| Farming, Fishing & Forestry | 0 (0.0%) | 2 (100.0%) |
| Construction & Extraction | 46 (95.8%) | 2 (4.2%) |
| Installation, Maintenance & Repair | 13 (100.0%) | 0 (0.0%) |
| Total (Category) | 59 (93.6%) | 4 (6.4%) |
| Total (Overall) | 332 (42.7%) | 445 (57.3%) |
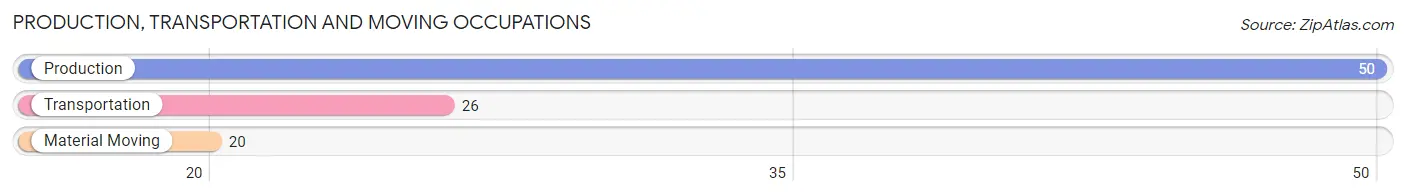
Production, Transportation and Moving Occupations
The most common Production, Transportation and Moving occupations in Skagway Municipality are Production (50 | 6.4%), Transportation (26 | 3.4%), and Material Moving (20 | 2.6%).
Production, Transportation and Moving Occupations by Sex
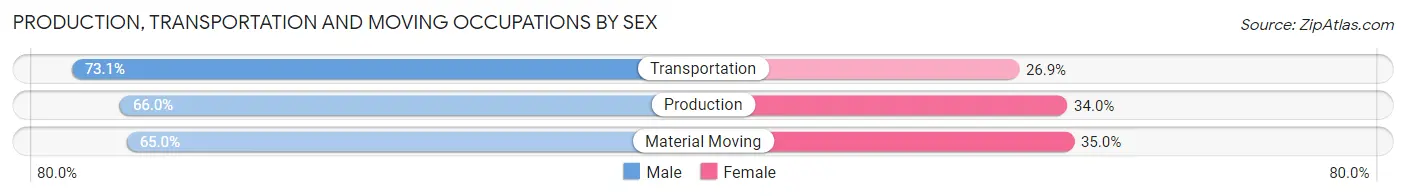
| Occupation | Male | Female |
| Production | 33 (66.0%) | 17 (34.0%) |
| Transportation | 19 (73.1%) | 7 (26.9%) |
| Material Moving | 13 (65.0%) | 7 (35.0%) |
| Total (Category) | 65 (67.7%) | 31 (32.3%) |
| Total (Overall) | 332 (42.7%) | 445 (57.3%) |
Employment Industries by Sex in Skagway Municipality
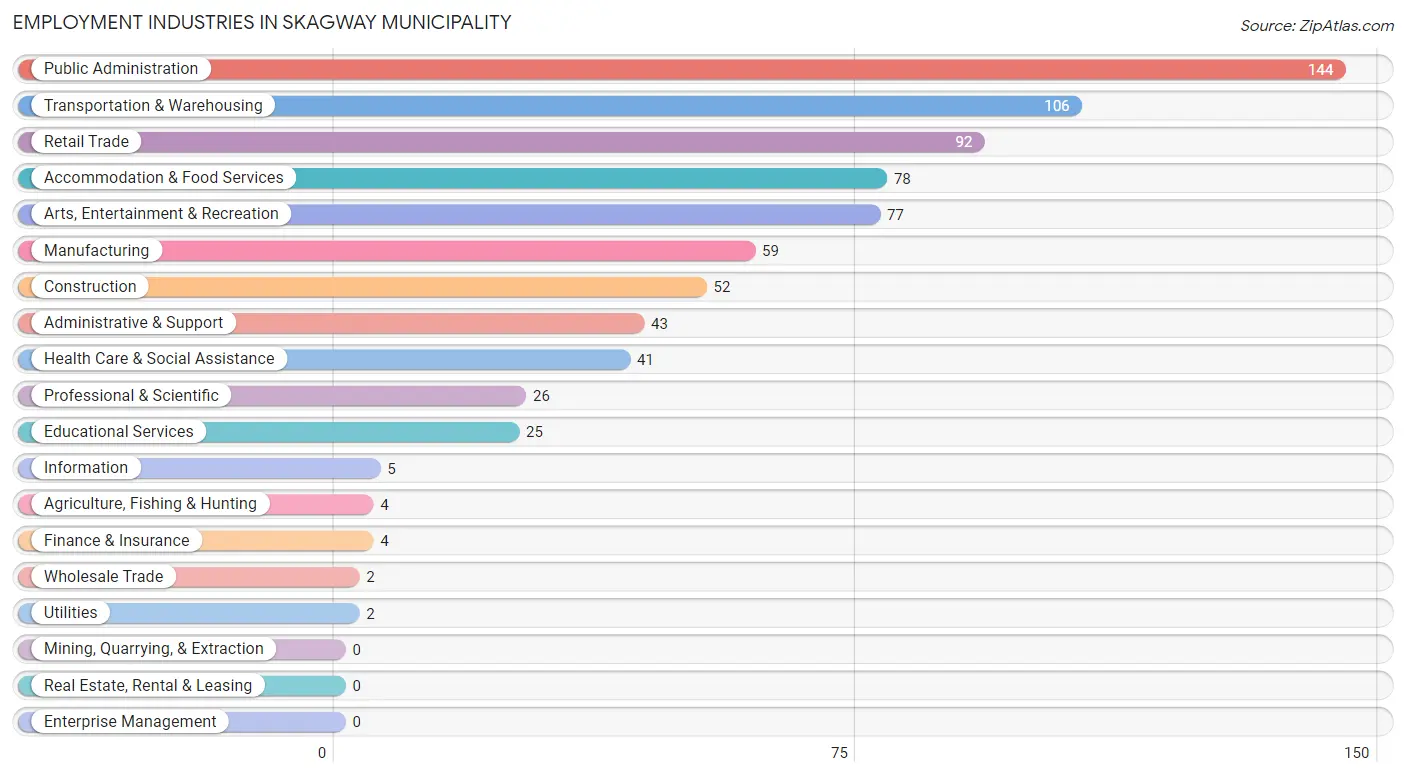
Employment Industries in Skagway Municipality
The major employment industries in Skagway Municipality include Public Administration (144 | 18.5%), Transportation & Warehousing (106 | 13.6%), Retail Trade (92 | 11.8%), Accommodation & Food Services (78 | 10.0%), and Arts, Entertainment & Recreation (77 | 9.9%).
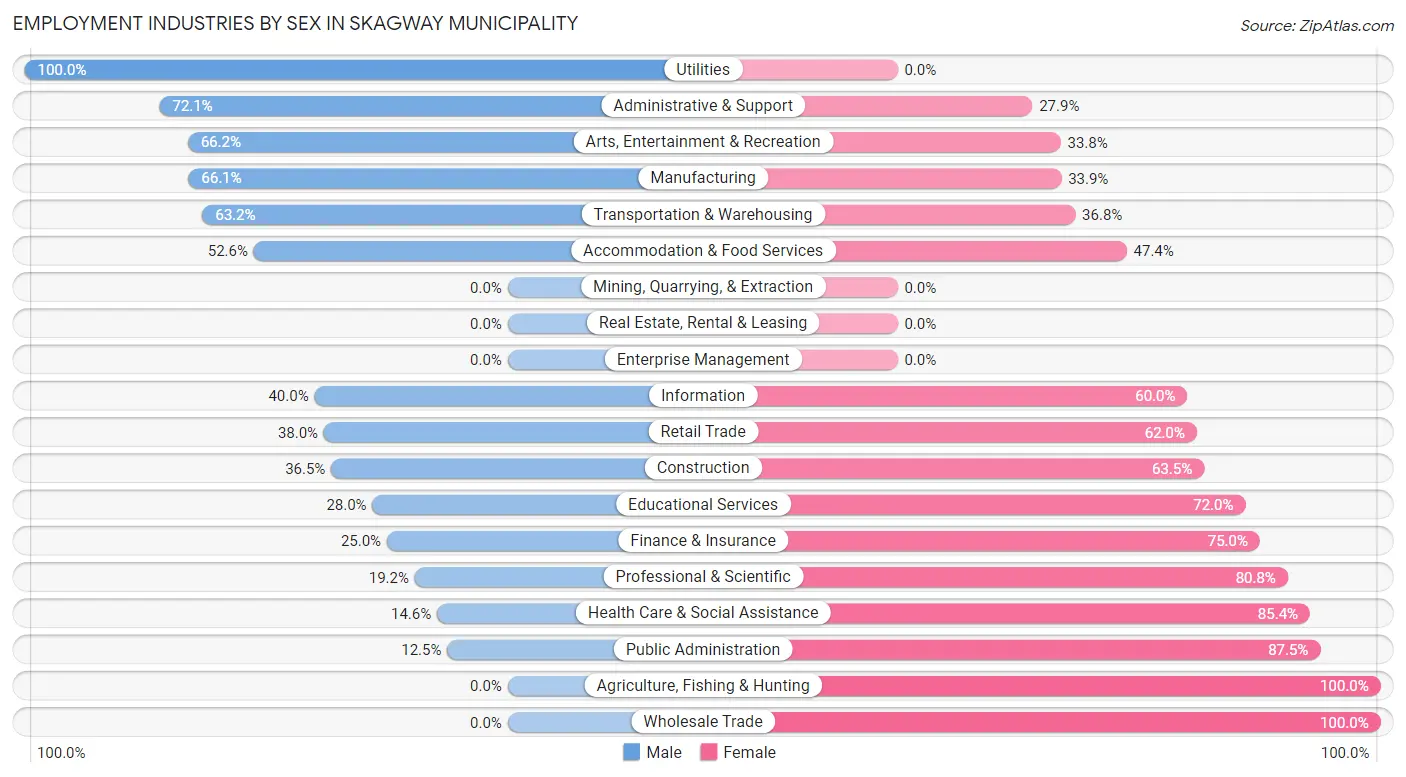
Employment Industries by Sex in Skagway Municipality
The Skagway Municipality industries that see more men than women are Utilities (100.0%), Administrative & Support (72.1%), and Arts, Entertainment & Recreation (66.2%), whereas the industries that tend to have a higher number of women are Agriculture, Fishing & Hunting (100.0%), Wholesale Trade (100.0%), and Public Administration (87.5%).
| Industry | Male | Female |
| Agriculture, Fishing & Hunting | 0 (0.0%) | 4 (100.0%) |
| Mining, Quarrying, & Extraction | 0 (0.0%) | 0 (0.0%) |
| Construction | 19 (36.5%) | 33 (63.5%) |
| Manufacturing | 39 (66.1%) | 20 (33.9%) |
| Wholesale Trade | 0 (0.0%) | 2 (100.0%) |
| Retail Trade | 35 (38.0%) | 57 (62.0%) |
| Transportation & Warehousing | 67 (63.2%) | 39 (36.8%) |
| Utilities | 2 (100.0%) | 0 (0.0%) |
| Information | 2 (40.0%) | 3 (60.0%) |
| Finance & Insurance | 1 (25.0%) | 3 (75.0%) |
| Real Estate, Rental & Leasing | 0 (0.0%) | 0 (0.0%) |
| Professional & Scientific | 5 (19.2%) | 21 (80.8%) |
| Enterprise Management | 0 (0.0%) | 0 (0.0%) |
| Administrative & Support | 31 (72.1%) | 12 (27.9%) |
| Educational Services | 7 (28.0%) | 18 (72.0%) |
| Health Care & Social Assistance | 6 (14.6%) | 35 (85.4%) |
| Arts, Entertainment & Recreation | 51 (66.2%) | 26 (33.8%) |
| Accommodation & Food Services | 41 (52.6%) | 37 (47.4%) |
| Public Administration | 18 (12.5%) | 126 (87.5%) |
| Total | 332 (42.7%) | 445 (57.3%) |
Education in Skagway Municipality
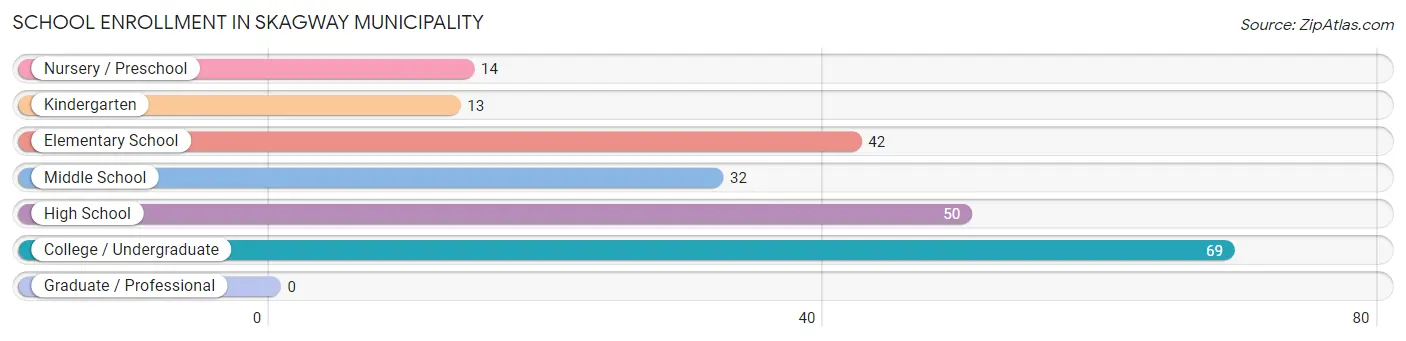
School Enrollment in Skagway Municipality
The most common levels of schooling among the 220 students in Skagway Municipality are college / undergraduate (69 | 31.4%), high school (50 | 22.7%), and elementary school (42 | 19.1%).
| School Level | # Students | % Students |
| Nursery / Preschool | 14 | 6.4% |
| Kindergarten | 13 | 5.9% |
| Elementary School | 42 | 19.1% |
| Middle School | 32 | 14.5% |
| High School | 50 | 22.7% |
| College / Undergraduate | 69 | 31.4% |
| Graduate / Professional | 0 | 0.0% |
| Total | 220 | 100.0% |
School Enrollment by Age by Funding Source in Skagway Municipality
Out of a total of 220 students who are enrolled in schools in Skagway Municipality, 2 (0.9%) attend a private institution, while the remaining 218 (99.1%) are enrolled in public schools. The age group of 18 to 19 year olds has the highest likelihood of being enrolled in private schools, with 2 (9.5% in the age bracket) enrolled. Conversely, the age group of 3 to 4 year olds has the lowest likelihood of being enrolled in a private school, with 11 (100.0% in the age bracket) attending a public institution.
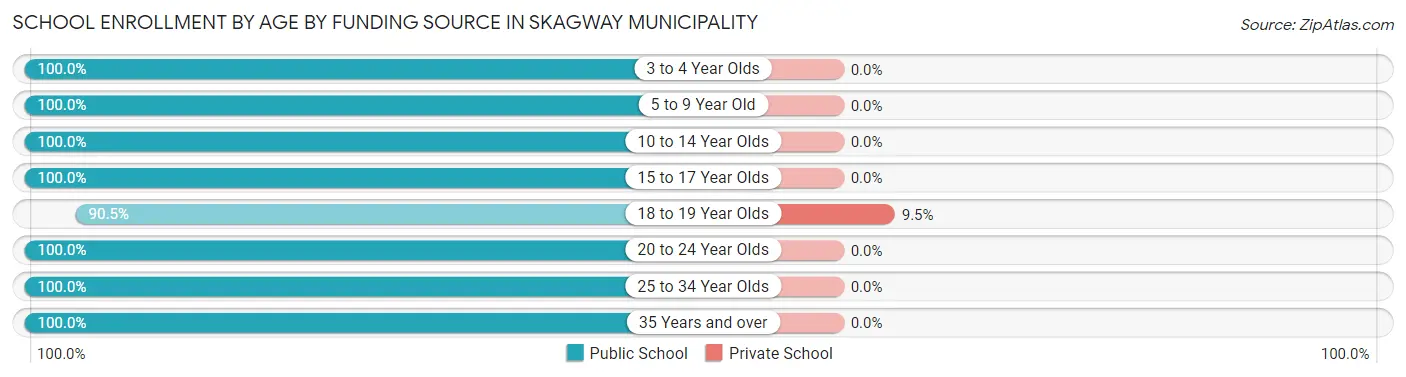
| Age Bracket | Public School | Private School |
| 3 to 4 Year Olds | 11 (100.0%) | 0 (0.0%) |
| 5 to 9 Year Old | 58 (100.0%) | 0 (0.0%) |
| 10 to 14 Year Olds | 46 (100.0%) | 0 (0.0%) |
| 15 to 17 Year Olds | 22 (100.0%) | 0 (0.0%) |
| 18 to 19 Year Olds | 19 (90.5%) | 2 (9.5%) |
| 20 to 24 Year Olds | 14 (100.0%) | 0 (0.0%) |
| 25 to 34 Year Olds | 3 (100.0%) | 0 (0.0%) |
| 35 Years and over | 45 (100.0%) | 0 (0.0%) |
| Total | 218 (99.1%) | 2 (0.9%) |
Educational Attainment by Field of Study in Skagway Municipality
Business (61 | 20.7%), physical & health sciences (42 | 14.2%), bio, nature & agricultural (31 | 10.5%), arts & humanities (26 | 8.8%), and education (21 | 7.1%) are the most common fields of study among 295 individuals in Skagway Municipality who have obtained a bachelor's degree or higher.
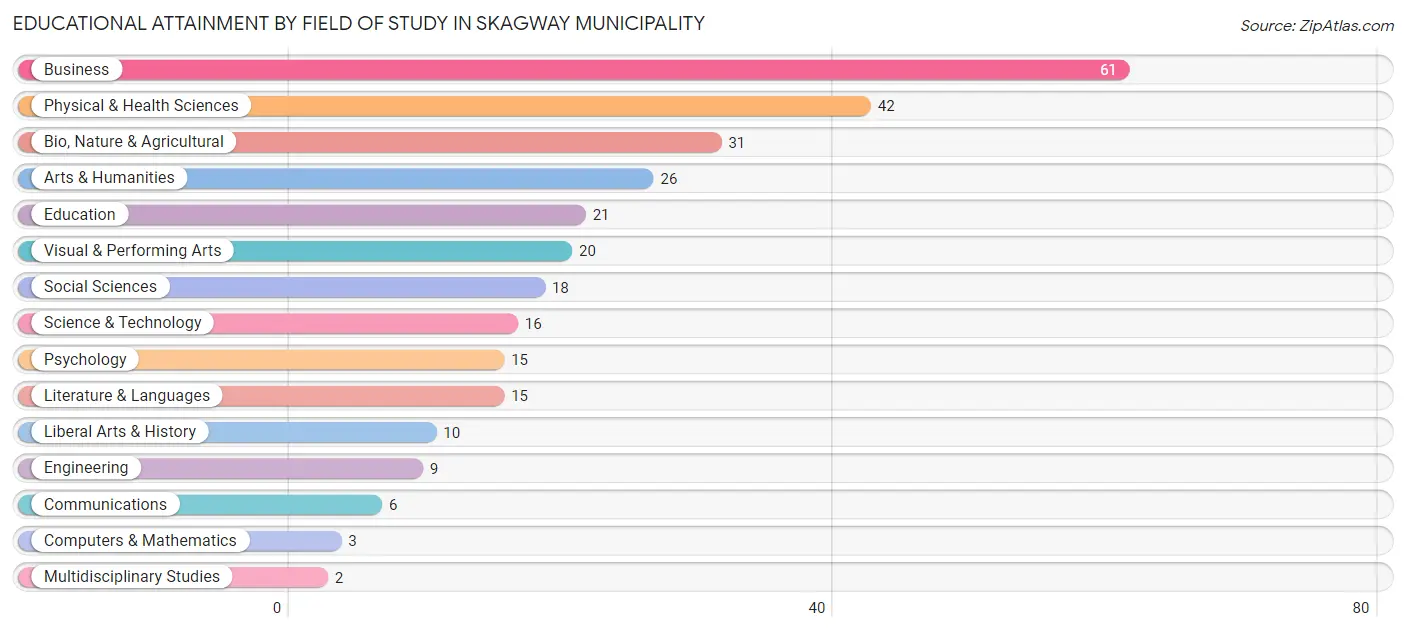
| Field of Study | # Graduates | % Graduates |
| Computers & Mathematics | 3 | 1.0% |
| Bio, Nature & Agricultural | 31 | 10.5% |
| Physical & Health Sciences | 42 | 14.2% |
| Psychology | 15 | 5.1% |
| Social Sciences | 18 | 6.1% |
| Engineering | 9 | 3.0% |
| Multidisciplinary Studies | 2 | 0.7% |
| Science & Technology | 16 | 5.4% |
| Business | 61 | 20.7% |
| Education | 21 | 7.1% |
| Literature & Languages | 15 | 5.1% |
| Liberal Arts & History | 10 | 3.4% |
| Visual & Performing Arts | 20 | 6.8% |
| Communications | 6 | 2.0% |
| Arts & Humanities | 26 | 8.8% |
| Total | 295 | 100.0% |
Transportation & Commute in Skagway Municipality
Vehicle Availability by Sex in Skagway Municipality
The most prevalent vehicle ownership categories in Skagway Municipality are males with 1 vehicle (70, accounting for 27.3%) and females with 1 vehicle (101, making up 21.9%).
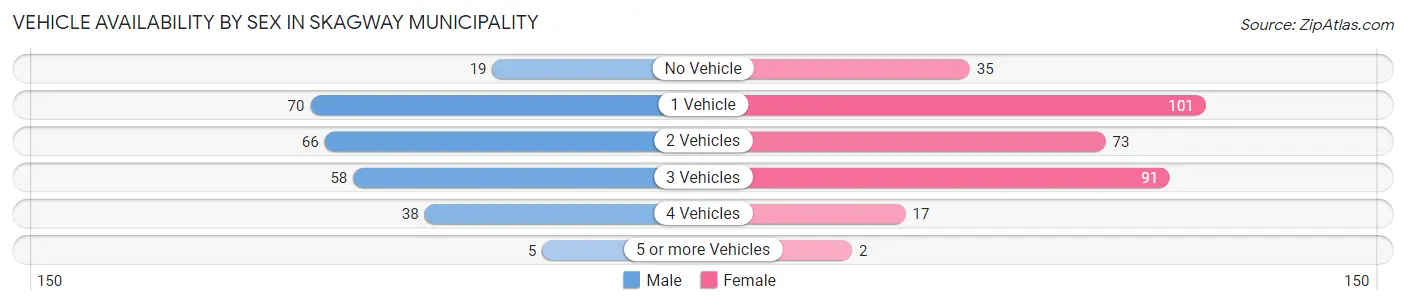
| Vehicles Available | Male | Female |
| No Vehicle | 19 (7.4%) | 35 (11.0%) |
| 1 Vehicle | 70 (27.3%) | 101 (31.7%) |
| 2 Vehicles | 66 (25.8%) | 73 (22.9%) |
| 3 Vehicles | 58 (22.7%) | 91 (28.5%) |
| 4 Vehicles | 38 (14.8%) | 17 (5.3%) |
| 5 or more Vehicles | 5 (1.9%) | 2 (0.6%) |
| Total | 256 (100.0%) | 319 (100.0%) |
Commute Time in Skagway Municipality
The most frequently occuring commute durations in Skagway Municipality are less than 5 minutes (297 commuters, 40.5%), 5 to 9 minutes (269 commuters, 36.7%), and 10 to 14 minutes (105 commuters, 14.3%).
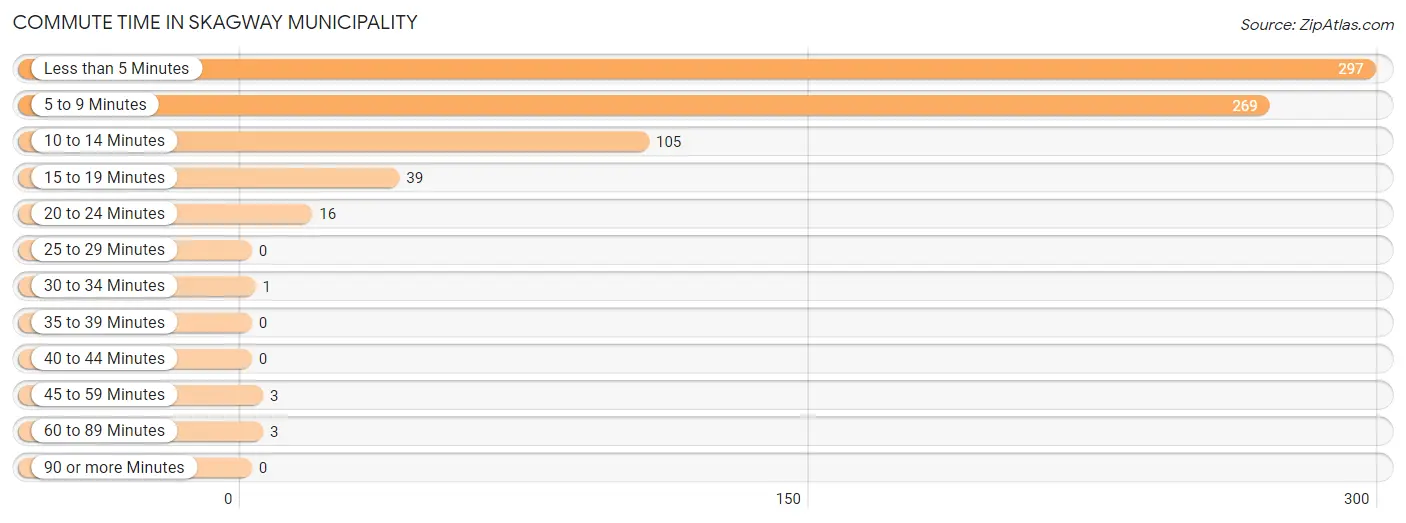
| Commute Time | # Commuters | % Commuters |
| Less than 5 Minutes | 297 | 40.5% |
| 5 to 9 Minutes | 269 | 36.7% |
| 10 to 14 Minutes | 105 | 14.3% |
| 15 to 19 Minutes | 39 | 5.3% |
| 20 to 24 Minutes | 16 | 2.2% |
| 25 to 29 Minutes | 0 | 0.0% |
| 30 to 34 Minutes | 1 | 0.1% |
| 35 to 39 Minutes | 0 | 0.0% |
| 40 to 44 Minutes | 0 | 0.0% |
| 45 to 59 Minutes | 3 | 0.4% |
| 60 to 89 Minutes | 3 | 0.4% |
| 90 or more Minutes | 0 | 0.0% |
Commute Time by Sex in Skagway Municipality
The most common commute times in Skagway Municipality are 5 to 9 minutes (138 commuters, 43.5%) for males and less than 5 minutes (164 commuters, 39.4%) for females.
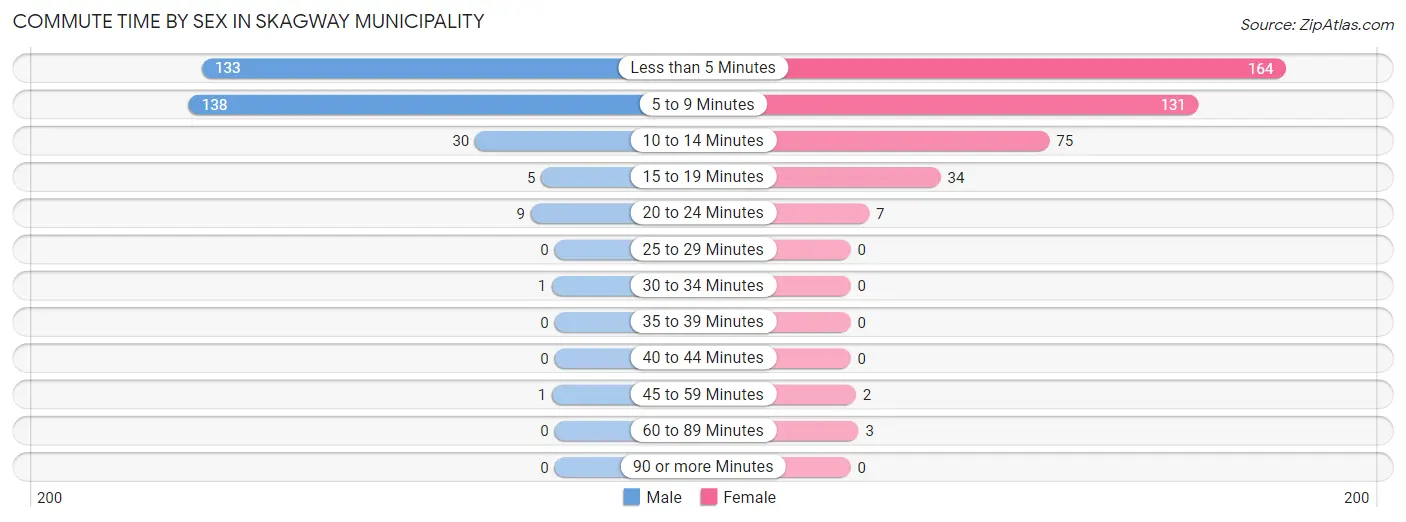
| Commute Time | Male | Female |
| Less than 5 Minutes | 133 (42.0%) | 164 (39.4%) |
| 5 to 9 Minutes | 138 (43.5%) | 131 (31.5%) |
| 10 to 14 Minutes | 30 (9.5%) | 75 (18.0%) |
| 15 to 19 Minutes | 5 (1.6%) | 34 (8.2%) |
| 20 to 24 Minutes | 9 (2.8%) | 7 (1.7%) |
| 25 to 29 Minutes | 0 (0.0%) | 0 (0.0%) |
| 30 to 34 Minutes | 1 (0.3%) | 0 (0.0%) |
| 35 to 39 Minutes | 0 (0.0%) | 0 (0.0%) |
| 40 to 44 Minutes | 0 (0.0%) | 0 (0.0%) |
| 45 to 59 Minutes | 1 (0.3%) | 2 (0.5%) |
| 60 to 89 Minutes | 0 (0.0%) | 3 (0.7%) |
| 90 or more Minutes | 0 (0.0%) | 0 (0.0%) |
Time of Departure to Work by Sex in Skagway Municipality
The most frequent times of departure to work in Skagway Municipality are 6:30 AM to 6:59 AM (98, 30.9%) for males and 7:00 AM to 7:29 AM (84, 20.2%) for females.
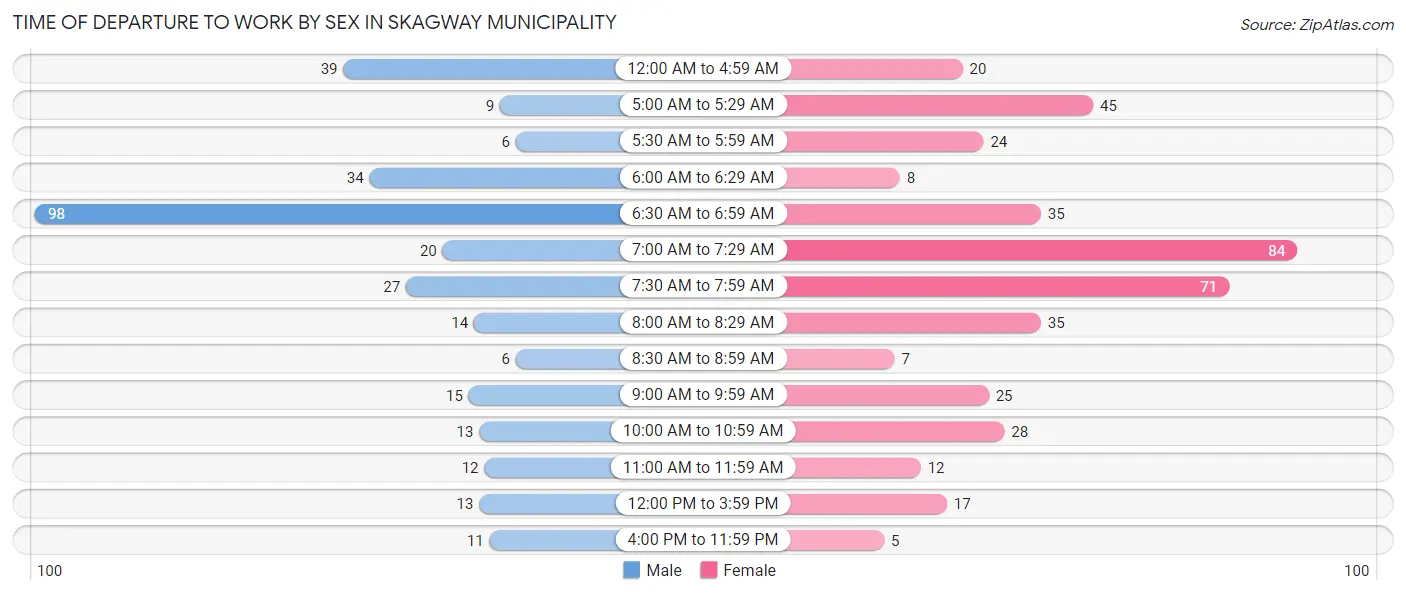
| Time of Departure | Male | Female |
| 12:00 AM to 4:59 AM | 39 (12.3%) | 20 (4.8%) |
| 5:00 AM to 5:29 AM | 9 (2.8%) | 45 (10.8%) |
| 5:30 AM to 5:59 AM | 6 (1.9%) | 24 (5.8%) |
| 6:00 AM to 6:29 AM | 34 (10.7%) | 8 (1.9%) |
| 6:30 AM to 6:59 AM | 98 (30.9%) | 35 (8.4%) |
| 7:00 AM to 7:29 AM | 20 (6.3%) | 84 (20.2%) |
| 7:30 AM to 7:59 AM | 27 (8.5%) | 71 (17.1%) |
| 8:00 AM to 8:29 AM | 14 (4.4%) | 35 (8.4%) |
| 8:30 AM to 8:59 AM | 6 (1.9%) | 7 (1.7%) |
| 9:00 AM to 9:59 AM | 15 (4.7%) | 25 (6.0%) |
| 10:00 AM to 10:59 AM | 13 (4.1%) | 28 (6.7%) |
| 11:00 AM to 11:59 AM | 12 (3.8%) | 12 (2.9%) |
| 12:00 PM to 3:59 PM | 13 (4.1%) | 17 (4.1%) |
| 4:00 PM to 11:59 PM | 11 (3.5%) | 5 (1.2%) |
| Total | 317 (100.0%) | 416 (100.0%) |
Housing Occupancy in Skagway Municipality
Occupancy by Ownership in Skagway Municipality
Of the total 410 dwellings in Skagway Municipality, owner-occupied units account for 269 (65.6%), while renter-occupied units make up 141 (34.4%).
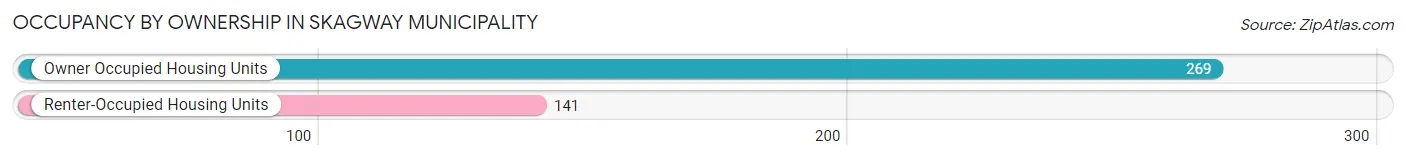
| Occupancy | # Housing Units | % Housing Units |
| Owner Occupied Housing Units | 269 | 65.6% |
| Renter-Occupied Housing Units | 141 | 34.4% |
| Total Occupied Housing Units | 410 | 100.0% |
Occupancy by Household Size in Skagway Municipality
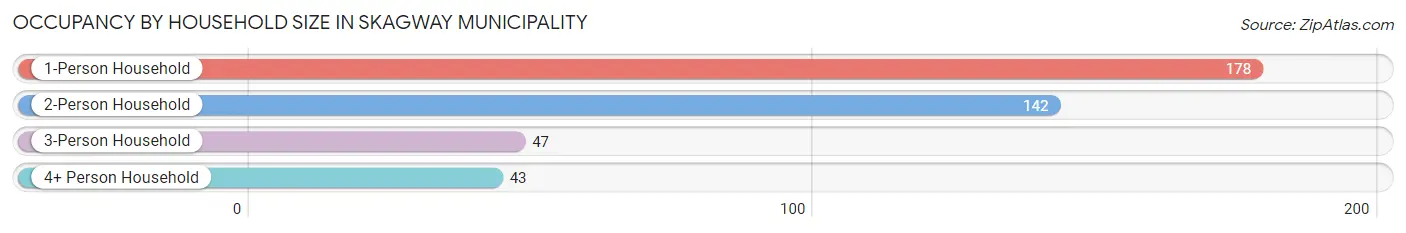
| Household Size | # Housing Units | % Housing Units |
| 1-Person Household | 178 | 43.4% |
| 2-Person Household | 142 | 34.6% |
| 3-Person Household | 47 | 11.5% |
| 4+ Person Household | 43 | 10.5% |
| Total Housing Units | 410 | 100.0% |
Occupancy by Ownership by Household Size in Skagway Municipality
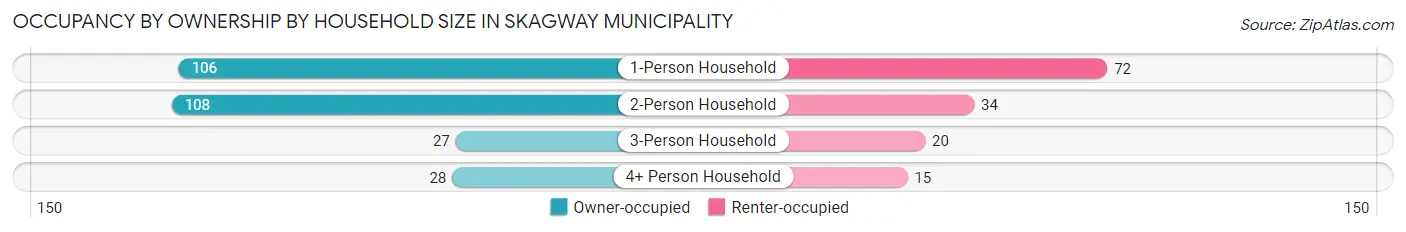
| Household Size | Owner-occupied | Renter-occupied |
| 1-Person Household | 106 (59.6%) | 72 (40.5%) |
| 2-Person Household | 108 (76.1%) | 34 (23.9%) |
| 3-Person Household | 27 (57.5%) | 20 (42.5%) |
| 4+ Person Household | 28 (65.1%) | 15 (34.9%) |
| Total Housing Units | 269 (65.6%) | 141 (34.4%) |
Occupancy by Educational Attainment in Skagway Municipality
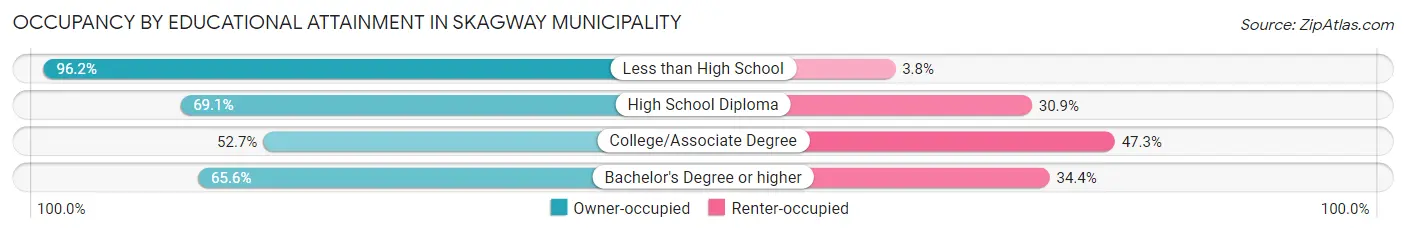
| Household Size | Owner-occupied | Renter-occupied |
| Less than High School | 51 (96.2%) | 2 (3.8%) |
| High School Diploma | 56 (69.1%) | 25 (30.9%) |
| College/Associate Degree | 78 (52.7%) | 70 (47.3%) |
| Bachelor's Degree or higher | 84 (65.6%) | 44 (34.4%) |
Occupancy by Age of Householder in Skagway Municipality
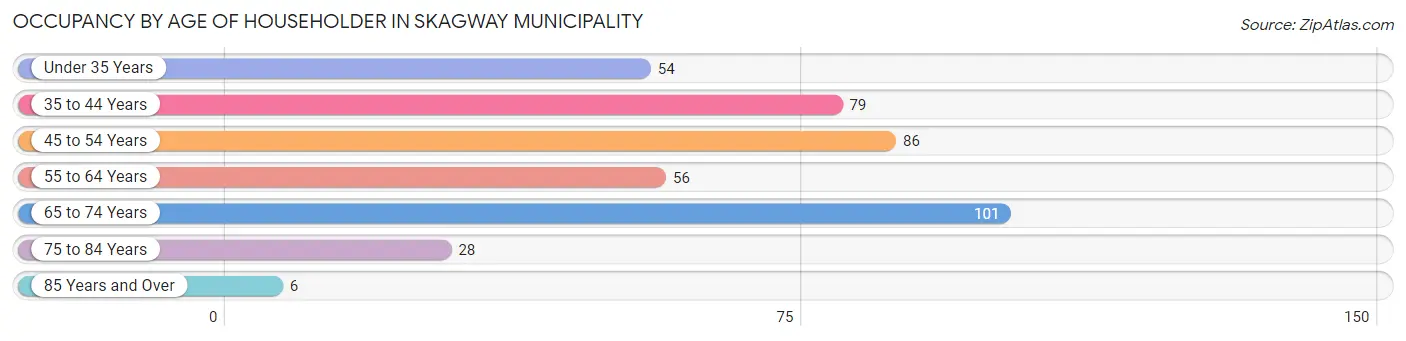
| Age Bracket | # Households | % Households |
| Under 35 Years | 54 | 13.2% |
| 35 to 44 Years | 79 | 19.3% |
| 45 to 54 Years | 86 | 21.0% |
| 55 to 64 Years | 56 | 13.7% |
| 65 to 74 Years | 101 | 24.6% |
| 75 to 84 Years | 28 | 6.8% |
| 85 Years and Over | 6 | 1.5% |
| Total | 410 | 100.0% |
Housing Finances in Skagway Municipality
Median Income by Occupancy in Skagway Municipality
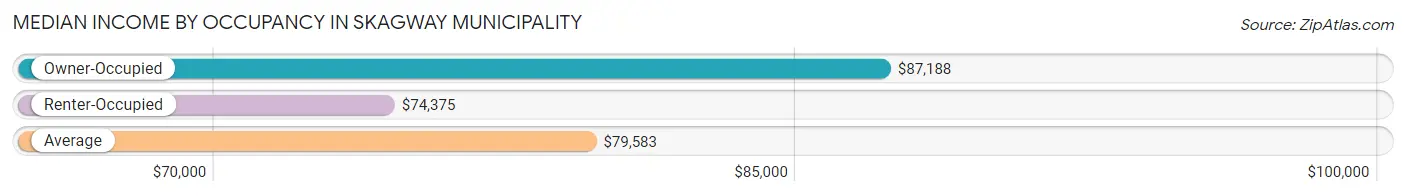
| Occupancy Type | # Households | Median Income |
| Owner-Occupied | 269 (65.6%) | $87,188 |
| Renter-Occupied | 141 (34.4%) | $74,375 |
| Average | 410 (100.0%) | $79,583 |
Occupancy by Householder Income Bracket in Skagway Municipality
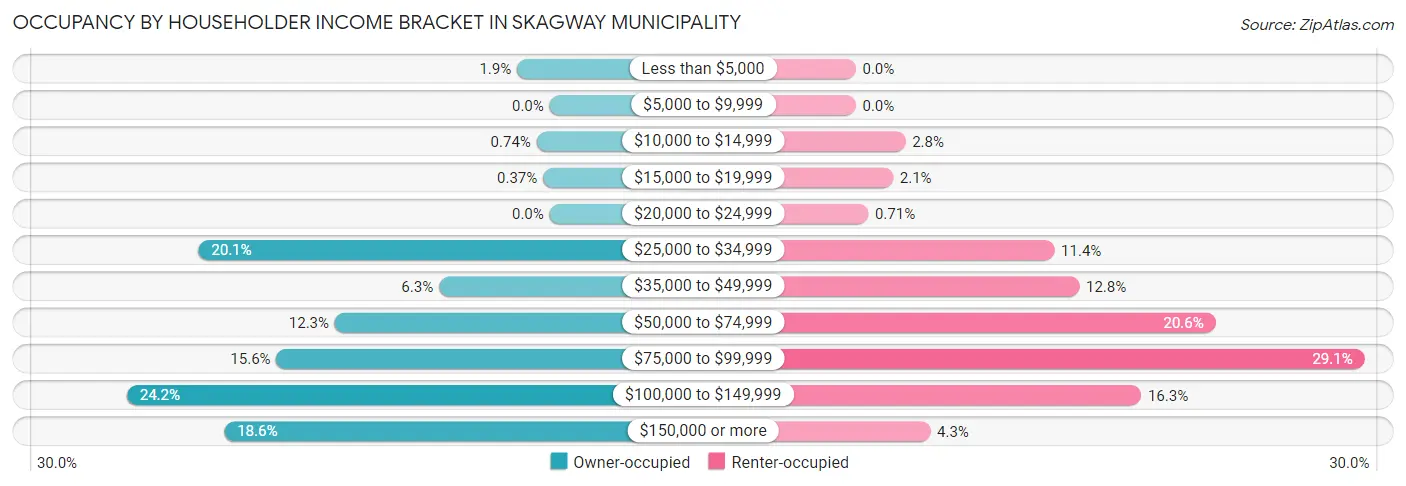
| Income Bracket | Owner-occupied | Renter-occupied |
| Less than $5,000 | 5 (1.9%) | 0 (0.0%) |
| $5,000 to $9,999 | 0 (0.0%) | 0 (0.0%) |
| $10,000 to $14,999 | 2 (0.7%) | 4 (2.8%) |
| $15,000 to $19,999 | 1 (0.4%) | 3 (2.1%) |
| $20,000 to $24,999 | 0 (0.0%) | 1 (0.7%) |
| $25,000 to $34,999 | 54 (20.1%) | 16 (11.4%) |
| $35,000 to $49,999 | 17 (6.3%) | 18 (12.8%) |
| $50,000 to $74,999 | 33 (12.3%) | 29 (20.6%) |
| $75,000 to $99,999 | 42 (15.6%) | 41 (29.1%) |
| $100,000 to $149,999 | 65 (24.2%) | 23 (16.3%) |
| $150,000 or more | 50 (18.6%) | 6 (4.3%) |
| Total | 269 (100.0%) | 141 (100.0%) |
Monthly Housing Cost Tiers in Skagway Municipality
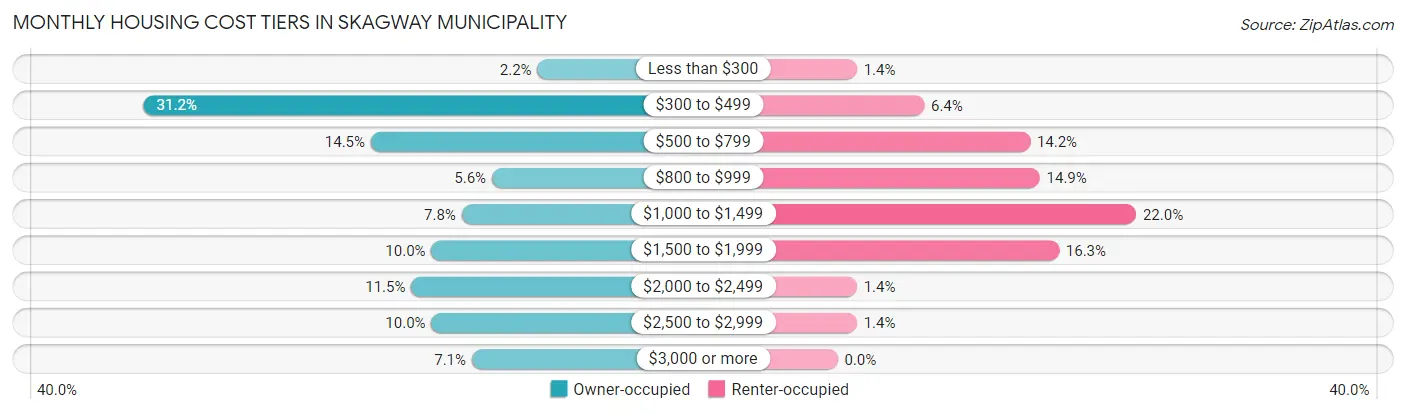
| Monthly Cost | Owner-occupied | Renter-occupied |
| Less than $300 | 6 (2.2%) | 2 (1.4%) |
| $300 to $499 | 84 (31.2%) | 9 (6.4%) |
| $500 to $799 | 39 (14.5%) | 20 (14.2%) |
| $800 to $999 | 15 (5.6%) | 21 (14.9%) |
| $1,000 to $1,499 | 21 (7.8%) | 31 (22.0%) |
| $1,500 to $1,999 | 27 (10.0%) | 23 (16.3%) |
| $2,000 to $2,499 | 31 (11.5%) | 2 (1.4%) |
| $2,500 to $2,999 | 27 (10.0%) | 2 (1.4%) |
| $3,000 or more | 19 (7.1%) | 0 (0.0%) |
| Total | 269 (100.0%) | 141 (100.0%) |
Physical Housing Characteristics in Skagway Municipality
Housing Structures in Skagway Municipality
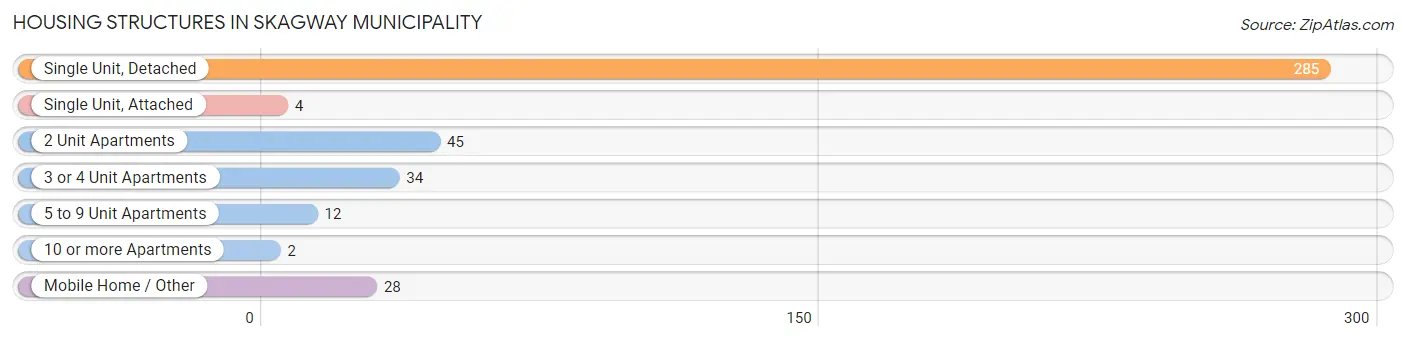
| Structure Type | # Housing Units | % Housing Units |
| Single Unit, Detached | 285 | 69.5% |
| Single Unit, Attached | 4 | 1.0% |
| 2 Unit Apartments | 45 | 11.0% |
| 3 or 4 Unit Apartments | 34 | 8.3% |
| 5 to 9 Unit Apartments | 12 | 2.9% |
| 10 or more Apartments | 2 | 0.5% |
| Mobile Home / Other | 28 | 6.8% |
| Total | 410 | 100.0% |
Housing Structures by Occupancy in Skagway Municipality
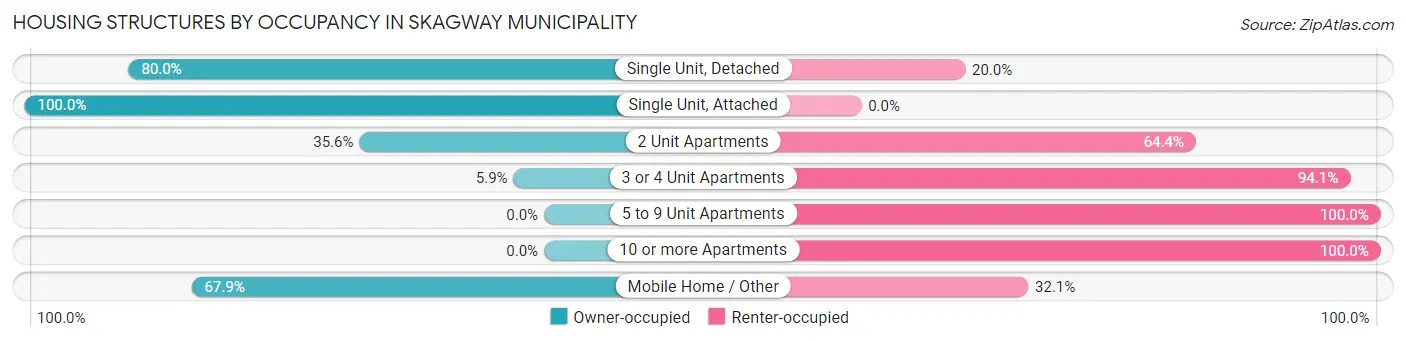
| Structure Type | Owner-occupied | Renter-occupied |
| Single Unit, Detached | 228 (80.0%) | 57 (20.0%) |
| Single Unit, Attached | 4 (100.0%) | 0 (0.0%) |
| 2 Unit Apartments | 16 (35.6%) | 29 (64.4%) |
| 3 or 4 Unit Apartments | 2 (5.9%) | 32 (94.1%) |
| 5 to 9 Unit Apartments | 0 (0.0%) | 12 (100.0%) |
| 10 or more Apartments | 0 (0.0%) | 2 (100.0%) |
| Mobile Home / Other | 19 (67.9%) | 9 (32.1%) |
| Total | 269 (65.6%) | 141 (34.4%) |
Housing Structures by Number of Rooms in Skagway Municipality
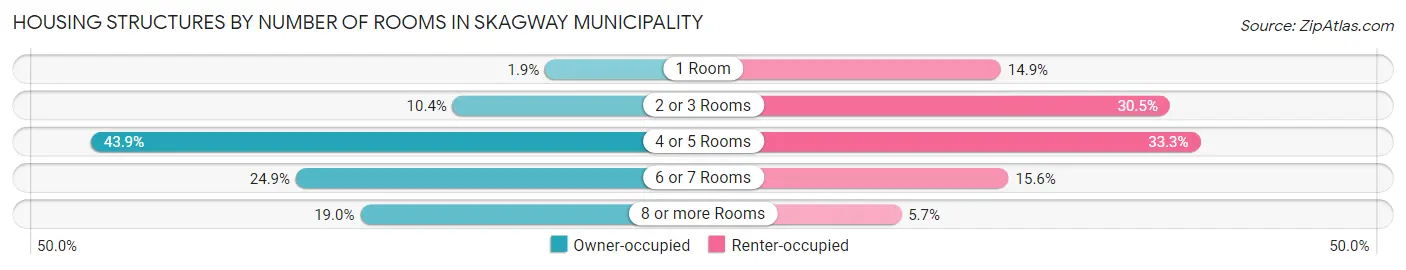
| Number of Rooms | Owner-occupied | Renter-occupied |
| 1 Room | 5 (1.9%) | 21 (14.9%) |
| 2 or 3 Rooms | 28 (10.4%) | 43 (30.5%) |
| 4 or 5 Rooms | 118 (43.9%) | 47 (33.3%) |
| 6 or 7 Rooms | 67 (24.9%) | 22 (15.6%) |
| 8 or more Rooms | 51 (19.0%) | 8 (5.7%) |
| Total | 269 (100.0%) | 141 (100.0%) |
Housing Structure by Heating Type in Skagway Municipality
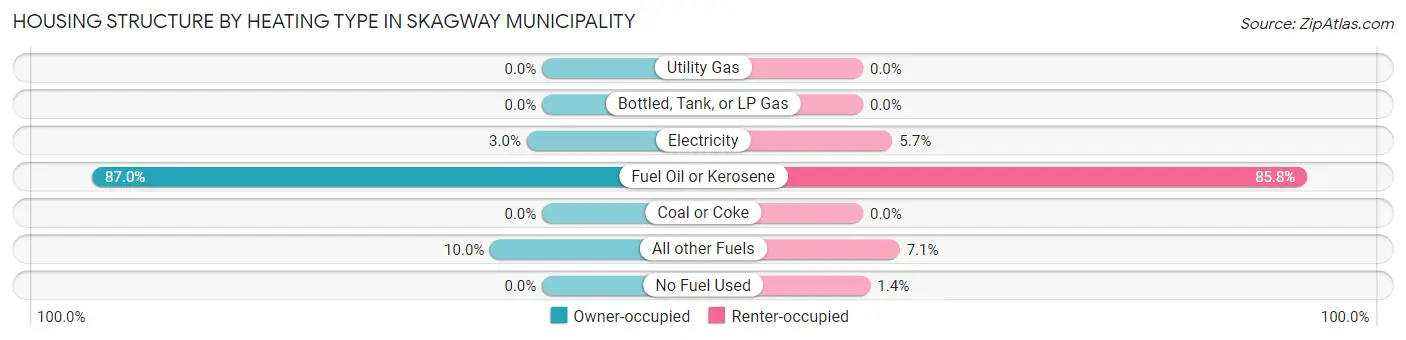
| Heating Type | Owner-occupied | Renter-occupied |
| Utility Gas | 0 (0.0%) | 0 (0.0%) |
| Bottled, Tank, or LP Gas | 0 (0.0%) | 0 (0.0%) |
| Electricity | 8 (3.0%) | 8 (5.7%) |
| Fuel Oil or Kerosene | 234 (87.0%) | 121 (85.8%) |
| Coal or Coke | 0 (0.0%) | 0 (0.0%) |
| All other Fuels | 27 (10.0%) | 10 (7.1%) |
| No Fuel Used | 0 (0.0%) | 2 (1.4%) |
| Total | 269 (100.0%) | 141 (100.0%) |
Household Vehicle Usage in Skagway Municipality
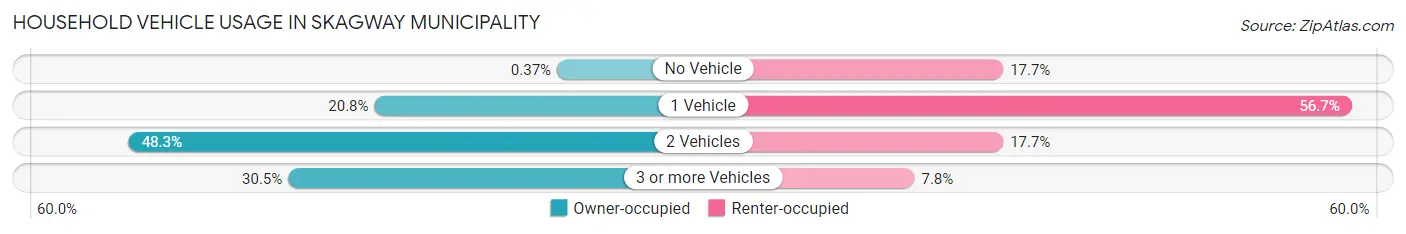
| Vehicles per Household | Owner-occupied | Renter-occupied |
| No Vehicle | 1 (0.4%) | 25 (17.7%) |
| 1 Vehicle | 56 (20.8%) | 80 (56.7%) |
| 2 Vehicles | 130 (48.3%) | 25 (17.7%) |
| 3 or more Vehicles | 82 (30.5%) | 11 (7.8%) |
| Total | 269 (100.0%) | 141 (100.0%) |
Real Estate & Mortgages in Skagway Municipality
Real Estate and Mortgage Overview in Skagway Municipality
| Characteristic | Without Mortgage | With Mortgage |
| Housing Units | 151 | 118 |
| Median Property Value | $435,900 | $431,900 |
| Median Household Income | $60,625 | $31 |
| Monthly Housing Costs | $434 | $19 |
| Real Estate Taxes | $1,322 | $0 |
Property Value by Mortgage Status in Skagway Municipality
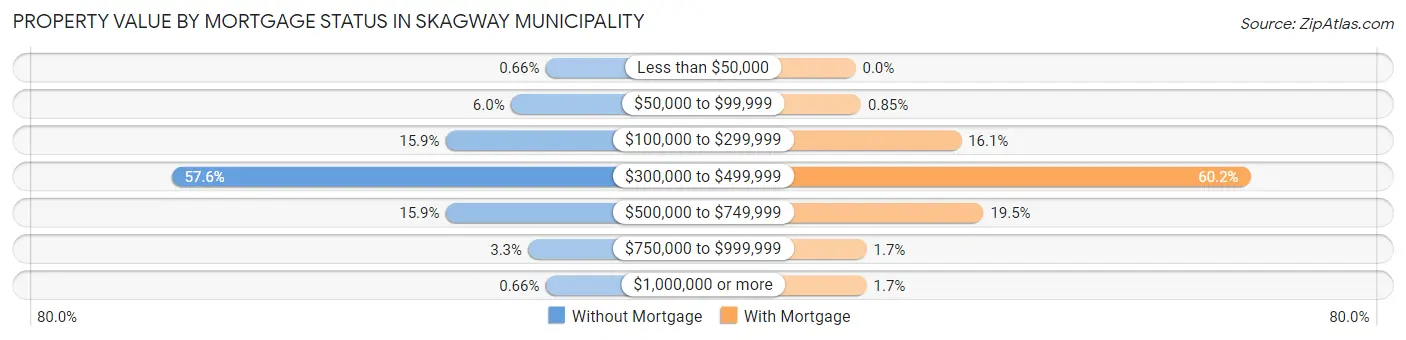
| Property Value | Without Mortgage | With Mortgage |
| Less than $50,000 | 1 (0.7%) | 0 (0.0%) |
| $50,000 to $99,999 | 9 (6.0%) | 1 (0.9%) |
| $100,000 to $299,999 | 24 (15.9%) | 19 (16.1%) |
| $300,000 to $499,999 | 87 (57.6%) | 71 (60.2%) |
| $500,000 to $749,999 | 24 (15.9%) | 23 (19.5%) |
| $750,000 to $999,999 | 5 (3.3%) | 2 (1.7%) |
| $1,000,000 or more | 1 (0.7%) | 2 (1.7%) |
| Total | 151 (100.0%) | 118 (100.0%) |
Household Income by Mortgage Status in Skagway Municipality
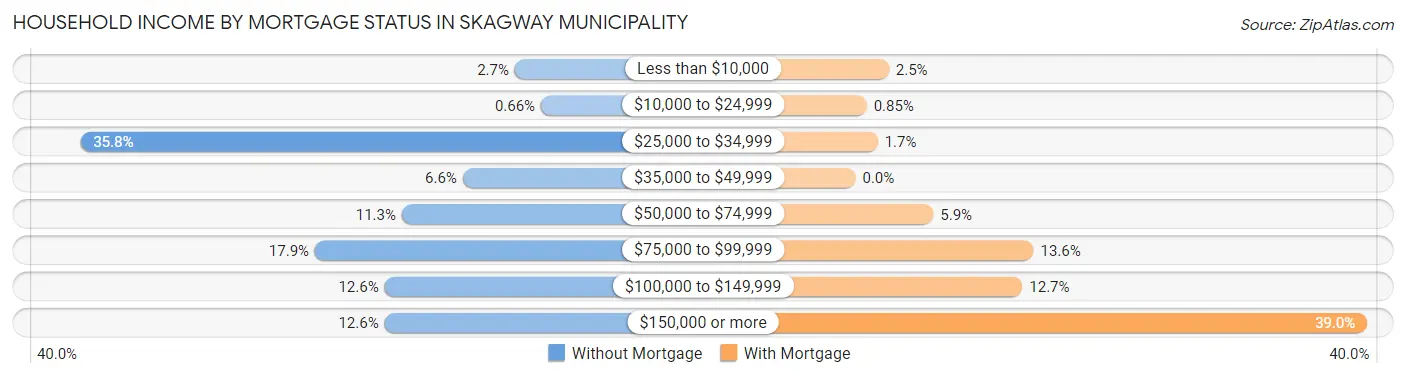
| Household Income | Without Mortgage | With Mortgage |
| Less than $10,000 | 4 (2.6%) | 3 (2.5%) |
| $10,000 to $24,999 | 1 (0.7%) | 1 (0.9%) |
| $25,000 to $34,999 | 54 (35.8%) | 2 (1.7%) |
| $35,000 to $49,999 | 10 (6.6%) | 0 (0.0%) |
| $50,000 to $74,999 | 17 (11.3%) | 7 (5.9%) |
| $75,000 to $99,999 | 27 (17.9%) | 16 (13.6%) |
| $100,000 to $149,999 | 19 (12.6%) | 15 (12.7%) |
| $150,000 or more | 19 (12.6%) | 46 (39.0%) |
| Total | 151 (100.0%) | 118 (100.0%) |
Property Value to Household Income Ratio in Skagway Municipality
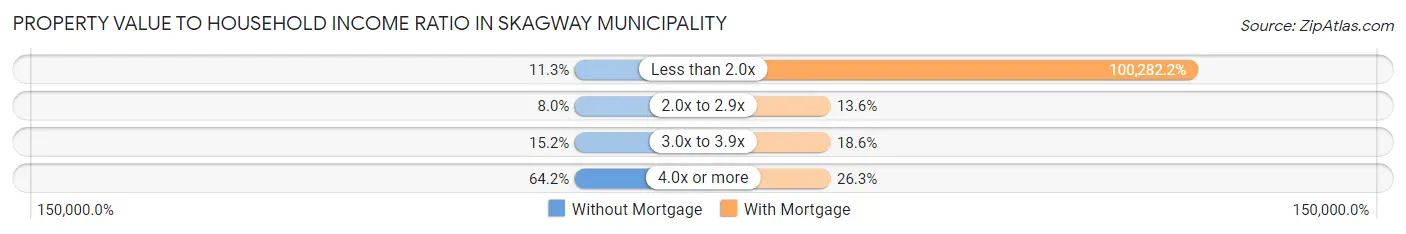
| Value-to-Income Ratio | Without Mortgage | With Mortgage |
| Less than 2.0x | 17 (11.3%) | 118,333 (100,282.2%) |
| 2.0x to 2.9x | 12 (8.0%) | 16 (13.6%) |
| 3.0x to 3.9x | 23 (15.2%) | 22 (18.6%) |
| 4.0x or more | 97 (64.2%) | 31 (26.3%) |
| Total | 151 (100.0%) | 118 (100.0%) |
Real Estate Taxes by Mortgage Status in Skagway Municipality
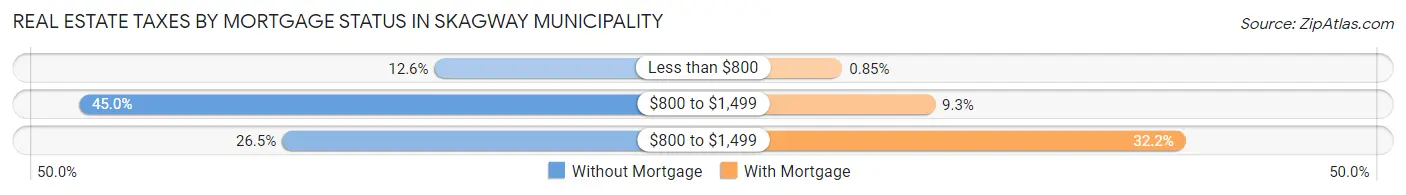
| Property Taxes | Without Mortgage | With Mortgage |
| Less than $800 | 19 (12.6%) | 1 (0.9%) |
| $800 to $1,499 | 68 (45.0%) | 11 (9.3%) |
| $800 to $1,499 | 40 (26.5%) | 38 (32.2%) |
| Total | 151 (100.0%) | 118 (100.0%) |
Health & Disability in Skagway Municipality
Health Insurance Coverage by Age in Skagway Municipality
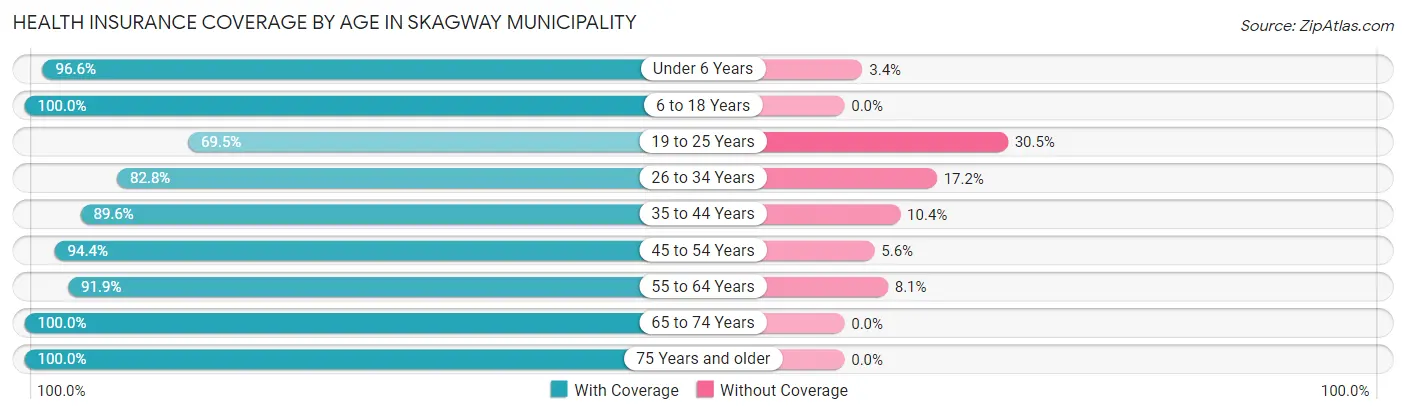
| Age Bracket | With Coverage | Without Coverage |
| Under 6 Years | 86 (96.6%) | 3 (3.4%) |
| 6 to 18 Years | 132 (100.0%) | 0 (0.0%) |
| 19 to 25 Years | 89 (69.5%) | 39 (30.5%) |
| 26 to 34 Years | 197 (82.8%) | 41 (17.2%) |
| 35 to 44 Years | 172 (89.6%) | 20 (10.4%) |
| 45 to 54 Years | 185 (94.4%) | 11 (5.6%) |
| 55 to 64 Years | 136 (91.9%) | 12 (8.1%) |
| 65 to 74 Years | 131 (100.0%) | 0 (0.0%) |
| 75 Years and older | 49 (100.0%) | 0 (0.0%) |
| Total | 1,177 (90.3%) | 126 (9.7%) |
Health Insurance Coverage by Citizenship Status in Skagway Municipality
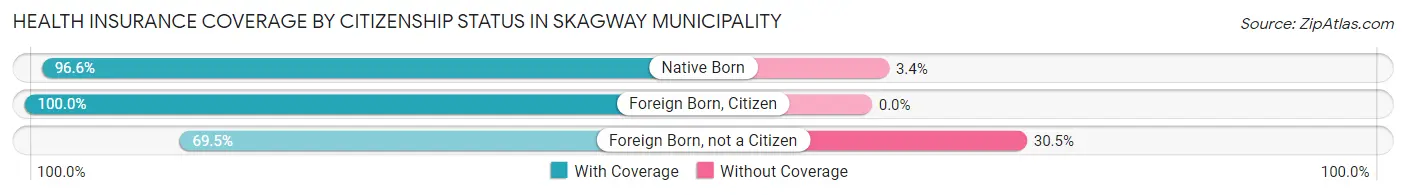
| Citizenship Status | With Coverage | Without Coverage |
| Native Born | 86 (96.6%) | 3 (3.4%) |
| Foreign Born, Citizen | 132 (100.0%) | 0 (0.0%) |
| Foreign Born, not a Citizen | 89 (69.5%) | 39 (30.5%) |
Health Insurance Coverage by Household Income in Skagway Municipality
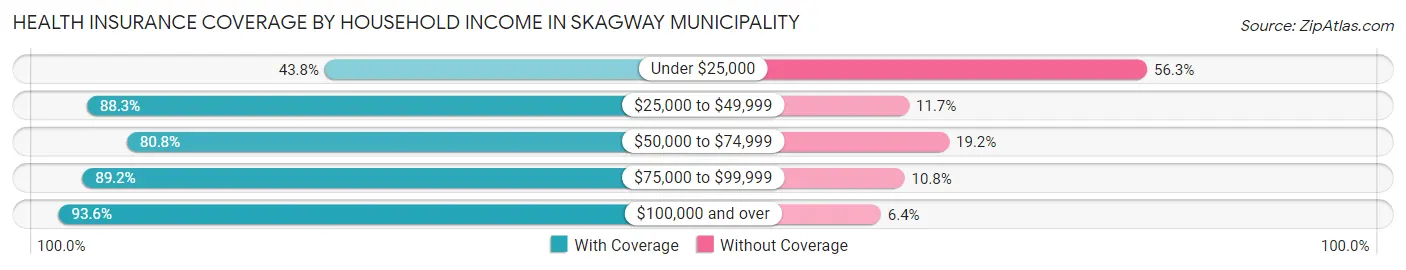
| Household Income | With Coverage | Without Coverage |
| Under $25,000 | 7 (43.8%) | 9 (56.2%) |
| $25,000 to $49,999 | 106 (88.3%) | 14 (11.7%) |
| $50,000 to $74,999 | 97 (80.8%) | 23 (19.2%) |
| $75,000 to $99,999 | 239 (89.2%) | 29 (10.8%) |
| $100,000 and over | 514 (93.6%) | 35 (6.4%) |
Public vs Private Health Insurance Coverage by Age in Skagway Municipality
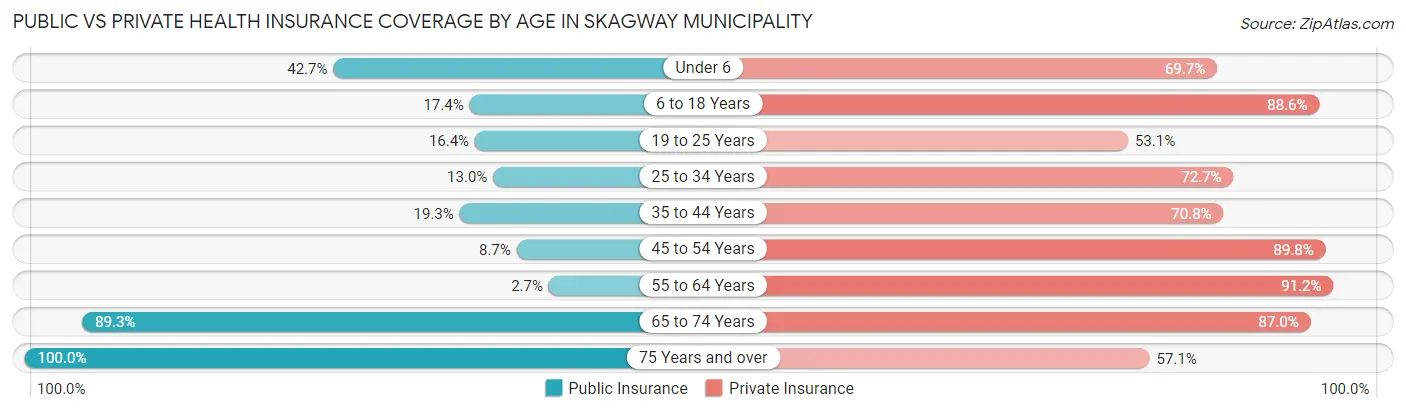
| Age Bracket | Public Insurance | Private Insurance |
| Under 6 | 38 (42.7%) | 62 (69.7%) |
| 6 to 18 Years | 23 (17.4%) | 117 (88.6%) |
| 19 to 25 Years | 21 (16.4%) | 68 (53.1%) |
| 25 to 34 Years | 31 (13.0%) | 173 (72.7%) |
| 35 to 44 Years | 37 (19.3%) | 136 (70.8%) |
| 45 to 54 Years | 17 (8.7%) | 176 (89.8%) |
| 55 to 64 Years | 4 (2.7%) | 135 (91.2%) |
| 65 to 74 Years | 117 (89.3%) | 114 (87.0%) |
| 75 Years and over | 49 (100.0%) | 28 (57.1%) |
| Total | 337 (25.9%) | 1,009 (77.4%) |
Disability Status by Sex by Age in Skagway Municipality
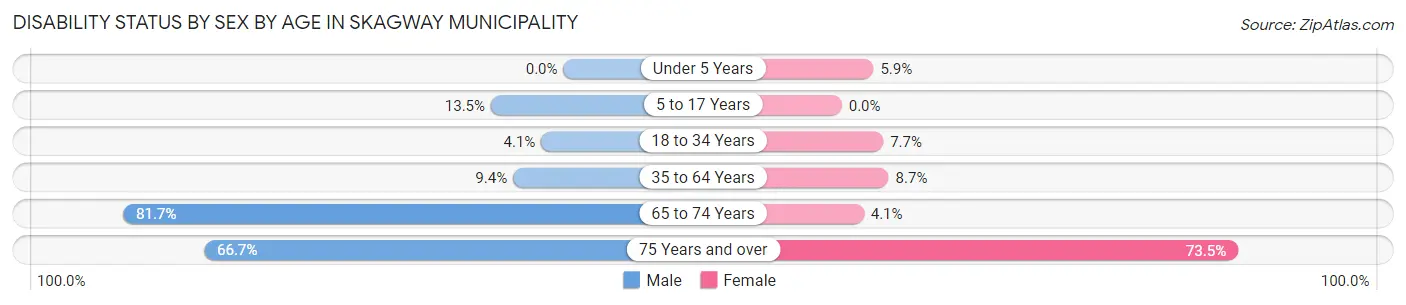
| Age Bracket | Male | Female |
| Under 5 Years | 0 (0.0%) | 3 (5.9%) |
| 5 to 17 Years | 7 (13.5%) | 0 (0.0%) |
| 18 to 34 Years | 6 (4.1%) | 18 (7.7%) |
| 35 to 64 Years | 20 (9.3%) | 28 (8.7%) |
| 65 to 74 Years | 67 (81.7%) | 2 (4.1%) |
| 75 Years and over | 10 (66.7%) | 25 (73.5%) |
Disability Class by Sex by Age in Skagway Municipality
Disability Class: Hearing Difficulty
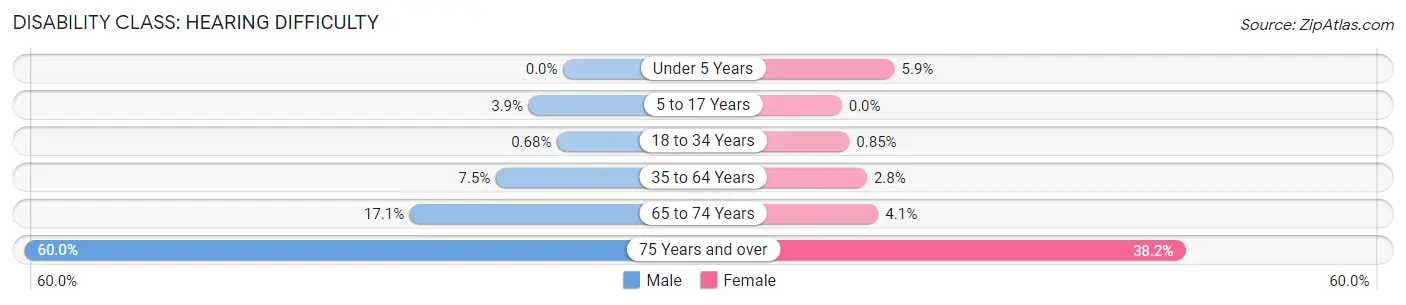
| Age Bracket | Male | Female |
| Under 5 Years | 0 (0.0%) | 3 (5.9%) |
| 5 to 17 Years | 2 (3.8%) | 0 (0.0%) |
| 18 to 34 Years | 1 (0.7%) | 2 (0.9%) |
| 35 to 64 Years | 16 (7.5%) | 9 (2.8%) |
| 65 to 74 Years | 14 (17.1%) | 2 (4.1%) |
| 75 Years and over | 9 (60.0%) | 13 (38.2%) |
Disability Class: Vision Difficulty
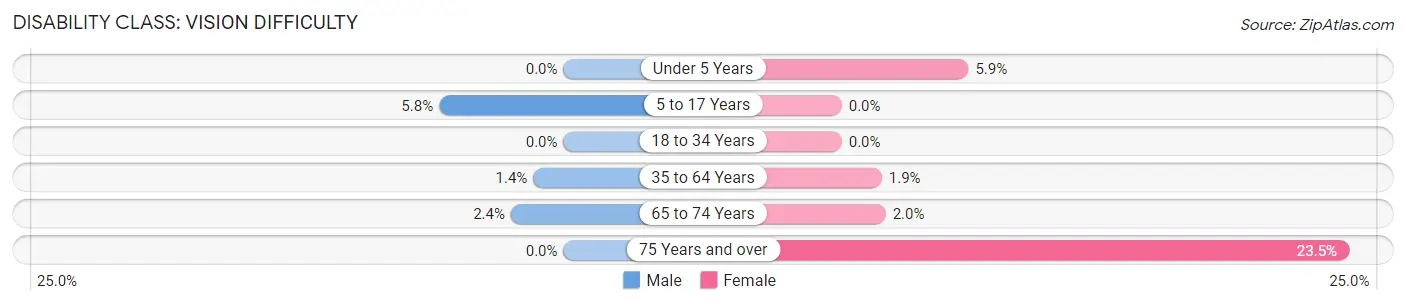
| Age Bracket | Male | Female |
| Under 5 Years | 0 (0.0%) | 3 (5.9%) |
| 5 to 17 Years | 3 (5.8%) | 0 (0.0%) |
| 18 to 34 Years | 0 (0.0%) | 0 (0.0%) |
| 35 to 64 Years | 3 (1.4%) | 6 (1.9%) |
| 65 to 74 Years | 2 (2.4%) | 1 (2.0%) |
| 75 Years and over | 0 (0.0%) | 8 (23.5%) |
Disability Class: Cognitive Difficulty
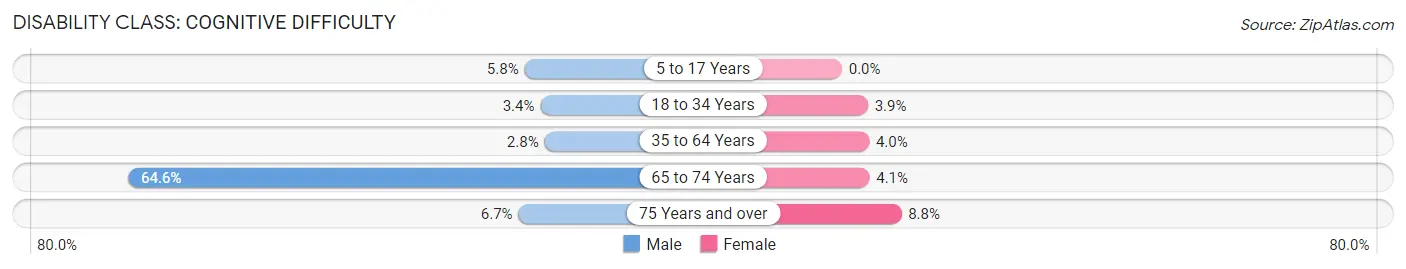
| Age Bracket | Male | Female |
| 5 to 17 Years | 3 (5.8%) | 0 (0.0%) |
| 18 to 34 Years | 5 (3.4%) | 9 (3.8%) |
| 35 to 64 Years | 6 (2.8%) | 13 (4.0%) |
| 65 to 74 Years | 53 (64.6%) | 2 (4.1%) |
| 75 Years and over | 1 (6.7%) | 3 (8.8%) |
Disability Class: Ambulatory Difficulty
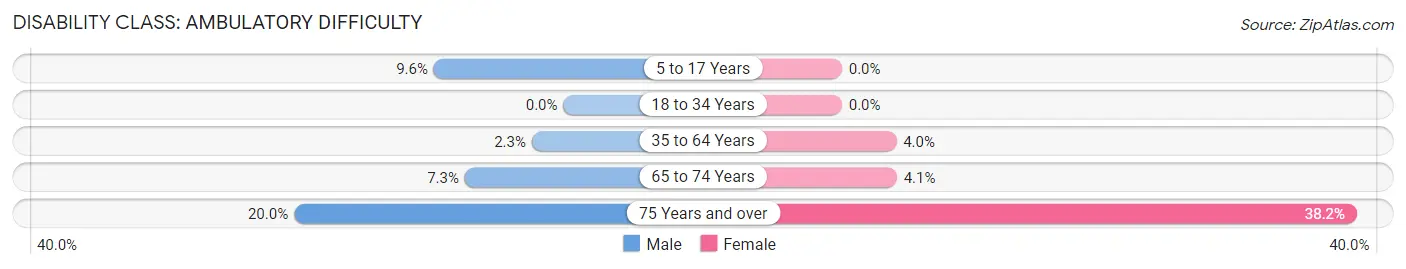
| Age Bracket | Male | Female |
| 5 to 17 Years | 5 (9.6%) | 0 (0.0%) |
| 18 to 34 Years | 0 (0.0%) | 0 (0.0%) |
| 35 to 64 Years | 5 (2.3%) | 13 (4.0%) |
| 65 to 74 Years | 6 (7.3%) | 2 (4.1%) |
| 75 Years and over | 3 (20.0%) | 13 (38.2%) |
Disability Class: Self-Care Difficulty
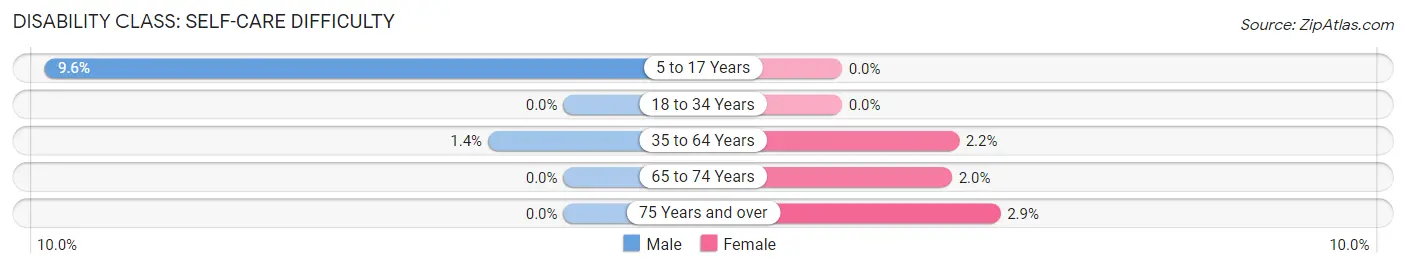
| Age Bracket | Male | Female |
| 5 to 17 Years | 5 (9.6%) | 0 (0.0%) |
| 18 to 34 Years | 0 (0.0%) | 0 (0.0%) |
| 35 to 64 Years | 3 (1.4%) | 7 (2.2%) |
| 65 to 74 Years | 0 (0.0%) | 1 (2.0%) |
| 75 Years and over | 0 (0.0%) | 1 (2.9%) |
Technology Access in Skagway Municipality
Computing Device Access in Skagway Municipality
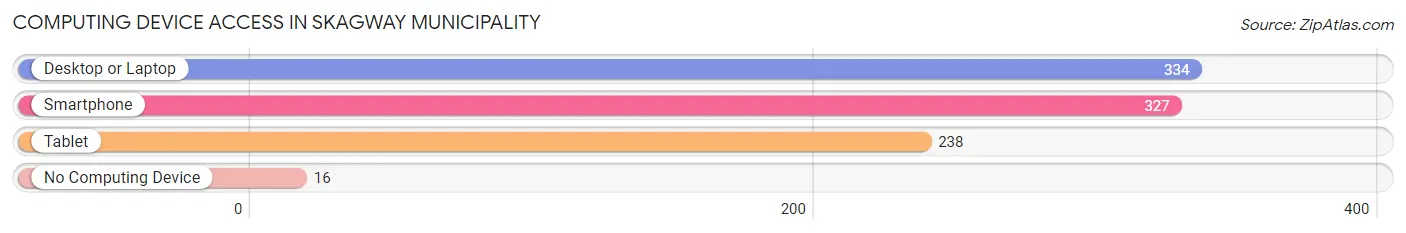
| Device Type | # Households | % Households |
| Desktop or Laptop | 334 | 81.5% |
| Smartphone | 327 | 79.8% |
| Tablet | 238 | 58.1% |
| No Computing Device | 16 | 3.9% |
| Total | 410 | 100.0% |
Internet Access in Skagway Municipality
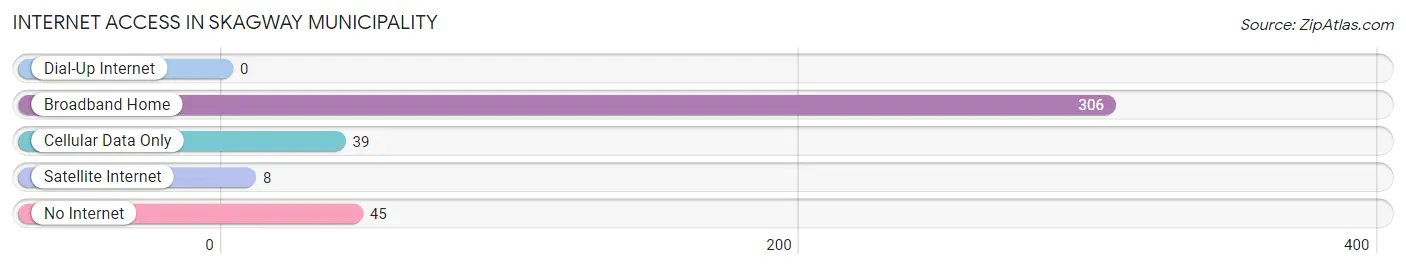
| Internet Type | # Households | % Households |
| Dial-Up Internet | 0 | 0.0% |
| Broadband Home | 306 | 74.6% |
| Cellular Data Only | 39 | 9.5% |
| Satellite Internet | 8 | 1.9% |
| No Internet | 45 | 11.0% |
| Total | 410 | 100.0% |
Skagway Municipality Summary
Skagway Municipality, Alaska is located in the southeastern corner of the state, in the panhandle region of the state. It is bordered by the Canadian province of British Columbia to the east, the Gulf of Alaska to the south, and the Inside Passage to the west. The municipality is comprised of the city of Skagway and the surrounding area, including the communities of Dyea, Haines, and Hoonah. The total population of the municipality was 1,057 in the 2010 census.
History
The area now known as Skagway Municipality has been inhabited for thousands of years by the Tlingit people. The first Europeans to explore the area were the Spanish, who arrived in 1774. The area was later explored by the British and Russians, who established trading posts in the area.
In the late 19th century, the area became a major hub for the Klondike Gold Rush. Thousands of prospectors and adventurers flocked to the area in search of gold. The town of Skagway was founded in 1897 and quickly became the gateway to the gold fields of the Yukon. The town was a wild and lawless place, and was known as the “Badlands of Alaska”.
In 1900, the White Pass and Yukon Route railway was completed, connecting Skagway to Whitehorse, Yukon. This allowed for the transportation of goods and people to and from the gold fields. The railway was a major factor in the growth of the town, and it remains in operation today.
In the early 20th century, the town of Skagway was incorporated as a municipality. The municipality was later expanded to include the surrounding communities of Dyea, Haines, and Hoonah.
Geography
Skagway Municipality is located in the southeastern corner of Alaska, in the panhandle region of the state. It is bordered by the Canadian province of British Columbia to the east, the Gulf of Alaska to the south, and the Inside Passage to the west. The municipality is comprised of the city of Skagway and the surrounding area, including the communities of Dyea, Haines, and Hoonah.
The municipality has a total area of 1,845 square miles, of which 1,717 square miles is land and 128 square miles is water. The terrain is mountainous and heavily forested, with the highest point being Mount Ripinsky at an elevation of 4,890 feet.
Economy
The economy of Skagway Municipality is largely based on tourism. The town of Skagway is a popular cruise ship port, and the municipality is home to several popular attractions, including the White Pass and Yukon Route railway, the Klondike Gold Rush National Historical Park, and the Chilkoot Trail.
The municipality is also home to several fishing and logging operations. The fishing industry is centered around the salmon and halibut fisheries in the Gulf of Alaska. The logging industry is focused on the harvesting of timber from the surrounding forests.
Demographics
As of the 2010 census, the population of Skagway Municipality was 1,057. The racial makeup of the municipality was 85.3% White, 0.7% Black or African American, 8.2% Native American, 0.7% Asian, 0.1% Pacific Islander, 0.7% from other races, and 4.3% from two or more races. Hispanic or Latino of any race were 2.2% of the population.
The median household income in the municipality was $50,000, and the median family income was $54,000. The per capita income was $25,000. About 10.3% of families and 13.2% of the population were below the poverty line, including 16.7% of those under the age of 18 and none of those 65 or over.
Common Questions
What is the Total Population of Skagway Municipality?
Total Population of Skagway Municipality is 1,303.
What is the Total Male Population of Skagway Municipality?
Total Male Population of Skagway Municipality is 537.
What is the Total Female Population of Skagway Municipality?
Total Female Population of Skagway Municipality is 766.
What is the Ratio of Males per 100 Females in Skagway Municipality?
There are 70.10 Males per 100 Females in Skagway Municipality.
What is the Ratio of Females per 100 Males in Skagway Municipality?
There are 142.64 Females per 100 Males in Skagway Municipality.
What is the Median Population Age in Skagway Municipality?
Median Population Age in Skagway Municipality is 38.6 Years.
What is the Average Family Size in Skagway Municipality
Average Family Size in Skagway Municipality is 3.6 People.
What is the Average Household Size in Skagway Municipality
Average Household Size in Skagway Municipality is 2.6 People.
What is Per Capita Income in Skagway Municipality?
Per Capita income in Skagway Municipality is $46,771.
What is the Median Family Income in Skagway Municipality?
Median Family Income in Skagway Municipality is $110,833.
What is the Median Household income in Skagway Municipality?
Median Household Income in Skagway Municipality is $79,583.
What is Income or Wage Gap in Skagway Municipality?
Income or Wage Gap in Skagway Municipality is 32.3%.
Women in Skagway Municipality earn 67.7 cents for every dollar earned by a man.
What is Inequality or Gini Index in Skagway Municipality?
Inequality or Gini Index in Skagway Municipality is 0.35.
How Large is the Labor Force in Skagway Municipality?
There are 872 People in the Labor Forcein in Skagway Municipality.
What is the Percentage of People in the Labor Force in Skagway Municipality?
78.6% of People are in the Labor Force in Skagway Municipality.
What is the Unemployment Rate in Skagway Municipality?
Unemployment Rate in Skagway Municipality is 11.0%.