Prince of Wales-Hyder Census Area, AK
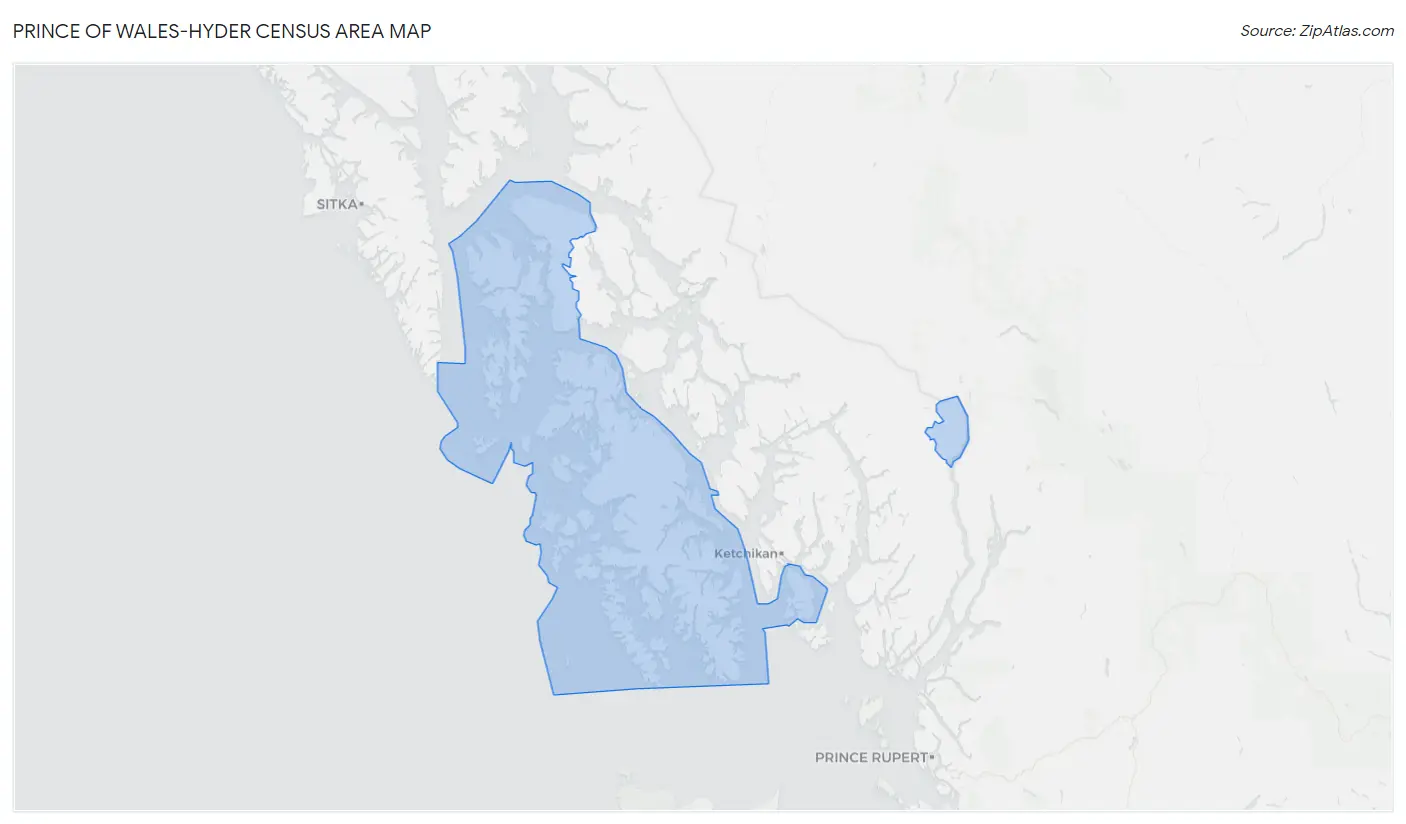
Prince of Wales-Hyder Census Area Map
Prince of Wales-Hyder Census Area Overview
5,799
TOTAL POPULATION
3,223
MALE POPULATION
2,576
FEMALE POPULATION
125.12
MALES / 100 FEMALES
79.93
FEMALES / 100 MALES
43.1
MEDIAN AGE
3.0
AVG FAMILY SIZE
2.4
AVG HOUSEHOLD SIZE
$34,433
PER CAPITA INCOME
$77,548
AVG FAMILY INCOME
$61,779
AVG HOUSEHOLD INCOME
12.1%
WAGE / INCOME GAP [ % ]
87.9¢/ $1
WAGE / INCOME GAP [ $ ]
$10,027
FAMILY INCOME DEFICIT
0.42
INEQUALITY / GINI INDEX
2,969
LABOR FORCE [ PEOPLE ]
63.0%
PERCENT IN LABOR FORCE
7.5%
UNEMPLOYMENT RATE
Prince of Wales-Hyder Census Area Area Codes
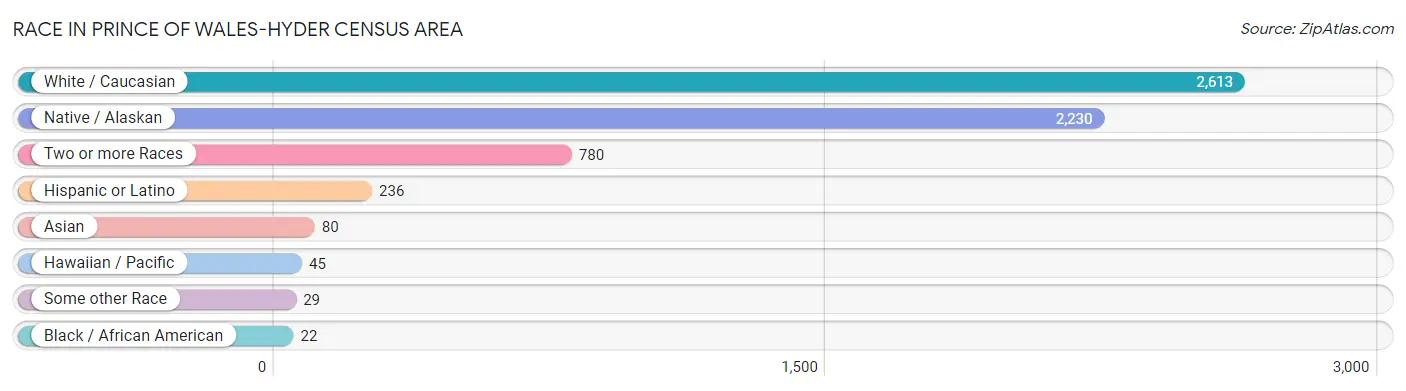
Race in Prince of Wales-Hyder Census Area
The most populous races in Prince of Wales-Hyder Census Area are White / Caucasian (2,613 | 45.1%), Native / Alaskan (2,230 | 38.5%), and Two or more Races (780 | 13.5%).
| Race | # Population | % Population |
| Asian | 80 | 1.4% |
| Black / African American | 22 | 0.4% |
| Hawaiian / Pacific | 45 | 0.8% |
| Hispanic or Latino | 236 | 4.1% |
| Native / Alaskan | 2,230 | 38.5% |
| White / Caucasian | 2,613 | 45.1% |
| Two or more Races | 780 | 13.5% |
| Some other Race | 29 | 0.5% |
| Total | 5,799 | 100.0% |
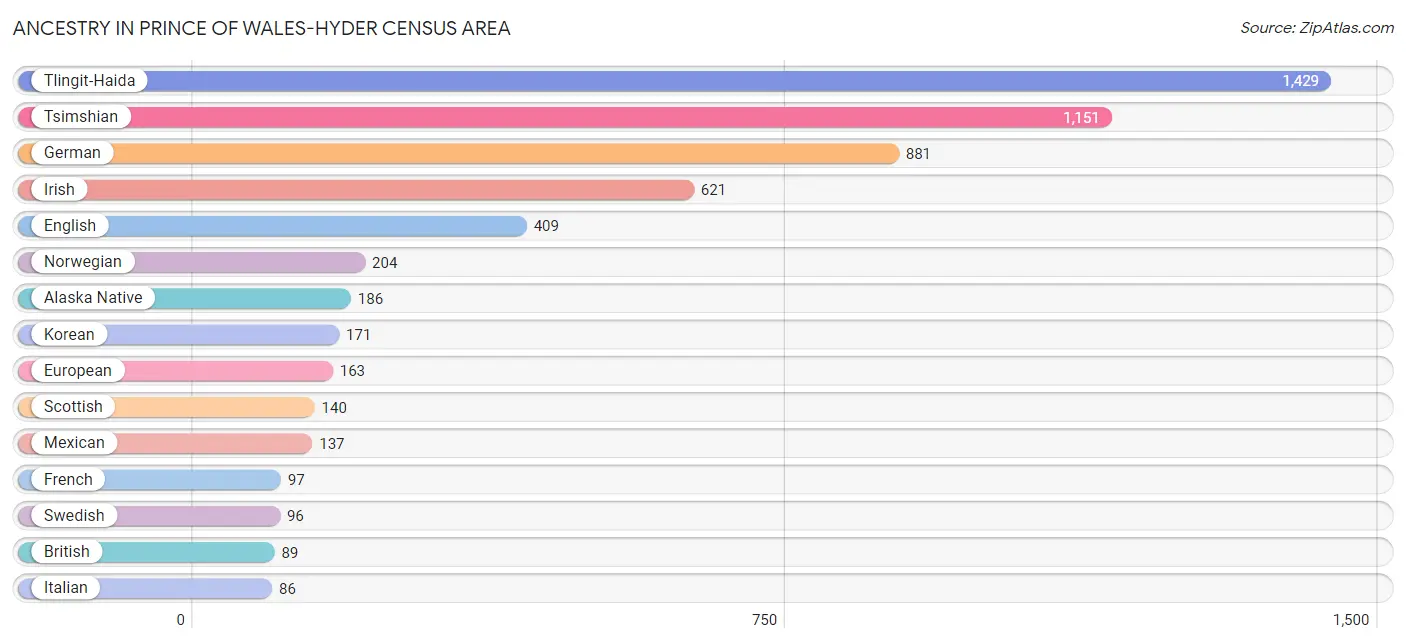
Ancestry in Prince of Wales-Hyder Census Area
The most populous ancestries reported in Prince of Wales-Hyder Census Area are Tlingit-Haida (1,429 | 24.6%), Tsimshian (1,151 | 19.9%), German (881 | 15.2%), Irish (621 | 10.7%), and English (409 | 7.0%), together accounting for 77.4% of all Prince of Wales-Hyder Census Area residents.
| Ancestry | # Population | % Population |
| African | 11 | 0.2% |
| Alaska Native | 186 | 3.2% |
| Alaskan Athabascan | 28 | 0.5% |
| Aleut | 31 | 0.5% |
| American | 38 | 0.7% |
| Apache | 5 | 0.1% |
| Arab | 1 | 0.0% |
| Australian | 15 | 0.3% |
| Austrian | 21 | 0.4% |
| Belgian | 2 | 0.0% |
| Bhutanese | 18 | 0.3% |
| Blackfeet | 18 | 0.3% |
| British | 89 | 1.5% |
| British West Indian | 1 | 0.0% |
| Bulgarian | 3 | 0.1% |
| Burmese | 7 | 0.1% |
| Cajun | 1 | 0.0% |
| Canadian | 58 | 1.0% |
| Central American | 8 | 0.1% |
| Cherokee | 78 | 1.3% |
| Chippewa | 17 | 0.3% |
| Choctaw | 8 | 0.1% |
| Croatian | 4 | 0.1% |
| Crow | 2 | 0.0% |
| Czech | 22 | 0.4% |
| Czechoslovakian | 11 | 0.2% |
| Danish | 30 | 0.5% |
| Dutch | 80 | 1.4% |
| Eastern European | 13 | 0.2% |
| English | 409 | 7.0% |
| European | 163 | 2.8% |
| Finnish | 7 | 0.1% |
| French | 97 | 1.7% |
| French American Indian | 16 | 0.3% |
| French Canadian | 39 | 0.7% |
| German | 881 | 15.2% |
| Greek | 3 | 0.1% |
| Haitian | 5 | 0.1% |
| Hungarian | 31 | 0.5% |
| Indian (Asian) | 1 | 0.0% |
| Inupiat | 43 | 0.7% |
| Irish | 621 | 10.7% |
| Italian | 86 | 1.5% |
| Korean | 171 | 2.9% |
| Laotian | 6 | 0.1% |
| Lithuanian | 6 | 0.1% |
| Marshallese | 3 | 0.1% |
| Mexican | 137 | 2.4% |
| Native Hawaiian | 15 | 0.3% |
| Navajo | 12 | 0.2% |
| Northern European | 5 | 0.1% |
| Norwegian | 204 | 3.5% |
| Panamanian | 2 | 0.0% |
| Polish | 45 | 0.8% |
| Portuguese | 4 | 0.1% |
| Pueblo | 5 | 0.1% |
| Puerto Rican | 4 | 0.1% |
| Puget Sound Salish | 1 | 0.0% |
| Romanian | 5 | 0.1% |
| Russian | 39 | 0.7% |
| Salvadoran | 6 | 0.1% |
| Samoan | 27 | 0.5% |
| Scandinavian | 46 | 0.8% |
| Scotch-Irish | 84 | 1.5% |
| Scottish | 140 | 2.4% |
| Sioux | 7 | 0.1% |
| Slavic | 3 | 0.1% |
| Slovak | 2 | 0.0% |
| South American | 5 | 0.1% |
| Spaniard | 19 | 0.3% |
| Spanish | 56 | 1.0% |
| Sri Lankan | 7 | 0.1% |
| Subsaharan African | 11 | 0.2% |
| Swedish | 96 | 1.7% |
| Swiss | 8 | 0.1% |
| Tlingit-Haida | 1,429 | 24.6% |
| Tongan | 4 | 0.1% |
| Tsimshian | 1,151 | 19.9% |
| Ukrainian | 5 | 0.1% |
| Vietnamese | 14 | 0.2% |
| Welsh | 45 | 0.8% |
| Yakama | 20 | 0.3% |
| Yup'ik | 33 | 0.6% | View All 83 Rows |
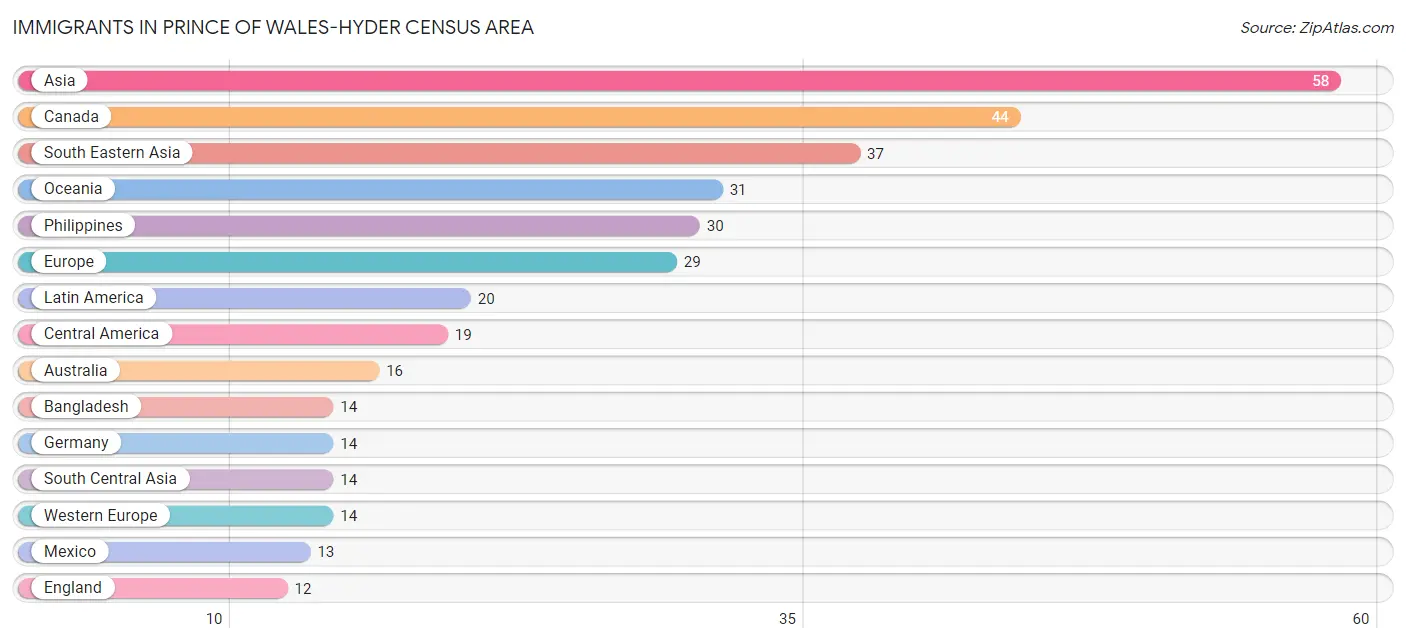
Immigrants in Prince of Wales-Hyder Census Area
The most numerous immigrant groups reported in Prince of Wales-Hyder Census Area came from Asia (58 | 1.0%), Canada (44 | 0.8%), South Eastern Asia (37 | 0.6%), Oceania (31 | 0.5%), and Philippines (30 | 0.5%), together accounting for 3.5% of all Prince of Wales-Hyder Census Area residents.
| Immigration Origin | # Population | % Population |
| Africa | 8 | 0.1% |
| Asia | 58 | 1.0% |
| Australia | 16 | 0.3% |
| Bangladesh | 14 | 0.2% |
| Canada | 44 | 0.8% |
| Caribbean | 1 | 0.0% |
| Central America | 19 | 0.3% |
| Eastern Africa | 8 | 0.1% |
| Eastern Asia | 7 | 0.1% |
| Eastern Europe | 3 | 0.1% |
| El Salvador | 6 | 0.1% |
| England | 12 | 0.2% |
| Europe | 29 | 0.5% |
| Germany | 14 | 0.2% |
| Kenya | 5 | 0.1% |
| Korea | 7 | 0.1% |
| Latin America | 20 | 0.3% |
| Mexico | 13 | 0.2% |
| Micronesia | 5 | 0.1% |
| Northern Europe | 12 | 0.2% |
| Oceania | 31 | 0.5% |
| Philippines | 30 | 0.5% |
| Romania | 2 | 0.0% |
| Russia | 1 | 0.0% |
| South Central Asia | 14 | 0.2% |
| South Eastern Asia | 37 | 0.6% |
| St. Vincent and the Grenadines | 1 | 0.0% |
| Vietnam | 7 | 0.1% |
| Western Europe | 14 | 0.2% | View All 29 Rows |
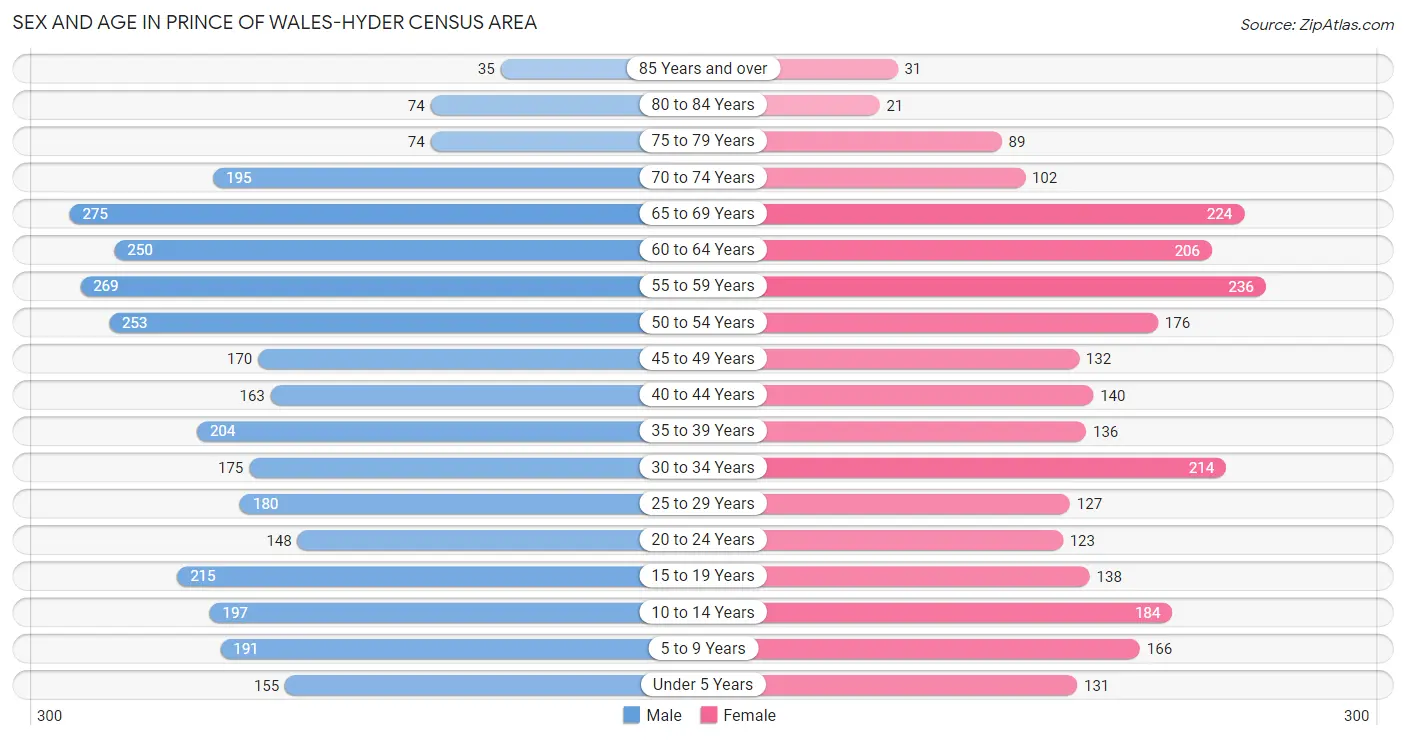
Sex and Age in Prince of Wales-Hyder Census Area
Sex and Age in Prince of Wales-Hyder Census Area
The most populous age groups in Prince of Wales-Hyder Census Area are 65 to 69 Years (275 | 8.5%) for men and 55 to 59 Years (236 | 9.2%) for women.
| Age Bracket | Male | Female |
| Under 5 Years | 155 (4.8%) | 131 (5.1%) |
| 5 to 9 Years | 191 (5.9%) | 166 (6.4%) |
| 10 to 14 Years | 197 (6.1%) | 184 (7.1%) |
| 15 to 19 Years | 215 (6.7%) | 138 (5.4%) |
| 20 to 24 Years | 148 (4.6%) | 123 (4.8%) |
| 25 to 29 Years | 180 (5.6%) | 127 (4.9%) |
| 30 to 34 Years | 175 (5.4%) | 214 (8.3%) |
| 35 to 39 Years | 204 (6.3%) | 136 (5.3%) |
| 40 to 44 Years | 163 (5.1%) | 140 (5.4%) |
| 45 to 49 Years | 170 (5.3%) | 132 (5.1%) |
| 50 to 54 Years | 253 (7.9%) | 176 (6.8%) |
| 55 to 59 Years | 269 (8.4%) | 236 (9.2%) |
| 60 to 64 Years | 250 (7.8%) | 206 (8.0%) |
| 65 to 69 Years | 275 (8.5%) | 224 (8.7%) |
| 70 to 74 Years | 195 (6.0%) | 102 (4.0%) |
| 75 to 79 Years | 74 (2.3%) | 89 (3.5%) |
| 80 to 84 Years | 74 (2.3%) | 21 (0.8%) |
| 85 Years and over | 35 (1.1%) | 31 (1.2%) |
| Total | 3,223 (100.0%) | 2,576 (100.0%) |
Families and Households in Prince of Wales-Hyder Census Area
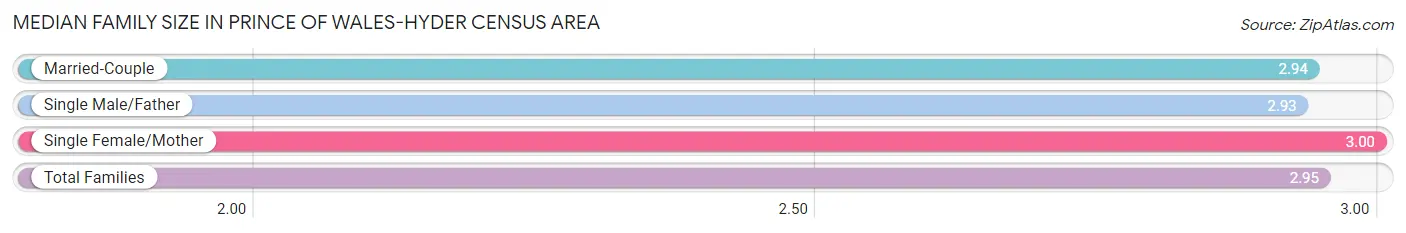
Median Family Size in Prince of Wales-Hyder Census Area
The median family size in Prince of Wales-Hyder Census Area is 2.95 persons per family, with single female/mother families (213 | 14.2%) accounting for the largest median family size of 3 persons per family. On the other hand, single male/father families (198 | 13.2%) represent the smallest median family size with 2.93 persons per family.
| Family Type | # Families | Family Size |
| Married-Couple | 1,084 (72.5%) | 2.94 |
| Single Male/Father | 198 (13.2%) | 2.93 |
| Single Female/Mother | 213 (14.2%) | 3.00 |
| Total Families | 1,495 (100.0%) | 2.95 |
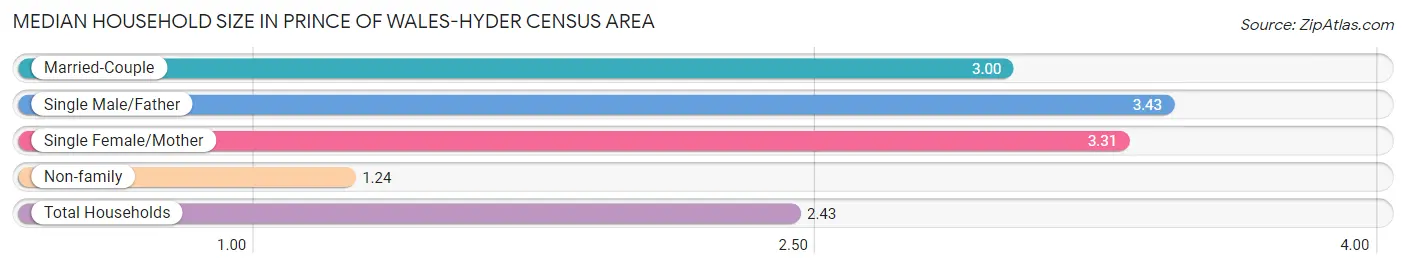
Median Household Size in Prince of Wales-Hyder Census Area
The median household size in Prince of Wales-Hyder Census Area is 2.43 persons per household, with single male/father households (198 | 8.5%) accounting for the largest median household size of 3.43 persons per household. non-family households (839 | 35.9%) represent the smallest median household size with 1.24 persons per household.
| Household Type | # Households | Household Size |
| Married-Couple | 1,084 (46.4%) | 3.00 |
| Single Male/Father | 198 (8.5%) | 3.43 |
| Single Female/Mother | 213 (9.1%) | 3.31 |
| Non-family | 839 (35.9%) | 1.24 |
| Total Households | 2,334 (100.0%) | 2.43 |
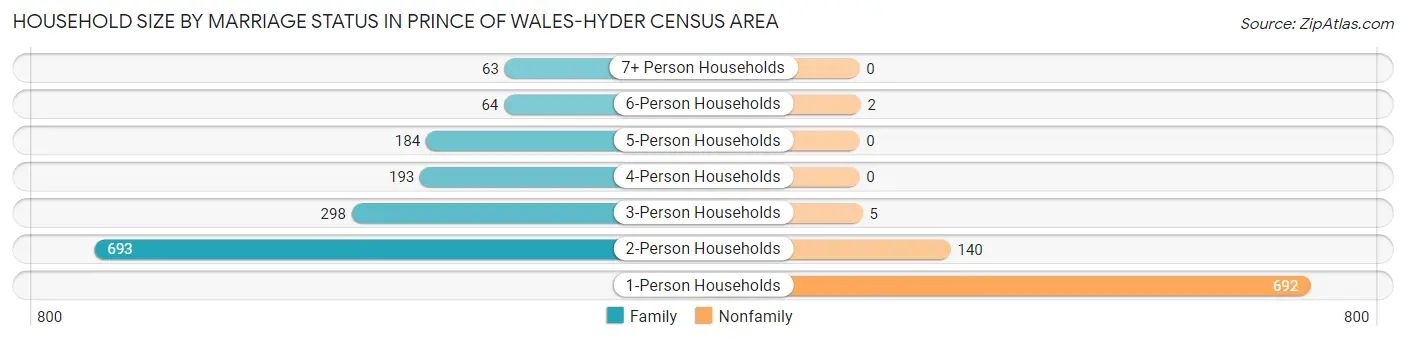
Household Size by Marriage Status in Prince of Wales-Hyder Census Area
Out of a total of 2,334 households in Prince of Wales-Hyder Census Area, 1,495 (64.0%) are family households, while 839 (35.9%) are nonfamily households. The most numerous type of family households are 2-person households, comprising 693, and the most common type of nonfamily households are 1-person households, comprising 692.
| Household Size | Family Households | Nonfamily Households |
| 1-Person Households | - | 692 (29.6%) |
| 2-Person Households | 693 (29.7%) | 140 (6.0%) |
| 3-Person Households | 298 (12.8%) | 5 (0.2%) |
| 4-Person Households | 193 (8.3%) | 0 (0.0%) |
| 5-Person Households | 184 (7.9%) | 0 (0.0%) |
| 6-Person Households | 64 (2.7%) | 2 (0.1%) |
| 7+ Person Households | 63 (2.7%) | 0 (0.0%) |
| Total | 1,495 (64.0%) | 839 (35.9%) |
Female Fertility in Prince of Wales-Hyder Census Area
Fertility by Age in Prince of Wales-Hyder Census Area
Average fertility rate in Prince of Wales-Hyder Census Area is 48.0 births per 1,000 women. Women in the age bracket of 20 to 34 years have the highest fertility rate with 99.0 births per 1,000 women. Women in the age bracket of 20 to 34 years acount for 92.0% of all women with births.
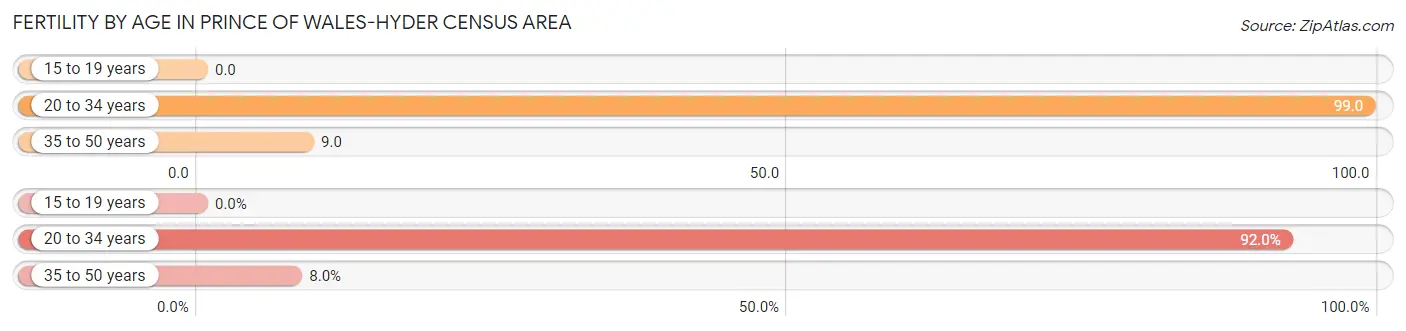
| Age Bracket | Women with Births | Births / 1,000 Women |
| 15 to 19 years | 0 (0.0%) | 0.0 |
| 20 to 34 years | 46 (92.0%) | 99.0 |
| 35 to 50 years | 4 (8.0%) | 9.0 |
| Total | 50 (100.0%) | 48.0 |
Fertility by Age by Marriage Status in Prince of Wales-Hyder Census Area
50.0% of women with births (50) in Prince of Wales-Hyder Census Area are married. The highest percentage of unmarried women with births falls into 20 to 34 years age bracket with 54.3% of them unmarried at the time of birth, while the lowest percentage of unmarried women with births belong to 35 to 50 years age bracket with 0.0% of them unmarried.
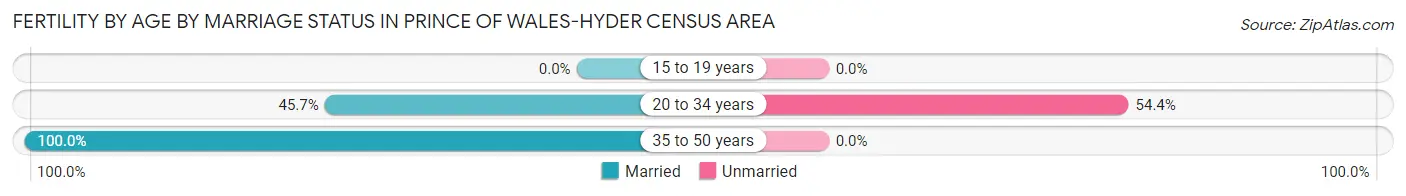
| Age Bracket | Married | Unmarried |
| 15 to 19 years | 0 (0.0%) | 0 (0.0%) |
| 20 to 34 years | 21 (45.7%) | 25 (54.3%) |
| 35 to 50 years | 4 (100.0%) | 0 (0.0%) |
| Total | 25 (50.0%) | 25 (50.0%) |
Fertility by Education in Prince of Wales-Hyder Census Area
Average fertility rate in Prince of Wales-Hyder Census Area is 48.0 births per 1,000 women. Women with the education attainment of less than high school have the highest fertility rate of 77.0 births per 1,000 women, while women with the education attainment of college or associate's degree have the lowest fertility at 18.0 births per 1,000 women. Women with the education attainment of high school diploma represent 40.0% of all women with births.
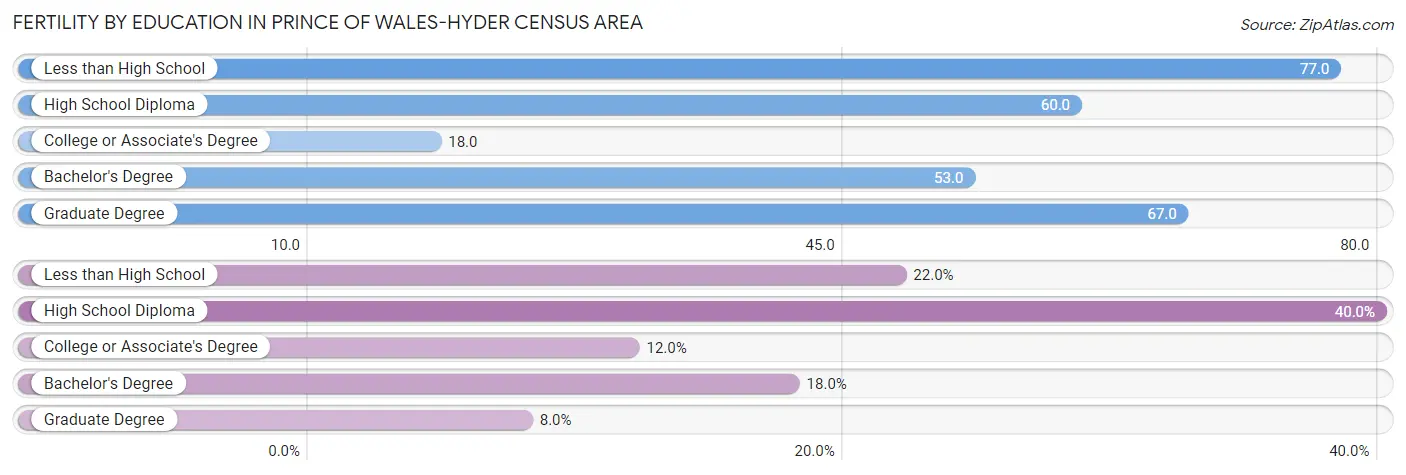
| Educational Attainment | Women with Births | Births / 1,000 Women |
| Less than High School | 11 (22.0%) | 77.0 |
| High School Diploma | 20 (40.0%) | 60.0 |
| College or Associate's Degree | 6 (12.0%) | 18.0 |
| Bachelor's Degree | 9 (18.0%) | 53.0 |
| Graduate Degree | 4 (8.0%) | 67.0 |
| Total | 50 (100.0%) | 48.0 |
Fertility by Education by Marriage Status in Prince of Wales-Hyder Census Area
50.0% of women with births in Prince of Wales-Hyder Census Area are unmarried. Women with the educational attainment of bachelor's degree are most likely to be married with 100.0% of them married at childbirth, while women with the educational attainment of high school diploma are least likely to be married with 90.0% of them unmarried at childbirth.
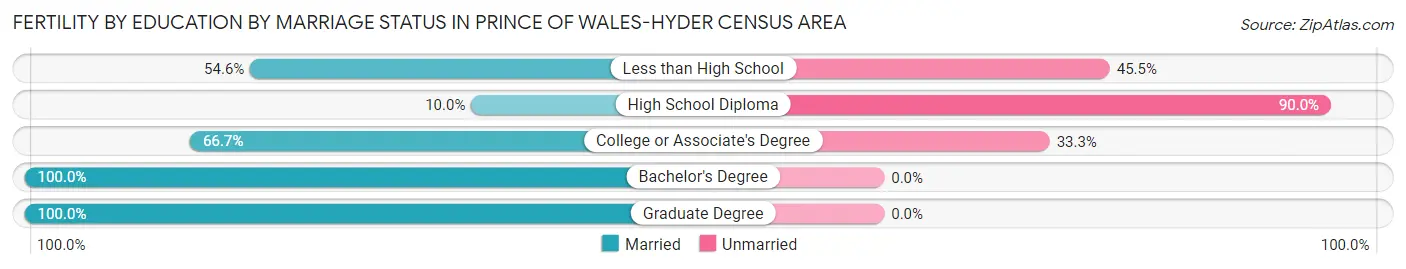
| Educational Attainment | Married | Unmarried |
| Less than High School | 6 (54.5%) | 5 (45.5%) |
| High School Diploma | 2 (10.0%) | 18 (90.0%) |
| College or Associate's Degree | 4 (66.7%) | 2 (33.3%) |
| Bachelor's Degree | 9 (100.0%) | 0 (0.0%) |
| Graduate Degree | 4 (100.0%) | 0 (0.0%) |
| Total | 25 (50.0%) | 25 (50.0%) |
Income in Prince of Wales-Hyder Census Area
Income Overview in Prince of Wales-Hyder Census Area
Per Capita Income in Prince of Wales-Hyder Census Area is $34,433, while median incomes of families and households are $77,548 and $61,779 respectively.
| Characteristic | Number | Measure |
| Per Capita Income | 5,799 | $34,433 |
| Median Family Income | 1,495 | $77,548 |
| Mean Family Income | 1,495 | $91,320 |
| Median Household Income | 2,334 | $61,779 |
| Mean Household Income | 2,334 | $80,427 |
| Income Deficit | 1,495 | $10,027 |
| Wage / Income Gap (%) | 5,799 | 12.13% |
| Wage / Income Gap ($) | 5,799 | 87.87¢ per $1 |
| Gini / Inequality Index | 5,799 | 0.42 |
Earnings by Sex in Prince of Wales-Hyder Census Area
Average Earnings in Prince of Wales-Hyder Census Area are $36,799, $40,016 for men and $35,163 for women, a difference of 12.1%.
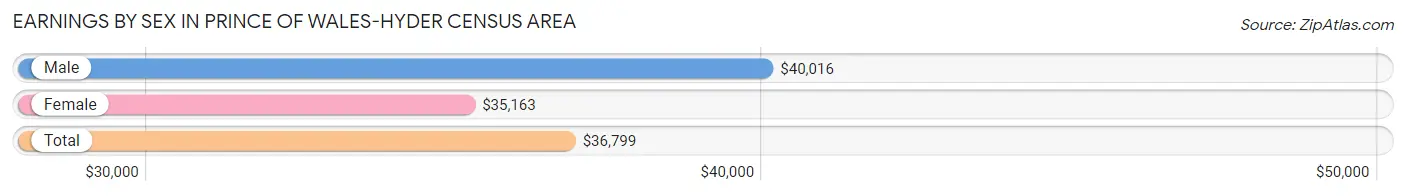
| Sex | Number | Average Earnings |
| Male | 1,897 (58.2%) | $40,016 |
| Female | 1,361 (41.8%) | $35,163 |
| Total | 3,258 (100.0%) | $36,799 |
Earnings by Sex by Income Bracket in Prince of Wales-Hyder Census Area
The most common earnings brackets in Prince of Wales-Hyder Census Area are $100,000+ for men (213 | 11.2%) and $55,000 to $64,999 for women (169 | 12.4%).
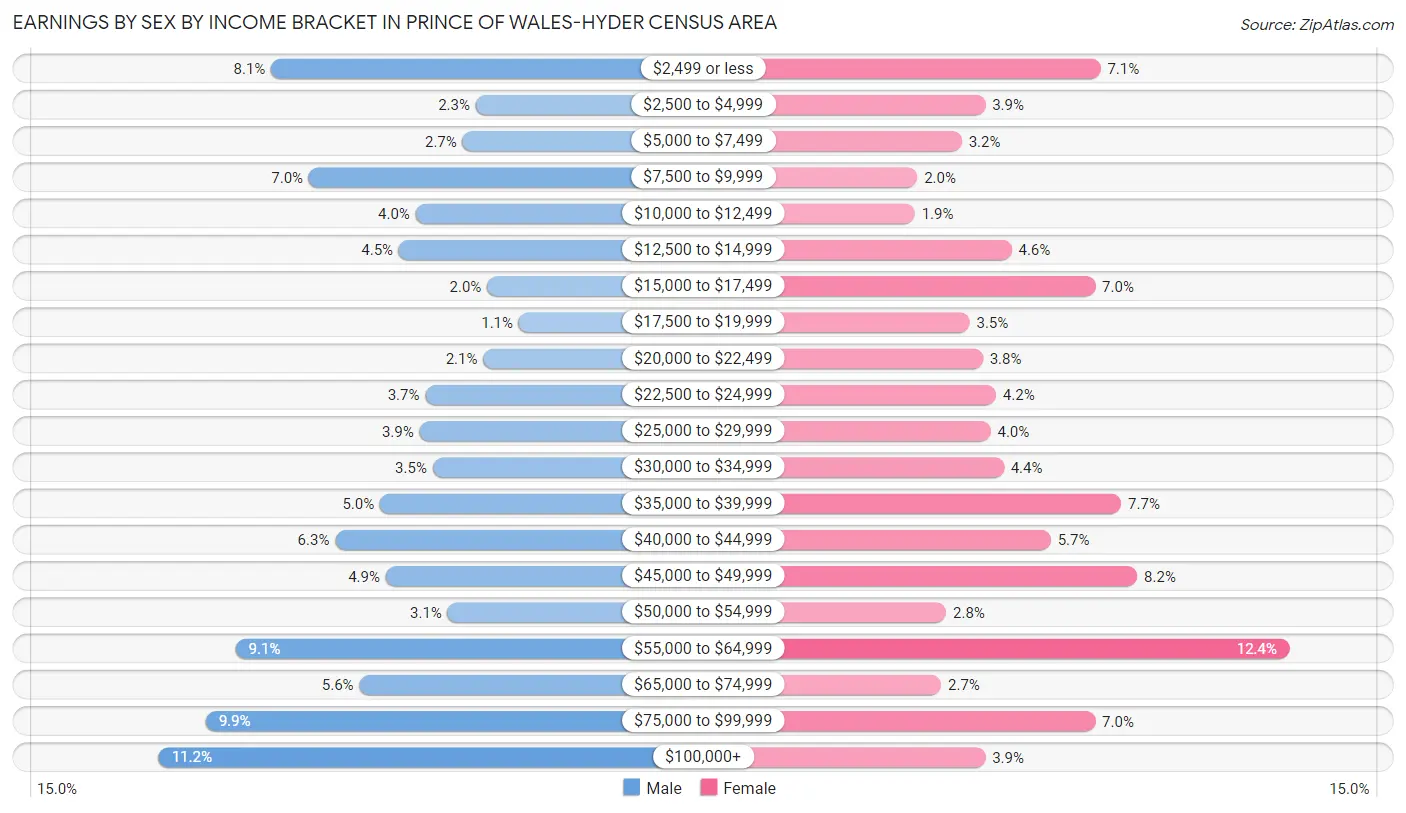
| Income | Male | Female |
| $2,499 or less | 153 (8.1%) | 97 (7.1%) |
| $2,500 to $4,999 | 44 (2.3%) | 53 (3.9%) |
| $5,000 to $7,499 | 51 (2.7%) | 44 (3.2%) |
| $7,500 to $9,999 | 133 (7.0%) | 27 (2.0%) |
| $10,000 to $12,499 | 76 (4.0%) | 26 (1.9%) |
| $12,500 to $14,999 | 85 (4.5%) | 63 (4.6%) |
| $15,000 to $17,499 | 38 (2.0%) | 95 (7.0%) |
| $17,500 to $19,999 | 21 (1.1%) | 47 (3.5%) |
| $20,000 to $22,499 | 40 (2.1%) | 52 (3.8%) |
| $22,500 to $24,999 | 71 (3.7%) | 57 (4.2%) |
| $25,000 to $29,999 | 74 (3.9%) | 55 (4.0%) |
| $30,000 to $34,999 | 67 (3.5%) | 60 (4.4%) |
| $35,000 to $39,999 | 95 (5.0%) | 105 (7.7%) |
| $40,000 to $44,999 | 119 (6.3%) | 78 (5.7%) |
| $45,000 to $49,999 | 92 (4.9%) | 111 (8.2%) |
| $50,000 to $54,999 | 59 (3.1%) | 38 (2.8%) |
| $55,000 to $64,999 | 172 (9.1%) | 169 (12.4%) |
| $65,000 to $74,999 | 106 (5.6%) | 36 (2.6%) |
| $75,000 to $99,999 | 188 (9.9%) | 95 (7.0%) |
| $100,000+ | 213 (11.2%) | 53 (3.9%) |
| Total | 1,897 (100.0%) | 1,361 (100.0%) |
Earnings by Sex by Educational Attainment in Prince of Wales-Hyder Census Area
Average earnings in Prince of Wales-Hyder Census Area are $43,618 for men and $37,292 for women, a difference of 14.5%. Men with an educational attainment of graduate degree enjoy the highest average annual earnings of $82,188, while those with less than high school education earn the least with $35,893. Women with an educational attainment of graduate degree earn the most with the average annual earnings of $80,903, while those with less than high school education have the smallest earnings of $23,750.
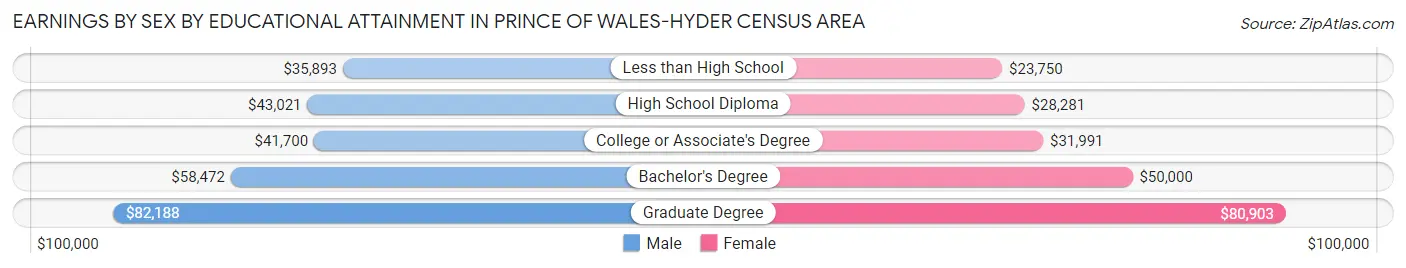
| Educational Attainment | Male Income | Female Income |
| Less than High School | $35,893 | $23,750 |
| High School Diploma | $43,021 | $28,281 |
| College or Associate's Degree | $41,700 | $31,991 |
| Bachelor's Degree | $58,472 | $50,000 |
| Graduate Degree | $82,188 | $80,903 |
| Total | $43,618 | $37,292 |
Family Income in Prince of Wales-Hyder Census Area
Family Income Brackets in Prince of Wales-Hyder Census Area
According to the Prince of Wales-Hyder Census Area family income data, there are 271 families falling into the $100,000 to $149,999 income range, which is the most common income bracket and makes up 18.1% of all families. Conversely, the less than $10,000 income bracket is the least frequent group with only 34 families (2.3%) belonging to this category.
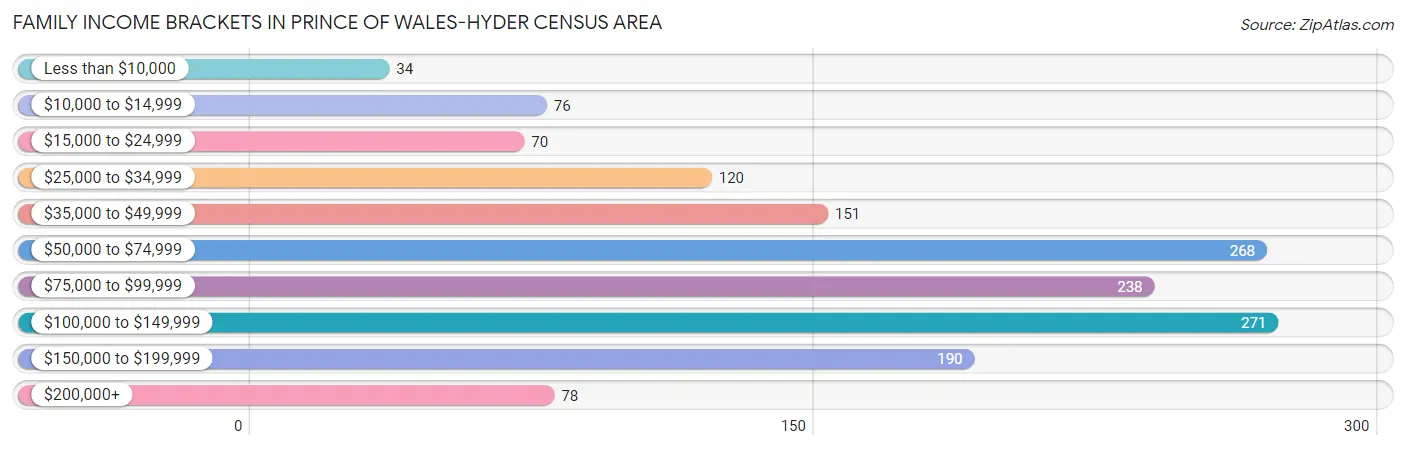
| Income Bracket | # Families | % Families |
| Less than $10,000 | 34 | 2.3% |
| $10,000 to $14,999 | 76 | 5.1% |
| $15,000 to $24,999 | 70 | 4.7% |
| $25,000 to $34,999 | 120 | 8.0% |
| $35,000 to $49,999 | 151 | 10.1% |
| $50,000 to $74,999 | 268 | 17.9% |
| $75,000 to $99,999 | 238 | 15.9% |
| $100,000 to $149,999 | 271 | 18.1% |
| $150,000 to $199,999 | 190 | 12.7% |
| $200,000+ | 78 | 5.2% |
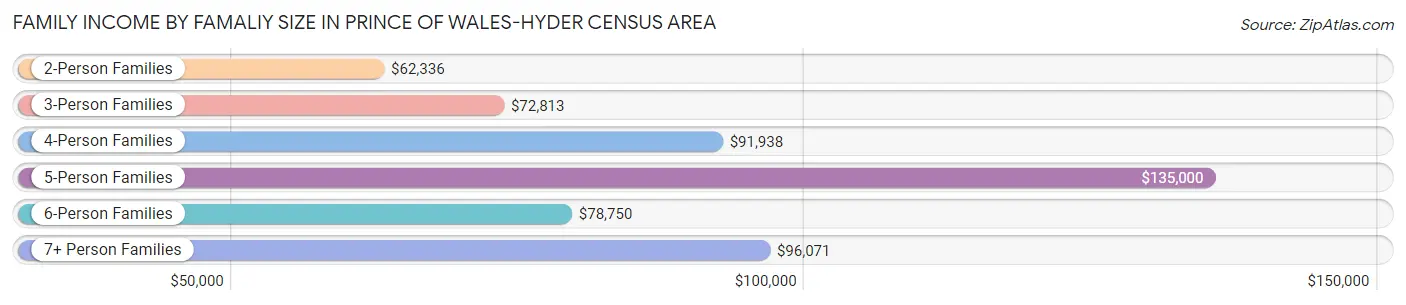
Family Income by Famaliy Size in Prince of Wales-Hyder Census Area
5-person families (178 | 11.9%) account for the highest median family income in Prince of Wales-Hyder Census Area with $135,000 per family, while 2-person families (761 | 50.9%) have the highest median income of $31,168 per family member.
| Income Bracket | # Families | Median Income |
| 2-Person Families | 761 (50.9%) | $62,336 |
| 3-Person Families | 289 (19.3%) | $72,813 |
| 4-Person Families | 169 (11.3%) | $91,938 |
| 5-Person Families | 178 (11.9%) | $135,000 |
| 6-Person Families | 50 (3.3%) | $78,750 |
| 7+ Person Families | 48 (3.2%) | $96,071 |
| Total | 1,495 (100.0%) | $77,548 |
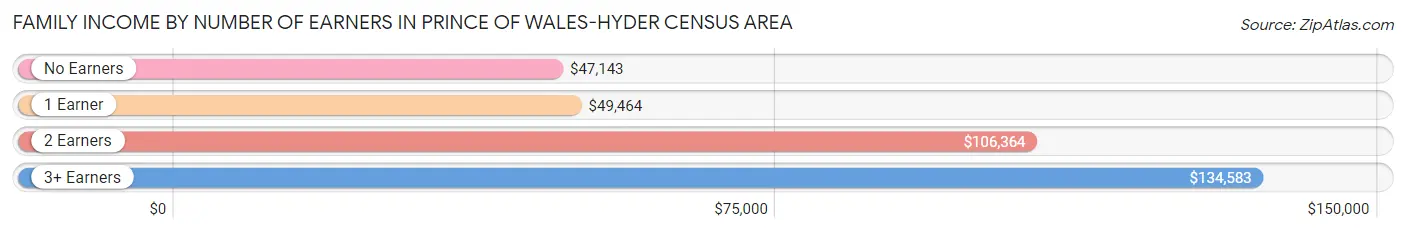
Family Income by Number of Earners in Prince of Wales-Hyder Census Area
The median family income in Prince of Wales-Hyder Census Area is $77,548, with families comprising 3+ earners (177) having the highest median family income of $134,583, while families with no earners (222) have the lowest median family income of $47,143, accounting for 11.8% and 14.8% of families, respectively.
| Number of Earners | # Families | Median Income |
| No Earners | 222 (14.8%) | $47,143 |
| 1 Earner | 476 (31.8%) | $49,464 |
| 2 Earners | 620 (41.5%) | $106,364 |
| 3+ Earners | 177 (11.8%) | $134,583 |
| Total | 1,495 (100.0%) | $77,548 |
Household Income in Prince of Wales-Hyder Census Area
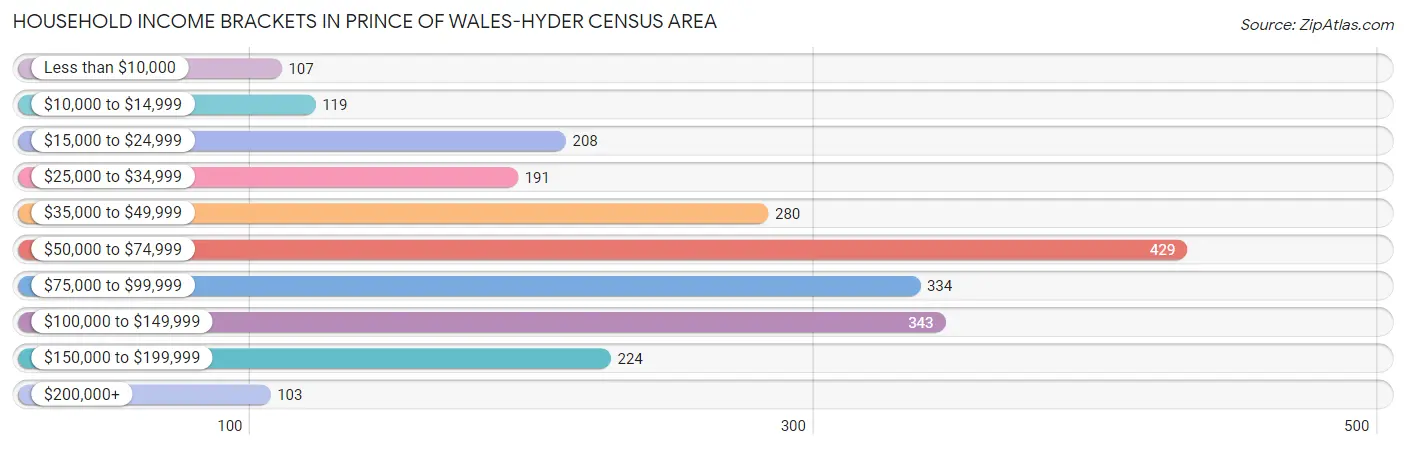
Household Income Brackets in Prince of Wales-Hyder Census Area
With 429 households falling in the category, the $50,000 to $74,999 income range is the most frequent in Prince of Wales-Hyder Census Area, accounting for 18.4% of all households. In contrast, only 103 households (4.4%) fall into the $200,000+ income bracket, making it the least populous group.
| Income Bracket | # Households | % Households |
| Less than $10,000 | 107 | 4.6% |
| $10,000 to $14,999 | 119 | 5.1% |
| $15,000 to $24,999 | 208 | 8.9% |
| $25,000 to $34,999 | 191 | 8.2% |
| $35,000 to $49,999 | 280 | 12.0% |
| $50,000 to $74,999 | 429 | 18.4% |
| $75,000 to $99,999 | 334 | 14.3% |
| $100,000 to $149,999 | 343 | 14.7% |
| $150,000 to $199,999 | 224 | 9.6% |
| $200,000+ | 103 | 4.4% |
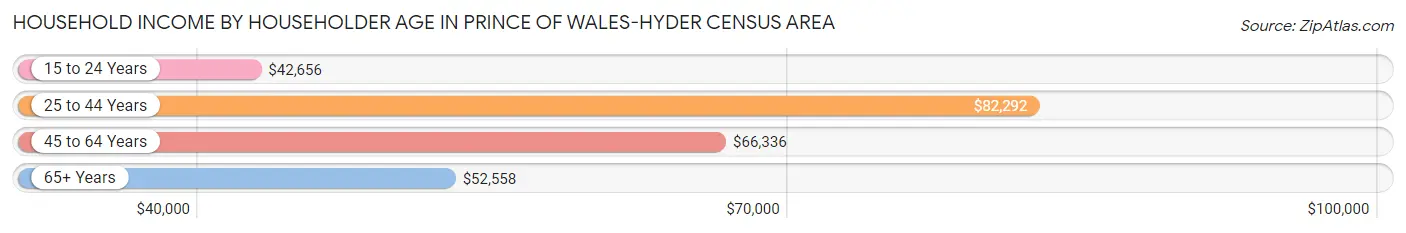
Household Income by Householder Age in Prince of Wales-Hyder Census Area
The median household income in Prince of Wales-Hyder Census Area is $61,779, with the highest median household income of $82,292 found in the 25 to 44 years age bracket for the primary householder. A total of 574 households (24.6%) fall into this category. Meanwhile, the 15 to 24 years age bracket for the primary householder has the lowest median household income of $42,656, with 87 households (3.7%) in this group.
| Income Bracket | # Households | Median Income |
| 15 to 24 Years | 87 (3.7%) | $42,656 |
| 25 to 44 Years | 574 (24.6%) | $82,292 |
| 45 to 64 Years | 983 (42.1%) | $66,336 |
| 65+ Years | 690 (29.6%) | $52,558 |
| Total | 2,334 (100.0%) | $61,779 |
Poverty in Prince of Wales-Hyder Census Area
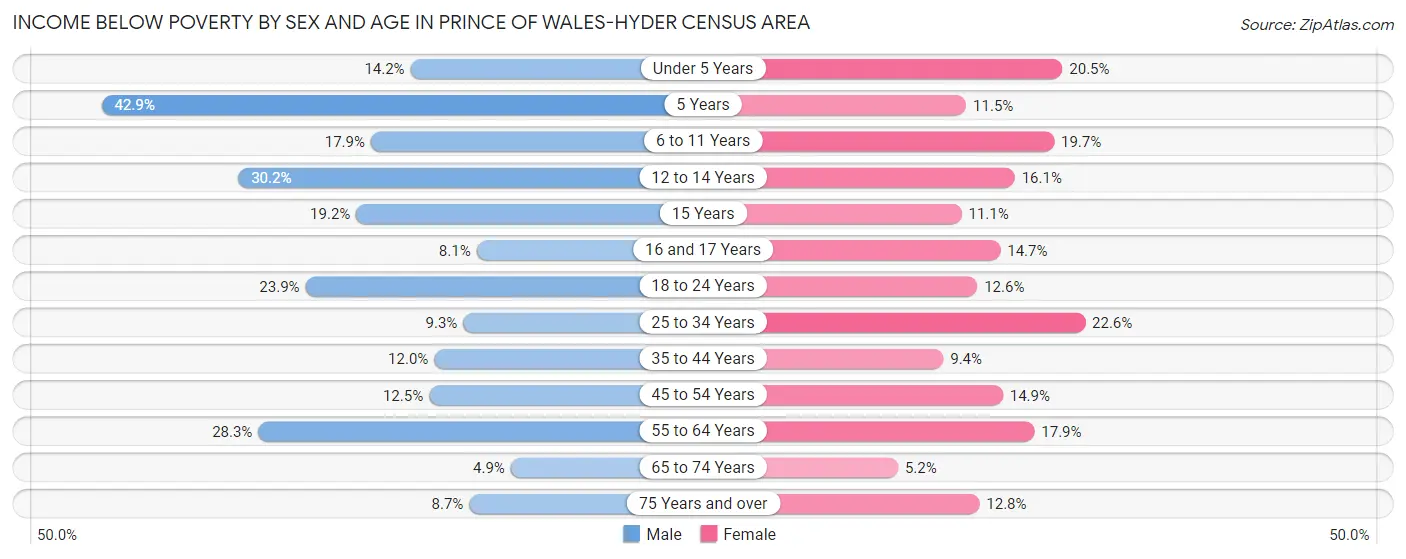
Income Below Poverty by Sex and Age in Prince of Wales-Hyder Census Area
With 15.6% poverty level for males and 14.9% for females among the residents of Prince of Wales-Hyder Census Area, 5 year old males and 25 to 34 year old females are the most vulnerable to poverty, with 27 males (42.9%) and 77 females (22.6%) in their respective age groups living below the poverty level.
| Age Bracket | Male | Female |
| Under 5 Years | 22 (14.2%) | 26 (20.5%) |
| 5 Years | 27 (42.9%) | 3 (11.5%) |
| 6 to 11 Years | 37 (17.9%) | 39 (19.7%) |
| 12 to 14 Years | 35 (30.2%) | 13 (16.1%) |
| 15 Years | 5 (19.2%) | 4 (11.1%) |
| 16 and 17 Years | 10 (8.1%) | 5 (14.7%) |
| 18 to 24 Years | 51 (23.9%) | 24 (12.6%) |
| 25 to 34 Years | 33 (9.3%) | 77 (22.6%) |
| 35 to 44 Years | 44 (12.0%) | 26 (9.4%) |
| 45 to 54 Years | 52 (12.5%) | 46 (14.9%) |
| 55 to 64 Years | 147 (28.3%) | 79 (17.9%) |
| 65 to 74 Years | 23 (4.9%) | 17 (5.2%) |
| 75 Years and over | 16 (8.7%) | 18 (12.8%) |
| Total | 502 (15.6%) | 377 (14.9%) |
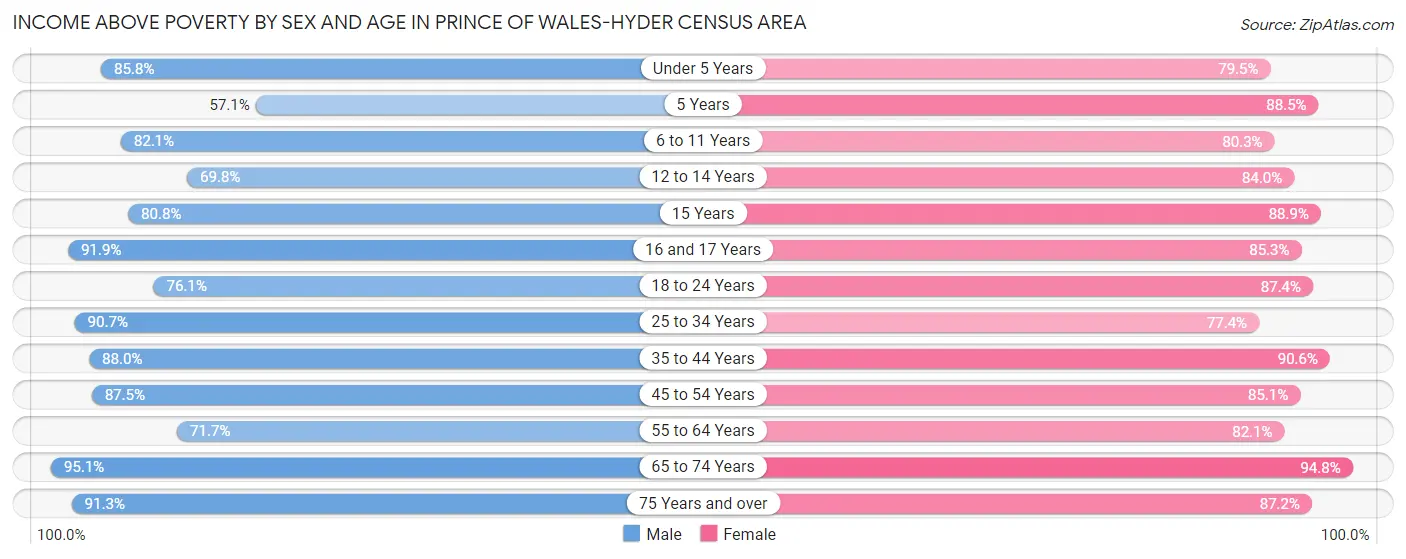
Income Above Poverty by Sex and Age in Prince of Wales-Hyder Census Area
According to the poverty statistics in Prince of Wales-Hyder Census Area, males aged 65 to 74 years and females aged 65 to 74 years are the age groups that are most secure financially, with 95.1% of males and 94.8% of females in these age groups living above the poverty line.
| Age Bracket | Male | Female |
| Under 5 Years | 133 (85.8%) | 101 (79.5%) |
| 5 Years | 36 (57.1%) | 23 (88.5%) |
| 6 to 11 Years | 170 (82.1%) | 159 (80.3%) |
| 12 to 14 Years | 81 (69.8%) | 68 (84.0%) |
| 15 Years | 21 (80.8%) | 32 (88.9%) |
| 16 and 17 Years | 114 (91.9%) | 29 (85.3%) |
| 18 to 24 Years | 162 (76.1%) | 167 (87.4%) |
| 25 to 34 Years | 322 (90.7%) | 264 (77.4%) |
| 35 to 44 Years | 323 (88.0%) | 250 (90.6%) |
| 45 to 54 Years | 365 (87.5%) | 262 (85.1%) |
| 55 to 64 Years | 372 (71.7%) | 363 (82.1%) |
| 65 to 74 Years | 447 (95.1%) | 309 (94.8%) |
| 75 Years and over | 167 (91.3%) | 123 (87.2%) |
| Total | 2,713 (84.4%) | 2,150 (85.1%) |
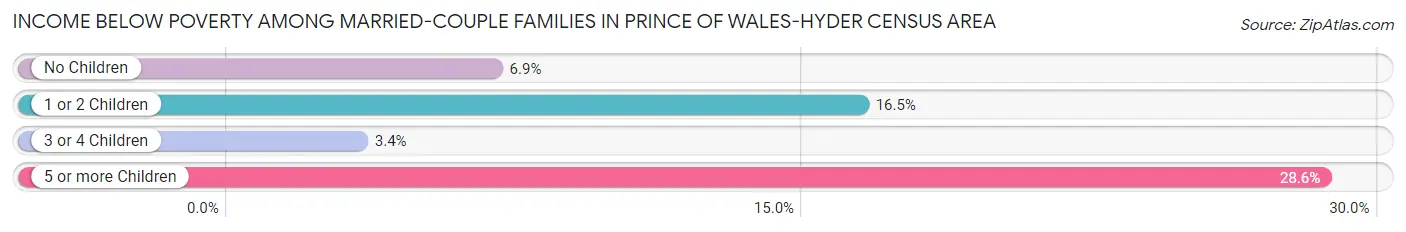
Income Below Poverty Among Married-Couple Families in Prince of Wales-Hyder Census Area
The poverty statistics for married-couple families in Prince of Wales-Hyder Census Area show that 8.9% or 97 of the total 1,084 families live below the poverty line. Families with 5 or more children have the highest poverty rate of 28.6%, comprising of 6 families. On the other hand, families with 3 or 4 children have the lowest poverty rate of 3.4%, which includes 6 families.
| Children | Above Poverty | Below Poverty |
| No Children | 593 (93.1%) | 44 (6.9%) |
| 1 or 2 Children | 208 (83.5%) | 41 (16.5%) |
| 3 or 4 Children | 171 (96.6%) | 6 (3.4%) |
| 5 or more Children | 15 (71.4%) | 6 (28.6%) |
| Total | 987 (91.0%) | 97 (8.9%) |
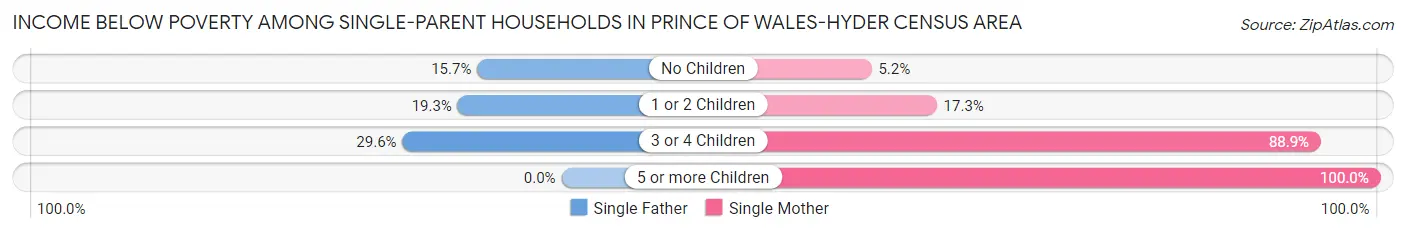
Income Below Poverty Among Single-Parent Households in Prince of Wales-Hyder Census Area
According to the poverty data in Prince of Wales-Hyder Census Area, 19.7% or 39 single-father households and 23.5% or 50 single-mother households are living below the poverty line. Among single-father households, those with 3 or 4 children have the highest poverty rate, with 8 households (29.6%) experiencing poverty. Likewise, among single-mother households, those with 5 or more children have the highest poverty rate, with 1 households (100.0%) falling below the poverty line.
| Children | Single Father | Single Mother |
| No Children | 8 (15.7%) | 3 (5.2%) |
| 1 or 2 Children | 23 (19.3%) | 22 (17.3%) |
| 3 or 4 Children | 8 (29.6%) | 24 (88.9%) |
| 5 or more Children | 0 (0.0%) | 1 (100.0%) |
| Total | 39 (19.7%) | 50 (23.5%) |
Income Below Poverty Among Married-Couple vs Single-Parent Households in Prince of Wales-Hyder Census Area
The poverty data for Prince of Wales-Hyder Census Area shows that 97 of the married-couple family households (8.9%) and 89 of the single-parent households (21.6%) are living below the poverty level. Within the married-couple family households, those with 5 or more children have the highest poverty rate, with 6 households (28.6%) falling below the poverty line. Among the single-parent households, those with 3 or 4 children have the highest poverty rate, with 32 household (59.3%) living below poverty.
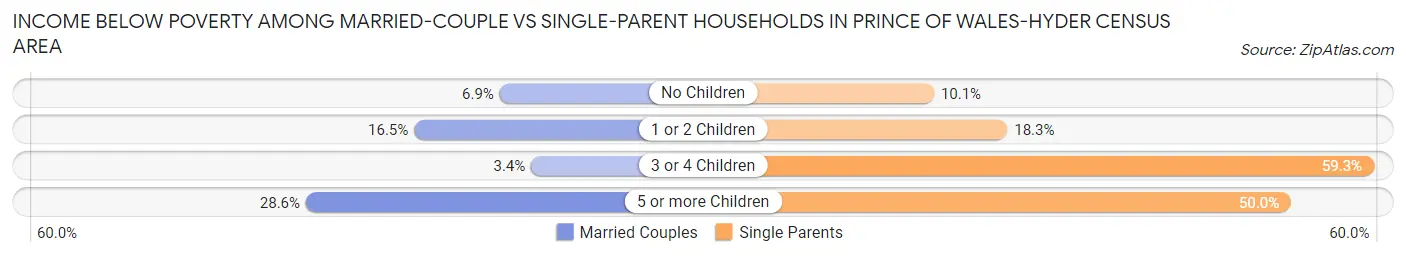
| Children | Married-Couple Families | Single-Parent Households |
| No Children | 44 (6.9%) | 11 (10.1%) |
| 1 or 2 Children | 41 (16.5%) | 45 (18.3%) |
| 3 or 4 Children | 6 (3.4%) | 32 (59.3%) |
| 5 or more Children | 6 (28.6%) | 1 (50.0%) |
| Total | 97 (8.9%) | 89 (21.6%) |
Employment Characteristics in Prince of Wales-Hyder Census Area
Employment by Class of Employer in Prince of Wales-Hyder Census Area
Among the 2,626 employed individuals in Prince of Wales-Hyder Census Area, private company employees (875 | 33.3%), local government employees (790 | 30.1%), and not-for-profit organizations (247 | 9.4%) make up the most common classes of employment.
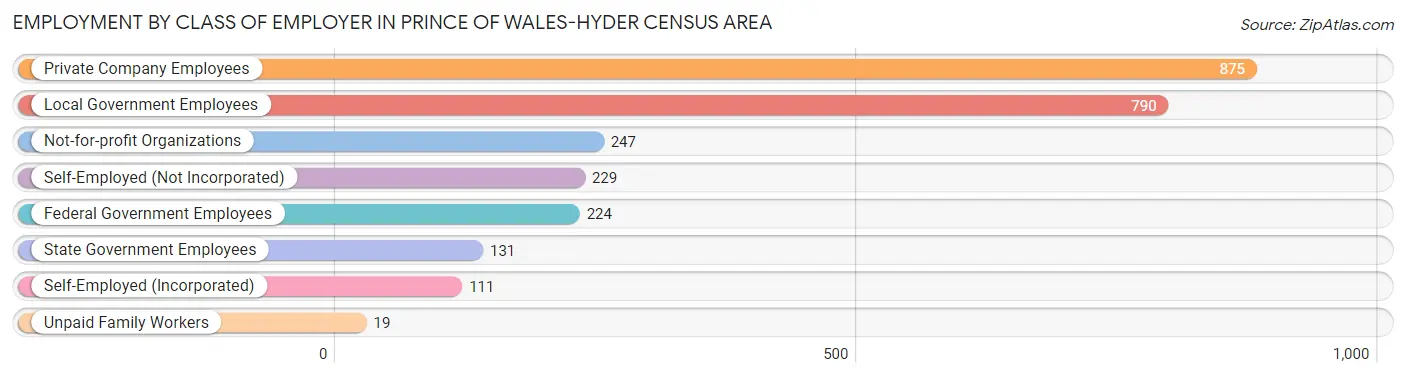
| Employer Class | # Employees | % Employees |
| Private Company Employees | 875 | 33.3% |
| Self-Employed (Incorporated) | 111 | 4.2% |
| Self-Employed (Not Incorporated) | 229 | 8.7% |
| Not-for-profit Organizations | 247 | 9.4% |
| Local Government Employees | 790 | 30.1% |
| State Government Employees | 131 | 5.0% |
| Federal Government Employees | 224 | 8.5% |
| Unpaid Family Workers | 19 | 0.7% |
| Total | 2,626 | 100.0% |
Employment Status by Age in Prince of Wales-Hyder Census Area
According to the labor force statistics for Prince of Wales-Hyder Census Area, out of the total population over 16 years of age (4,713), 63.0% or 2,969 individuals are in the labor force, with 7.5% or 223 of them unemployed. The age group with the highest labor force participation rate is 35 to 44 years, with 89.3% or 574 individuals in the labor force. Within the labor force, the 16 to 19 years age range has the highest percentage of unemployed individuals, with 17.8% or 26 of them being unemployed.
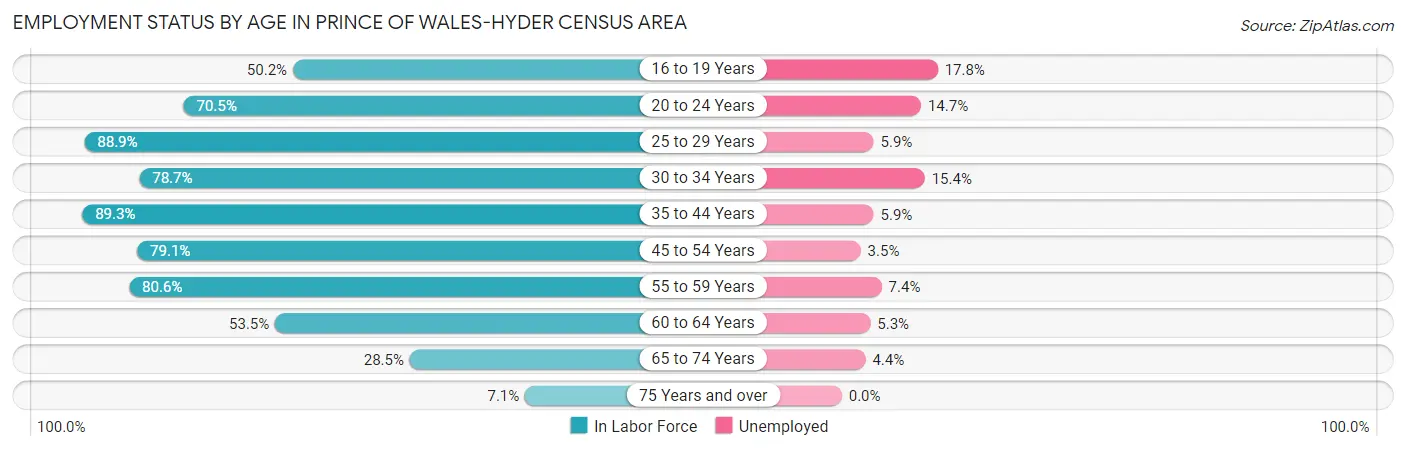
| Age Bracket | In Labor Force | Unemployed |
| 16 to 19 Years | 146 (50.2%) | 26 (17.8%) |
| 20 to 24 Years | 191 (70.5%) | 28 (14.7%) |
| 25 to 29 Years | 273 (88.9%) | 16 (5.9%) |
| 30 to 34 Years | 306 (78.7%) | 47 (15.4%) |
| 35 to 44 Years | 574 (89.3%) | 34 (5.9%) |
| 45 to 54 Years | 578 (79.1%) | 20 (3.5%) |
| 55 to 59 Years | 407 (80.6%) | 30 (7.4%) |
| 60 to 64 Years | 244 (53.5%) | 13 (5.3%) |
| 65 to 74 Years | 227 (28.5%) | 10 (4.4%) |
| 75 Years and over | 23 (7.1%) | 0 (0.0%) |
| Total | 2,969 (63.0%) | 223 (7.5%) |
Employment Status by Educational Attainment in Prince of Wales-Hyder Census Area
According to labor force statistics for Prince of Wales-Hyder Census Area, 78.6% of individuals (2,382) out of the total population between 25 and 64 years of age (3,031) are in the labor force, with 6.7% or 160 of them being unemployed. The group with the highest labor force participation rate are those with the educational attainment of college / associate degree, with 85.7% or 944 individuals in the labor force. Within the labor force, individuals with less than high school education have the highest percentage of unemployment, with 14.7% or 20 of them being unemployed.
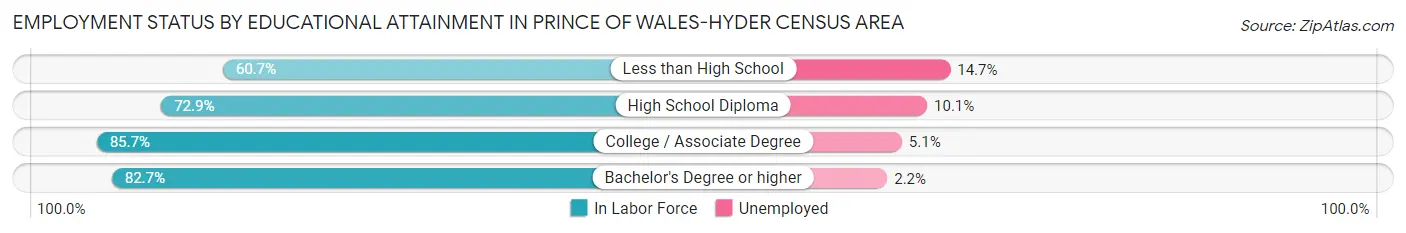
| Educational Attainment | In Labor Force | Unemployed |
| Less than High School | 136 (60.7%) | 33 (14.7%) |
| High School Diploma | 804 (72.9%) | 111 (10.1%) |
| College / Associate Degree | 944 (85.7%) | 56 (5.1%) |
| Bachelor's Degree or higher | 498 (82.7%) | 13 (2.2%) |
| Total | 2,382 (78.6%) | 203 (6.7%) |
Employment Occupations by Sex in Prince of Wales-Hyder Census Area
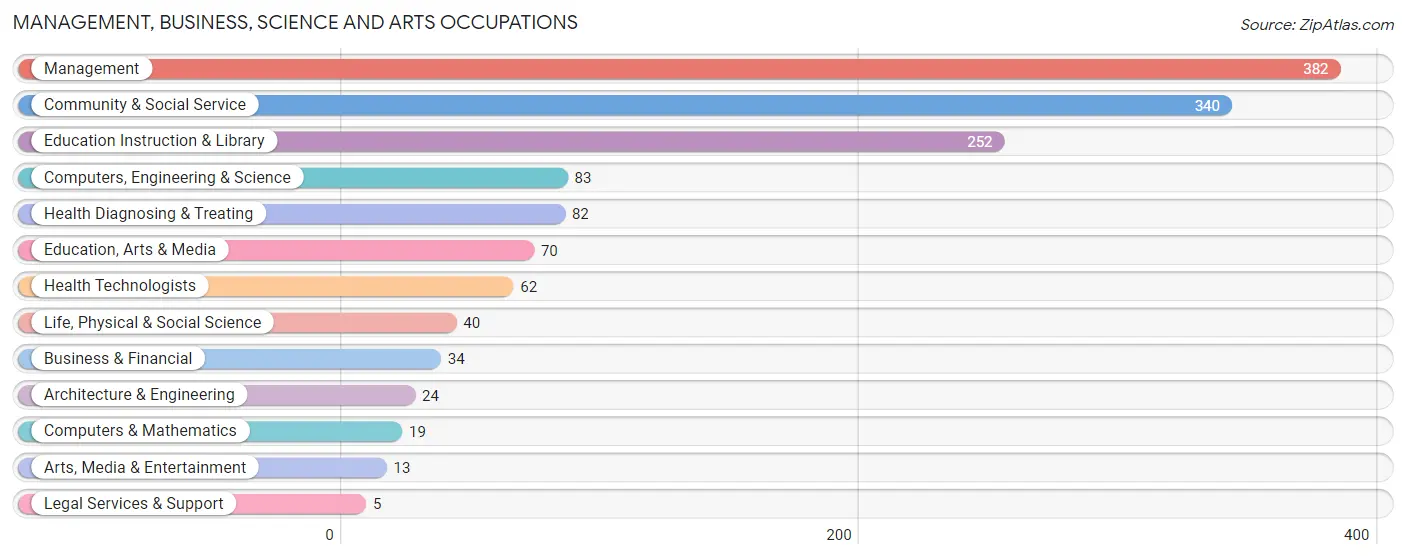
Management, Business, Science and Arts Occupations
The most common Management, Business, Science and Arts occupations in Prince of Wales-Hyder Census Area are Management (382 | 13.9%), Community & Social Service (340 | 12.4%), Education Instruction & Library (252 | 9.2%), Computers, Engineering & Science (83 | 3.0%), and Health Diagnosing & Treating (82 | 3.0%).
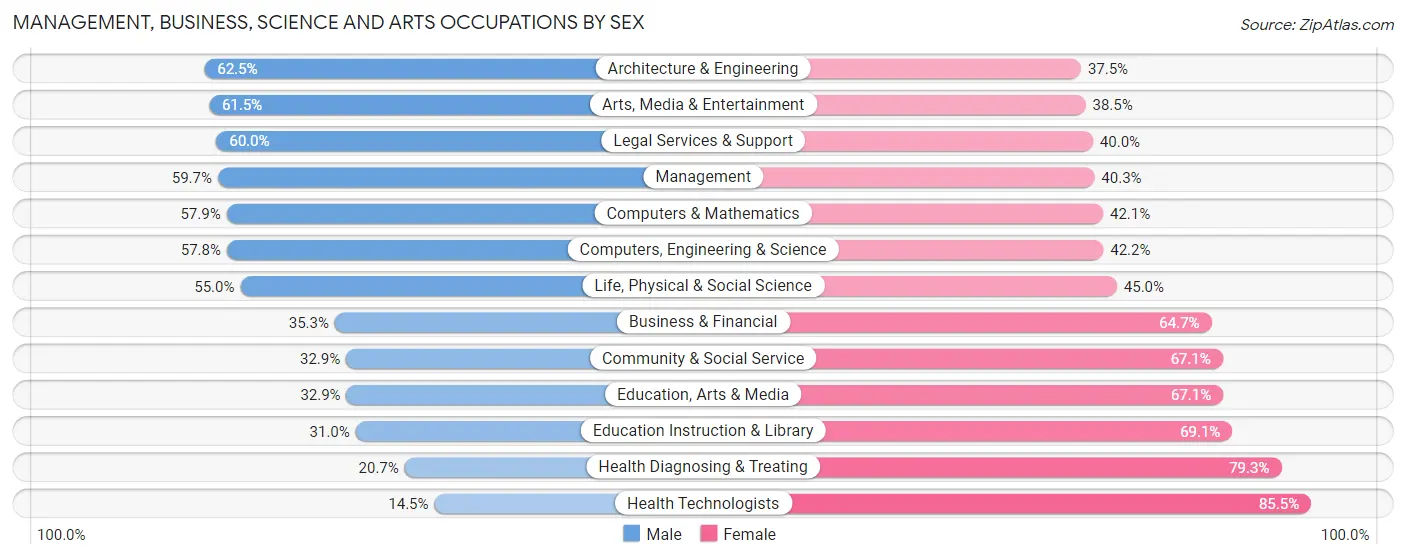
Management, Business, Science and Arts Occupations by Sex
Within the Management, Business, Science and Arts occupations in Prince of Wales-Hyder Census Area, the most male-oriented occupations are Architecture & Engineering (62.5%), Arts, Media & Entertainment (61.5%), and Legal Services & Support (60.0%), while the most female-oriented occupations are Health Technologists (85.5%), Health Diagnosing & Treating (79.3%), and Education Instruction & Library (69.1%).
| Occupation | Male | Female |
| Management | 228 (59.7%) | 154 (40.3%) |
| Business & Financial | 12 (35.3%) | 22 (64.7%) |
| Computers, Engineering & Science | 48 (57.8%) | 35 (42.2%) |
| Computers & Mathematics | 11 (57.9%) | 8 (42.1%) |
| Architecture & Engineering | 15 (62.5%) | 9 (37.5%) |
| Life, Physical & Social Science | 22 (55.0%) | 18 (45.0%) |
| Community & Social Service | 112 (32.9%) | 228 (67.1%) |
| Education, Arts & Media | 23 (32.9%) | 47 (67.1%) |
| Legal Services & Support | 3 (60.0%) | 2 (40.0%) |
| Education Instruction & Library | 78 (30.9%) | 174 (69.1%) |
| Arts, Media & Entertainment | 8 (61.5%) | 5 (38.5%) |
| Health Diagnosing & Treating | 17 (20.7%) | 65 (79.3%) |
| Health Technologists | 9 (14.5%) | 53 (85.5%) |
| Total (Category) | 417 (45.3%) | 504 (54.7%) |
| Total (Overall) | 1,572 (57.3%) | 1,173 (42.7%) |
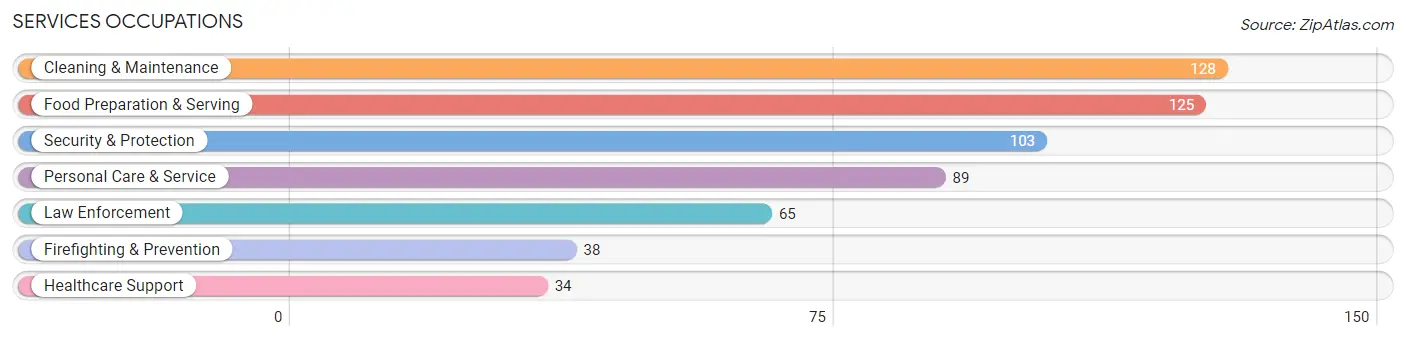
Services Occupations
The most common Services occupations in Prince of Wales-Hyder Census Area are Cleaning & Maintenance (128 | 4.7%), Food Preparation & Serving (125 | 4.5%), Security & Protection (103 | 3.7%), Personal Care & Service (89 | 3.2%), and Law Enforcement (65 | 2.4%).
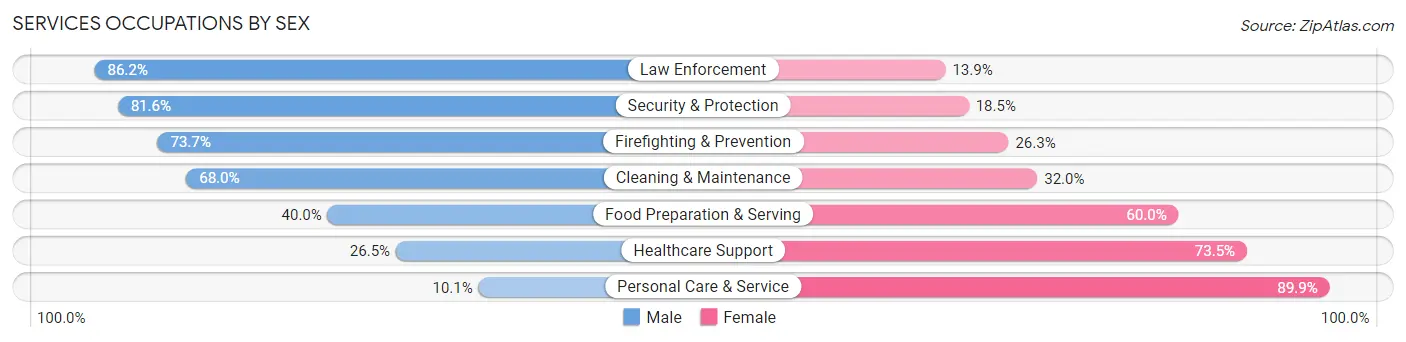
Services Occupations by Sex
Within the Services occupations in Prince of Wales-Hyder Census Area, the most male-oriented occupations are Law Enforcement (86.2%), Security & Protection (81.6%), and Firefighting & Prevention (73.7%), while the most female-oriented occupations are Personal Care & Service (89.9%), Healthcare Support (73.5%), and Food Preparation & Serving (60.0%).
| Occupation | Male | Female |
| Healthcare Support | 9 (26.5%) | 25 (73.5%) |
| Security & Protection | 84 (81.6%) | 19 (18.4%) |
| Firefighting & Prevention | 28 (73.7%) | 10 (26.3%) |
| Law Enforcement | 56 (86.2%) | 9 (13.9%) |
| Food Preparation & Serving | 50 (40.0%) | 75 (60.0%) |
| Cleaning & Maintenance | 87 (68.0%) | 41 (32.0%) |
| Personal Care & Service | 9 (10.1%) | 80 (89.9%) |
| Total (Category) | 239 (49.9%) | 240 (50.1%) |
| Total (Overall) | 1,572 (57.3%) | 1,173 (42.7%) |
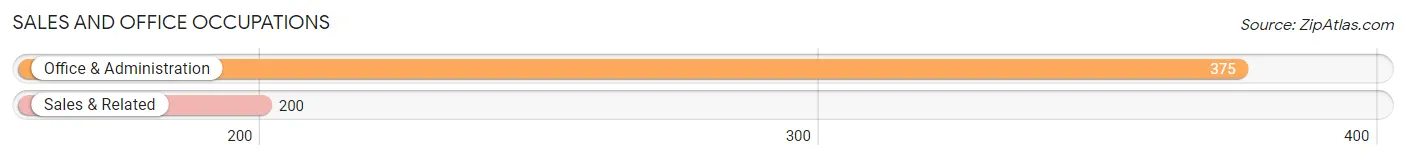
Sales and Office Occupations
The most common Sales and Office occupations in Prince of Wales-Hyder Census Area are Office & Administration (375 | 13.7%), and Sales & Related (200 | 7.3%).
Sales and Office Occupations by Sex
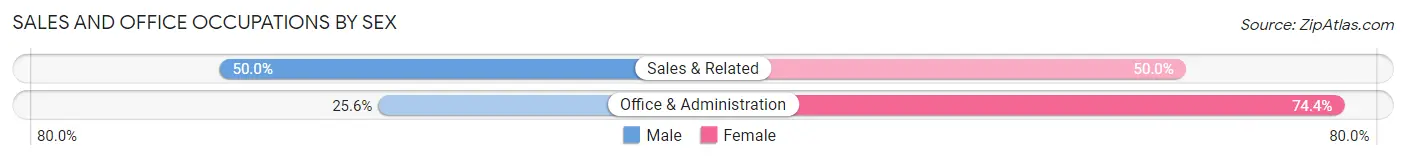
| Occupation | Male | Female |
| Sales & Related | 100 (50.0%) | 100 (50.0%) |
| Office & Administration | 96 (25.6%) | 279 (74.4%) |
| Total (Category) | 196 (34.1%) | 379 (65.9%) |
| Total (Overall) | 1,572 (57.3%) | 1,173 (42.7%) |
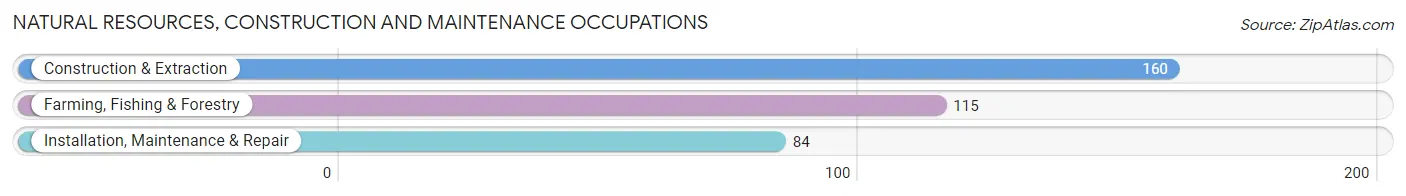
Natural Resources, Construction and Maintenance Occupations
The most common Natural Resources, Construction and Maintenance occupations in Prince of Wales-Hyder Census Area are Construction & Extraction (160 | 5.8%), Farming, Fishing & Forestry (115 | 4.2%), and Installation, Maintenance & Repair (84 | 3.1%).
Natural Resources, Construction and Maintenance Occupations by Sex
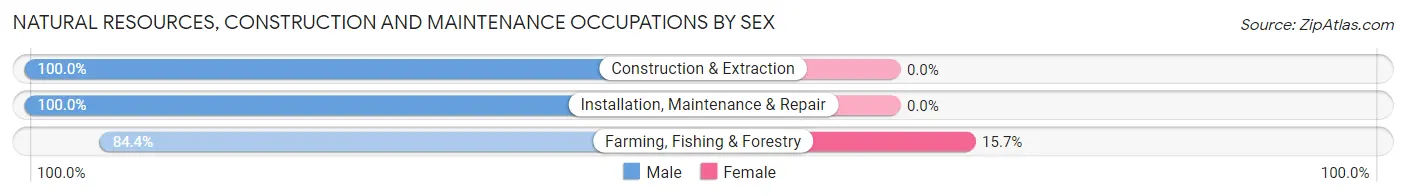
| Occupation | Male | Female |
| Farming, Fishing & Forestry | 97 (84.4%) | 18 (15.7%) |
| Construction & Extraction | 160 (100.0%) | 0 (0.0%) |
| Installation, Maintenance & Repair | 84 (100.0%) | 0 (0.0%) |
| Total (Category) | 341 (95.0%) | 18 (5.0%) |
| Total (Overall) | 1,572 (57.3%) | 1,173 (42.7%) |
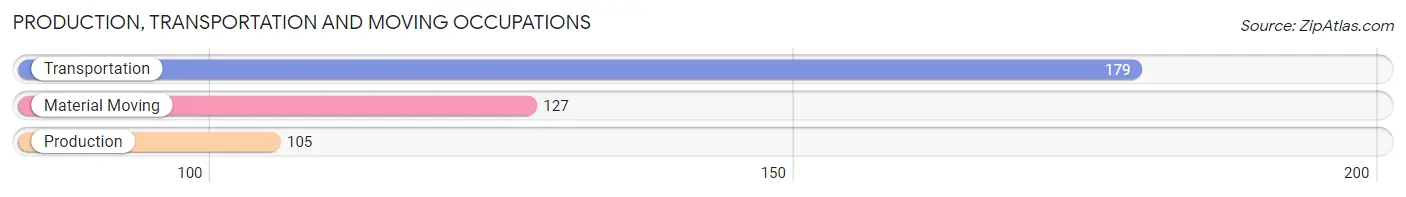
Production, Transportation and Moving Occupations
The most common Production, Transportation and Moving occupations in Prince of Wales-Hyder Census Area are Transportation (179 | 6.5%), Material Moving (127 | 4.6%), and Production (105 | 3.8%).
Production, Transportation and Moving Occupations by Sex
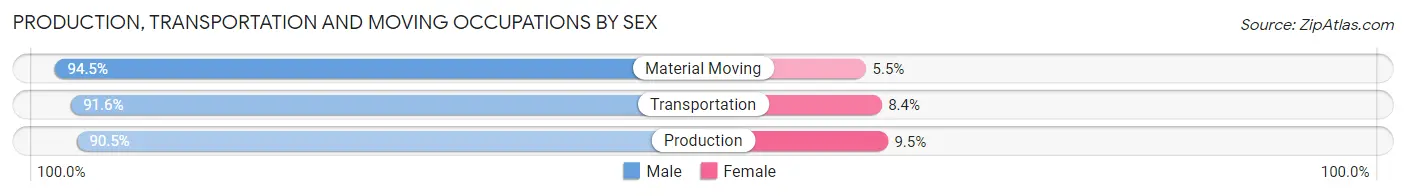
| Occupation | Male | Female |
| Production | 95 (90.5%) | 10 (9.5%) |
| Transportation | 164 (91.6%) | 15 (8.4%) |
| Material Moving | 120 (94.5%) | 7 (5.5%) |
| Total (Category) | 379 (92.2%) | 32 (7.8%) |
| Total (Overall) | 1,572 (57.3%) | 1,173 (42.7%) |
Employment Industries by Sex in Prince of Wales-Hyder Census Area
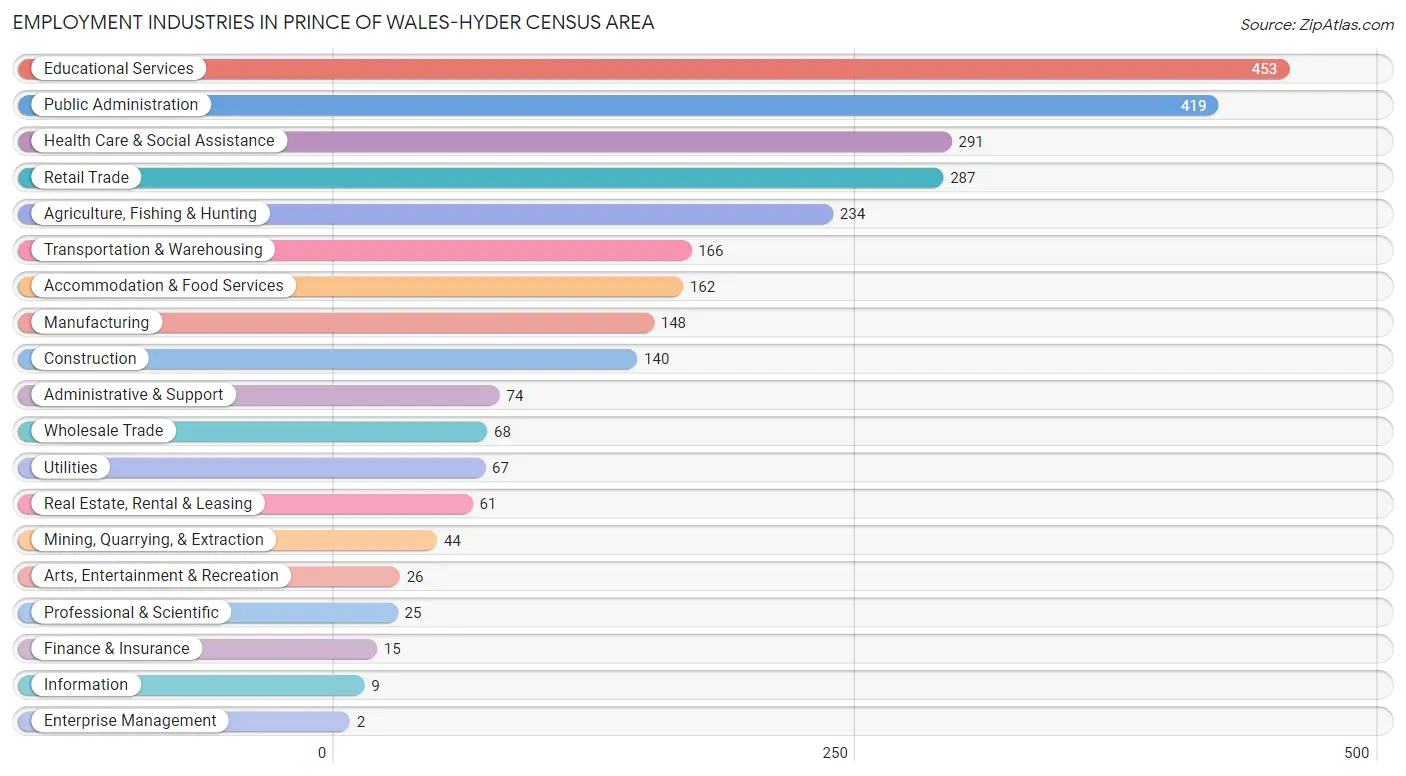
Employment Industries in Prince of Wales-Hyder Census Area
The major employment industries in Prince of Wales-Hyder Census Area include Educational Services (453 | 16.5%), Public Administration (419 | 15.3%), Health Care & Social Assistance (291 | 10.6%), Retail Trade (287 | 10.5%), and Agriculture, Fishing & Hunting (234 | 8.5%).
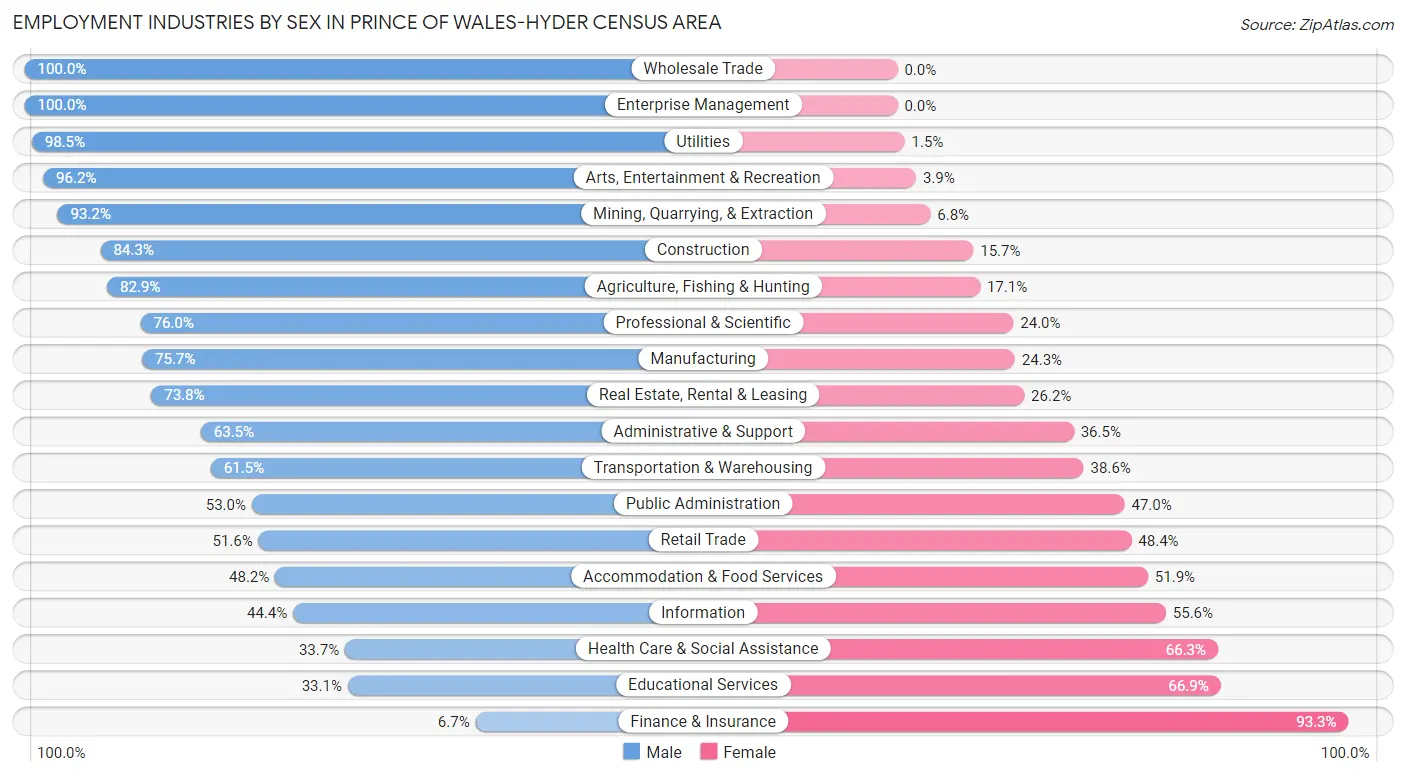
Employment Industries by Sex in Prince of Wales-Hyder Census Area
The Prince of Wales-Hyder Census Area industries that see more men than women are Wholesale Trade (100.0%), Enterprise Management (100.0%), and Utilities (98.5%), whereas the industries that tend to have a higher number of women are Finance & Insurance (93.3%), Educational Services (66.9%), and Health Care & Social Assistance (66.3%).
| Industry | Male | Female |
| Agriculture, Fishing & Hunting | 194 (82.9%) | 40 (17.1%) |
| Mining, Quarrying, & Extraction | 41 (93.2%) | 3 (6.8%) |
| Construction | 118 (84.3%) | 22 (15.7%) |
| Manufacturing | 112 (75.7%) | 36 (24.3%) |
| Wholesale Trade | 68 (100.0%) | 0 (0.0%) |
| Retail Trade | 148 (51.6%) | 139 (48.4%) |
| Transportation & Warehousing | 102 (61.5%) | 64 (38.6%) |
| Utilities | 66 (98.5%) | 1 (1.5%) |
| Information | 4 (44.4%) | 5 (55.6%) |
| Finance & Insurance | 1 (6.7%) | 14 (93.3%) |
| Real Estate, Rental & Leasing | 45 (73.8%) | 16 (26.2%) |
| Professional & Scientific | 19 (76.0%) | 6 (24.0%) |
| Enterprise Management | 2 (100.0%) | 0 (0.0%) |
| Administrative & Support | 47 (63.5%) | 27 (36.5%) |
| Educational Services | 150 (33.1%) | 303 (66.9%) |
| Health Care & Social Assistance | 98 (33.7%) | 193 (66.3%) |
| Arts, Entertainment & Recreation | 25 (96.2%) | 1 (3.8%) |
| Accommodation & Food Services | 78 (48.1%) | 84 (51.8%) |
| Public Administration | 222 (53.0%) | 197 (47.0%) |
| Total | 1,572 (57.3%) | 1,173 (42.7%) |
Education in Prince of Wales-Hyder Census Area
School Enrollment in Prince of Wales-Hyder Census Area
The most common levels of schooling among the 1,257 students in Prince of Wales-Hyder Census Area are high school (320 | 25.5%), middle school (294 | 23.4%), and elementary school (282 | 22.4%).
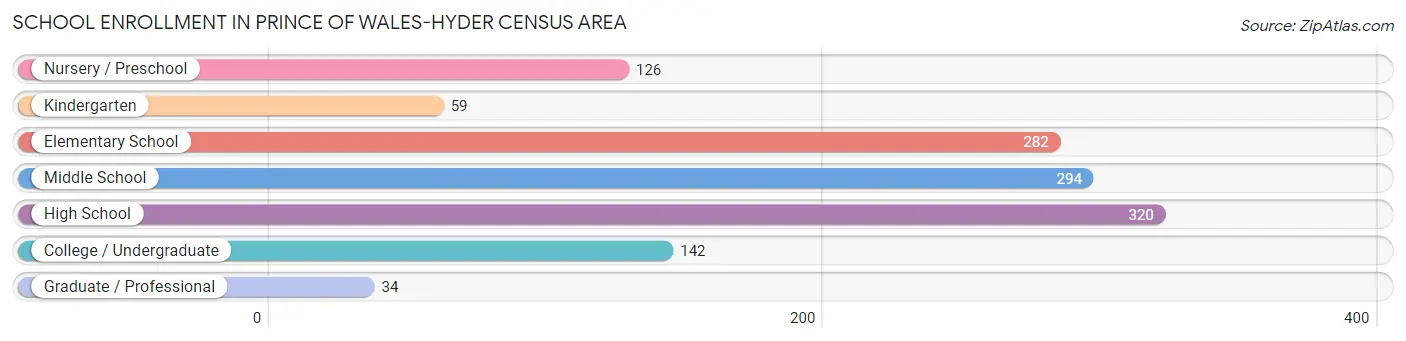
| School Level | # Students | % Students |
| Nursery / Preschool | 126 | 10.0% |
| Kindergarten | 59 | 4.7% |
| Elementary School | 282 | 22.4% |
| Middle School | 294 | 23.4% |
| High School | 320 | 25.5% |
| College / Undergraduate | 142 | 11.3% |
| Graduate / Professional | 34 | 2.7% |
| Total | 1,257 | 100.0% |
School Enrollment by Age by Funding Source in Prince of Wales-Hyder Census Area
Out of a total of 1,257 students who are enrolled in schools in Prince of Wales-Hyder Census Area, 47 (3.7%) attend a private institution, while the remaining 1,210 (96.3%) are enrolled in public schools. The age group of 20 to 24 year olds has the highest likelihood of being enrolled in private schools, with 12 (37.5% in the age bracket) enrolled. Conversely, the age group of 5 to 9 year old has the lowest likelihood of being enrolled in a private school, with 354 (100.0% in the age bracket) attending a public institution.

| Age Bracket | Public School | Private School |
| 3 to 4 Year Olds | 81 (97.6%) | 2 (2.4%) |
| 5 to 9 Year Old | 354 (100.0%) | 0 (0.0%) |
| 10 to 14 Year Olds | 367 (97.9%) | 8 (2.1%) |
| 15 to 17 Year Olds | 211 (95.9%) | 9 (4.1%) |
| 18 to 19 Year Olds | 56 (94.9%) | 3 (5.1%) |
| 20 to 24 Year Olds | 20 (62.5%) | 12 (37.5%) |
| 25 to 34 Year Olds | 31 (83.8%) | 6 (16.2%) |
| 35 Years and over | 91 (93.8%) | 6 (6.2%) |
| Total | 1,210 (96.3%) | 47 (3.7%) |
Educational Attainment by Field of Study in Prince of Wales-Hyder Census Area
Education (190 | 20.2%), bio, nature & agricultural (185 | 19.7%), business (131 | 14.0%), science & technology (64 | 6.8%), and social sciences (49 | 5.2%) are the most common fields of study among 939 individuals in Prince of Wales-Hyder Census Area who have obtained a bachelor's degree or higher.
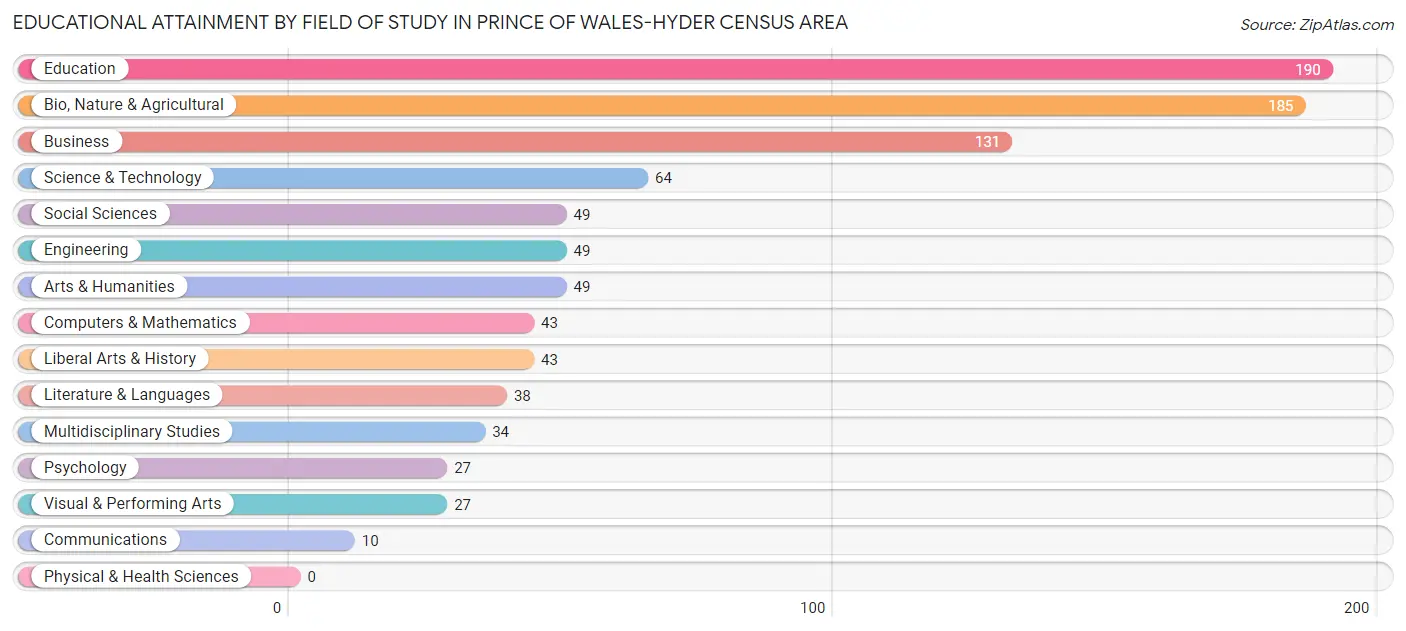
| Field of Study | # Graduates | % Graduates |
| Computers & Mathematics | 43 | 4.6% |
| Bio, Nature & Agricultural | 185 | 19.7% |
| Physical & Health Sciences | 0 | 0.0% |
| Psychology | 27 | 2.9% |
| Social Sciences | 49 | 5.2% |
| Engineering | 49 | 5.2% |
| Multidisciplinary Studies | 34 | 3.6% |
| Science & Technology | 64 | 6.8% |
| Business | 131 | 14.0% |
| Education | 190 | 20.2% |
| Literature & Languages | 38 | 4.1% |
| Liberal Arts & History | 43 | 4.6% |
| Visual & Performing Arts | 27 | 2.9% |
| Communications | 10 | 1.1% |
| Arts & Humanities | 49 | 5.2% |
| Total | 939 | 100.0% |
Transportation & Commute in Prince of Wales-Hyder Census Area
Vehicle Availability by Sex in Prince of Wales-Hyder Census Area
The most prevalent vehicle ownership categories in Prince of Wales-Hyder Census Area are males with 2 vehicles (549, accounting for 38.9%) and females with 2 vehicles (447, making up 49.8%).
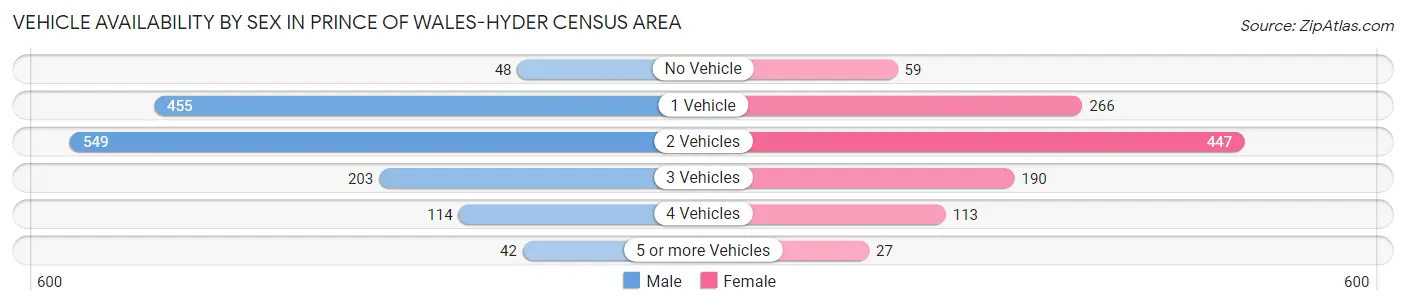
| Vehicles Available | Male | Female |
| No Vehicle | 48 (3.4%) | 59 (5.3%) |
| 1 Vehicle | 455 (32.3%) | 266 (24.1%) |
| 2 Vehicles | 549 (38.9%) | 447 (40.6%) |
| 3 Vehicles | 203 (14.4%) | 190 (17.2%) |
| 4 Vehicles | 114 (8.1%) | 113 (10.2%) |
| 5 or more Vehicles | 42 (3.0%) | 27 (2.5%) |
| Total | 1,411 (100.0%) | 1,102 (100.0%) |
Commute Time in Prince of Wales-Hyder Census Area
The most frequently occuring commute durations in Prince of Wales-Hyder Census Area are less than 5 minutes (912 commuters, 36.3%), 5 to 9 minutes (842 commuters, 33.5%), and 15 to 19 minutes (210 commuters, 8.4%).
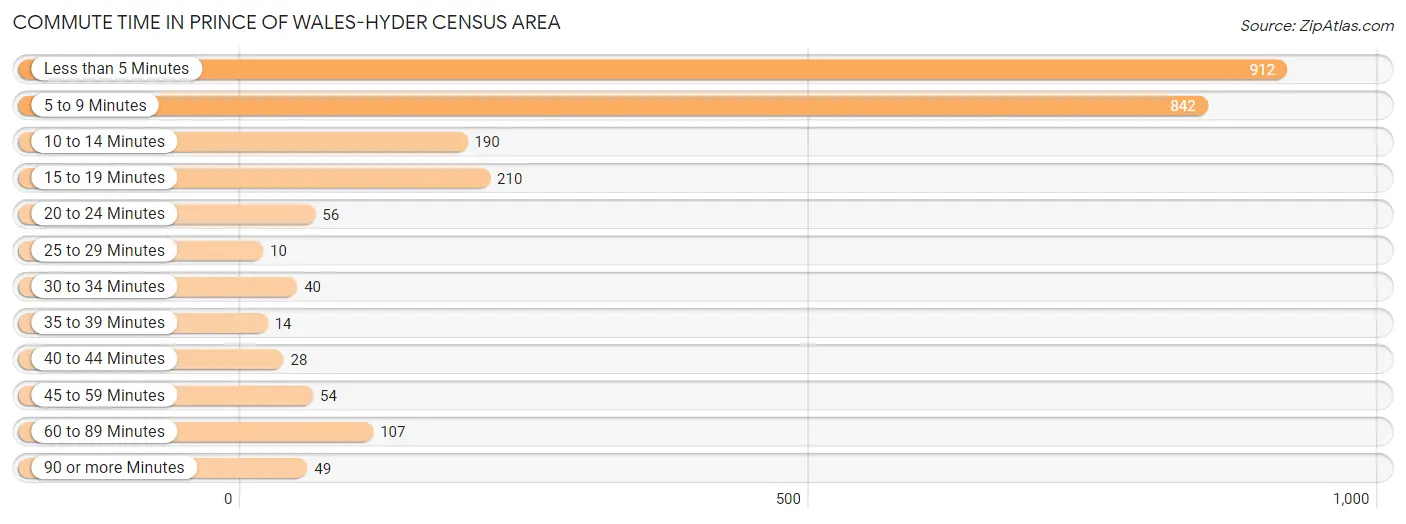
| Commute Time | # Commuters | % Commuters |
| Less than 5 Minutes | 912 | 36.3% |
| 5 to 9 Minutes | 842 | 33.5% |
| 10 to 14 Minutes | 190 | 7.6% |
| 15 to 19 Minutes | 210 | 8.4% |
| 20 to 24 Minutes | 56 | 2.2% |
| 25 to 29 Minutes | 10 | 0.4% |
| 30 to 34 Minutes | 40 | 1.6% |
| 35 to 39 Minutes | 14 | 0.6% |
| 40 to 44 Minutes | 28 | 1.1% |
| 45 to 59 Minutes | 54 | 2.1% |
| 60 to 89 Minutes | 107 | 4.3% |
| 90 or more Minutes | 49 | 1.9% |
Commute Time by Sex in Prince of Wales-Hyder Census Area
The most common commute times in Prince of Wales-Hyder Census Area are less than 5 minutes (519 commuters, 36.0%) for males and 5 to 9 minutes (400 commuters, 37.3%) for females.
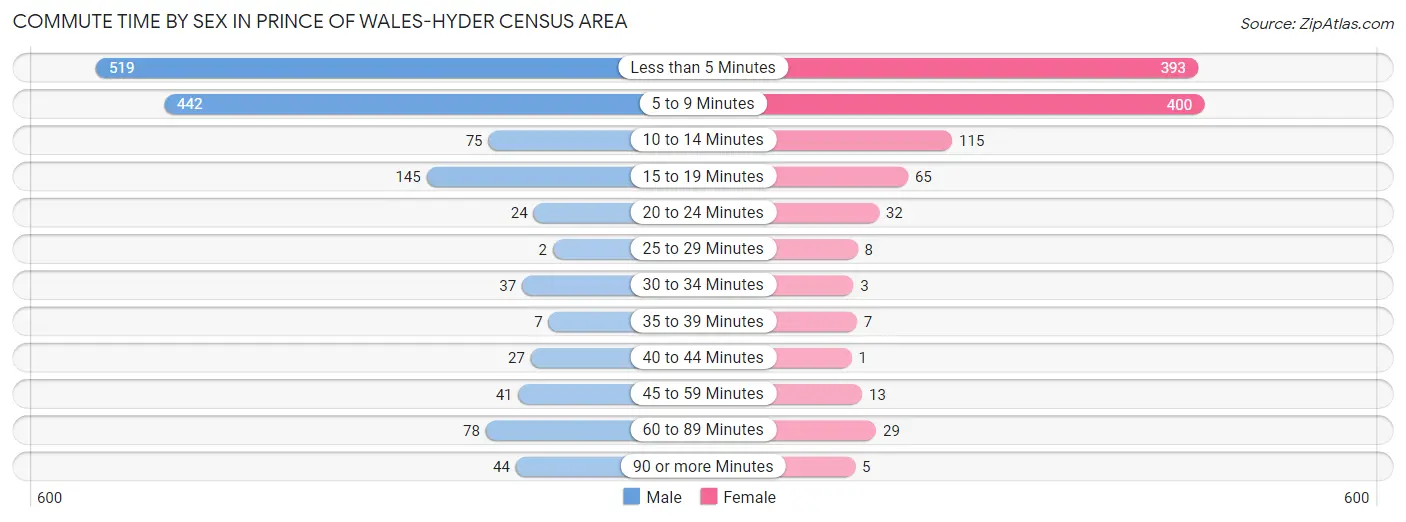
| Commute Time | Male | Female |
| Less than 5 Minutes | 519 (36.0%) | 393 (36.7%) |
| 5 to 9 Minutes | 442 (30.7%) | 400 (37.3%) |
| 10 to 14 Minutes | 75 (5.2%) | 115 (10.7%) |
| 15 to 19 Minutes | 145 (10.1%) | 65 (6.1%) |
| 20 to 24 Minutes | 24 (1.7%) | 32 (3.0%) |
| 25 to 29 Minutes | 2 (0.1%) | 8 (0.7%) |
| 30 to 34 Minutes | 37 (2.6%) | 3 (0.3%) |
| 35 to 39 Minutes | 7 (0.5%) | 7 (0.6%) |
| 40 to 44 Minutes | 27 (1.9%) | 1 (0.1%) |
| 45 to 59 Minutes | 41 (2.9%) | 13 (1.2%) |
| 60 to 89 Minutes | 78 (5.4%) | 29 (2.7%) |
| 90 or more Minutes | 44 (3.0%) | 5 (0.5%) |
Time of Departure to Work by Sex in Prince of Wales-Hyder Census Area
The most frequent times of departure to work in Prince of Wales-Hyder Census Area are 7:30 AM to 7:59 AM (250, 17.3%) for males and 7:30 AM to 7:59 AM (356, 33.2%) for females.
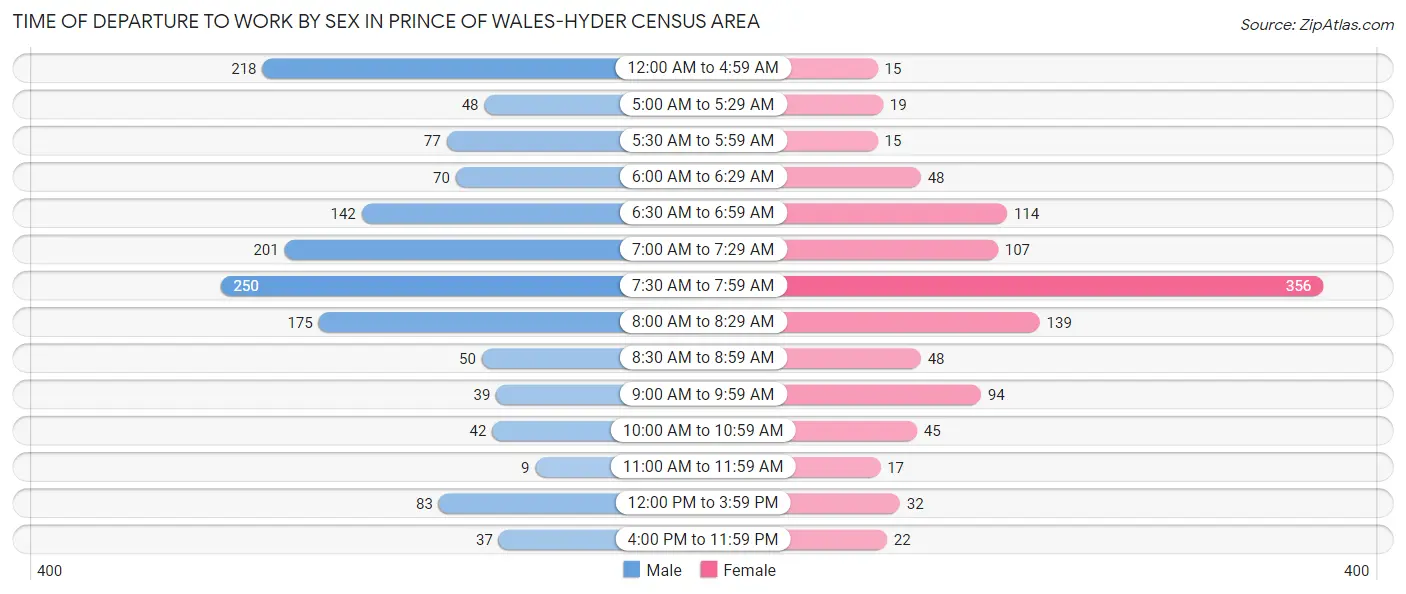
| Time of Departure | Male | Female |
| 12:00 AM to 4:59 AM | 218 (15.1%) | 15 (1.4%) |
| 5:00 AM to 5:29 AM | 48 (3.3%) | 19 (1.8%) |
| 5:30 AM to 5:59 AM | 77 (5.3%) | 15 (1.4%) |
| 6:00 AM to 6:29 AM | 70 (4.9%) | 48 (4.5%) |
| 6:30 AM to 6:59 AM | 142 (9.9%) | 114 (10.6%) |
| 7:00 AM to 7:29 AM | 201 (14.0%) | 107 (10.0%) |
| 7:30 AM to 7:59 AM | 250 (17.3%) | 356 (33.2%) |
| 8:00 AM to 8:29 AM | 175 (12.1%) | 139 (13.0%) |
| 8:30 AM to 8:59 AM | 50 (3.5%) | 48 (4.5%) |
| 9:00 AM to 9:59 AM | 39 (2.7%) | 94 (8.8%) |
| 10:00 AM to 10:59 AM | 42 (2.9%) | 45 (4.2%) |
| 11:00 AM to 11:59 AM | 9 (0.6%) | 17 (1.6%) |
| 12:00 PM to 3:59 PM | 83 (5.8%) | 32 (3.0%) |
| 4:00 PM to 11:59 PM | 37 (2.6%) | 22 (2.1%) |
| Total | 1,441 (100.0%) | 1,071 (100.0%) |
Housing Occupancy in Prince of Wales-Hyder Census Area
Occupancy by Ownership in Prince of Wales-Hyder Census Area
Of the total 2,334 dwellings in Prince of Wales-Hyder Census Area, owner-occupied units account for 1,695 (72.6%), while renter-occupied units make up 639 (27.4%).
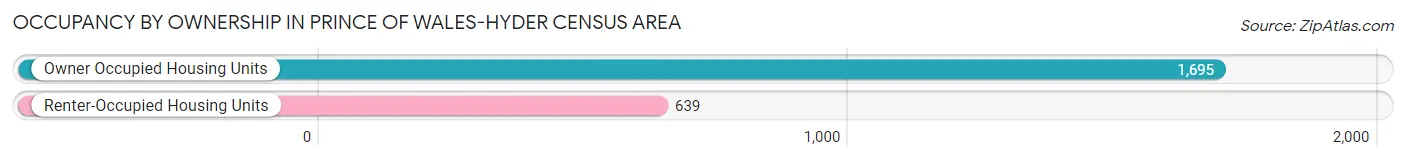
| Occupancy | # Housing Units | % Housing Units |
| Owner Occupied Housing Units | 1,695 | 72.6% |
| Renter-Occupied Housing Units | 639 | 27.4% |
| Total Occupied Housing Units | 2,334 | 100.0% |
Occupancy by Household Size in Prince of Wales-Hyder Census Area
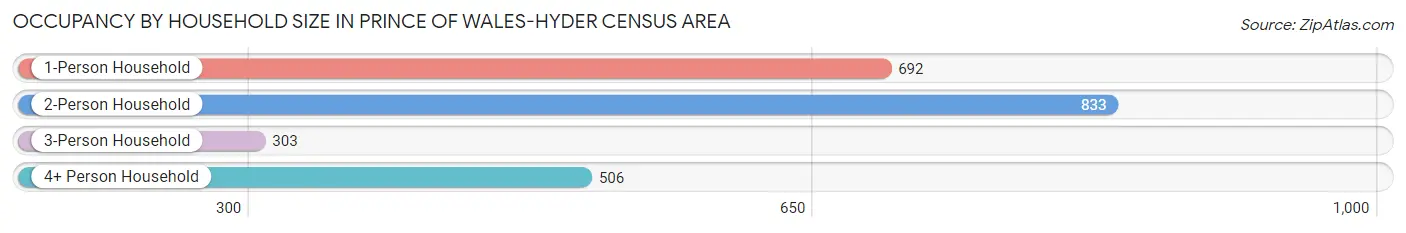
| Household Size | # Housing Units | % Housing Units |
| 1-Person Household | 692 | 29.6% |
| 2-Person Household | 833 | 35.7% |
| 3-Person Household | 303 | 13.0% |
| 4+ Person Household | 506 | 21.7% |
| Total Housing Units | 2,334 | 100.0% |
Occupancy by Ownership by Household Size in Prince of Wales-Hyder Census Area
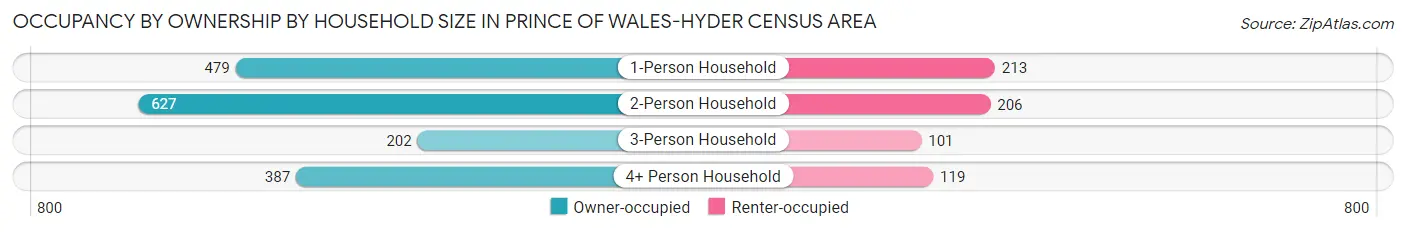
| Household Size | Owner-occupied | Renter-occupied |
| 1-Person Household | 479 (69.2%) | 213 (30.8%) |
| 2-Person Household | 627 (75.3%) | 206 (24.7%) |
| 3-Person Household | 202 (66.7%) | 101 (33.3%) |
| 4+ Person Household | 387 (76.5%) | 119 (23.5%) |
| Total Housing Units | 1,695 (72.6%) | 639 (27.4%) |
Occupancy by Educational Attainment in Prince of Wales-Hyder Census Area
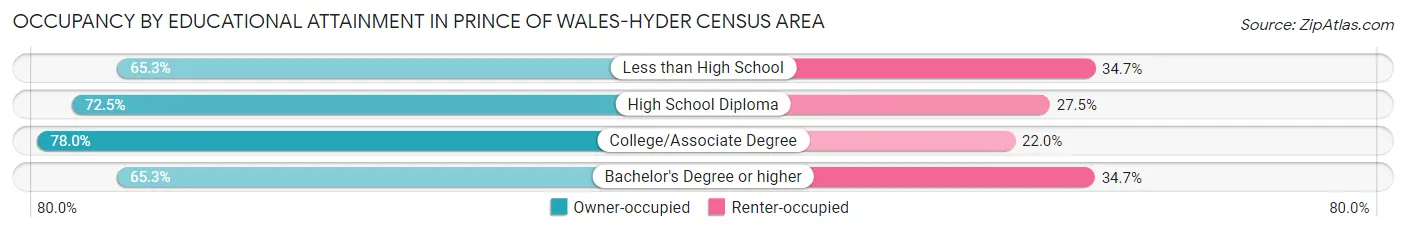
| Household Size | Owner-occupied | Renter-occupied |
| Less than High School | 94 (65.3%) | 50 (34.7%) |
| High School Diploma | 571 (72.5%) | 217 (27.5%) |
| College/Associate Degree | 704 (78.0%) | 199 (22.0%) |
| Bachelor's Degree or higher | 326 (65.3%) | 173 (34.7%) |
Occupancy by Age of Householder in Prince of Wales-Hyder Census Area
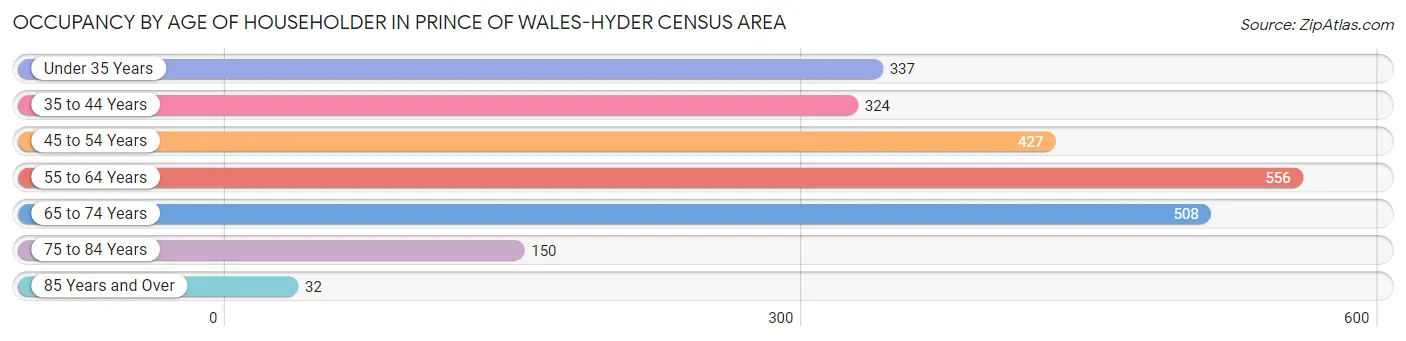
| Age Bracket | # Households | % Households |
| Under 35 Years | 337 | 14.4% |
| 35 to 44 Years | 324 | 13.9% |
| 45 to 54 Years | 427 | 18.3% |
| 55 to 64 Years | 556 | 23.8% |
| 65 to 74 Years | 508 | 21.8% |
| 75 to 84 Years | 150 | 6.4% |
| 85 Years and Over | 32 | 1.4% |
| Total | 2,334 | 100.0% |
Housing Finances in Prince of Wales-Hyder Census Area
Median Income by Occupancy in Prince of Wales-Hyder Census Area
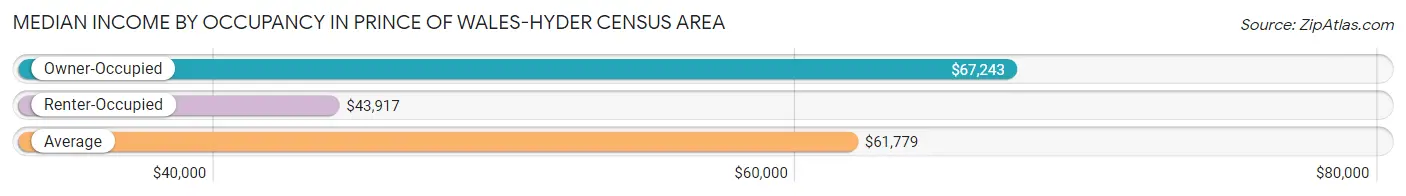
| Occupancy Type | # Households | Median Income |
| Owner-Occupied | 1,695 (72.6%) | $67,243 |
| Renter-Occupied | 639 (27.4%) | $43,917 |
| Average | 2,334 (100.0%) | $61,779 |
Occupancy by Householder Income Bracket in Prince of Wales-Hyder Census Area
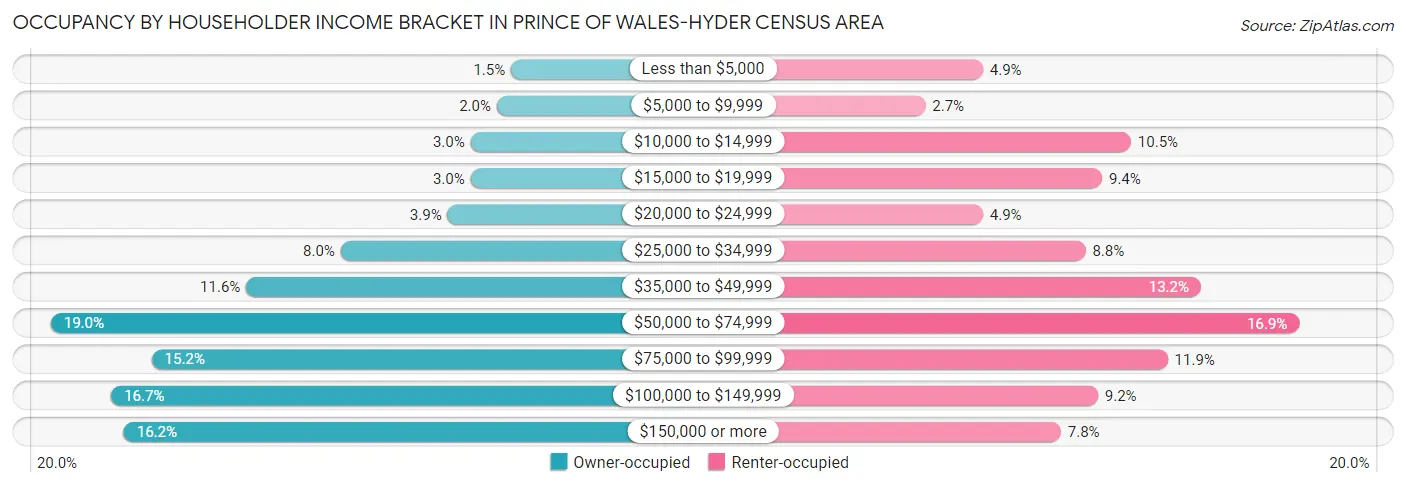
| Income Bracket | Owner-occupied | Renter-occupied |
| Less than $5,000 | 25 (1.5%) | 31 (4.9%) |
| $5,000 to $9,999 | 34 (2.0%) | 17 (2.7%) |
| $10,000 to $14,999 | 51 (3.0%) | 67 (10.5%) |
| $15,000 to $19,999 | 51 (3.0%) | 60 (9.4%) |
| $20,000 to $24,999 | 66 (3.9%) | 31 (4.9%) |
| $25,000 to $34,999 | 135 (8.0%) | 56 (8.8%) |
| $35,000 to $49,999 | 196 (11.6%) | 84 (13.2%) |
| $50,000 to $74,999 | 322 (19.0%) | 108 (16.9%) |
| $75,000 to $99,999 | 257 (15.2%) | 76 (11.9%) |
| $100,000 to $149,999 | 283 (16.7%) | 59 (9.2%) |
| $150,000 or more | 275 (16.2%) | 50 (7.8%) |
| Total | 1,695 (100.0%) | 639 (100.0%) |
Monthly Housing Cost Tiers in Prince of Wales-Hyder Census Area
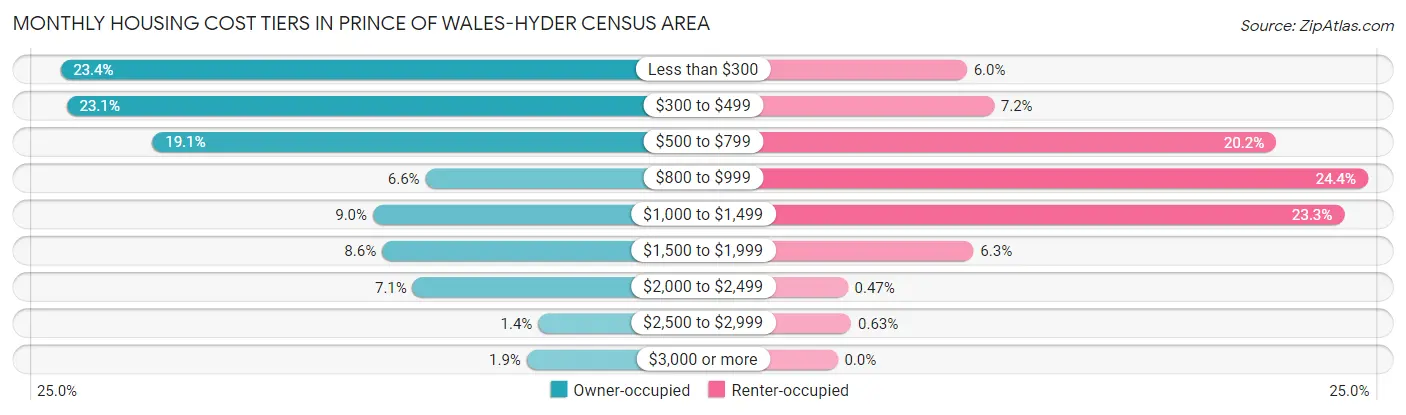
| Monthly Cost | Owner-occupied | Renter-occupied |
| Less than $300 | 396 (23.4%) | 38 (5.9%) |
| $300 to $499 | 391 (23.1%) | 46 (7.2%) |
| $500 to $799 | 324 (19.1%) | 129 (20.2%) |
| $800 to $999 | 111 (6.6%) | 156 (24.4%) |
| $1,000 to $1,499 | 152 (9.0%) | 149 (23.3%) |
| $1,500 to $1,999 | 145 (8.6%) | 40 (6.3%) |
| $2,000 to $2,499 | 121 (7.1%) | 3 (0.5%) |
| $2,500 to $2,999 | 23 (1.4%) | 4 (0.6%) |
| $3,000 or more | 32 (1.9%) | 0 (0.0%) |
| Total | 1,695 (100.0%) | 639 (100.0%) |
Physical Housing Characteristics in Prince of Wales-Hyder Census Area
Housing Structures in Prince of Wales-Hyder Census Area
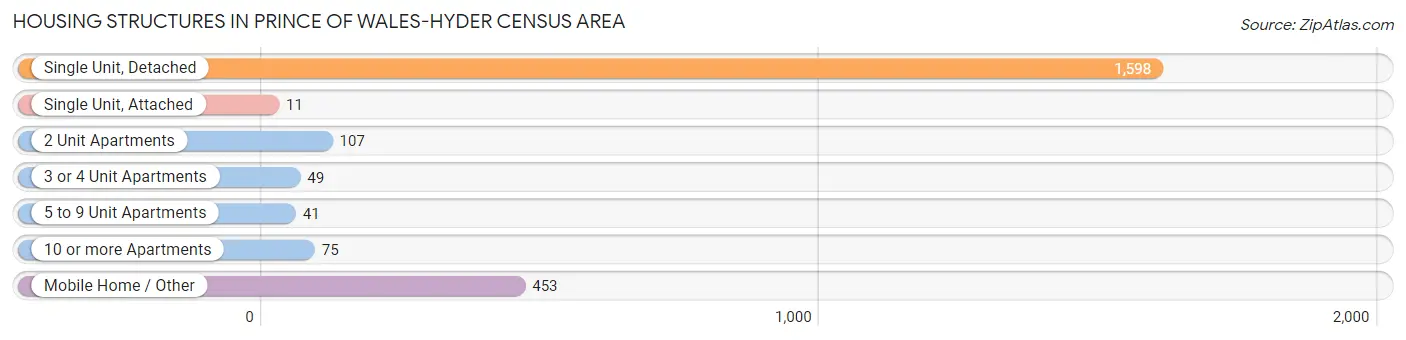
| Structure Type | # Housing Units | % Housing Units |
| Single Unit, Detached | 1,598 | 68.5% |
| Single Unit, Attached | 11 | 0.5% |
| 2 Unit Apartments | 107 | 4.6% |
| 3 or 4 Unit Apartments | 49 | 2.1% |
| 5 to 9 Unit Apartments | 41 | 1.8% |
| 10 or more Apartments | 75 | 3.2% |
| Mobile Home / Other | 453 | 19.4% |
| Total | 2,334 | 100.0% |
Housing Structures by Occupancy in Prince of Wales-Hyder Census Area
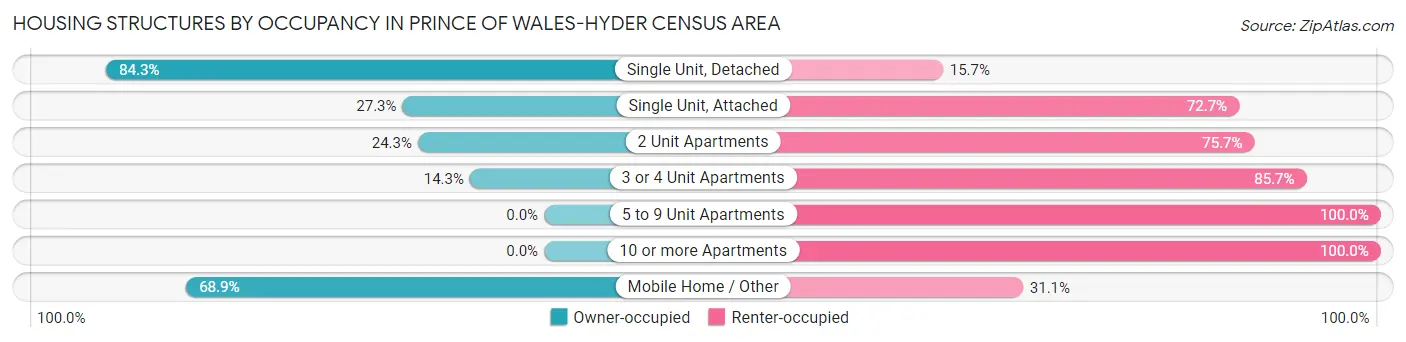
| Structure Type | Owner-occupied | Renter-occupied |
| Single Unit, Detached | 1,347 (84.3%) | 251 (15.7%) |
| Single Unit, Attached | 3 (27.3%) | 8 (72.7%) |
| 2 Unit Apartments | 26 (24.3%) | 81 (75.7%) |
| 3 or 4 Unit Apartments | 7 (14.3%) | 42 (85.7%) |
| 5 to 9 Unit Apartments | 0 (0.0%) | 41 (100.0%) |
| 10 or more Apartments | 0 (0.0%) | 75 (100.0%) |
| Mobile Home / Other | 312 (68.9%) | 141 (31.1%) |
| Total | 1,695 (72.6%) | 639 (27.4%) |
Housing Structures by Number of Rooms in Prince of Wales-Hyder Census Area
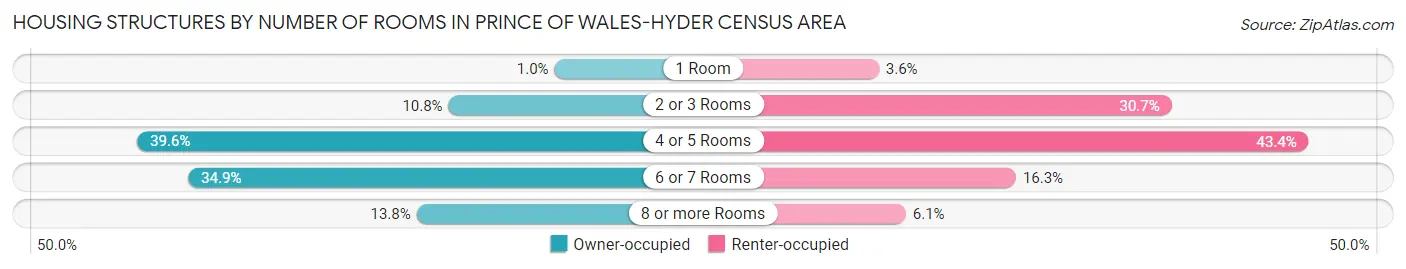
| Number of Rooms | Owner-occupied | Renter-occupied |
| 1 Room | 17 (1.0%) | 23 (3.6%) |
| 2 or 3 Rooms | 183 (10.8%) | 196 (30.7%) |
| 4 or 5 Rooms | 671 (39.6%) | 277 (43.3%) |
| 6 or 7 Rooms | 591 (34.9%) | 104 (16.3%) |
| 8 or more Rooms | 233 (13.8%) | 39 (6.1%) |
| Total | 1,695 (100.0%) | 639 (100.0%) |
Housing Structure by Heating Type in Prince of Wales-Hyder Census Area
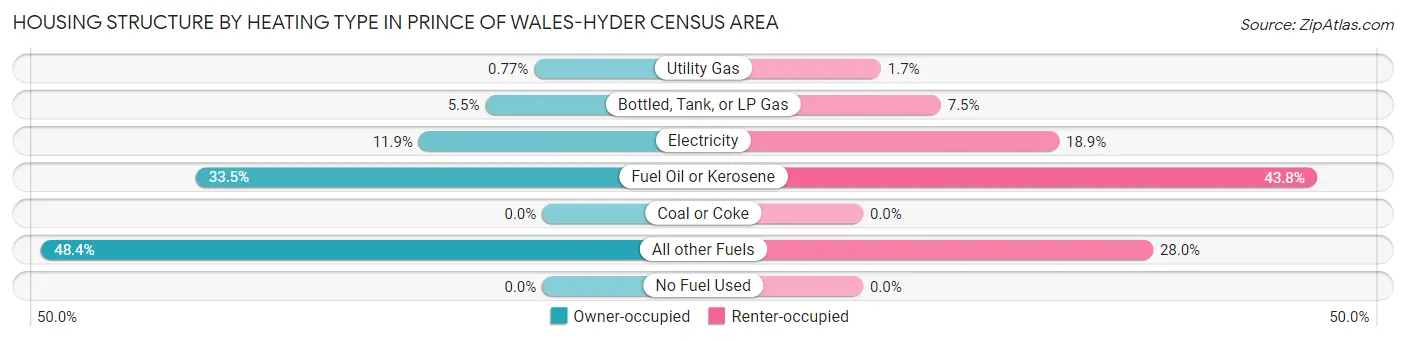
| Heating Type | Owner-occupied | Renter-occupied |
| Utility Gas | 13 (0.8%) | 11 (1.7%) |
| Bottled, Tank, or LP Gas | 93 (5.5%) | 48 (7.5%) |
| Electricity | 202 (11.9%) | 121 (18.9%) |
| Fuel Oil or Kerosene | 567 (33.5%) | 280 (43.8%) |
| Coal or Coke | 0 (0.0%) | 0 (0.0%) |
| All other Fuels | 820 (48.4%) | 179 (28.0%) |
| No Fuel Used | 0 (0.0%) | 0 (0.0%) |
| Total | 1,695 (100.0%) | 639 (100.0%) |
Household Vehicle Usage in Prince of Wales-Hyder Census Area
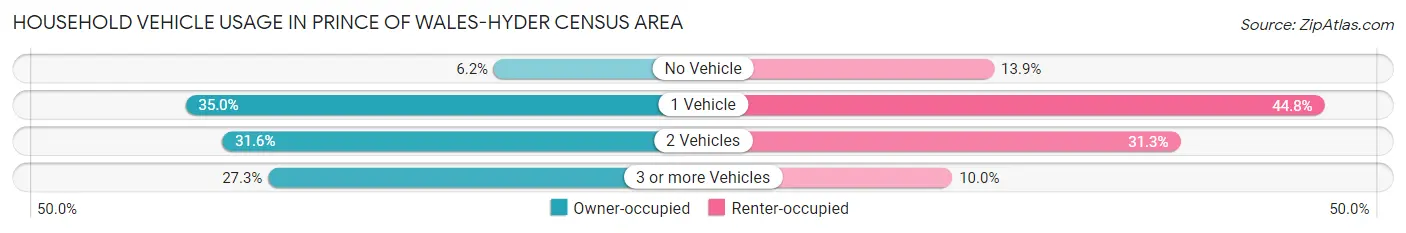
| Vehicles per Household | Owner-occupied | Renter-occupied |
| No Vehicle | 105 (6.2%) | 89 (13.9%) |
| 1 Vehicle | 593 (35.0%) | 286 (44.8%) |
| 2 Vehicles | 535 (31.6%) | 200 (31.3%) |
| 3 or more Vehicles | 462 (27.3%) | 64 (10.0%) |
| Total | 1,695 (100.0%) | 639 (100.0%) |
Real Estate & Mortgages in Prince of Wales-Hyder Census Area
Real Estate and Mortgage Overview in Prince of Wales-Hyder Census Area
| Characteristic | Without Mortgage | With Mortgage |
| Housing Units | 1,172 | 523 |
| Median Property Value | $185,800 | $304,200 |
| Median Household Income | $55,833 | $151 |
| Monthly Housing Costs | $384 | $32 |
| Real Estate Taxes | $199 | $378 |
Property Value by Mortgage Status in Prince of Wales-Hyder Census Area
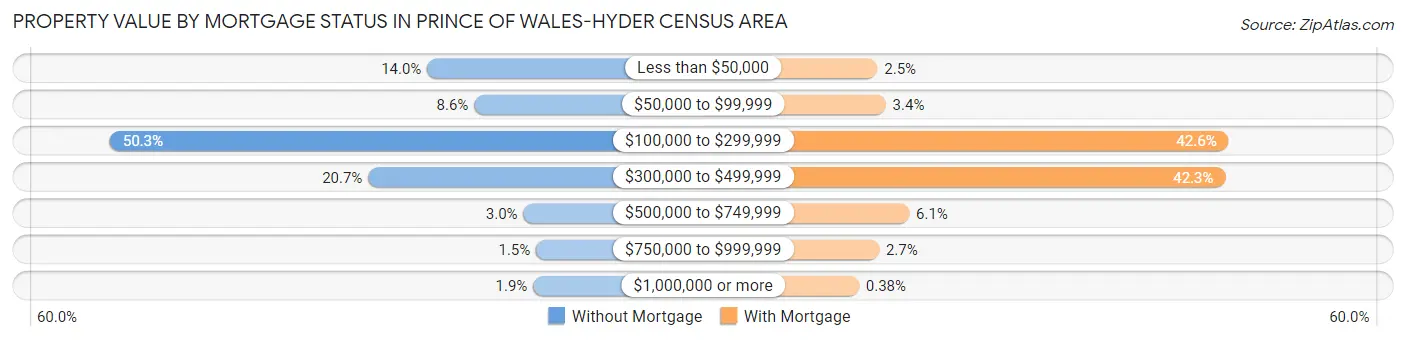
| Property Value | Without Mortgage | With Mortgage |
| Less than $50,000 | 164 (14.0%) | 13 (2.5%) |
| $50,000 to $99,999 | 101 (8.6%) | 18 (3.4%) |
| $100,000 to $299,999 | 589 (50.3%) | 223 (42.6%) |
| $300,000 to $499,999 | 243 (20.7%) | 221 (42.3%) |
| $500,000 to $749,999 | 35 (3.0%) | 32 (6.1%) |
| $750,000 to $999,999 | 18 (1.5%) | 14 (2.7%) |
| $1,000,000 or more | 22 (1.9%) | 2 (0.4%) |
| Total | 1,172 (100.0%) | 523 (100.0%) |
Household Income by Mortgage Status in Prince of Wales-Hyder Census Area
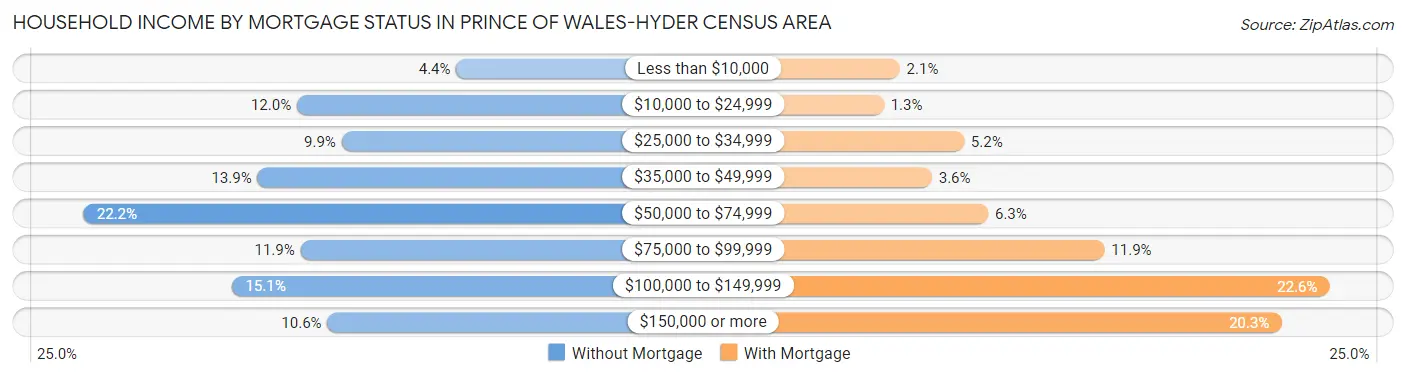
| Household Income | Without Mortgage | With Mortgage |
| Less than $10,000 | 52 (4.4%) | 11 (2.1%) |
| $10,000 to $24,999 | 141 (12.0%) | 7 (1.3%) |
| $25,000 to $34,999 | 116 (9.9%) | 27 (5.2%) |
| $35,000 to $49,999 | 163 (13.9%) | 19 (3.6%) |
| $50,000 to $74,999 | 260 (22.2%) | 33 (6.3%) |
| $75,000 to $99,999 | 139 (11.9%) | 62 (11.8%) |
| $100,000 to $149,999 | 177 (15.1%) | 118 (22.6%) |
| $150,000 or more | 124 (10.6%) | 106 (20.3%) |
| Total | 1,172 (100.0%) | 523 (100.0%) |
Property Value to Household Income Ratio in Prince of Wales-Hyder Census Area
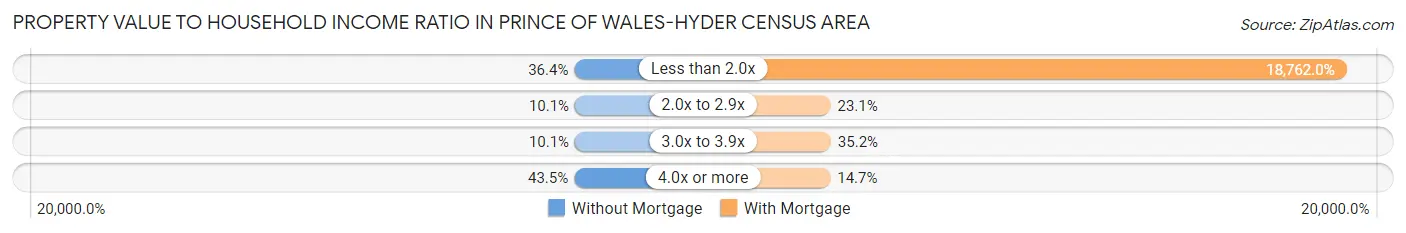
| Value-to-Income Ratio | Without Mortgage | With Mortgage |
| Less than 2.0x | 426 (36.3%) | 98,125 (18,761.9%) |
| 2.0x to 2.9x | 118 (10.1%) | 121 (23.1%) |
| 3.0x to 3.9x | 118 (10.1%) | 184 (35.2%) |
| 4.0x or more | 510 (43.5%) | 77 (14.7%) |
| Total | 1,172 (100.0%) | 523 (100.0%) |
Real Estate Taxes by Mortgage Status in Prince of Wales-Hyder Census Area
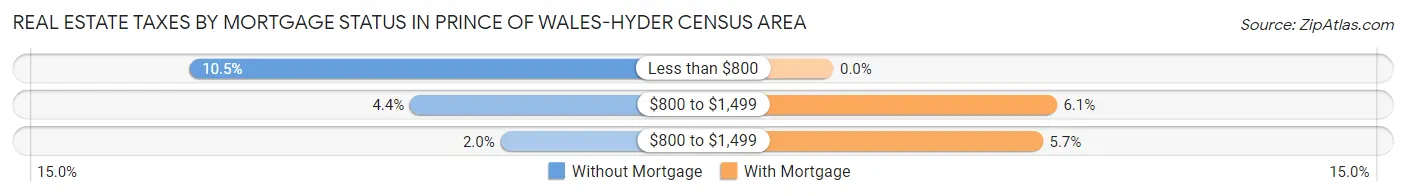
| Property Taxes | Without Mortgage | With Mortgage |
| Less than $800 | 123 (10.5%) | 0 (0.0%) |
| $800 to $1,499 | 52 (4.4%) | 32 (6.1%) |
| $800 to $1,499 | 23 (2.0%) | 30 (5.7%) |
| Total | 1,172 (100.0%) | 523 (100.0%) |
Health & Disability in Prince of Wales-Hyder Census Area
Health Insurance Coverage by Age in Prince of Wales-Hyder Census Area
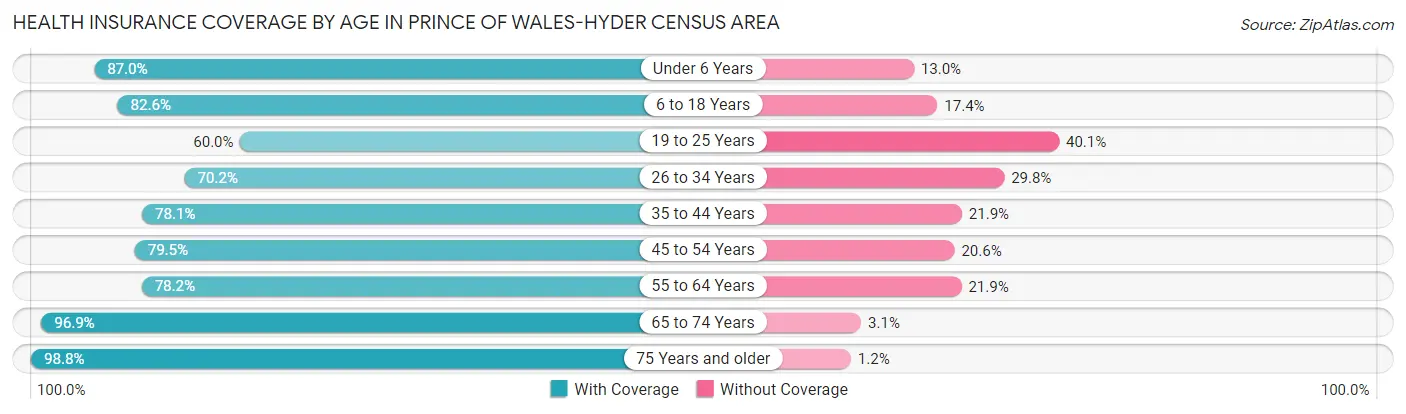
| Age Bracket | With Coverage | Without Coverage |
| Under 6 Years | 335 (87.0%) | 50 (13.0%) |
| 6 to 18 Years | 752 (82.6%) | 158 (17.4%) |
| 19 to 25 Years | 259 (60.0%) | 173 (40.1%) |
| 26 to 34 Years | 433 (70.2%) | 184 (29.8%) |
| 35 to 44 Years | 502 (78.1%) | 141 (21.9%) |
| 45 to 54 Years | 576 (79.4%) | 149 (20.5%) |
| 55 to 64 Years | 751 (78.1%) | 210 (21.8%) |
| 65 to 74 Years | 771 (96.9%) | 25 (3.1%) |
| 75 Years and older | 320 (98.8%) | 4 (1.2%) |
| Total | 4,699 (81.1%) | 1,094 (18.9%) |
Health Insurance Coverage by Citizenship Status in Prince of Wales-Hyder Census Area
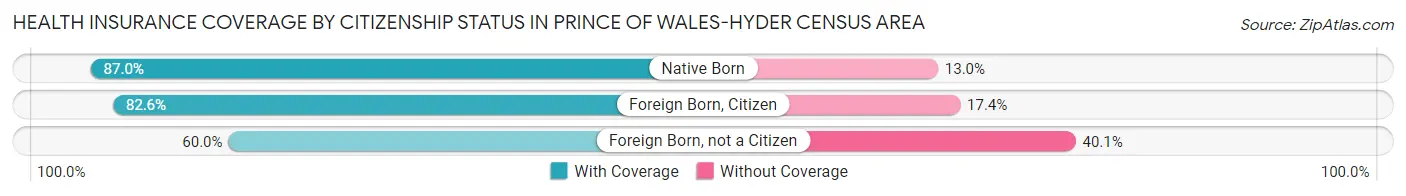
| Citizenship Status | With Coverage | Without Coverage |
| Native Born | 335 (87.0%) | 50 (13.0%) |
| Foreign Born, Citizen | 752 (82.6%) | 158 (17.4%) |
| Foreign Born, not a Citizen | 259 (60.0%) | 173 (40.1%) |
Health Insurance Coverage by Household Income in Prince of Wales-Hyder Census Area
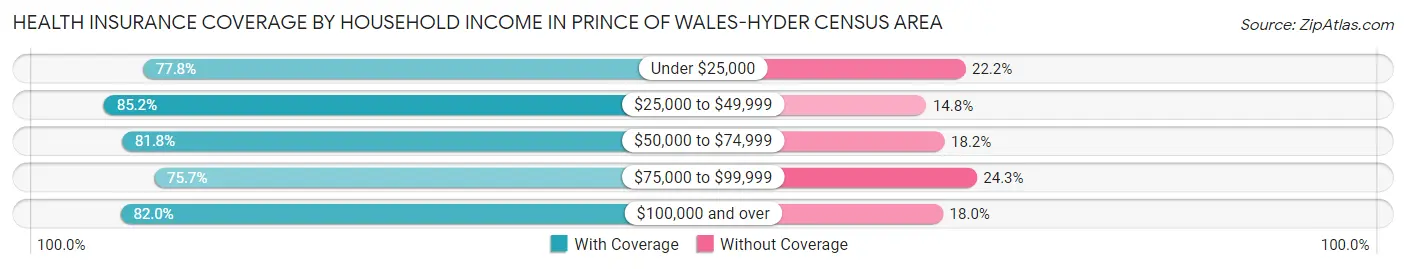
| Household Income | With Coverage | Without Coverage |
| Under $25,000 | 562 (77.8%) | 160 (22.2%) |
| $25,000 to $49,999 | 872 (85.2%) | 152 (14.8%) |
| $50,000 to $74,999 | 830 (81.8%) | 185 (18.2%) |
| $75,000 to $99,999 | 777 (75.7%) | 249 (24.3%) |
| $100,000 and over | 1,553 (82.0%) | 340 (18.0%) |
Public vs Private Health Insurance Coverage by Age in Prince of Wales-Hyder Census Area
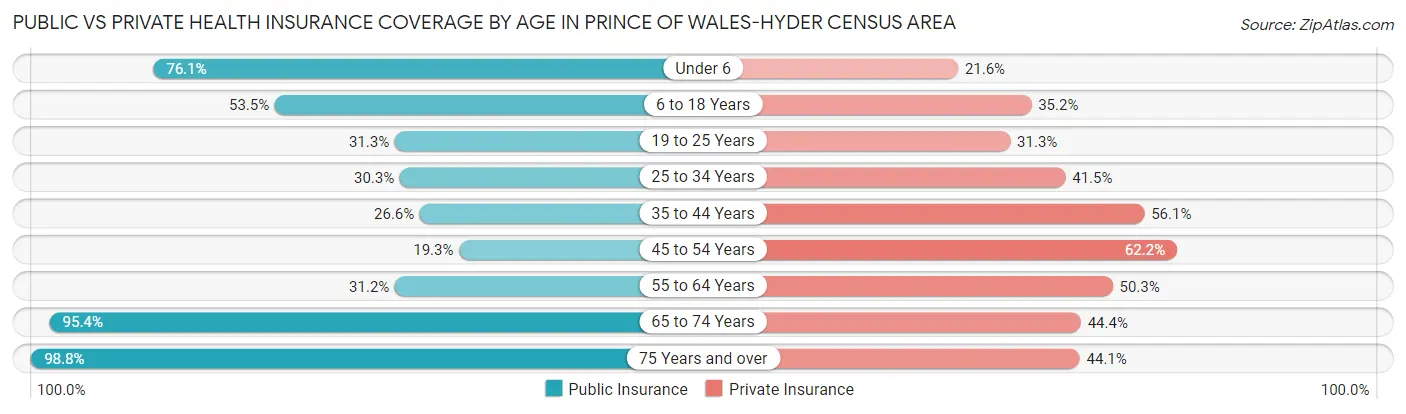
| Age Bracket | Public Insurance | Private Insurance |
| Under 6 | 293 (76.1%) | 83 (21.6%) |
| 6 to 18 Years | 487 (53.5%) | 320 (35.2%) |
| 19 to 25 Years | 135 (31.2%) | 135 (31.2%) |
| 25 to 34 Years | 187 (30.3%) | 256 (41.5%) |
| 35 to 44 Years | 171 (26.6%) | 361 (56.1%) |
| 45 to 54 Years | 140 (19.3%) | 451 (62.2%) |
| 55 to 64 Years | 300 (31.2%) | 483 (50.3%) |
| 65 to 74 Years | 759 (95.4%) | 353 (44.4%) |
| 75 Years and over | 320 (98.8%) | 143 (44.1%) |
| Total | 2,792 (48.2%) | 2,585 (44.6%) |
Disability Status by Sex by Age in Prince of Wales-Hyder Census Area
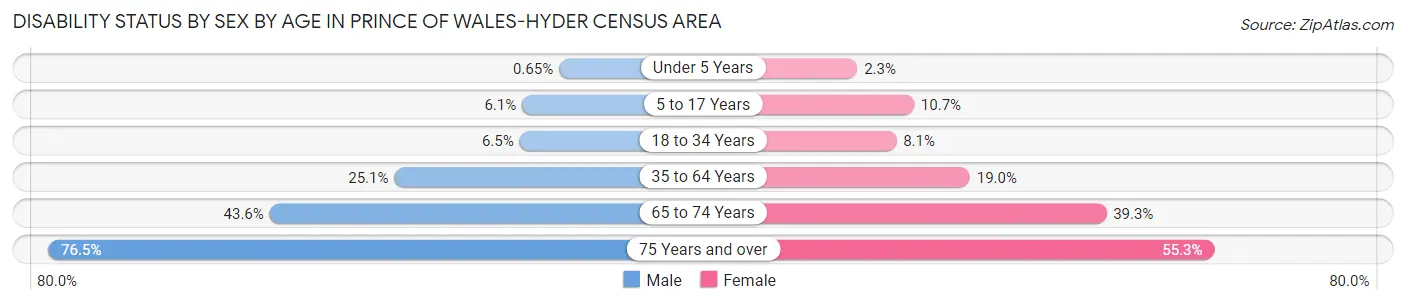
| Age Bracket | Male | Female |
| Under 5 Years | 1 (0.6%) | 3 (2.3%) |
| 5 to 17 Years | 33 (6.1%) | 45 (10.7%) |
| 18 to 34 Years | 37 (6.5%) | 43 (8.1%) |
| 35 to 64 Years | 327 (25.1%) | 195 (19.0%) |
| 65 to 74 Years | 205 (43.6%) | 128 (39.3%) |
| 75 Years and over | 140 (76.5%) | 78 (55.3%) |
Disability Class by Sex by Age in Prince of Wales-Hyder Census Area
Disability Class: Hearing Difficulty
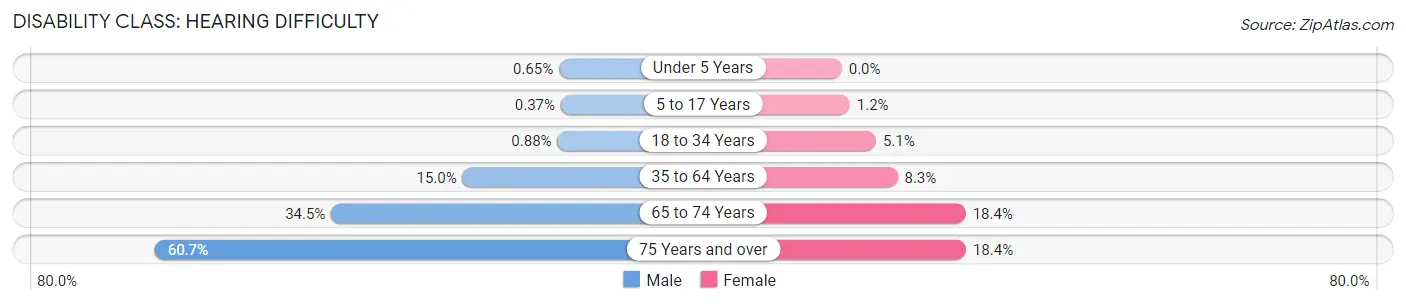
| Age Bracket | Male | Female |
| Under 5 Years | 1 (0.6%) | 0 (0.0%) |
| 5 to 17 Years | 2 (0.4%) | 5 (1.2%) |
| 18 to 34 Years | 5 (0.9%) | 27 (5.1%) |
| 35 to 64 Years | 195 (15.0%) | 85 (8.3%) |
| 65 to 74 Years | 162 (34.5%) | 60 (18.4%) |
| 75 Years and over | 111 (60.7%) | 26 (18.4%) |
Disability Class: Vision Difficulty
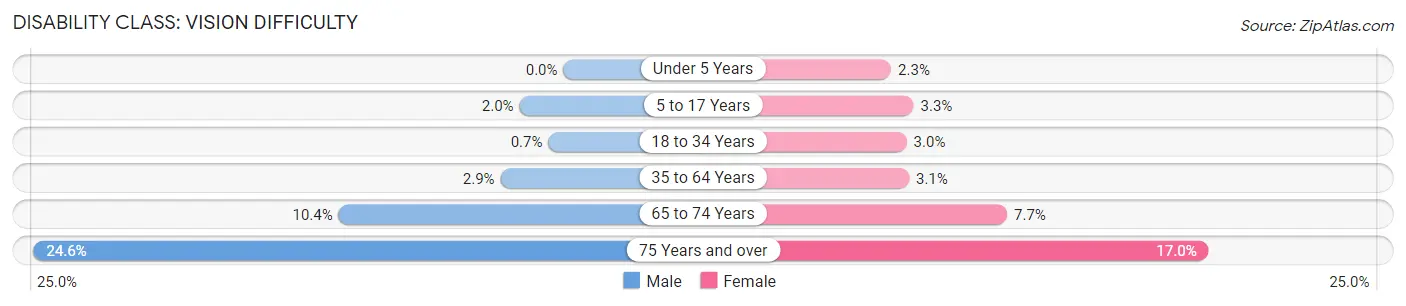
| Age Bracket | Male | Female |
| Under 5 Years | 0 (0.0%) | 3 (2.3%) |
| 5 to 17 Years | 11 (2.0%) | 14 (3.3%) |
| 18 to 34 Years | 4 (0.7%) | 16 (3.0%) |
| 35 to 64 Years | 38 (2.9%) | 32 (3.1%) |
| 65 to 74 Years | 49 (10.4%) | 25 (7.7%) |
| 75 Years and over | 45 (24.6%) | 24 (17.0%) |
Disability Class: Cognitive Difficulty
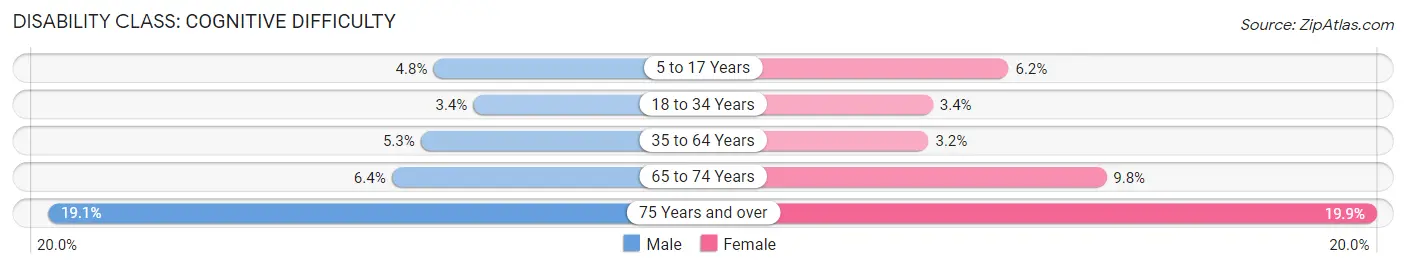
| Age Bracket | Male | Female |
| 5 to 17 Years | 26 (4.8%) | 26 (6.2%) |
| 18 to 34 Years | 19 (3.4%) | 18 (3.4%) |
| 35 to 64 Years | 69 (5.3%) | 33 (3.2%) |
| 65 to 74 Years | 30 (6.4%) | 32 (9.8%) |
| 75 Years and over | 35 (19.1%) | 28 (19.9%) |
Disability Class: Ambulatory Difficulty
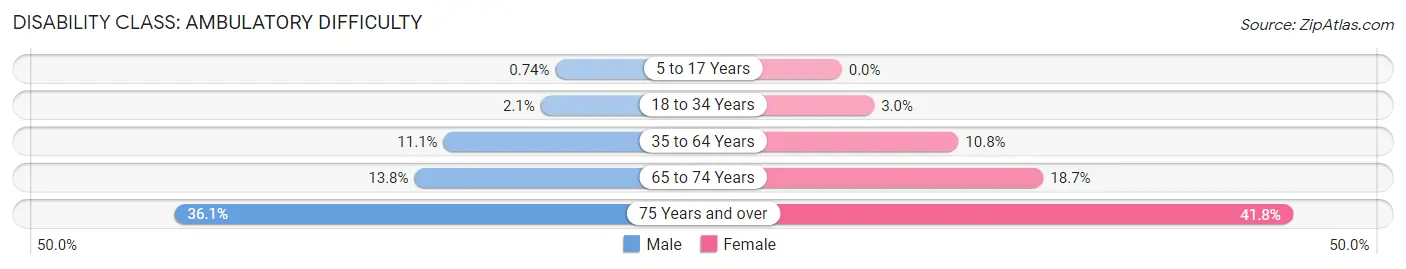
| Age Bracket | Male | Female |
| 5 to 17 Years | 4 (0.7%) | 0 (0.0%) |
| 18 to 34 Years | 12 (2.1%) | 16 (3.0%) |
| 35 to 64 Years | 145 (11.1%) | 111 (10.8%) |
| 65 to 74 Years | 65 (13.8%) | 61 (18.7%) |
| 75 Years and over | 66 (36.1%) | 59 (41.8%) |
Disability Class: Self-Care Difficulty
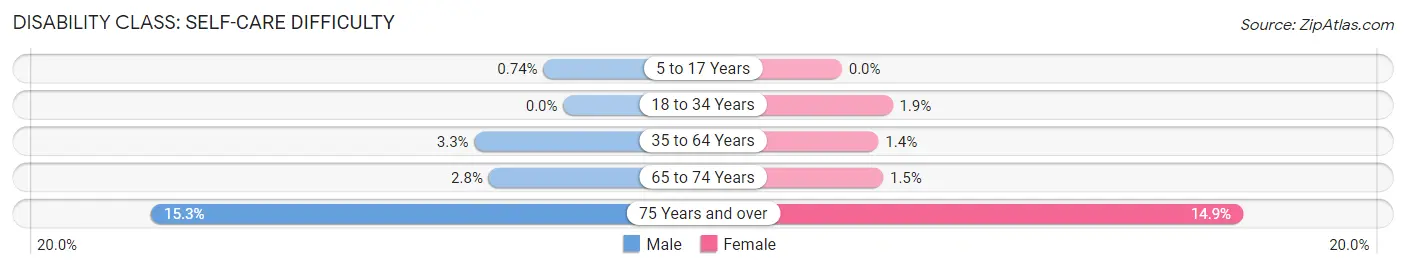
| Age Bracket | Male | Female |
| 5 to 17 Years | 4 (0.7%) | 0 (0.0%) |
| 18 to 34 Years | 0 (0.0%) | 10 (1.9%) |
| 35 to 64 Years | 43 (3.3%) | 14 (1.4%) |
| 65 to 74 Years | 13 (2.8%) | 5 (1.5%) |
| 75 Years and over | 28 (15.3%) | 21 (14.9%) |
Technology Access in Prince of Wales-Hyder Census Area
Computing Device Access in Prince of Wales-Hyder Census Area
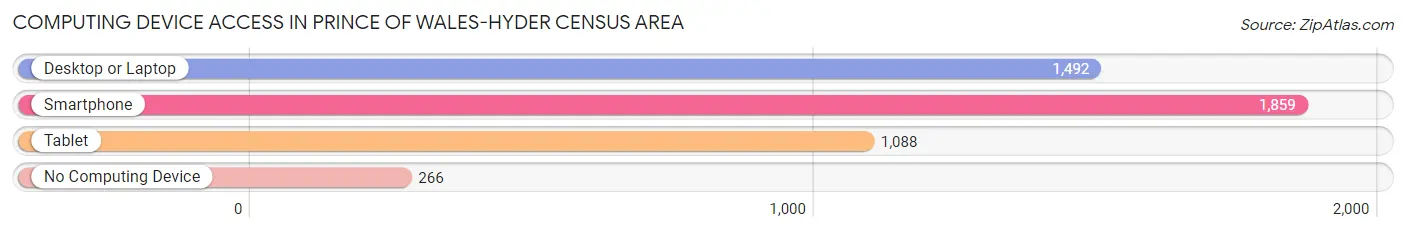
| Device Type | # Households | % Households |
| Desktop or Laptop | 1,492 | 63.9% |
| Smartphone | 1,859 | 79.6% |
| Tablet | 1,088 | 46.6% |
| No Computing Device | 266 | 11.4% |
| Total | 2,334 | 100.0% |
Internet Access in Prince of Wales-Hyder Census Area
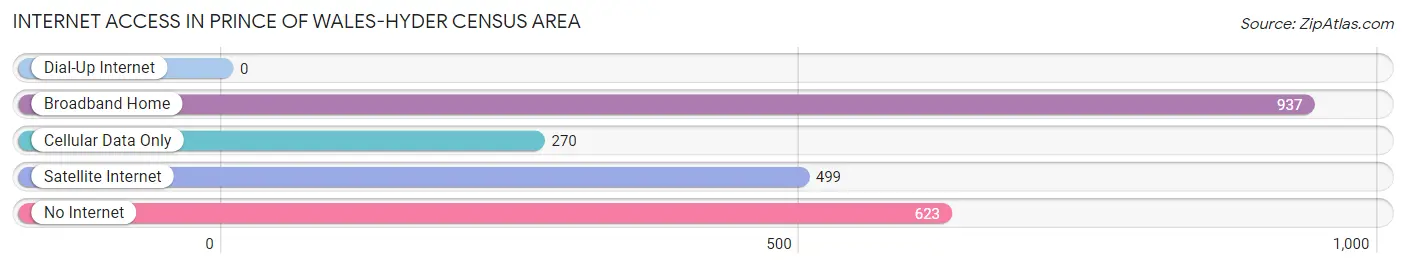
| Internet Type | # Households | % Households |
| Dial-Up Internet | 0 | 0.0% |
| Broadband Home | 937 | 40.2% |
| Cellular Data Only | 270 | 11.6% |
| Satellite Internet | 499 | 21.4% |
| No Internet | 623 | 26.7% |
| Total | 2,334 | 100.0% |
Prince of Wales-Hyder Census Area Summary
The Prince of Wales-Hyder Census Area is located in the southeastern corner of Alaska, and is part of the Alaska Panhandle. It is bordered by the Pacific Ocean to the south, the Gulf of Alaska to the west, and the Canadian province of British Columbia to the east. The area is home to a variety of wildlife, including bald eagles, black bears, and humpback whales. The area is also home to a number of Native American tribes, including the Tlingit, Haida, and Tsimshian.
History
The Prince of Wales-Hyder Census Area was first inhabited by the Tlingit people, who have lived in the area for thousands of years. The area was explored by Europeans in the late 1700s, and was eventually claimed by the United States in 1867. The area was named after the Prince of Wales, who visited the area in 1920.
The area was initially part of the Alaska Territory, and was later incorporated into the state of Alaska in 1959. The area was officially designated as the Prince of Wales-Hyder Census Area in 1980.
Geography
The Prince of Wales-Hyder Census Area covers an area of approximately 10,000 square miles, making it the largest census area in Alaska. The area is located in the southeastern corner of the state, and is bordered by the Pacific Ocean to the south, the Gulf of Alaska to the west, and the Canadian province of British Columbia to the east.
The area is mostly mountainous, with the highest point being Mount Fairweather at 15,325 feet. The area is also home to a number of glaciers, including the Hubbard Glacier, which is the largest tidewater glacier in North America.
The area is home to a variety of wildlife, including bald eagles, black bears, and humpback whales. The area is also home to a number of Native American tribes, including the Tlingit, Haida, and Tsimshian.
Economy
The economy of the Prince of Wales-Hyder Census Area is largely based on fishing, logging, and tourism. The area is home to a number of commercial fishing operations, and is also home to a number of logging companies. Tourism is also an important part of the economy, with visitors coming to the area to take advantage of the area’s natural beauty and wildlife.
Demographics
As of the 2010 census, the population of the Prince of Wales-Hyder Census Area was 7,059. The population is largely Native American, with the Tlingit, Haida, and Tsimshian tribes making up the majority of the population. The area also has a small non-Native American population, with the majority of the population being of European descent. The area also has a small Asian population, with the majority of the population being of Filipino descent.
Common Questions
What is the Total Population of Prince of Wales-Hyder Census Area?
Total Population of Prince of Wales-Hyder Census Area is 5,799.
What is the Total Male Population of Prince of Wales-Hyder Census Area?
Total Male Population of Prince of Wales-Hyder Census Area is 3,223.
What is the Total Female Population of Prince of Wales-Hyder Census Area?
Total Female Population of Prince of Wales-Hyder Census Area is 2,576.
What is the Ratio of Males per 100 Females in Prince of Wales-Hyder Census Area?
There are 125.12 Males per 100 Females in Prince of Wales-Hyder Census Area.
What is the Ratio of Females per 100 Males in Prince of Wales-Hyder Census Area?
There are 79.93 Females per 100 Males in Prince of Wales-Hyder Census Area.
What is the Median Population Age in Prince of Wales-Hyder Census Area?
Median Population Age in Prince of Wales-Hyder Census Area is 43.1 Years.
What is the Average Family Size in Prince of Wales-Hyder Census Area
Average Family Size in Prince of Wales-Hyder Census Area is 3.0 People.
What is the Average Household Size in Prince of Wales-Hyder Census Area
Average Household Size in Prince of Wales-Hyder Census Area is 2.4 People.
What is Per Capita Income in Prince of Wales-Hyder Census Area?
Per Capita income in Prince of Wales-Hyder Census Area is $34,433.
What is the Median Family Income in Prince of Wales-Hyder Census Area?
Median Family Income in Prince of Wales-Hyder Census Area is $77,548.
What is the Median Household income in Prince of Wales-Hyder Census Area?
Median Household Income in Prince of Wales-Hyder Census Area is $61,779.
What is Income or Wage Gap in Prince of Wales-Hyder Census Area?
Income or Wage Gap in Prince of Wales-Hyder Census Area is 12.1%.
Women in Prince of Wales-Hyder Census Area earn 87.9 cents for every dollar earned by a man.
What is Family Income Deficit in Prince of Wales-Hyder Census Area?
Family Income Deficit in Prince of Wales-Hyder Census Area is $10,027.
Families that are below poverty line in Prince of Wales-Hyder Census Area earn $10,027 less on average than the poverty threshold level.
What is Inequality or Gini Index in Prince of Wales-Hyder Census Area?
Inequality or Gini Index in Prince of Wales-Hyder Census Area is 0.42.
How Large is the Labor Force in Prince of Wales-Hyder Census Area?
There are 2,969 People in the Labor Forcein in Prince of Wales-Hyder Census Area.
What is the Percentage of People in the Labor Force in Prince of Wales-Hyder Census Area?
63.0% of People are in the Labor Force in Prince of Wales-Hyder Census Area.
What is the Unemployment Rate in Prince of Wales-Hyder Census Area?
Unemployment Rate in Prince of Wales-Hyder Census Area is 7.5%.