Northwest Arctic Borough, AK
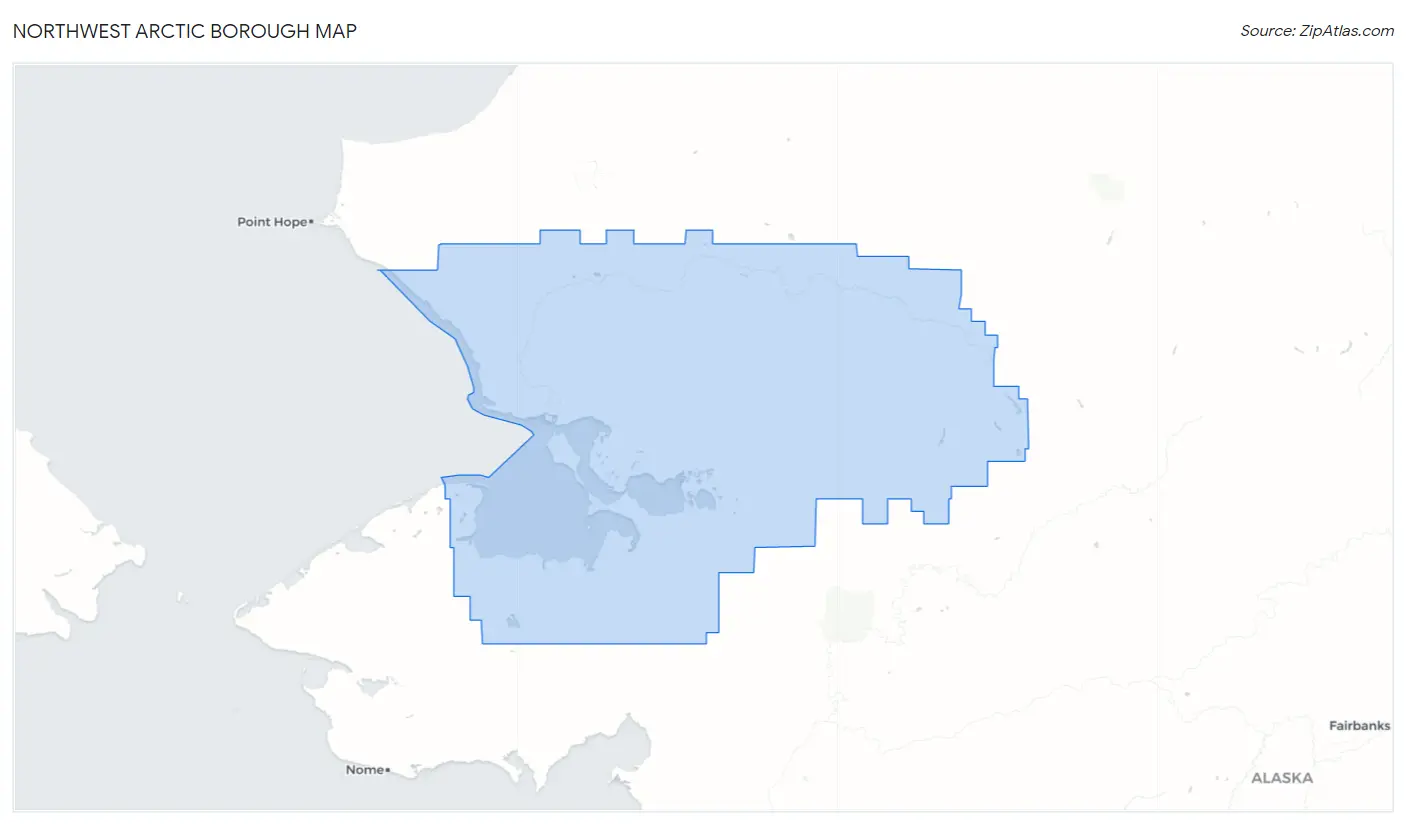
Northwest Arctic Borough Map
Northwest Arctic Borough Overview
7,682
TOTAL POPULATION
4,105
MALE POPULATION
3,577
FEMALE POPULATION
114.76
MALES / 100 FEMALES
87.14
FEMALES / 100 MALES
29.2
MEDIAN AGE
4.7
AVG FAMILY SIZE
4.0
AVG HOUSEHOLD SIZE
$32,133
PER CAPITA INCOME
$77,546
AVG FAMILY INCOME
$77,647
AVG HOUSEHOLD INCOME
11.2%
WAGE / INCOME GAP [ % ]
88.8¢/ $1
WAGE / INCOME GAP [ $ ]
$13,991
FAMILY INCOME DEFICIT
0.42
INEQUALITY / GINI INDEX
3,115
LABOR FORCE [ PEOPLE ]
60.2%
PERCENT IN LABOR FORCE
15.5%
UNEMPLOYMENT RATE
Northwest Arctic Borough Area Codes
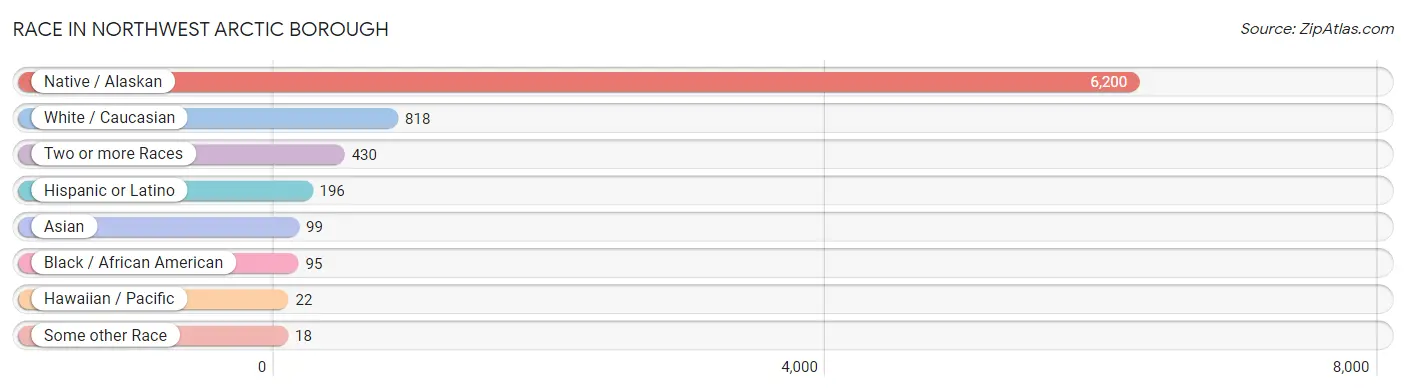
Race in Northwest Arctic Borough
The most populous races in Northwest Arctic Borough are Native / Alaskan (6,200 | 80.7%), White / Caucasian (818 | 10.6%), and Two or more Races (430 | 5.6%).
| Race | # Population | % Population |
| Asian | 99 | 1.3% |
| Black / African American | 95 | 1.2% |
| Hawaiian / Pacific | 22 | 0.3% |
| Hispanic or Latino | 196 | 2.5% |
| Native / Alaskan | 6,200 | 80.7% |
| White / Caucasian | 818 | 10.6% |
| Two or more Races | 430 | 5.6% |
| Some other Race | 18 | 0.2% |
| Total | 7,682 | 100.0% |
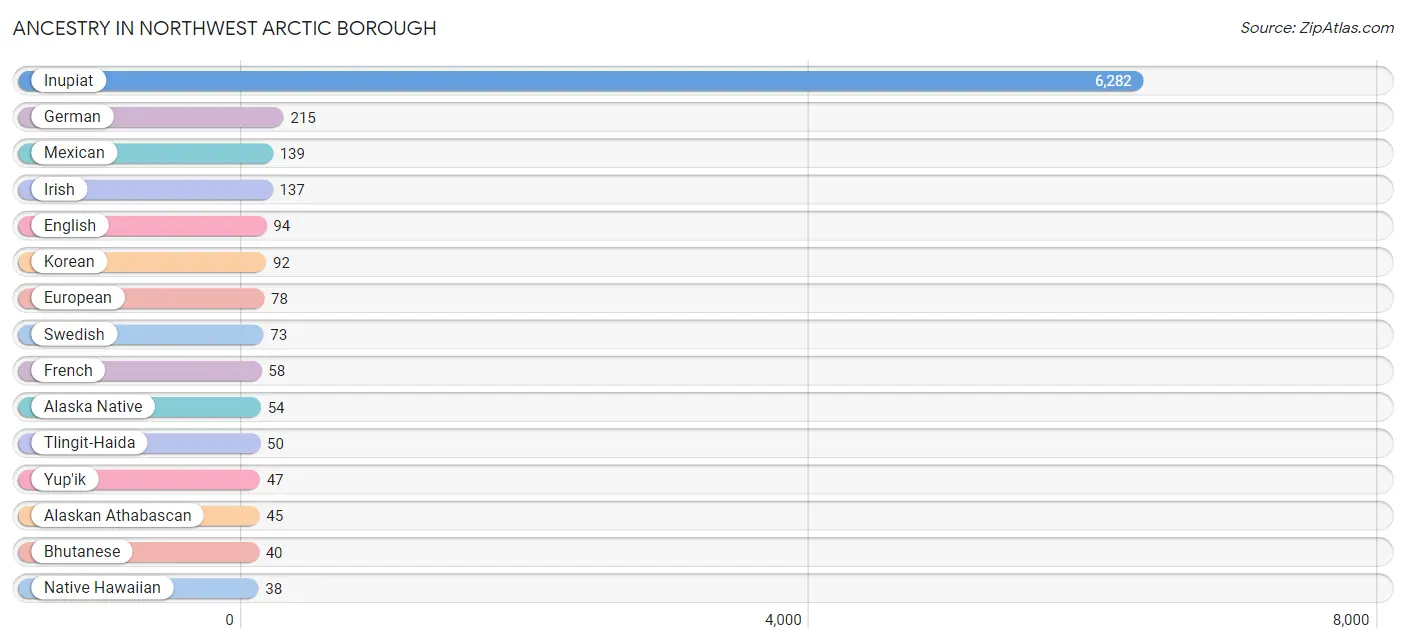
Ancestry in Northwest Arctic Borough
The most populous ancestries reported in Northwest Arctic Borough are Inupiat (6,282 | 81.8%), German (215 | 2.8%), Mexican (139 | 1.8%), Irish (137 | 1.8%), and English (94 | 1.2%), together accounting for 89.4% of all Northwest Arctic Borough residents.
| Ancestry | # Population | % Population |
| Alaska Native | 54 | 0.7% |
| Alaskan Athabascan | 45 | 0.6% |
| Aleut | 9 | 0.1% |
| American | 7 | 0.1% |
| Austrian | 6 | 0.1% |
| Bhutanese | 40 | 0.5% |
| Blackfeet | 7 | 0.1% |
| British | 3 | 0.0% |
| Burmese | 18 | 0.2% |
| Canadian | 1 | 0.0% |
| Central American | 9 | 0.1% |
| Central American Indian | 6 | 0.1% |
| Cherokee | 7 | 0.1% |
| Cheyenne | 5 | 0.1% |
| Cuban | 7 | 0.1% |
| Czech | 3 | 0.0% |
| Danish | 15 | 0.2% |
| Dutch | 13 | 0.2% |
| Eastern European | 1 | 0.0% |
| English | 94 | 1.2% |
| Ethiopian | 3 | 0.0% |
| European | 78 | 1.0% |
| French | 58 | 0.8% |
| German | 215 | 2.8% |
| Hungarian | 4 | 0.1% |
| Indian (Asian) | 1 | 0.0% |
| Inupiat | 6,282 | 81.8% |
| Irish | 137 | 1.8% |
| Italian | 16 | 0.2% |
| Jamaican | 22 | 0.3% |
| Korean | 92 | 1.2% |
| Mexican | 139 | 1.8% |
| Native Hawaiian | 38 | 0.5% |
| Navajo | 3 | 0.0% |
| New Zealander | 6 | 0.1% |
| Norwegian | 20 | 0.3% |
| Pakistani | 11 | 0.1% |
| Panamanian | 7 | 0.1% |
| Polish | 36 | 0.5% |
| Portuguese | 19 | 0.3% |
| Puerto Rican | 29 | 0.4% |
| Russian | 7 | 0.1% |
| Salvadoran | 2 | 0.0% |
| Samoan | 8 | 0.1% |
| Scandinavian | 4 | 0.1% |
| Scotch-Irish | 20 | 0.3% |
| Scottish | 9 | 0.1% |
| Spaniard | 10 | 0.1% |
| Spanish | 1 | 0.0% |
| Sri Lankan | 6 | 0.1% |
| Subsaharan African | 3 | 0.0% |
| Swedish | 73 | 0.9% |
| Swiss | 6 | 0.1% |
| Tlingit-Haida | 50 | 0.6% |
| Ukrainian | 7 | 0.1% |
| Welsh | 4 | 0.1% |
| West Indian | 6 | 0.1% |
| Yugoslavian | 8 | 0.1% |
| Yuman | 36 | 0.5% |
| Yup'ik | 47 | 0.6% | View All 60 Rows |
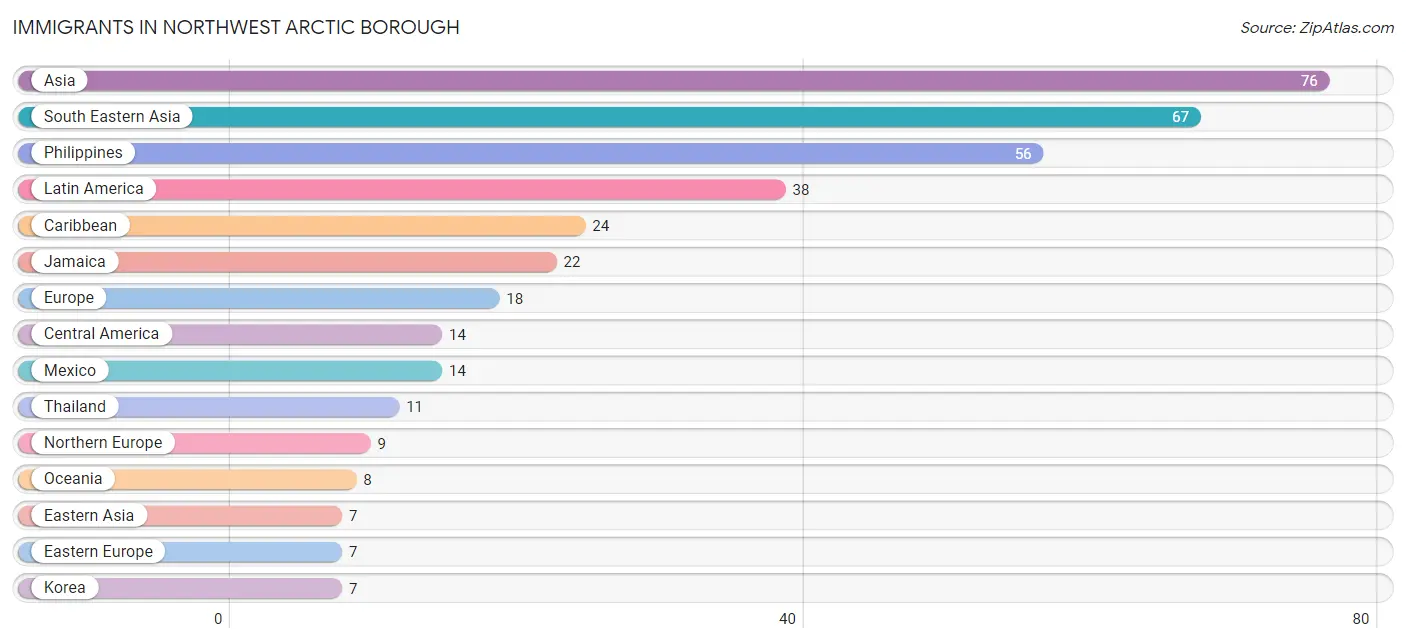
Immigrants in Northwest Arctic Borough
The most numerous immigrant groups reported in Northwest Arctic Borough came from Asia (76 | 1.0%), South Eastern Asia (67 | 0.9%), Philippines (56 | 0.7%), Latin America (38 | 0.5%), and Caribbean (24 | 0.3%), together accounting for 3.4% of all Northwest Arctic Borough residents.
| Immigration Origin | # Population | % Population |
| Asia | 76 | 1.0% |
| Canada | 3 | 0.0% |
| Caribbean | 24 | 0.3% |
| Central America | 14 | 0.2% |
| Cuba | 2 | 0.0% |
| Eastern Asia | 7 | 0.1% |
| Eastern Europe | 7 | 0.1% |
| Europe | 18 | 0.2% |
| Germany | 2 | 0.0% |
| Iran | 2 | 0.0% |
| Ireland | 4 | 0.1% |
| Jamaica | 22 | 0.3% |
| Korea | 7 | 0.1% |
| Latin America | 38 | 0.5% |
| Mexico | 14 | 0.2% |
| Northern Europe | 9 | 0.1% |
| Oceania | 8 | 0.1% |
| Philippines | 56 | 0.7% |
| Russia | 7 | 0.1% |
| South Central Asia | 2 | 0.0% |
| South Eastern Asia | 67 | 0.9% |
| Sweden | 5 | 0.1% |
| Thailand | 11 | 0.1% |
| Western Europe | 2 | 0.0% | View All 24 Rows |
Sex and Age in Northwest Arctic Borough
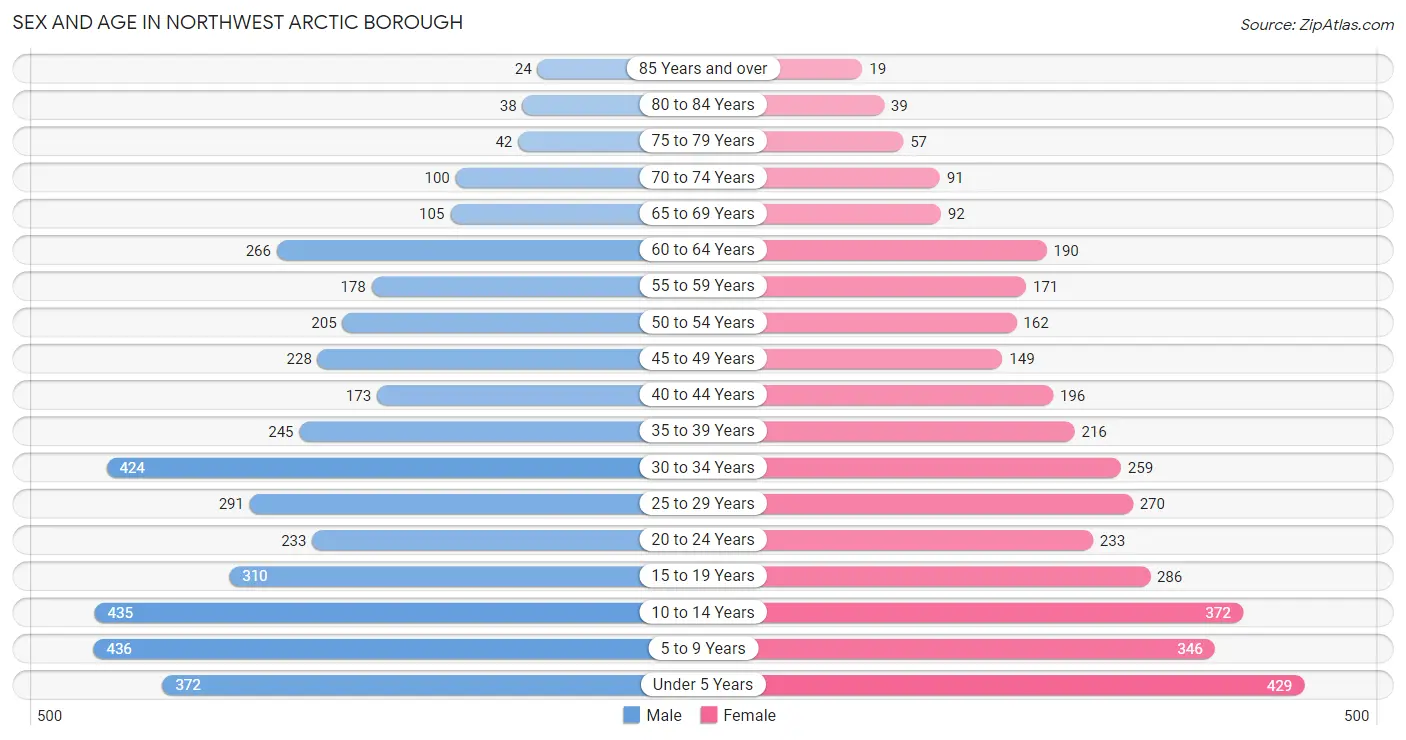
Sex and Age in Northwest Arctic Borough
The most populous age groups in Northwest Arctic Borough are 5 to 9 Years (436 | 10.6%) for men and Under 5 Years (429 | 12.0%) for women.
| Age Bracket | Male | Female |
| Under 5 Years | 372 (9.1%) | 429 (12.0%) |
| 5 to 9 Years | 436 (10.6%) | 346 (9.7%) |
| 10 to 14 Years | 435 (10.6%) | 372 (10.4%) |
| 15 to 19 Years | 310 (7.5%) | 286 (8.0%) |
| 20 to 24 Years | 233 (5.7%) | 233 (6.5%) |
| 25 to 29 Years | 291 (7.1%) | 270 (7.5%) |
| 30 to 34 Years | 424 (10.3%) | 259 (7.2%) |
| 35 to 39 Years | 245 (6.0%) | 216 (6.0%) |
| 40 to 44 Years | 173 (4.2%) | 196 (5.5%) |
| 45 to 49 Years | 228 (5.6%) | 149 (4.2%) |
| 50 to 54 Years | 205 (5.0%) | 162 (4.5%) |
| 55 to 59 Years | 178 (4.3%) | 171 (4.8%) |
| 60 to 64 Years | 266 (6.5%) | 190 (5.3%) |
| 65 to 69 Years | 105 (2.6%) | 92 (2.6%) |
| 70 to 74 Years | 100 (2.4%) | 91 (2.5%) |
| 75 to 79 Years | 42 (1.0%) | 57 (1.6%) |
| 80 to 84 Years | 38 (0.9%) | 39 (1.1%) |
| 85 Years and over | 24 (0.6%) | 19 (0.5%) |
| Total | 4,105 (100.0%) | 3,577 (100.0%) |
Families and Households in Northwest Arctic Borough
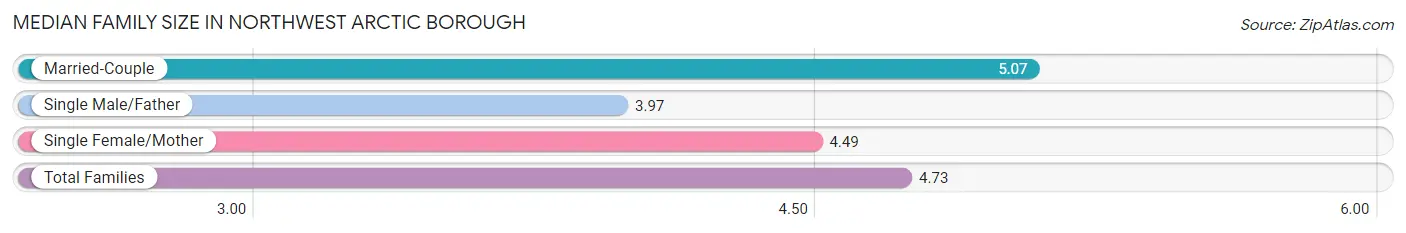
Median Family Size in Northwest Arctic Borough
The median family size in Northwest Arctic Borough is 4.73 persons per family, with married-couple families (730 | 55.0%) accounting for the largest median family size of 5.07 persons per family. On the other hand, single male/father families (198 | 14.9%) represent the smallest median family size with 3.97 persons per family.
| Family Type | # Families | Family Size |
| Married-Couple | 730 (55.0%) | 5.07 |
| Single Male/Father | 198 (14.9%) | 3.97 |
| Single Female/Mother | 399 (30.1%) | 4.49 |
| Total Families | 1,327 (100.0%) | 4.73 |
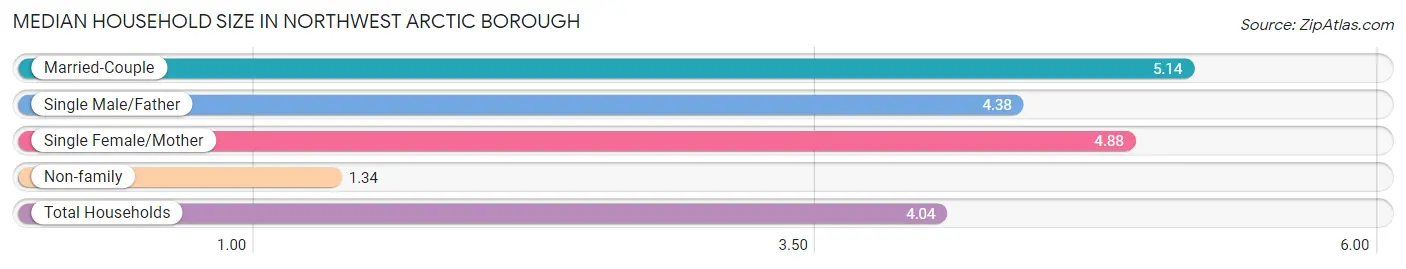
Median Household Size in Northwest Arctic Borough
The median household size in Northwest Arctic Borough is 4.04 persons per household, with married-couple households (730 | 41.1%) accounting for the largest median household size of 5.14 persons per household. non-family households (449 | 25.3%) represent the smallest median household size with 1.34 persons per household.
| Household Type | # Households | Household Size |
| Married-Couple | 730 (41.1%) | 5.14 |
| Single Male/Father | 198 (11.2%) | 4.38 |
| Single Female/Mother | 399 (22.5%) | 4.88 |
| Non-family | 449 (25.3%) | 1.34 |
| Total Households | 1,776 (100.0%) | 4.04 |
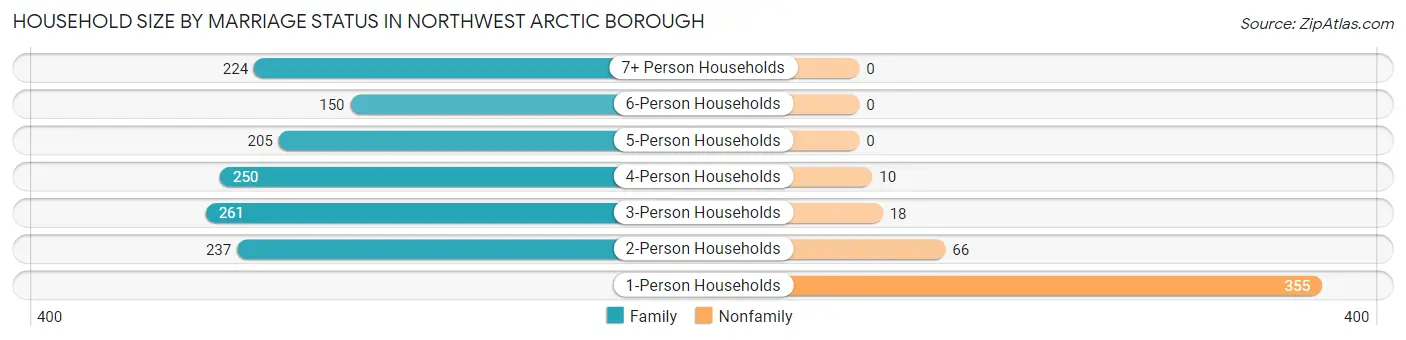
Household Size by Marriage Status in Northwest Arctic Borough
Out of a total of 1,776 households in Northwest Arctic Borough, 1,327 (74.7%) are family households, while 449 (25.3%) are nonfamily households. The most numerous type of family households are 3-person households, comprising 261, and the most common type of nonfamily households are 1-person households, comprising 355.
| Household Size | Family Households | Nonfamily Households |
| 1-Person Households | - | 355 (20.0%) |
| 2-Person Households | 237 (13.3%) | 66 (3.7%) |
| 3-Person Households | 261 (14.7%) | 18 (1.0%) |
| 4-Person Households | 250 (14.1%) | 10 (0.6%) |
| 5-Person Households | 205 (11.5%) | 0 (0.0%) |
| 6-Person Households | 150 (8.5%) | 0 (0.0%) |
| 7+ Person Households | 224 (12.6%) | 0 (0.0%) |
| Total | 1,327 (74.7%) | 449 (25.3%) |
Female Fertility in Northwest Arctic Borough
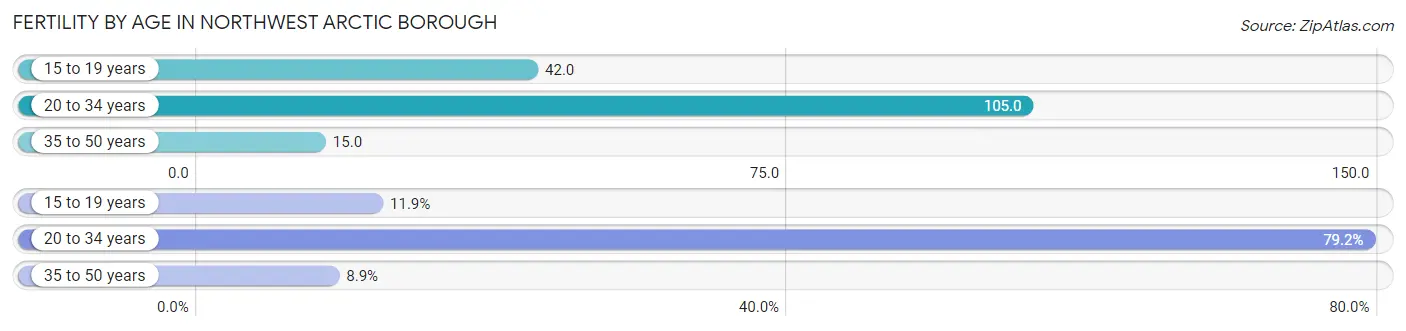
Fertility by Age in Northwest Arctic Borough
Average fertility rate in Northwest Arctic Borough is 61.0 births per 1,000 women. Women in the age bracket of 20 to 34 years have the highest fertility rate with 105.0 births per 1,000 women. Women in the age bracket of 20 to 34 years acount for 79.2% of all women with births.
| Age Bracket | Women with Births | Births / 1,000 Women |
| 15 to 19 years | 12 (11.9%) | 42.0 |
| 20 to 34 years | 80 (79.2%) | 105.0 |
| 35 to 50 years | 9 (8.9%) | 15.0 |
| Total | 101 (100.0%) | 61.0 |
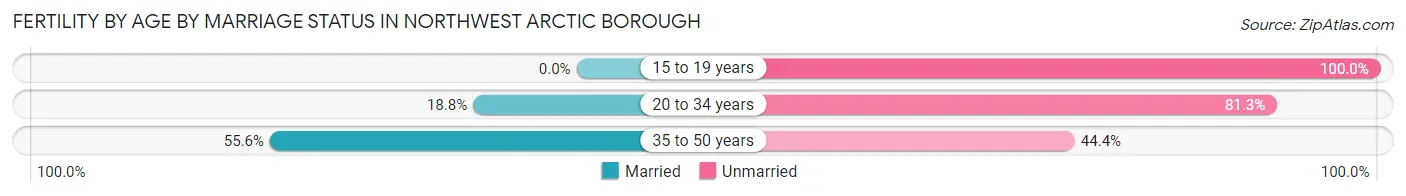
Fertility by Age by Marriage Status in Northwest Arctic Borough
19.8% of women with births (101) in Northwest Arctic Borough are married. The highest percentage of unmarried women with births falls into 15 to 19 years age bracket with 100.0% of them unmarried at the time of birth, while the lowest percentage of unmarried women with births belong to 35 to 50 years age bracket with 44.4% of them unmarried.
| Age Bracket | Married | Unmarried |
| 15 to 19 years | 0 (0.0%) | 12 (100.0%) |
| 20 to 34 years | 15 (18.8%) | 65 (81.2%) |
| 35 to 50 years | 5 (55.6%) | 4 (44.4%) |
| Total | 20 (19.8%) | 81 (80.2%) |
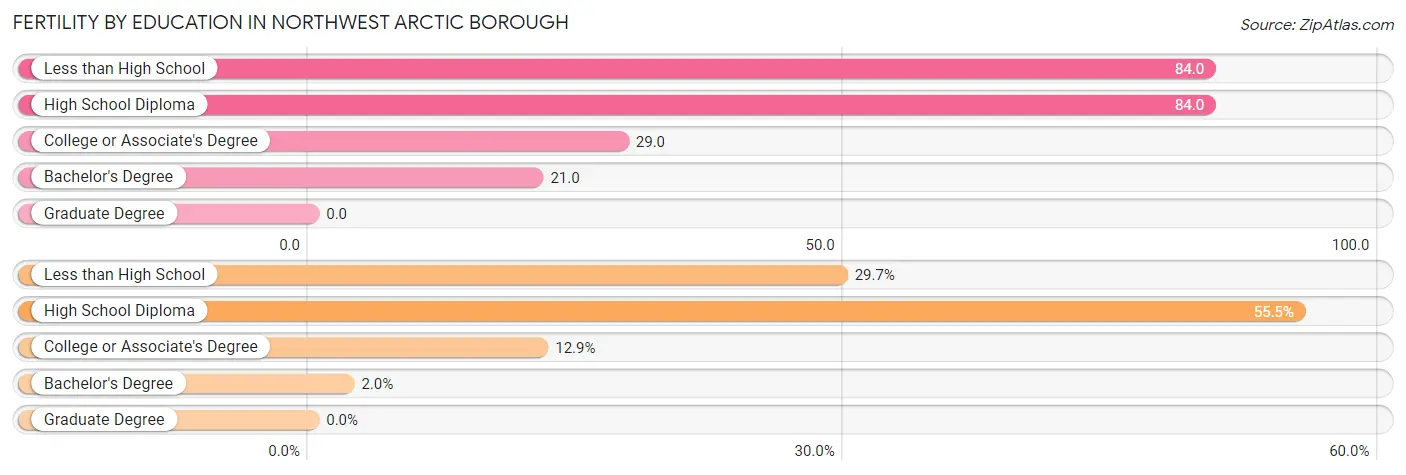
Fertility by Education in Northwest Arctic Borough
| Educational Attainment | Women with Births | Births / 1,000 Women |
| Less than High School | 30 (29.7%) | 84.0 |
| High School Diploma | 56 (55.4%) | 84.0 |
| College or Associate's Degree | 13 (12.9%) | 29.0 |
| Bachelor's Degree | 2 (2.0%) | 21.0 |
| Graduate Degree | 0 (0.0%) | 0.0 |
| Total | 101 (100.0%) | 61.0 |
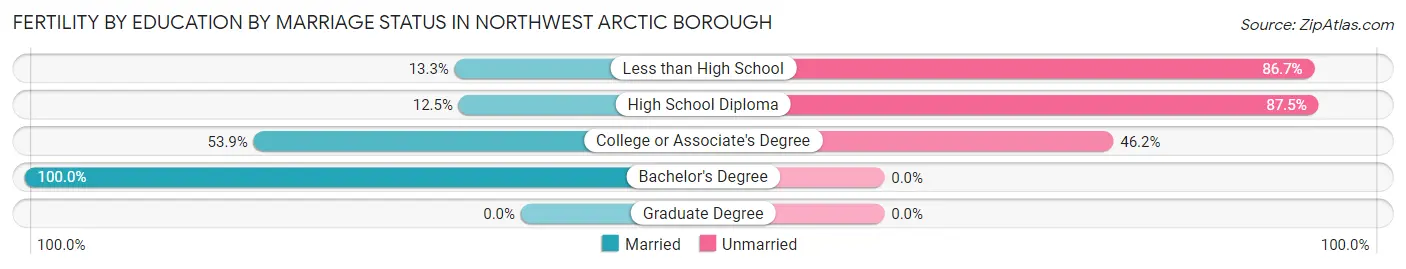
Fertility by Education by Marriage Status in Northwest Arctic Borough
80.2% of women with births in Northwest Arctic Borough are unmarried. Women with the educational attainment of bachelor's degree are most likely to be married with 100.0% of them married at childbirth, while women with the educational attainment of high school diploma are least likely to be married with 87.5% of them unmarried at childbirth.
| Educational Attainment | Married | Unmarried |
| Less than High School | 4 (13.3%) | 26 (86.7%) |
| High School Diploma | 7 (12.5%) | 49 (87.5%) |
| College or Associate's Degree | 7 (53.8%) | 6 (46.2%) |
| Bachelor's Degree | 2 (100.0%) | 0 (0.0%) |
| Graduate Degree | 0 (0.0%) | 0 (0.0%) |
| Total | 20 (19.8%) | 81 (80.2%) |
Income in Northwest Arctic Borough
Income Overview in Northwest Arctic Borough
Per Capita Income in Northwest Arctic Borough is $32,133, while median incomes of families and households are $77,546 and $77,647 respectively.
| Characteristic | Number | Measure |
| Per Capita Income | 7,682 | $32,133 |
| Median Family Income | 1,327 | $77,546 |
| Mean Family Income | 1,327 | $98,000 |
| Median Household Income | 1,776 | $77,647 |
| Mean Household Income | 1,776 | $96,030 |
| Income Deficit | 1,327 | $13,991 |
| Wage / Income Gap (%) | 7,682 | 11.17% |
| Wage / Income Gap ($) | 7,682 | 88.83¢ per $1 |
| Gini / Inequality Index | 7,682 | 0.42 |
Earnings by Sex in Northwest Arctic Borough
Average Earnings in Northwest Arctic Borough are $40,771, $38,006 for men and $42,784 for women, a difference of 11.2%.
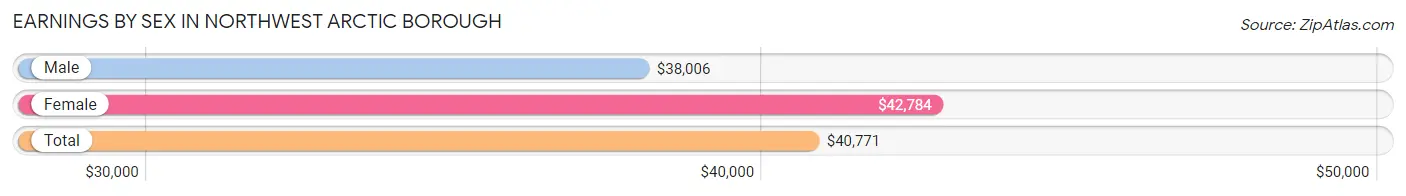
| Sex | Number | Average Earnings |
| Male | 1,853 (55.1%) | $38,006 |
| Female | 1,509 (44.9%) | $42,784 |
| Total | 3,362 (100.0%) | $40,771 |
Earnings by Sex by Income Bracket in Northwest Arctic Borough
The most common earnings brackets in Northwest Arctic Borough are $100,000+ for men (396 | 21.4%) and $75,000 to $99,999 for women (228 | 15.1%).
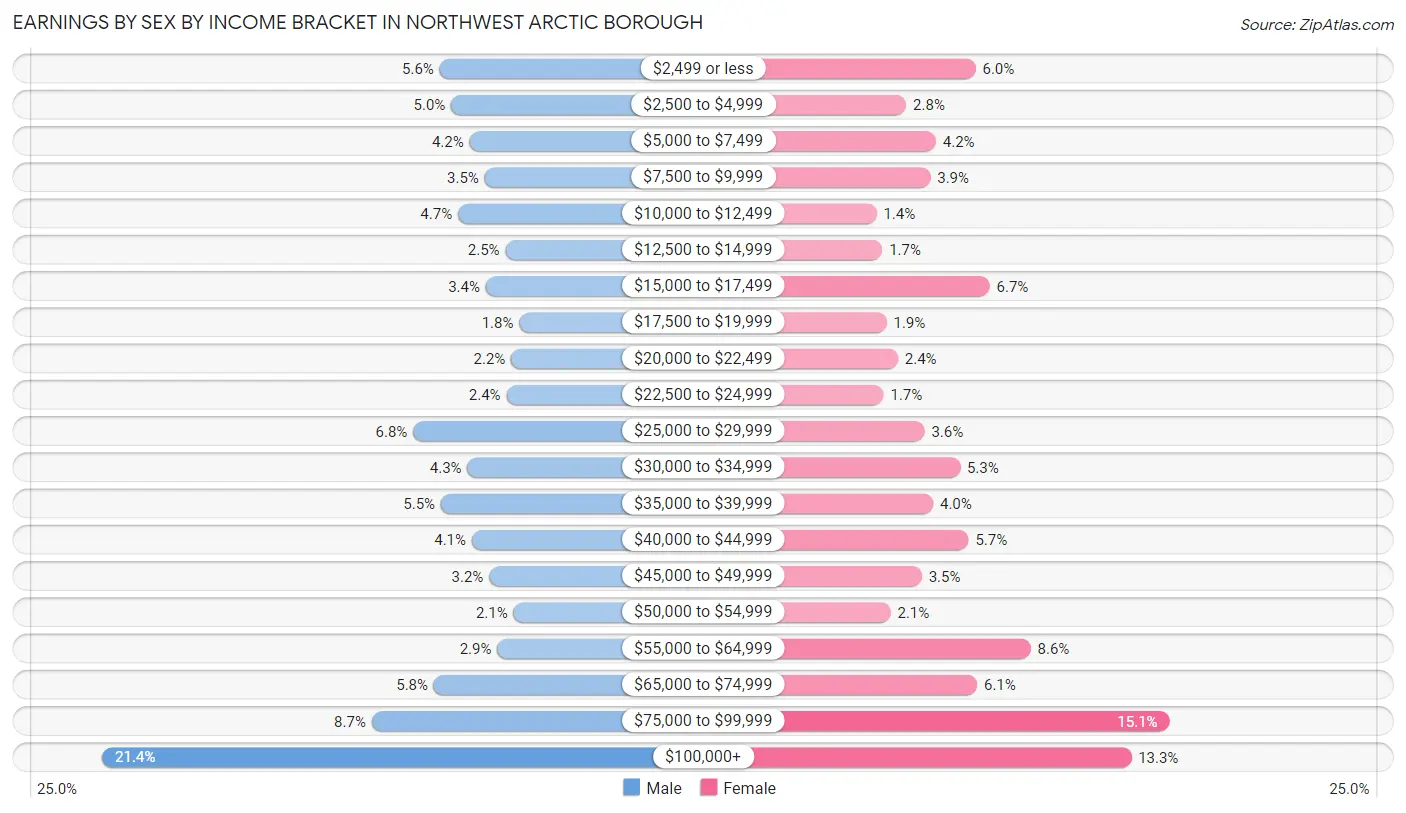
| Income | Male | Female |
| $2,499 or less | 103 (5.6%) | 91 (6.0%) |
| $2,500 to $4,999 | 93 (5.0%) | 42 (2.8%) |
| $5,000 to $7,499 | 77 (4.2%) | 63 (4.2%) |
| $7,500 to $9,999 | 64 (3.5%) | 59 (3.9%) |
| $10,000 to $12,499 | 87 (4.7%) | 21 (1.4%) |
| $12,500 to $14,999 | 46 (2.5%) | 25 (1.7%) |
| $15,000 to $17,499 | 63 (3.4%) | 101 (6.7%) |
| $17,500 to $19,999 | 34 (1.8%) | 28 (1.9%) |
| $20,000 to $22,499 | 41 (2.2%) | 36 (2.4%) |
| $22,500 to $24,999 | 45 (2.4%) | 26 (1.7%) |
| $25,000 to $29,999 | 126 (6.8%) | 55 (3.6%) |
| $30,000 to $34,999 | 79 (4.3%) | 80 (5.3%) |
| $35,000 to $39,999 | 102 (5.5%) | 61 (4.0%) |
| $40,000 to $44,999 | 75 (4.1%) | 86 (5.7%) |
| $45,000 to $49,999 | 60 (3.2%) | 53 (3.5%) |
| $50,000 to $54,999 | 39 (2.1%) | 31 (2.1%) |
| $55,000 to $64,999 | 53 (2.9%) | 130 (8.6%) |
| $65,000 to $74,999 | 108 (5.8%) | 92 (6.1%) |
| $75,000 to $99,999 | 162 (8.7%) | 228 (15.1%) |
| $100,000+ | 396 (21.4%) | 201 (13.3%) |
| Total | 1,853 (100.0%) | 1,509 (100.0%) |
Earnings by Sex by Educational Attainment in Northwest Arctic Borough
Average earnings in Northwest Arctic Borough are $44,250 for men and $53,250 for women, a difference of 16.9%. Men with an educational attainment of college or associate's degree enjoy the highest average annual earnings of $53,125, while those with less than high school education earn the least with $12,917. Women with an educational attainment of bachelor's degree earn the most with the average annual earnings of $73,333, while those with less than high school education have the smallest earnings of $20,833.
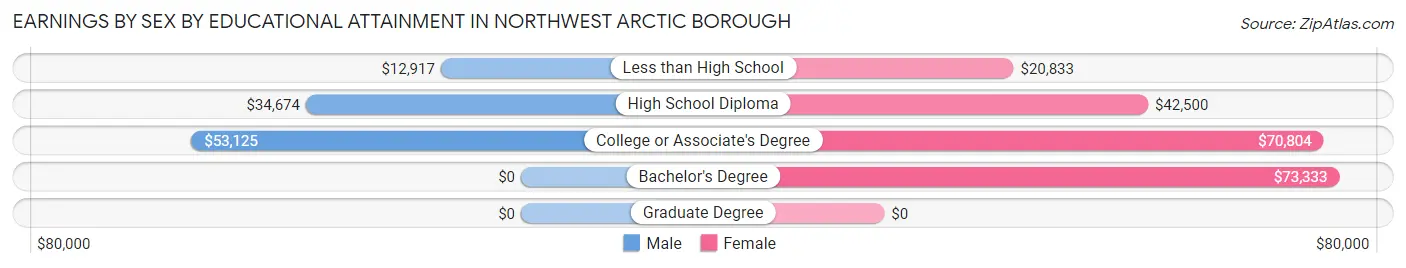
| Educational Attainment | Male Income | Female Income |
| Less than High School | $12,917 | $20,833 |
| High School Diploma | $34,674 | $42,500 |
| College or Associate's Degree | $53,125 | $70,804 |
| Bachelor's Degree | - | - |
| Graduate Degree | - | - |
| Total | $44,250 | $53,250 |
Family Income in Northwest Arctic Borough
Family Income Brackets in Northwest Arctic Borough
According to the Northwest Arctic Borough family income data, there are 265 families falling into the $50,000 to $74,999 income range, which is the most common income bracket and makes up 20.0% of all families. Conversely, the less than $10,000 income bracket is the least frequent group with only 54 families (4.1%) belonging to this category.
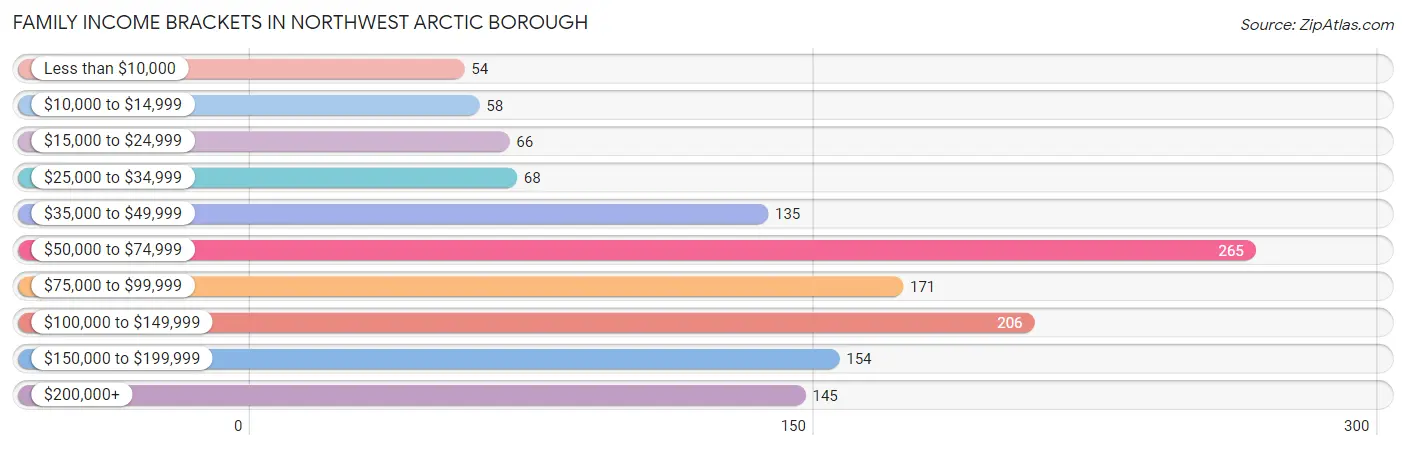
| Income Bracket | # Families | % Families |
| Less than $10,000 | 54 | 4.1% |
| $10,000 to $14,999 | 58 | 4.4% |
| $15,000 to $24,999 | 66 | 5.0% |
| $25,000 to $34,999 | 68 | 5.1% |
| $35,000 to $49,999 | 135 | 10.2% |
| $50,000 to $74,999 | 265 | 20.0% |
| $75,000 to $99,999 | 171 | 12.9% |
| $100,000 to $149,999 | 206 | 15.5% |
| $150,000 to $199,999 | 154 | 11.6% |
| $200,000+ | 145 | 10.9% |
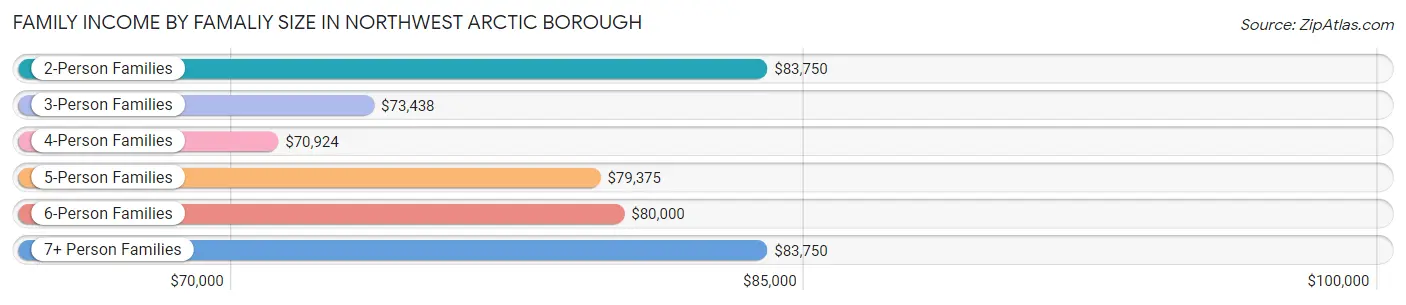
Family Income by Famaliy Size in Northwest Arctic Borough
2-person families (272 | 20.5%) account for the highest median family income in Northwest Arctic Borough with $83,750 per family, while 2-person families (272 | 20.5%) have the highest median income of $41,875 per family member.
| Income Bracket | # Families | Median Income |
| 2-Person Families | 272 (20.5%) | $83,750 |
| 3-Person Families | 281 (21.2%) | $73,438 |
| 4-Person Families | 257 (19.4%) | $70,924 |
| 5-Person Families | 176 (13.3%) | $79,375 |
| 6-Person Families | 132 (10.0%) | $80,000 |
| 7+ Person Families | 209 (15.8%) | $83,750 |
| Total | 1,327 (100.0%) | $77,546 |
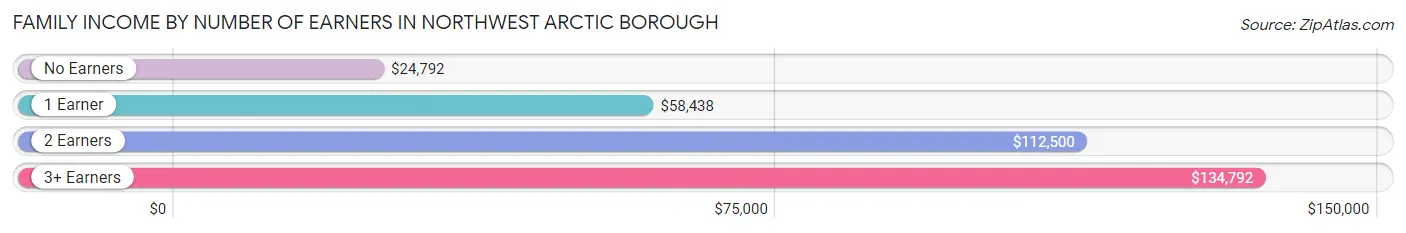
Family Income by Number of Earners in Northwest Arctic Borough
The median family income in Northwest Arctic Borough is $77,546, with families comprising 3+ earners (218) having the highest median family income of $134,792, while families with no earners (195) have the lowest median family income of $24,792, accounting for 16.4% and 14.7% of families, respectively.
| Number of Earners | # Families | Median Income |
| No Earners | 195 (14.7%) | $24,792 |
| 1 Earner | 450 (33.9%) | $58,438 |
| 2 Earners | 464 (35.0%) | $112,500 |
| 3+ Earners | 218 (16.4%) | $134,792 |
| Total | 1,327 (100.0%) | $77,546 |
Household Income in Northwest Arctic Borough
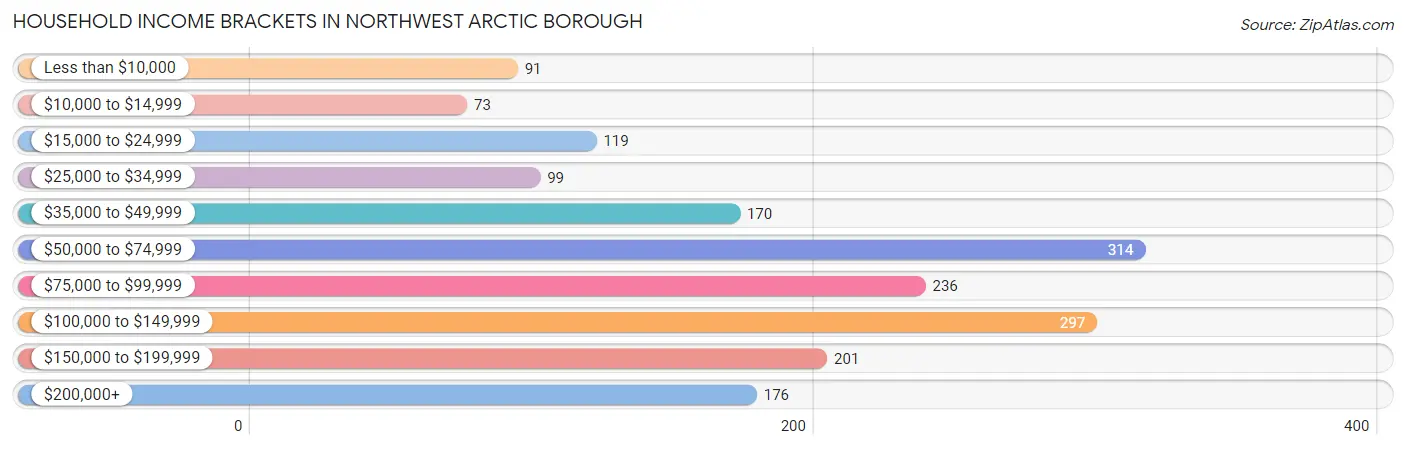
Household Income Brackets in Northwest Arctic Borough
With 314 households falling in the category, the $50,000 to $74,999 income range is the most frequent in Northwest Arctic Borough, accounting for 17.7% of all households. In contrast, only 73 households (4.1%) fall into the $10,000 to $14,999 income bracket, making it the least populous group.
| Income Bracket | # Households | % Households |
| Less than $10,000 | 91 | 5.1% |
| $10,000 to $14,999 | 73 | 4.1% |
| $15,000 to $24,999 | 119 | 6.7% |
| $25,000 to $34,999 | 99 | 5.6% |
| $35,000 to $49,999 | 170 | 9.6% |
| $50,000 to $74,999 | 314 | 17.7% |
| $75,000 to $99,999 | 236 | 13.3% |
| $100,000 to $149,999 | 297 | 16.7% |
| $150,000 to $199,999 | 201 | 11.3% |
| $200,000+ | 176 | 9.9% |
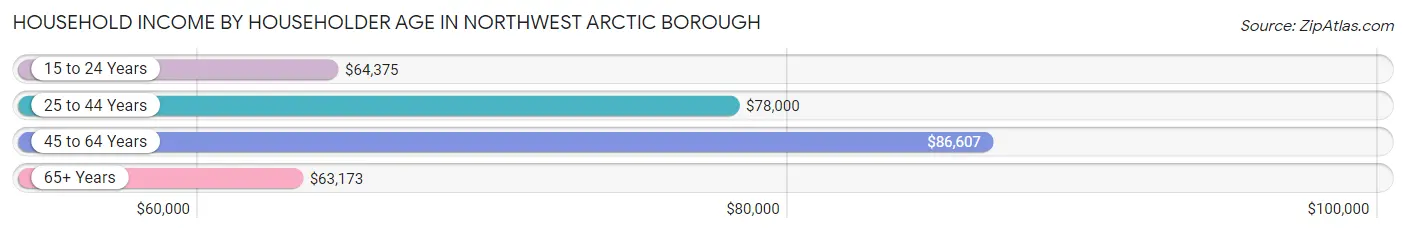
Household Income by Householder Age in Northwest Arctic Borough
The median household income in Northwest Arctic Borough is $77,647, with the highest median household income of $86,607 found in the 45 to 64 years age bracket for the primary householder. A total of 807 households (45.4%) fall into this category. Meanwhile, the 65+ years age bracket for the primary householder has the lowest median household income of $63,173, with 392 households (22.1%) in this group.
| Income Bracket | # Households | Median Income |
| 15 to 24 Years | 51 (2.9%) | $64,375 |
| 25 to 44 Years | 526 (29.6%) | $78,000 |
| 45 to 64 Years | 807 (45.4%) | $86,607 |
| 65+ Years | 392 (22.1%) | $63,173 |
| Total | 1,776 (100.0%) | $77,647 |
Poverty in Northwest Arctic Borough
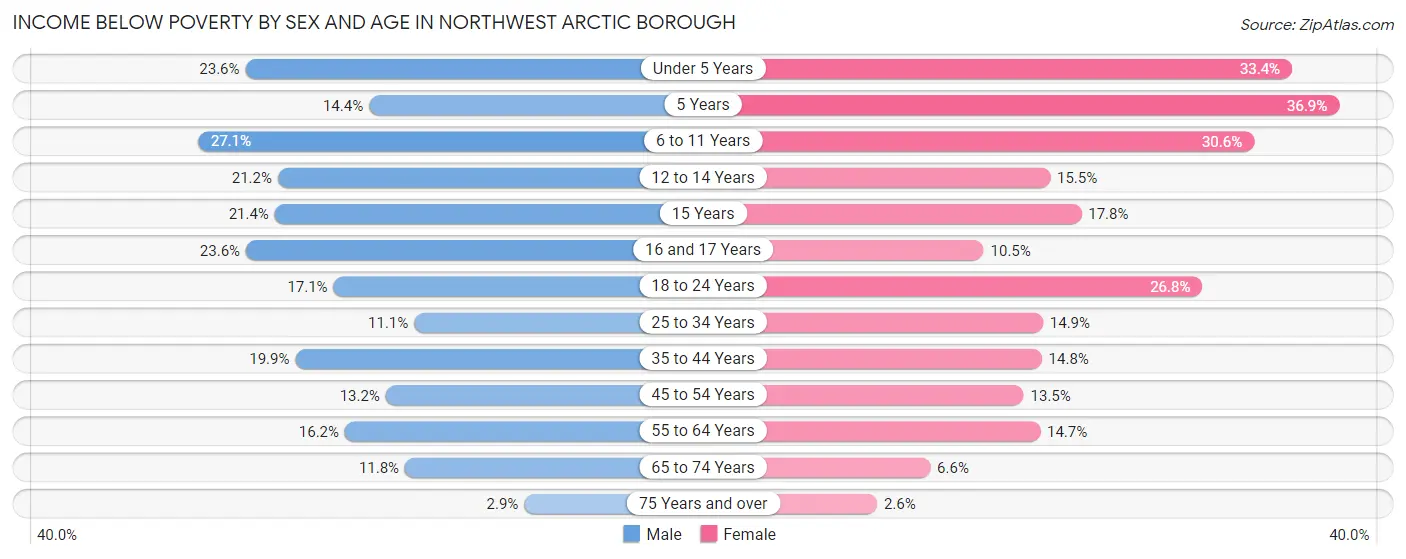
Income Below Poverty by Sex and Age in Northwest Arctic Borough
With 17.6% poverty level for males and 19.5% for females among the residents of Northwest Arctic Borough, 6 to 11 year old males and 5 year old females are the most vulnerable to poverty, with 149 males (27.1%) and 24 females (36.9%) in their respective age groups living below the poverty level.
| Age Bracket | Male | Female |
| Under 5 Years | 85 (23.6%) | 136 (33.4%) |
| 5 Years | 14 (14.4%) | 24 (36.9%) |
| 6 to 11 Years | 149 (27.1%) | 138 (30.6%) |
| 12 to 14 Years | 46 (21.2%) | 30 (15.5%) |
| 15 Years | 15 (21.4%) | 8 (17.8%) |
| 16 and 17 Years | 33 (23.6%) | 14 (10.5%) |
| 18 to 24 Years | 56 (17.1%) | 91 (26.8%) |
| 25 to 34 Years | 78 (11.1%) | 79 (14.9%) |
| 35 to 44 Years | 82 (19.9%) | 61 (14.8%) |
| 45 to 54 Years | 57 (13.2%) | 42 (13.5%) |
| 55 to 64 Years | 72 (16.2%) | 53 (14.7%) |
| 65 to 74 Years | 24 (11.8%) | 12 (6.6%) |
| 75 Years and over | 3 (2.9%) | 3 (2.6%) |
| Total | 714 (17.6%) | 691 (19.5%) |
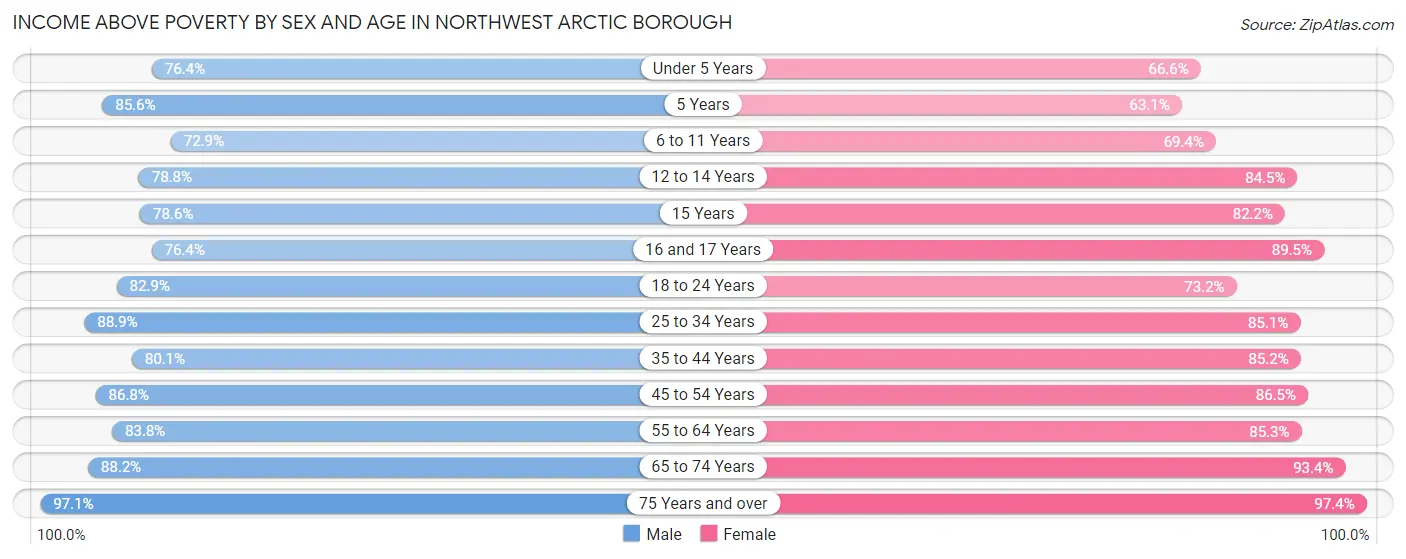
Income Above Poverty by Sex and Age in Northwest Arctic Borough
According to the poverty statistics in Northwest Arctic Borough, males aged 75 years and over and females aged 75 years and over are the age groups that are most secure financially, with 97.1% of males and 97.4% of females in these age groups living above the poverty line.
| Age Bracket | Male | Female |
| Under 5 Years | 275 (76.4%) | 271 (66.6%) |
| 5 Years | 83 (85.6%) | 41 (63.1%) |
| 6 to 11 Years | 400 (72.9%) | 313 (69.4%) |
| 12 to 14 Years | 171 (78.8%) | 164 (84.5%) |
| 15 Years | 55 (78.6%) | 37 (82.2%) |
| 16 and 17 Years | 107 (76.4%) | 119 (89.5%) |
| 18 to 24 Years | 272 (82.9%) | 249 (73.2%) |
| 25 to 34 Years | 626 (88.9%) | 450 (85.1%) |
| 35 to 44 Years | 330 (80.1%) | 350 (85.2%) |
| 45 to 54 Years | 375 (86.8%) | 269 (86.5%) |
| 55 to 64 Years | 372 (83.8%) | 307 (85.3%) |
| 65 to 74 Years | 180 (88.2%) | 171 (93.4%) |
| 75 Years and over | 100 (97.1%) | 112 (97.4%) |
| Total | 3,346 (82.4%) | 2,853 (80.5%) |
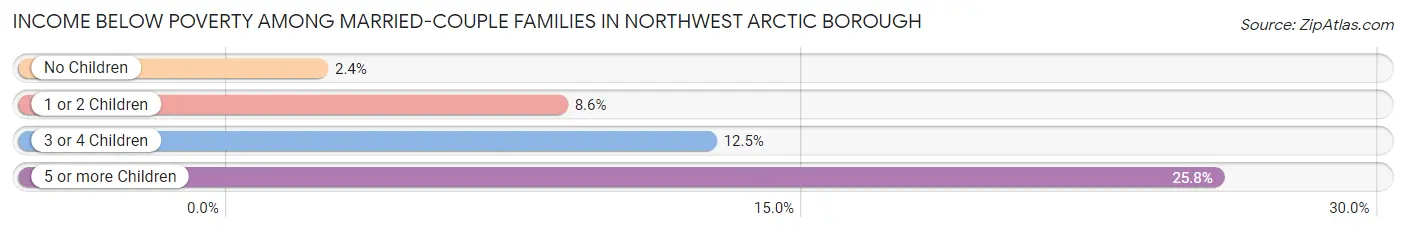
Income Below Poverty Among Married-Couple Families in Northwest Arctic Borough
The poverty statistics for married-couple families in Northwest Arctic Borough show that 9.3% or 68 of the total 730 families live below the poverty line. Families with 5 or more children have the highest poverty rate of 25.8%, comprising of 17 families. On the other hand, families with no children have the lowest poverty rate of 2.4%, which includes 5 families.
| Children | Above Poverty | Below Poverty |
| No Children | 208 (97.7%) | 5 (2.4%) |
| 1 or 2 Children | 244 (91.4%) | 23 (8.6%) |
| 3 or 4 Children | 161 (87.5%) | 23 (12.5%) |
| 5 or more Children | 49 (74.2%) | 17 (25.8%) |
| Total | 662 (90.7%) | 68 (9.3%) |
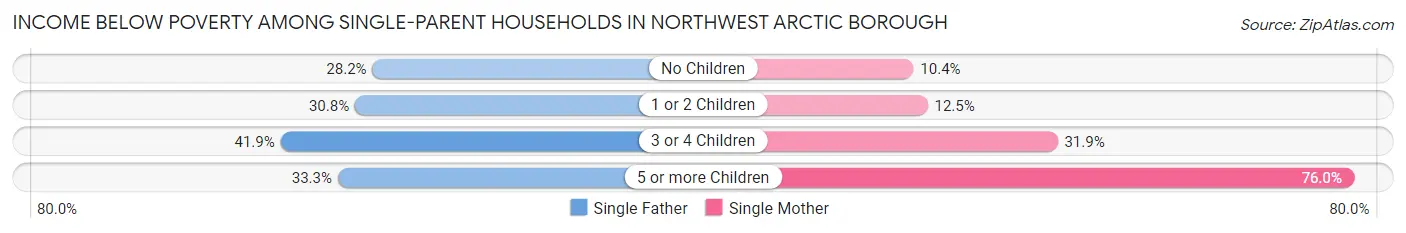
Income Below Poverty Among Single-Parent Households in Northwest Arctic Borough
According to the poverty data in Northwest Arctic Borough, 32.3% or 64 single-father households and 21.5% or 86 single-mother households are living below the poverty line. Among single-father households, those with 3 or 4 children have the highest poverty rate, with 18 households (41.9%) experiencing poverty. Likewise, among single-mother households, those with 5 or more children have the highest poverty rate, with 19 households (76.0%) falling below the poverty line.
| Children | Single Father | Single Mother |
| No Children | 20 (28.2%) | 8 (10.4%) |
| 1 or 2 Children | 24 (30.8%) | 23 (12.5%) |
| 3 or 4 Children | 18 (41.9%) | 36 (31.9%) |
| 5 or more Children | 2 (33.3%) | 19 (76.0%) |
| Total | 64 (32.3%) | 86 (21.5%) |
Income Below Poverty Among Married-Couple vs Single-Parent Households in Northwest Arctic Borough
The poverty data for Northwest Arctic Borough shows that 68 of the married-couple family households (9.3%) and 150 of the single-parent households (25.1%) are living below the poverty level. Within the married-couple family households, those with 5 or more children have the highest poverty rate, with 17 households (25.8%) falling below the poverty line. Among the single-parent households, those with 5 or more children have the highest poverty rate, with 21 household (67.7%) living below poverty.
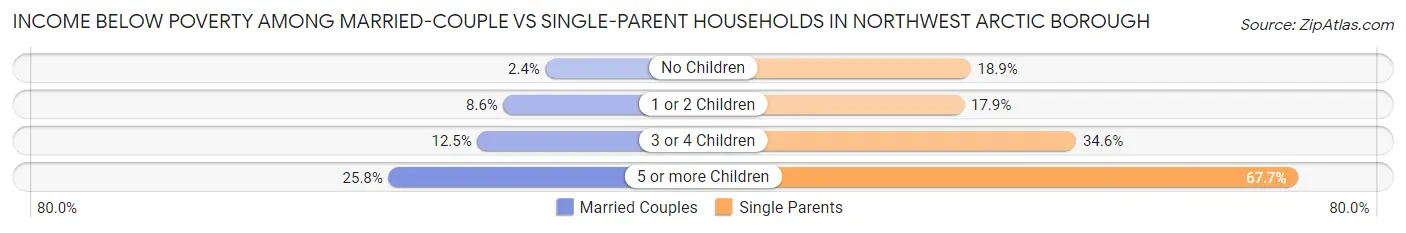
| Children | Married-Couple Families | Single-Parent Households |
| No Children | 5 (2.4%) | 28 (18.9%) |
| 1 or 2 Children | 23 (8.6%) | 47 (17.9%) |
| 3 or 4 Children | 23 (12.5%) | 54 (34.6%) |
| 5 or more Children | 17 (25.8%) | 21 (67.7%) |
| Total | 68 (9.3%) | 150 (25.1%) |
Employment Characteristics in Northwest Arctic Borough
Employment by Class of Employer in Northwest Arctic Borough
Among the 2,525 employed individuals in Northwest Arctic Borough, private company employees (846 | 33.5%), local government employees (827 | 32.8%), and not-for-profit organizations (534 | 21.1%) make up the most common classes of employment.
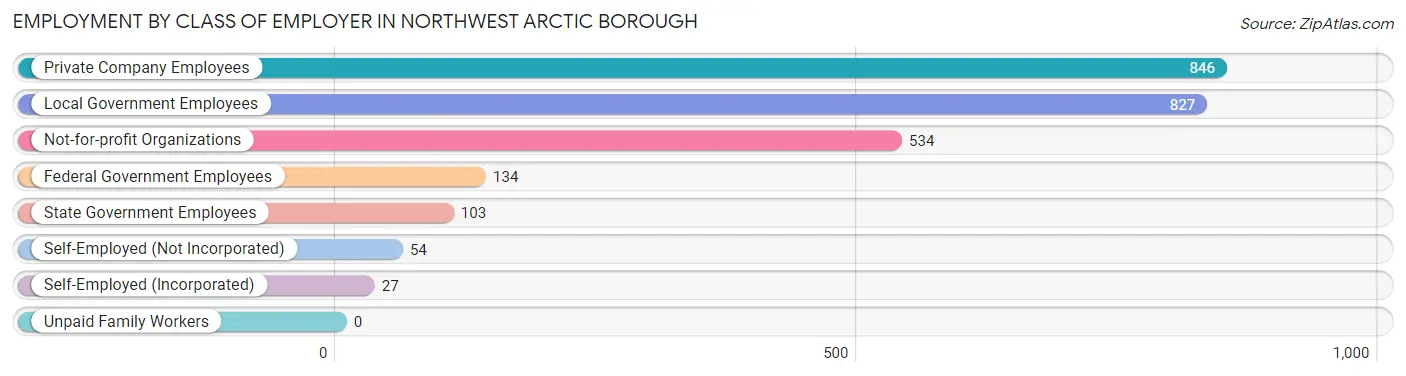
| Employer Class | # Employees | % Employees |
| Private Company Employees | 846 | 33.5% |
| Self-Employed (Incorporated) | 27 | 1.1% |
| Self-Employed (Not Incorporated) | 54 | 2.1% |
| Not-for-profit Organizations | 534 | 21.1% |
| Local Government Employees | 827 | 32.8% |
| State Government Employees | 103 | 4.1% |
| Federal Government Employees | 134 | 5.3% |
| Unpaid Family Workers | 0 | 0.0% |
| Total | 2,525 | 100.0% |
Employment Status by Age in Northwest Arctic Borough
According to the labor force statistics for Northwest Arctic Borough, out of the total population over 16 years of age (5,175), 60.2% or 3,115 individuals are in the labor force, with 15.5% or 483 of them unemployed. The age group with the highest labor force participation rate is 30 to 34 years, with 79.8% or 545 individuals in the labor force. Within the labor force, the 16 to 19 years age range has the highest percentage of unemployed individuals, with 45.7% or 42 of them being unemployed.
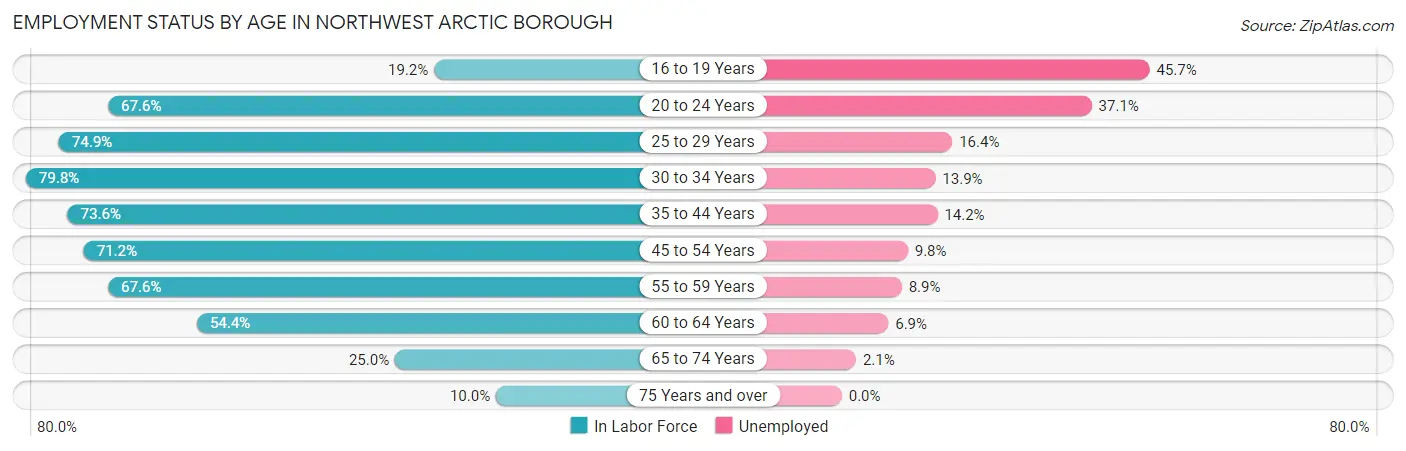
| Age Bracket | In Labor Force | Unemployed |
| 16 to 19 Years | 92 (19.2%) | 42 (45.7%) |
| 20 to 24 Years | 315 (67.6%) | 117 (37.1%) |
| 25 to 29 Years | 420 (74.9%) | 69 (16.4%) |
| 30 to 34 Years | 545 (79.8%) | 76 (13.9%) |
| 35 to 44 Years | 611 (73.6%) | 87 (14.2%) |
| 45 to 54 Years | 530 (71.2%) | 52 (9.8%) |
| 55 to 59 Years | 236 (67.6%) | 21 (8.9%) |
| 60 to 64 Years | 248 (54.4%) | 17 (6.9%) |
| 65 to 74 Years | 97 (25.0%) | 2 (2.1%) |
| 75 Years and over | 22 (10.0%) | 0 (0.0%) |
| Total | 3,115 (60.2%) | 483 (15.5%) |
Employment Status by Educational Attainment in Northwest Arctic Borough
According to labor force statistics for Northwest Arctic Borough, 71.5% of individuals (2,590) out of the total population between 25 and 64 years of age (3,623) are in the labor force, with 12.4% or 321 of them being unemployed. The group with the highest labor force participation rate are those with the educational attainment of bachelor's degree or higher, with 96.2% or 527 individuals in the labor force. Within the labor force, individuals with less than high school education have the highest percentage of unemployment, with 37.9% or 64 of them being unemployed.
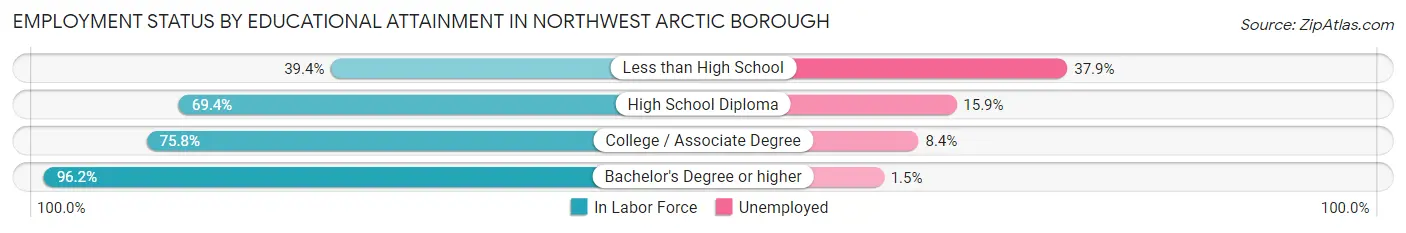
| Educational Attainment | In Labor Force | Unemployed |
| Less than High School | 169 (39.4%) | 163 (37.9%) |
| High School Diploma | 1,215 (69.4%) | 278 (15.9%) |
| College / Associate Degree | 679 (75.8%) | 75 (8.4%) |
| Bachelor's Degree or higher | 527 (96.2%) | 8 (1.5%) |
| Total | 2,590 (71.5%) | 449 (12.4%) |
Employment Occupations by Sex in Northwest Arctic Borough
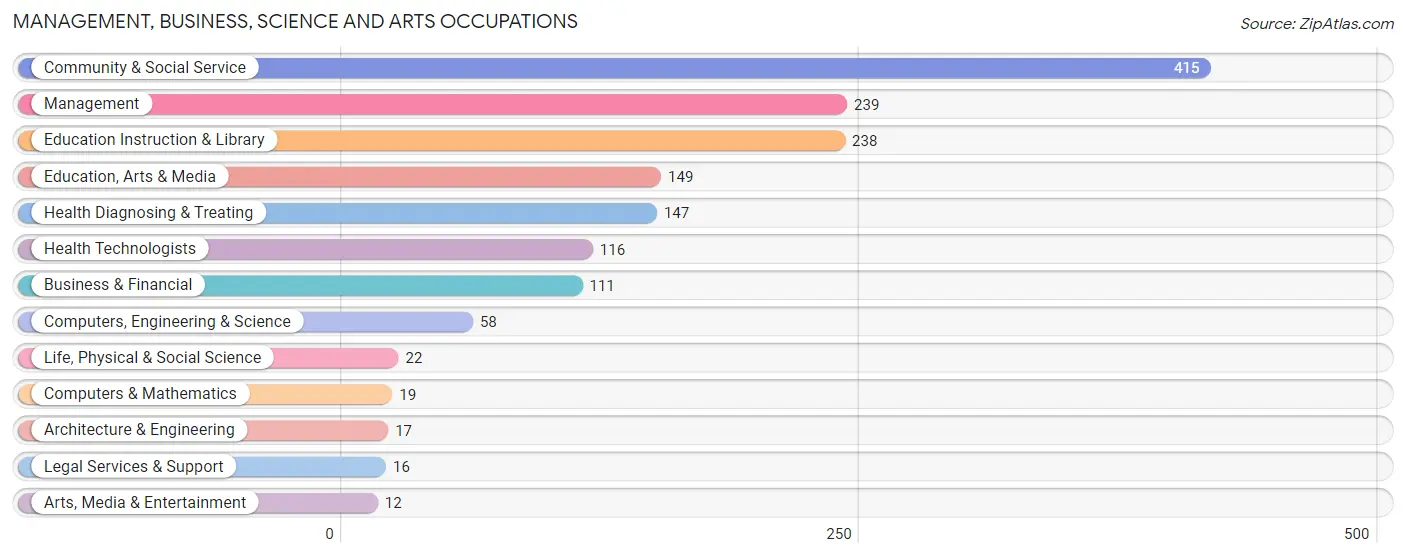
Management, Business, Science and Arts Occupations
The most common Management, Business, Science and Arts occupations in Northwest Arctic Borough are Community & Social Service (415 | 15.8%), Management (239 | 9.1%), Education Instruction & Library (238 | 9.0%), Education, Arts & Media (149 | 5.7%), and Health Diagnosing & Treating (147 | 5.6%).
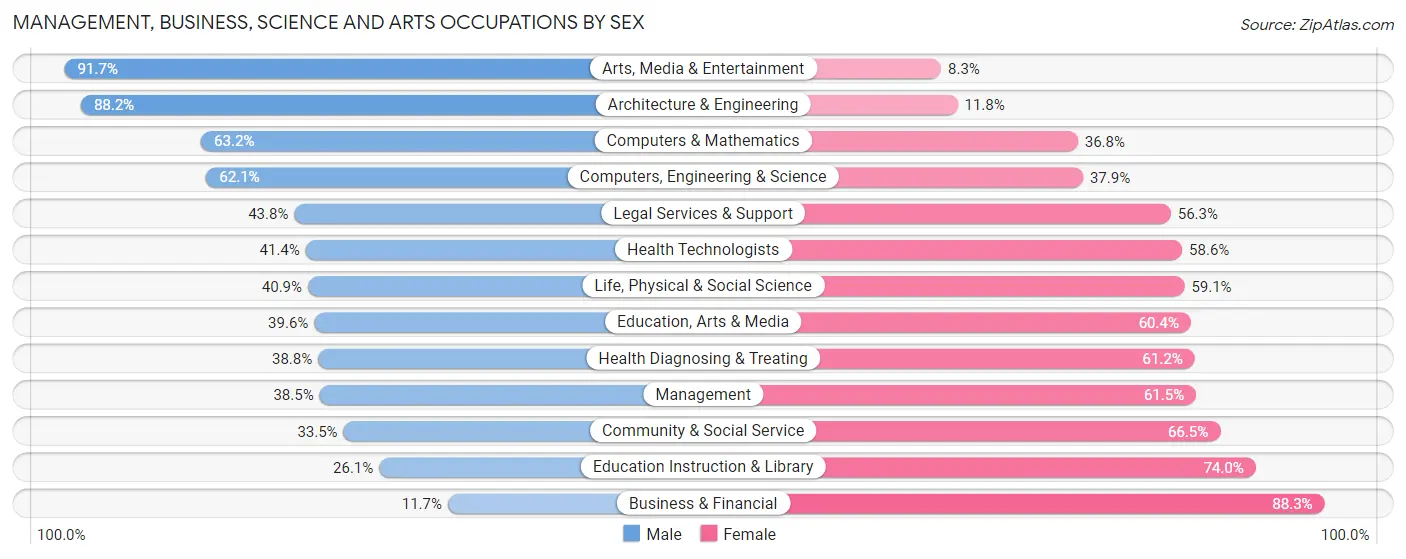
Management, Business, Science and Arts Occupations by Sex
Within the Management, Business, Science and Arts occupations in Northwest Arctic Borough, the most male-oriented occupations are Arts, Media & Entertainment (91.7%), Architecture & Engineering (88.2%), and Computers & Mathematics (63.2%), while the most female-oriented occupations are Business & Financial (88.3%), Education Instruction & Library (74.0%), and Community & Social Service (66.5%).
| Occupation | Male | Female |
| Management | 92 (38.5%) | 147 (61.5%) |
| Business & Financial | 13 (11.7%) | 98 (88.3%) |
| Computers, Engineering & Science | 36 (62.1%) | 22 (37.9%) |
| Computers & Mathematics | 12 (63.2%) | 7 (36.8%) |
| Architecture & Engineering | 15 (88.2%) | 2 (11.8%) |
| Life, Physical & Social Science | 9 (40.9%) | 13 (59.1%) |
| Community & Social Service | 139 (33.5%) | 276 (66.5%) |
| Education, Arts & Media | 59 (39.6%) | 90 (60.4%) |
| Legal Services & Support | 7 (43.8%) | 9 (56.2%) |
| Education Instruction & Library | 62 (26.1%) | 176 (74.0%) |
| Arts, Media & Entertainment | 11 (91.7%) | 1 (8.3%) |
| Health Diagnosing & Treating | 57 (38.8%) | 90 (61.2%) |
| Health Technologists | 48 (41.4%) | 68 (58.6%) |
| Total (Category) | 337 (34.7%) | 633 (65.3%) |
| Total (Overall) | 1,402 (53.3%) | 1,230 (46.7%) |
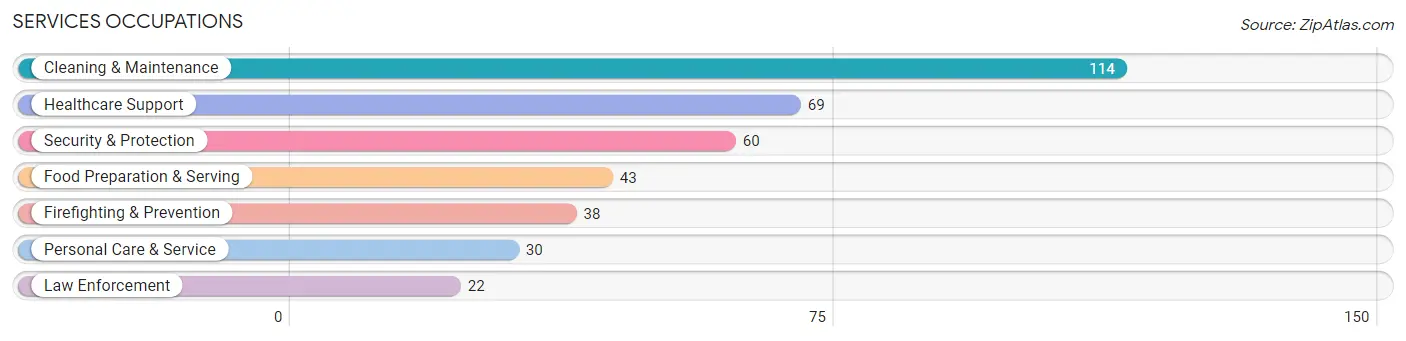
Services Occupations
The most common Services occupations in Northwest Arctic Borough are Cleaning & Maintenance (114 | 4.3%), Healthcare Support (69 | 2.6%), Security & Protection (60 | 2.3%), Food Preparation & Serving (43 | 1.6%), and Firefighting & Prevention (38 | 1.4%).
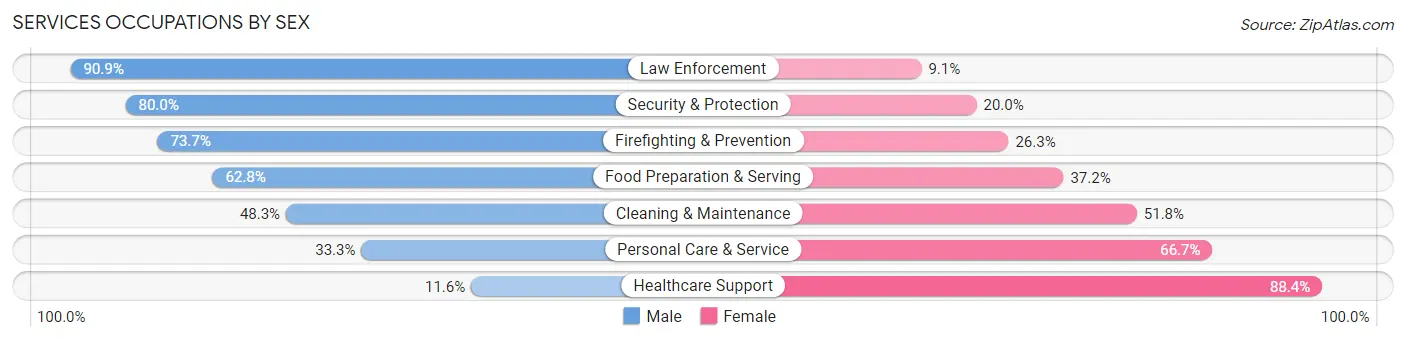
Services Occupations by Sex
Within the Services occupations in Northwest Arctic Borough, the most male-oriented occupations are Law Enforcement (90.9%), Security & Protection (80.0%), and Firefighting & Prevention (73.7%), while the most female-oriented occupations are Healthcare Support (88.4%), Personal Care & Service (66.7%), and Cleaning & Maintenance (51.7%).
| Occupation | Male | Female |
| Healthcare Support | 8 (11.6%) | 61 (88.4%) |
| Security & Protection | 48 (80.0%) | 12 (20.0%) |
| Firefighting & Prevention | 28 (73.7%) | 10 (26.3%) |
| Law Enforcement | 20 (90.9%) | 2 (9.1%) |
| Food Preparation & Serving | 27 (62.8%) | 16 (37.2%) |
| Cleaning & Maintenance | 55 (48.2%) | 59 (51.7%) |
| Personal Care & Service | 10 (33.3%) | 20 (66.7%) |
| Total (Category) | 148 (46.8%) | 168 (53.2%) |
| Total (Overall) | 1,402 (53.3%) | 1,230 (46.7%) |
Sales and Office Occupations
The most common Sales and Office occupations in Northwest Arctic Borough are Office & Administration (351 | 13.3%), and Sales & Related (110 | 4.2%).

Sales and Office Occupations by Sex
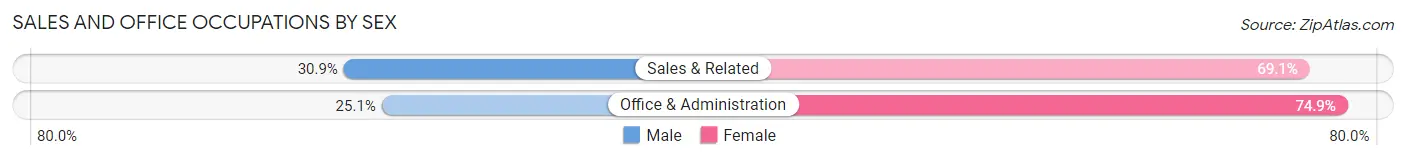
| Occupation | Male | Female |
| Sales & Related | 34 (30.9%) | 76 (69.1%) |
| Office & Administration | 88 (25.1%) | 263 (74.9%) |
| Total (Category) | 122 (26.5%) | 339 (73.5%) |
| Total (Overall) | 1,402 (53.3%) | 1,230 (46.7%) |
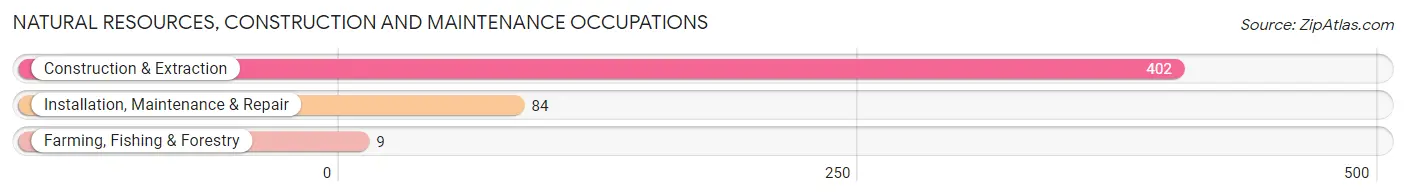
Natural Resources, Construction and Maintenance Occupations
The most common Natural Resources, Construction and Maintenance occupations in Northwest Arctic Borough are Construction & Extraction (402 | 15.3%), Installation, Maintenance & Repair (84 | 3.2%), and Farming, Fishing & Forestry (9 | 0.3%).
Natural Resources, Construction and Maintenance Occupations by Sex
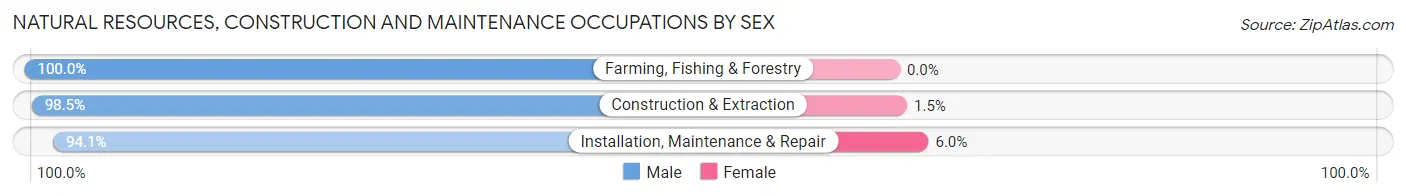
| Occupation | Male | Female |
| Farming, Fishing & Forestry | 9 (100.0%) | 0 (0.0%) |
| Construction & Extraction | 396 (98.5%) | 6 (1.5%) |
| Installation, Maintenance & Repair | 79 (94.1%) | 5 (5.9%) |
| Total (Category) | 484 (97.8%) | 11 (2.2%) |
| Total (Overall) | 1,402 (53.3%) | 1,230 (46.7%) |
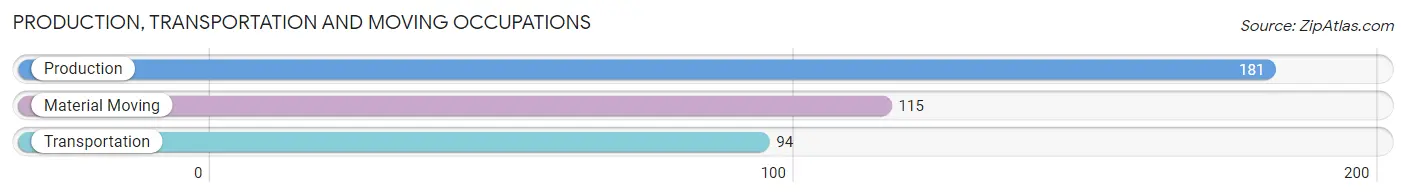
Production, Transportation and Moving Occupations
The most common Production, Transportation and Moving occupations in Northwest Arctic Borough are Production (181 | 6.9%), Material Moving (115 | 4.4%), and Transportation (94 | 3.6%).
Production, Transportation and Moving Occupations by Sex
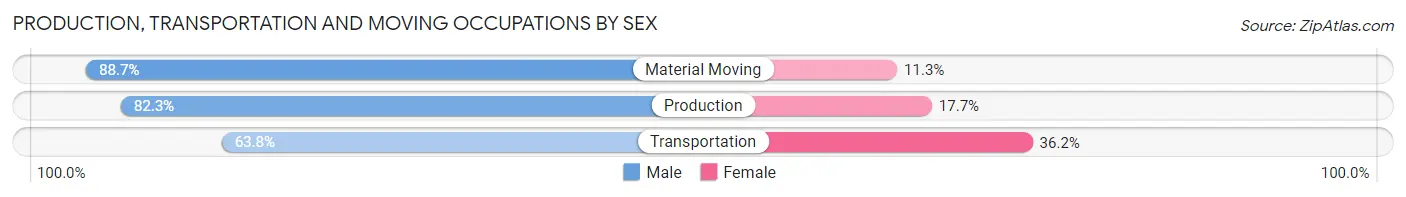
| Occupation | Male | Female |
| Production | 149 (82.3%) | 32 (17.7%) |
| Transportation | 60 (63.8%) | 34 (36.2%) |
| Material Moving | 102 (88.7%) | 13 (11.3%) |
| Total (Category) | 311 (79.7%) | 79 (20.3%) |
| Total (Overall) | 1,402 (53.3%) | 1,230 (46.7%) |
Employment Industries by Sex in Northwest Arctic Borough
Employment Industries in Northwest Arctic Borough
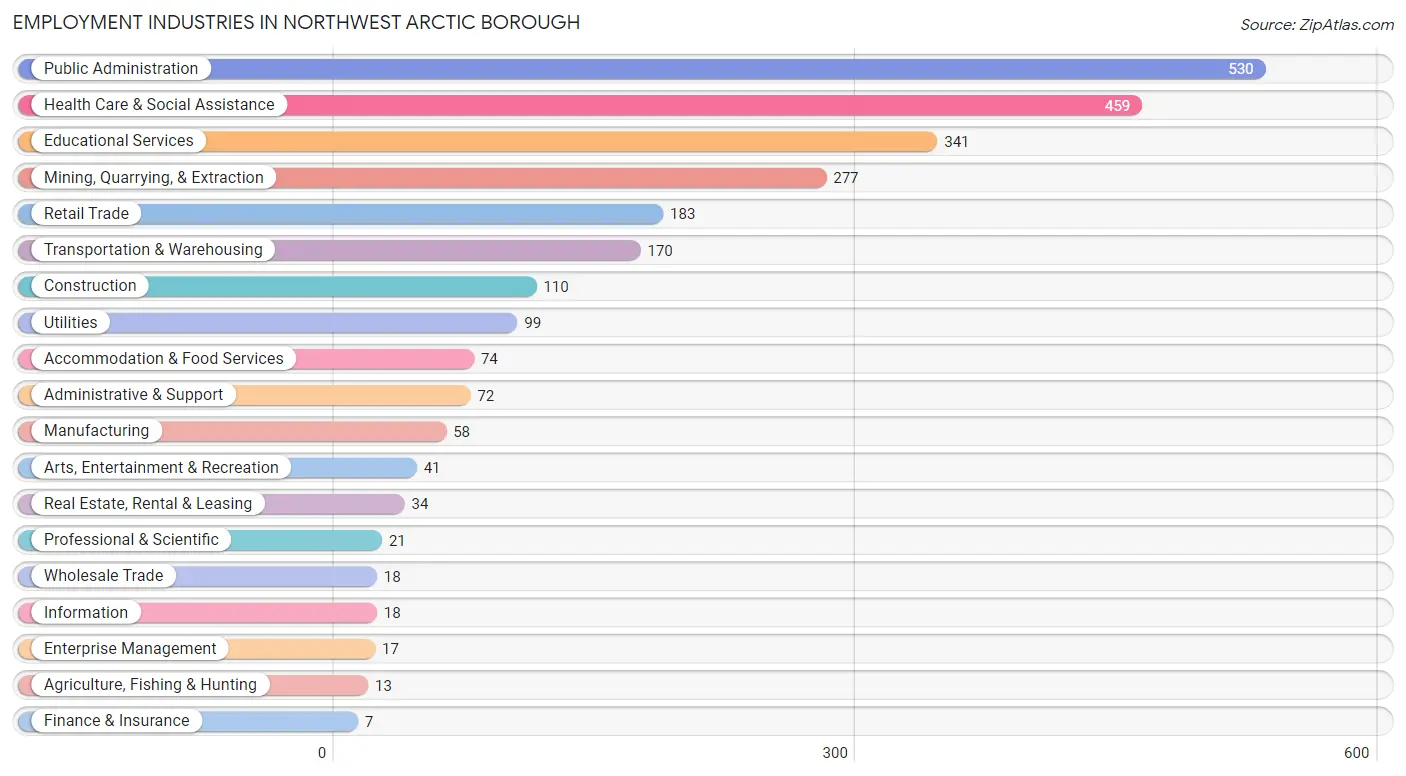
The major employment industries in Northwest Arctic Borough include Public Administration (530 | 20.1%), Health Care & Social Assistance (459 | 17.4%), Educational Services (341 | 13.0%), Mining, Quarrying, & Extraction (277 | 10.5%), and Retail Trade (183 | 7.0%).
Employment Industries by Sex in Northwest Arctic Borough
The Northwest Arctic Borough industries that see more men than women are Construction (100.0%), Mining, Quarrying, & Extraction (93.5%), and Agriculture, Fishing & Hunting (92.3%), whereas the industries that tend to have a higher number of women are Finance & Insurance (100.0%), Health Care & Social Assistance (69.3%), and Educational Services (68.0%).
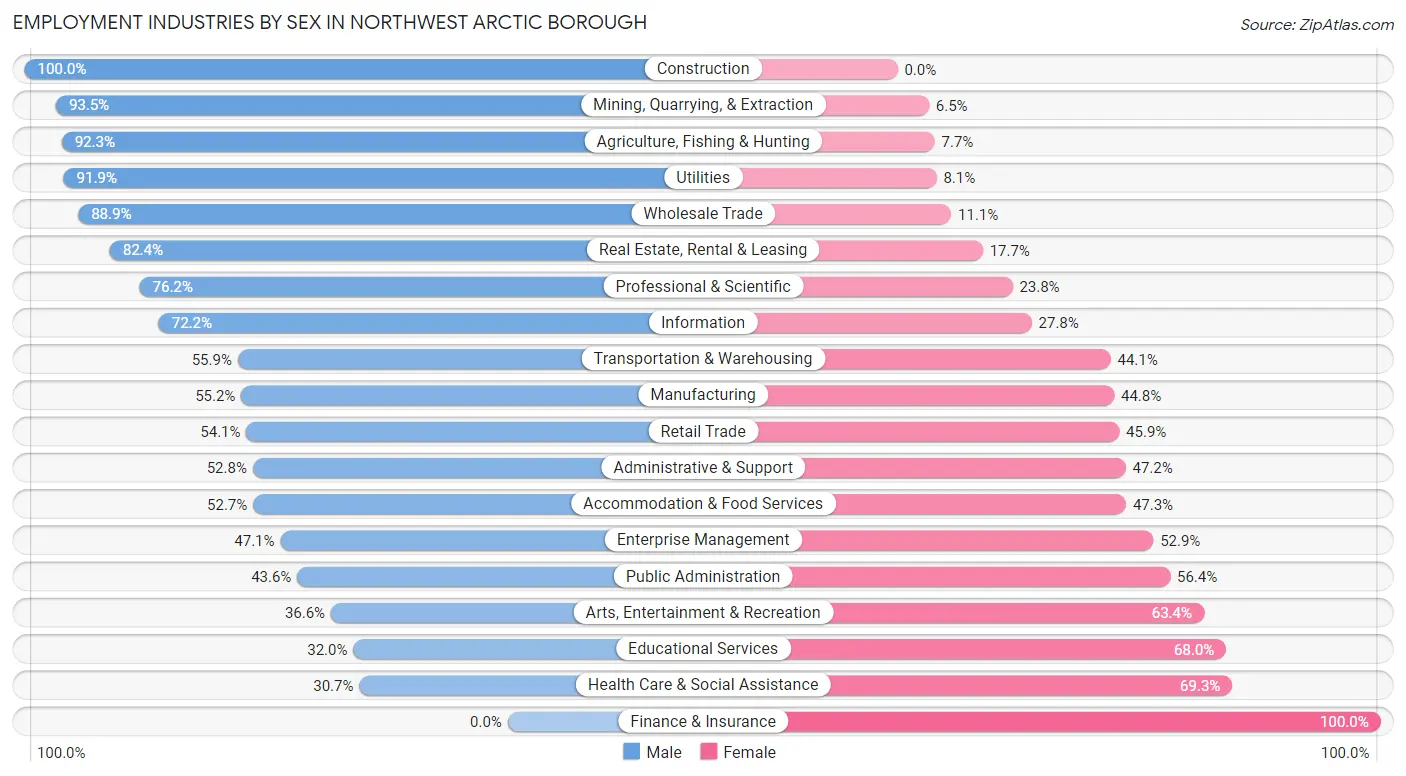
| Industry | Male | Female |
| Agriculture, Fishing & Hunting | 12 (92.3%) | 1 (7.7%) |
| Mining, Quarrying, & Extraction | 259 (93.5%) | 18 (6.5%) |
| Construction | 110 (100.0%) | 0 (0.0%) |
| Manufacturing | 32 (55.2%) | 26 (44.8%) |
| Wholesale Trade | 16 (88.9%) | 2 (11.1%) |
| Retail Trade | 99 (54.1%) | 84 (45.9%) |
| Transportation & Warehousing | 95 (55.9%) | 75 (44.1%) |
| Utilities | 91 (91.9%) | 8 (8.1%) |
| Information | 13 (72.2%) | 5 (27.8%) |
| Finance & Insurance | 0 (0.0%) | 7 (100.0%) |
| Real Estate, Rental & Leasing | 28 (82.4%) | 6 (17.6%) |
| Professional & Scientific | 16 (76.2%) | 5 (23.8%) |
| Enterprise Management | 8 (47.1%) | 9 (52.9%) |
| Administrative & Support | 38 (52.8%) | 34 (47.2%) |
| Educational Services | 109 (32.0%) | 232 (68.0%) |
| Health Care & Social Assistance | 141 (30.7%) | 318 (69.3%) |
| Arts, Entertainment & Recreation | 15 (36.6%) | 26 (63.4%) |
| Accommodation & Food Services | 39 (52.7%) | 35 (47.3%) |
| Public Administration | 231 (43.6%) | 299 (56.4%) |
| Total | 1,402 (53.3%) | 1,230 (46.7%) |
Education in Northwest Arctic Borough
School Enrollment in Northwest Arctic Borough
The most common levels of schooling among the 2,188 students in Northwest Arctic Borough are middle school (657 | 30.0%), elementary school (623 | 28.5%), and high school (522 | 23.9%).
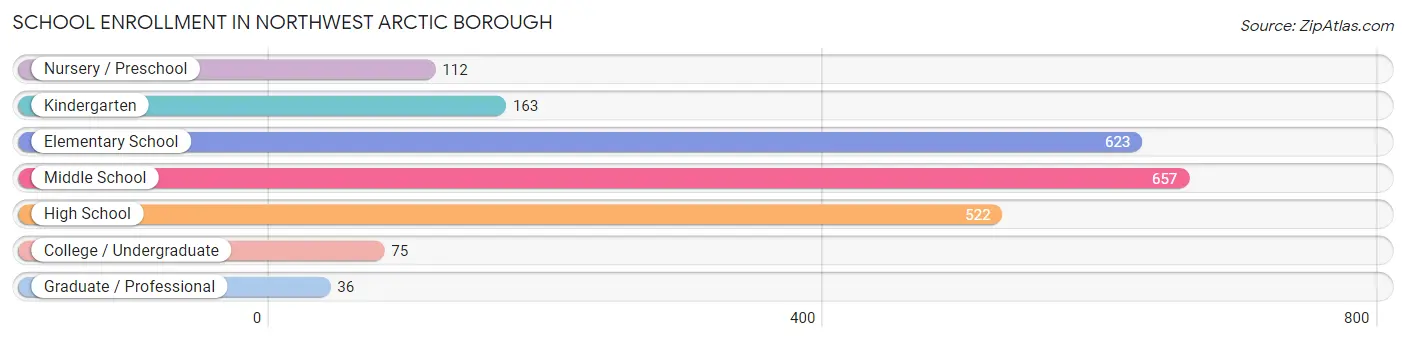
| School Level | # Students | % Students |
| Nursery / Preschool | 112 | 5.1% |
| Kindergarten | 163 | 7.4% |
| Elementary School | 623 | 28.5% |
| Middle School | 657 | 30.0% |
| High School | 522 | 23.9% |
| College / Undergraduate | 75 | 3.4% |
| Graduate / Professional | 36 | 1.7% |
| Total | 2,188 | 100.0% |
School Enrollment by Age by Funding Source in Northwest Arctic Borough
Out of a total of 2,188 students who are enrolled in schools in Northwest Arctic Borough, 74 (3.4%) attend a private institution, while the remaining 2,114 (96.6%) are enrolled in public schools. The age group of 25 to 34 year olds has the highest likelihood of being enrolled in private schools, with 13 (36.1% in the age bracket) enrolled. Conversely, the age group of 5 to 9 year old has the lowest likelihood of being enrolled in a private school, with 738 (98.5% in the age bracket) attending a public institution.
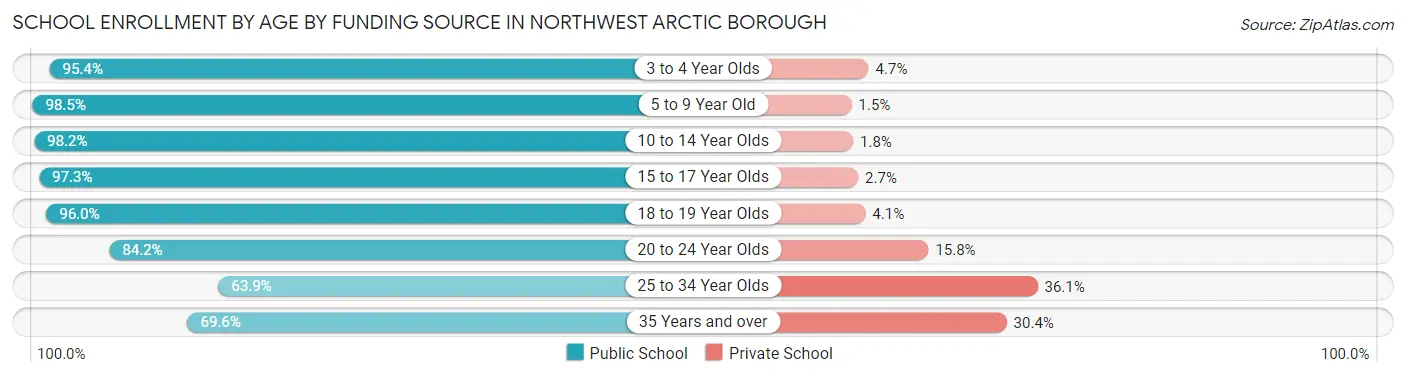
| Age Bracket | Public School | Private School |
| 3 to 4 Year Olds | 82 (95.4%) | 4 (4.6%) |
| 5 to 9 Year Old | 738 (98.5%) | 11 (1.5%) |
| 10 to 14 Year Olds | 783 (98.2%) | 14 (1.8%) |
| 15 to 17 Year Olds | 361 (97.3%) | 10 (2.7%) |
| 18 to 19 Year Olds | 71 (96.0%) | 3 (4.1%) |
| 20 to 24 Year Olds | 16 (84.2%) | 3 (15.8%) |
| 25 to 34 Year Olds | 23 (63.9%) | 13 (36.1%) |
| 35 Years and over | 39 (69.6%) | 17 (30.4%) |
| Total | 2,114 (96.6%) | 74 (3.4%) |
Educational Attainment by Field of Study in Northwest Arctic Borough
Business (159 | 23.3%), education (128 | 18.7%), science & technology (90 | 13.2%), bio, nature & agricultural (59 | 8.6%), and liberal arts & history (57 | 8.4%) are the most common fields of study among 683 individuals in Northwest Arctic Borough who have obtained a bachelor's degree or higher.
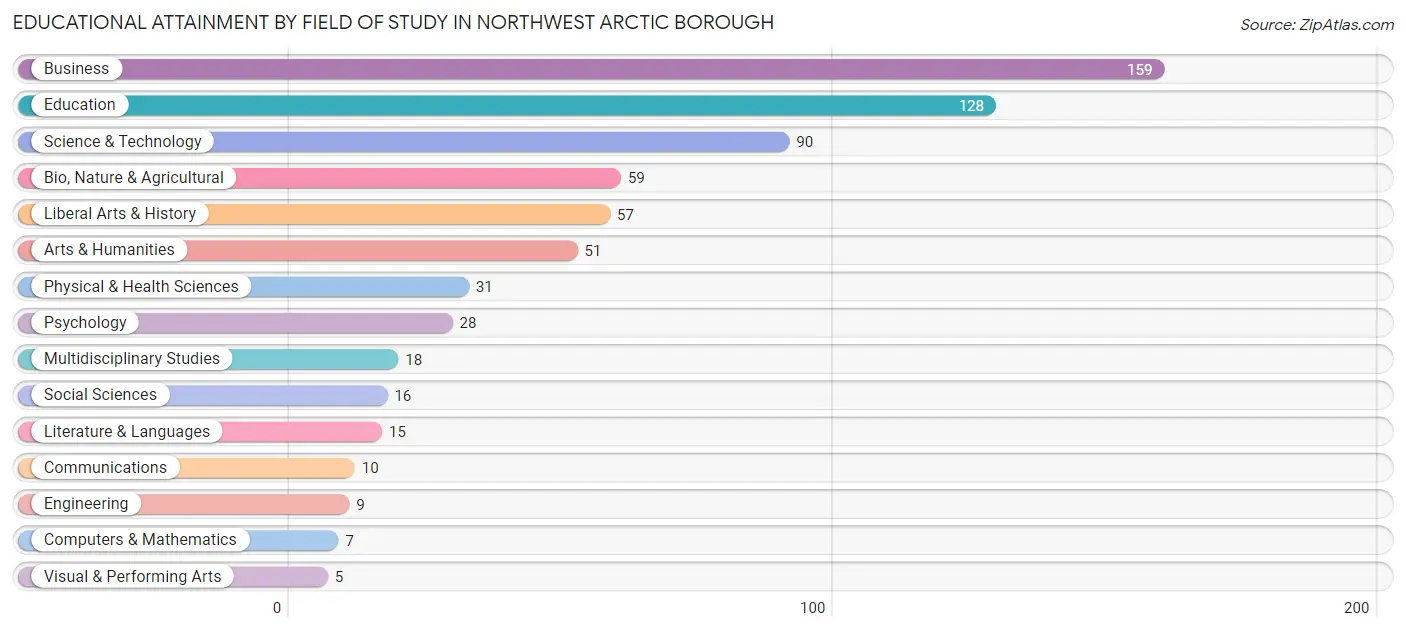
| Field of Study | # Graduates | % Graduates |
| Computers & Mathematics | 7 | 1.0% |
| Bio, Nature & Agricultural | 59 | 8.6% |
| Physical & Health Sciences | 31 | 4.5% |
| Psychology | 28 | 4.1% |
| Social Sciences | 16 | 2.3% |
| Engineering | 9 | 1.3% |
| Multidisciplinary Studies | 18 | 2.6% |
| Science & Technology | 90 | 13.2% |
| Business | 159 | 23.3% |
| Education | 128 | 18.7% |
| Literature & Languages | 15 | 2.2% |
| Liberal Arts & History | 57 | 8.4% |
| Visual & Performing Arts | 5 | 0.7% |
| Communications | 10 | 1.5% |
| Arts & Humanities | 51 | 7.5% |
| Total | 683 | 100.0% |
Transportation & Commute in Northwest Arctic Borough
Vehicle Availability by Sex in Northwest Arctic Borough
The most prevalent vehicle ownership categories in Northwest Arctic Borough are males with no vehicle (591, accounting for 53.0%) and females with no vehicle (490, making up 61.6%).
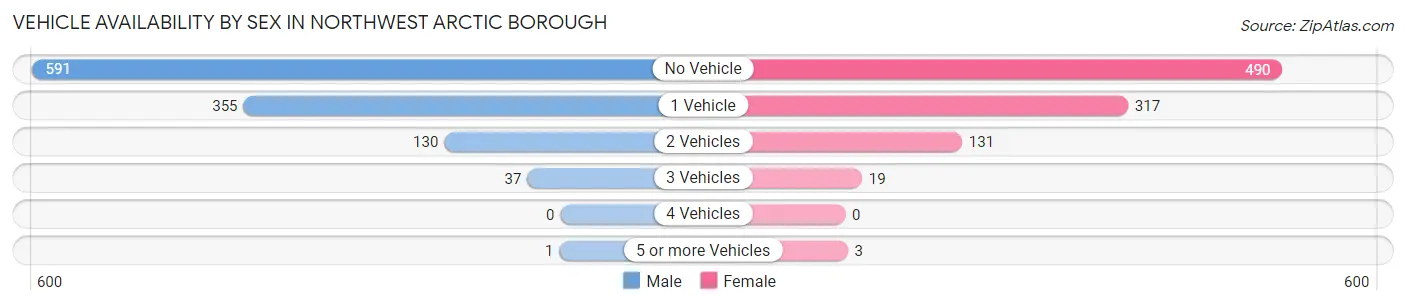
| Vehicles Available | Male | Female |
| No Vehicle | 591 (53.0%) | 490 (51.0%) |
| 1 Vehicle | 355 (31.9%) | 317 (33.0%) |
| 2 Vehicles | 130 (11.7%) | 131 (13.7%) |
| 3 Vehicles | 37 (3.3%) | 19 (2.0%) |
| 4 Vehicles | 0 (0.0%) | 0 (0.0%) |
| 5 or more Vehicles | 1 (0.1%) | 3 (0.3%) |
| Total | 1,114 (100.0%) | 960 (100.0%) |
Commute Time in Northwest Arctic Borough
The most frequently occuring commute durations in Northwest Arctic Borough are 5 to 9 minutes (918 commuters, 38.1%), less than 5 minutes (917 commuters, 38.1%), and 10 to 14 minutes (434 commuters, 18.0%).
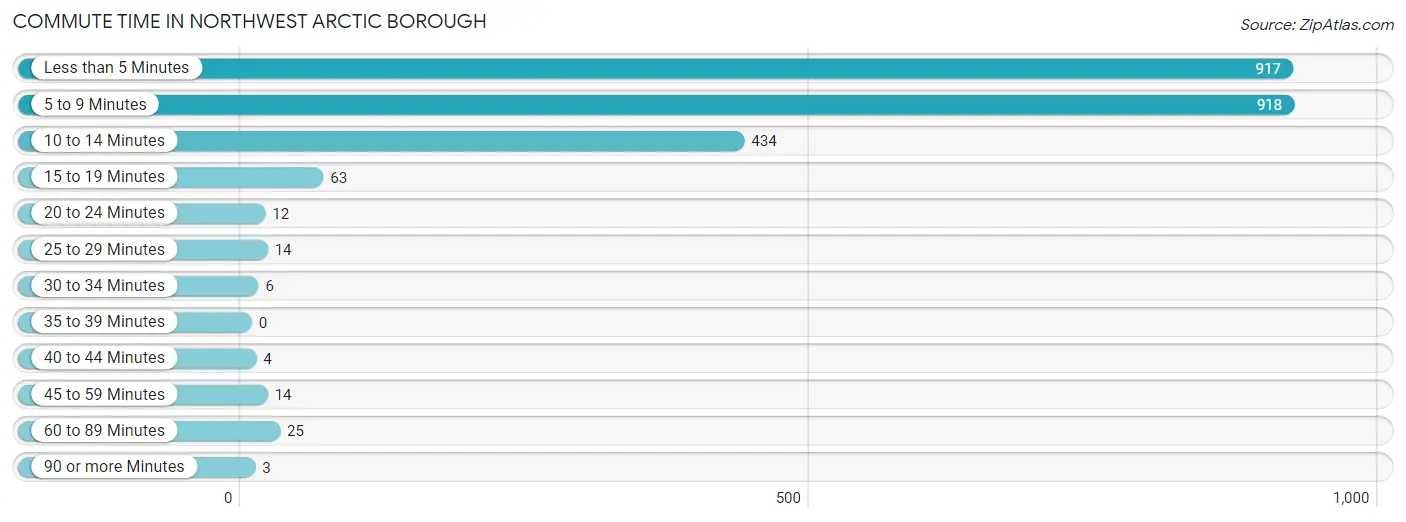
| Commute Time | # Commuters | % Commuters |
| Less than 5 Minutes | 917 | 38.1% |
| 5 to 9 Minutes | 918 | 38.1% |
| 10 to 14 Minutes | 434 | 18.0% |
| 15 to 19 Minutes | 63 | 2.6% |
| 20 to 24 Minutes | 12 | 0.5% |
| 25 to 29 Minutes | 14 | 0.6% |
| 30 to 34 Minutes | 6 | 0.3% |
| 35 to 39 Minutes | 0 | 0.0% |
| 40 to 44 Minutes | 4 | 0.2% |
| 45 to 59 Minutes | 14 | 0.6% |
| 60 to 89 Minutes | 25 | 1.0% |
| 90 or more Minutes | 3 | 0.1% |
Commute Time by Sex in Northwest Arctic Borough
The most common commute times in Northwest Arctic Borough are 5 to 9 minutes (476 commuters, 36.8%) for males and less than 5 minutes (467 commuters, 41.8%) for females.
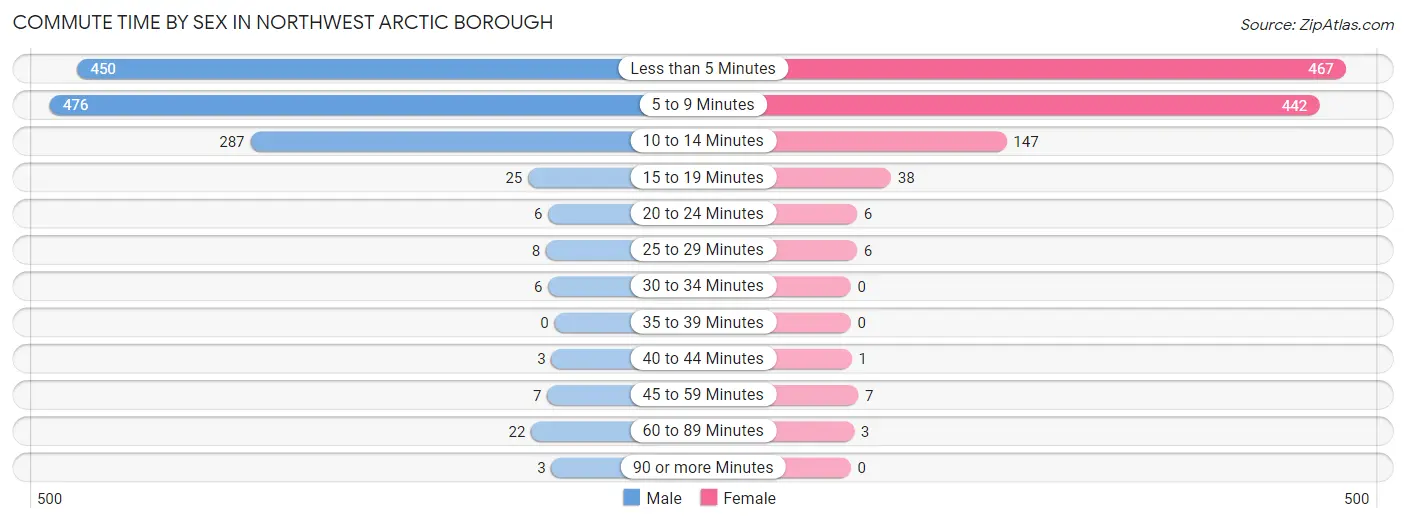
| Commute Time | Male | Female |
| Less than 5 Minutes | 450 (34.8%) | 467 (41.8%) |
| 5 to 9 Minutes | 476 (36.8%) | 442 (39.6%) |
| 10 to 14 Minutes | 287 (22.2%) | 147 (13.2%) |
| 15 to 19 Minutes | 25 (1.9%) | 38 (3.4%) |
| 20 to 24 Minutes | 6 (0.5%) | 6 (0.5%) |
| 25 to 29 Minutes | 8 (0.6%) | 6 (0.5%) |
| 30 to 34 Minutes | 6 (0.5%) | 0 (0.0%) |
| 35 to 39 Minutes | 0 (0.0%) | 0 (0.0%) |
| 40 to 44 Minutes | 3 (0.2%) | 1 (0.1%) |
| 45 to 59 Minutes | 7 (0.5%) | 7 (0.6%) |
| 60 to 89 Minutes | 22 (1.7%) | 3 (0.3%) |
| 90 or more Minutes | 3 (0.2%) | 0 (0.0%) |
Time of Departure to Work by Sex in Northwest Arctic Borough
The most frequent times of departure to work in Northwest Arctic Borough are 7:30 AM to 7:59 AM (363, 28.1%) for males and 7:30 AM to 7:59 AM (531, 47.5%) for females.
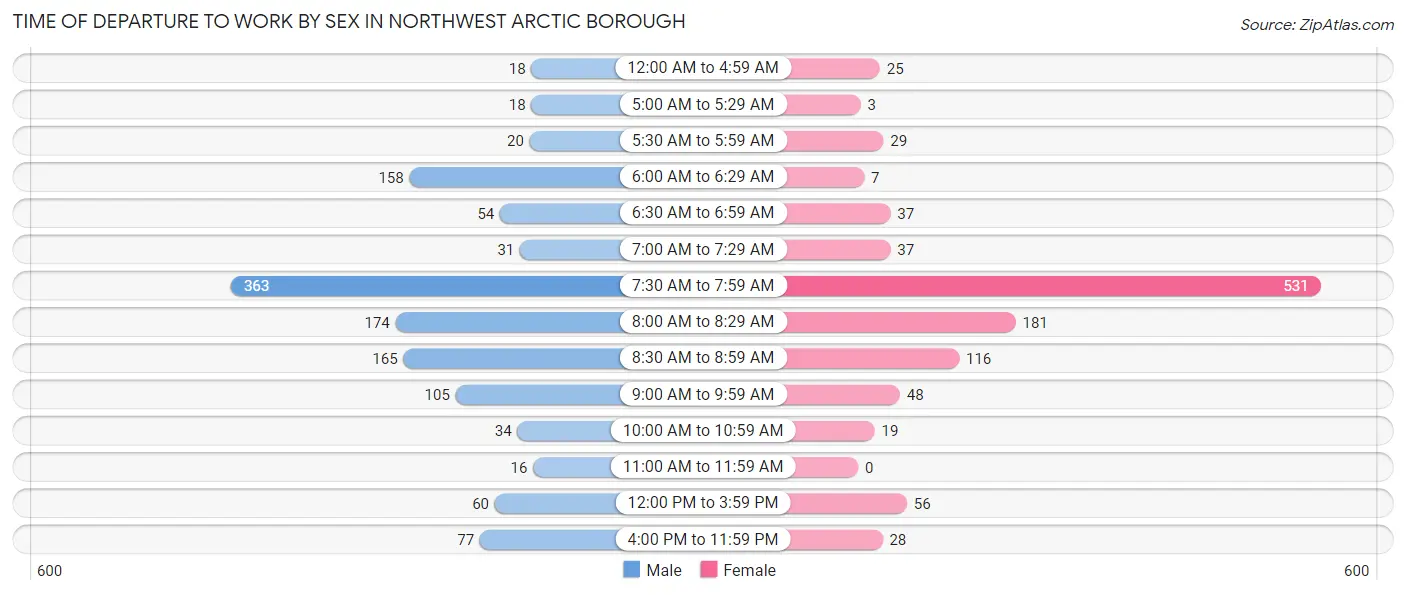
| Time of Departure | Male | Female |
| 12:00 AM to 4:59 AM | 18 (1.4%) | 25 (2.2%) |
| 5:00 AM to 5:29 AM | 18 (1.4%) | 3 (0.3%) |
| 5:30 AM to 5:59 AM | 20 (1.5%) | 29 (2.6%) |
| 6:00 AM to 6:29 AM | 158 (12.2%) | 7 (0.6%) |
| 6:30 AM to 6:59 AM | 54 (4.2%) | 37 (3.3%) |
| 7:00 AM to 7:29 AM | 31 (2.4%) | 37 (3.3%) |
| 7:30 AM to 7:59 AM | 363 (28.1%) | 531 (47.5%) |
| 8:00 AM to 8:29 AM | 174 (13.5%) | 181 (16.2%) |
| 8:30 AM to 8:59 AM | 165 (12.8%) | 116 (10.4%) |
| 9:00 AM to 9:59 AM | 105 (8.1%) | 48 (4.3%) |
| 10:00 AM to 10:59 AM | 34 (2.6%) | 19 (1.7%) |
| 11:00 AM to 11:59 AM | 16 (1.2%) | 0 (0.0%) |
| 12:00 PM to 3:59 PM | 60 (4.6%) | 56 (5.0%) |
| 4:00 PM to 11:59 PM | 77 (6.0%) | 28 (2.5%) |
| Total | 1,293 (100.0%) | 1,117 (100.0%) |
Housing Occupancy in Northwest Arctic Borough
Occupancy by Ownership in Northwest Arctic Borough
Of the total 1,776 dwellings in Northwest Arctic Borough, owner-occupied units account for 1,083 (61.0%), while renter-occupied units make up 693 (39.0%).
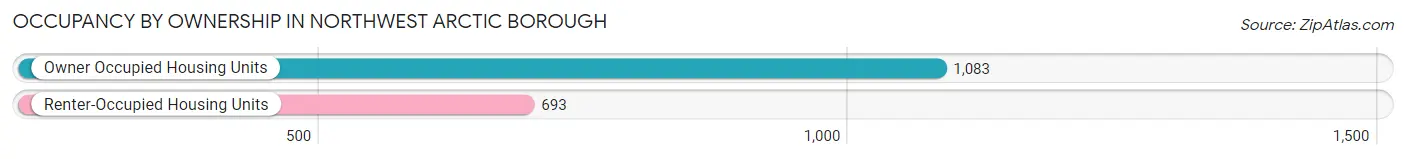
| Occupancy | # Housing Units | % Housing Units |
| Owner Occupied Housing Units | 1,083 | 61.0% |
| Renter-Occupied Housing Units | 693 | 39.0% |
| Total Occupied Housing Units | 1,776 | 100.0% |
Occupancy by Household Size in Northwest Arctic Borough
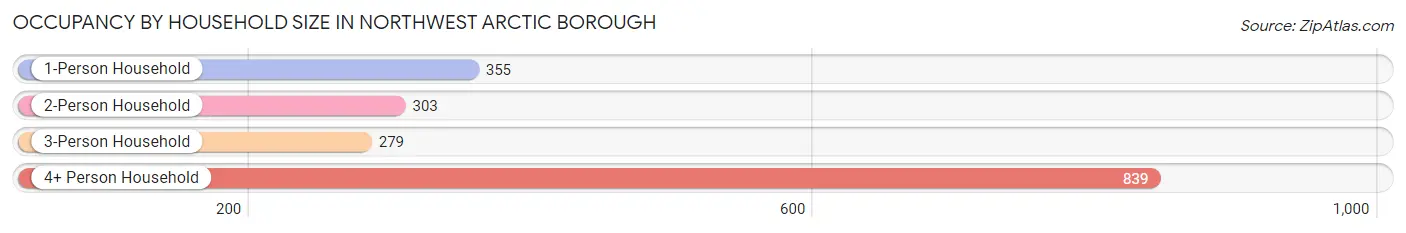
| Household Size | # Housing Units | % Housing Units |
| 1-Person Household | 355 | 20.0% |
| 2-Person Household | 303 | 17.1% |
| 3-Person Household | 279 | 15.7% |
| 4+ Person Household | 839 | 47.2% |
| Total Housing Units | 1,776 | 100.0% |
Occupancy by Ownership by Household Size in Northwest Arctic Borough
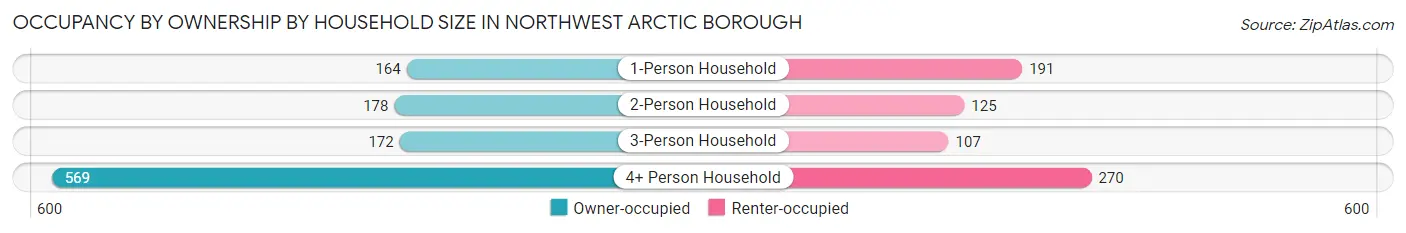
| Household Size | Owner-occupied | Renter-occupied |
| 1-Person Household | 164 (46.2%) | 191 (53.8%) |
| 2-Person Household | 178 (58.8%) | 125 (41.2%) |
| 3-Person Household | 172 (61.7%) | 107 (38.4%) |
| 4+ Person Household | 569 (67.8%) | 270 (32.2%) |
| Total Housing Units | 1,083 (61.0%) | 693 (39.0%) |
Occupancy by Educational Attainment in Northwest Arctic Borough
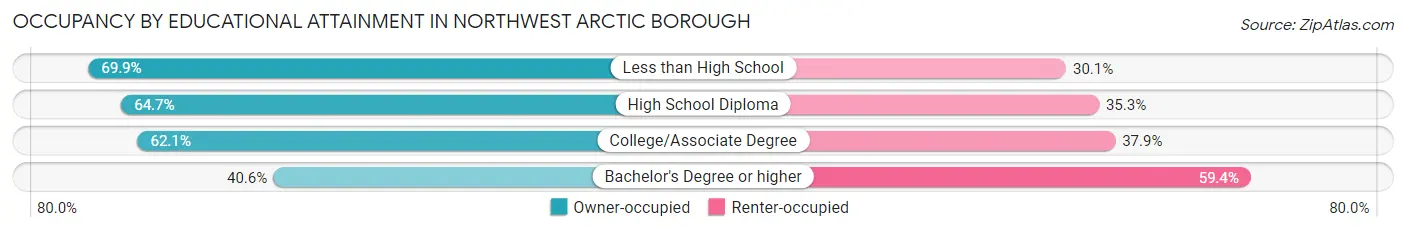
| Household Size | Owner-occupied | Renter-occupied |
| Less than High School | 181 (69.9%) | 78 (30.1%) |
| High School Diploma | 463 (64.7%) | 253 (35.3%) |
| College/Associate Degree | 329 (62.1%) | 201 (37.9%) |
| Bachelor's Degree or higher | 110 (40.6%) | 161 (59.4%) |
Occupancy by Age of Householder in Northwest Arctic Borough
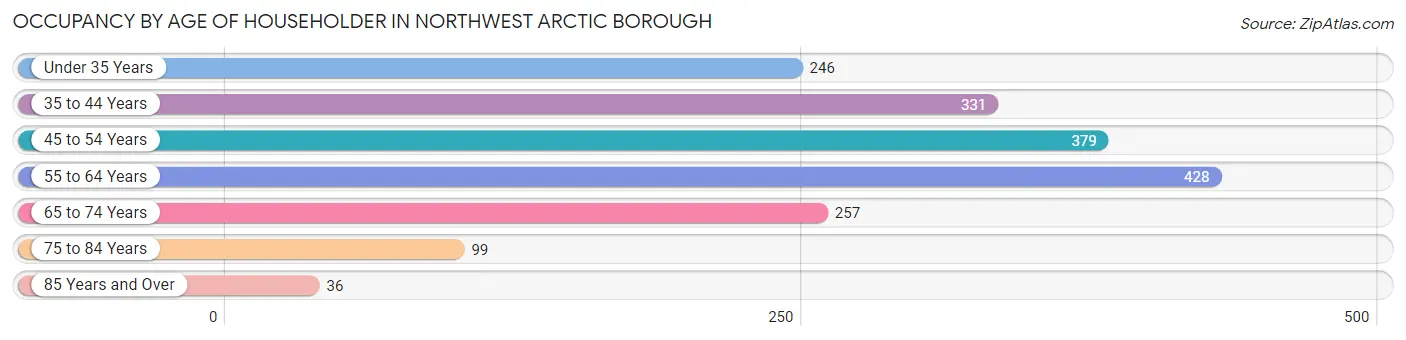
| Age Bracket | # Households | % Households |
| Under 35 Years | 246 | 13.9% |
| 35 to 44 Years | 331 | 18.6% |
| 45 to 54 Years | 379 | 21.3% |
| 55 to 64 Years | 428 | 24.1% |
| 65 to 74 Years | 257 | 14.5% |
| 75 to 84 Years | 99 | 5.6% |
| 85 Years and Over | 36 | 2.0% |
| Total | 1,776 | 100.0% |
Housing Finances in Northwest Arctic Borough
Median Income by Occupancy in Northwest Arctic Borough
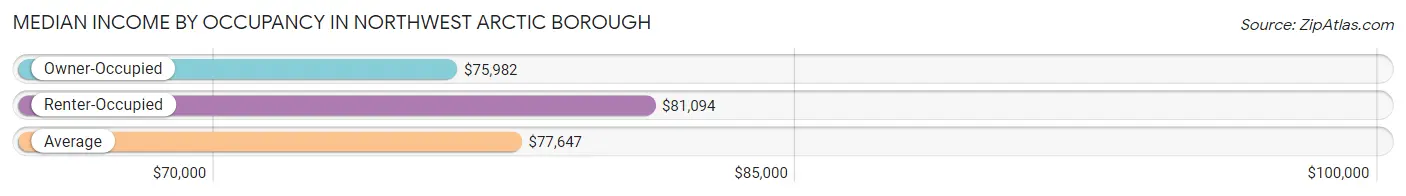
| Occupancy Type | # Households | Median Income |
| Owner-Occupied | 1,083 (61.0%) | $75,982 |
| Renter-Occupied | 693 (39.0%) | $81,094 |
| Average | 1,776 (100.0%) | $77,647 |
Occupancy by Householder Income Bracket in Northwest Arctic Borough
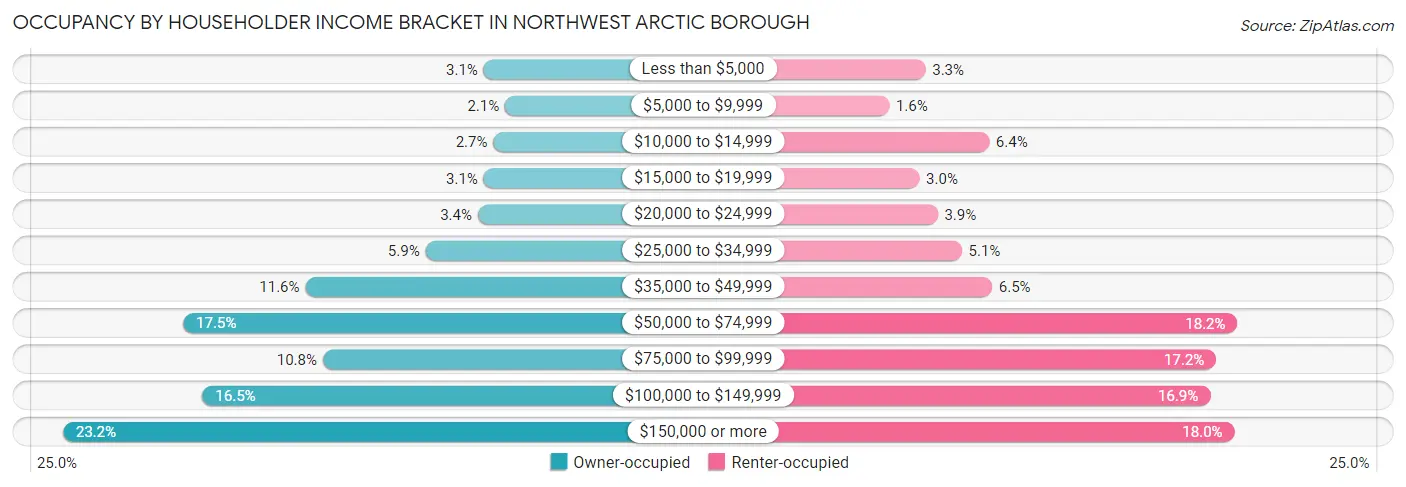
| Income Bracket | Owner-occupied | Renter-occupied |
| Less than $5,000 | 34 (3.1%) | 23 (3.3%) |
| $5,000 to $9,999 | 23 (2.1%) | 11 (1.6%) |
| $10,000 to $14,999 | 29 (2.7%) | 44 (6.4%) |
| $15,000 to $19,999 | 34 (3.1%) | 21 (3.0%) |
| $20,000 to $24,999 | 37 (3.4%) | 27 (3.9%) |
| $25,000 to $34,999 | 64 (5.9%) | 35 (5.1%) |
| $35,000 to $49,999 | 126 (11.6%) | 45 (6.5%) |
| $50,000 to $74,999 | 189 (17.4%) | 126 (18.2%) |
| $75,000 to $99,999 | 117 (10.8%) | 119 (17.2%) |
| $100,000 to $149,999 | 179 (16.5%) | 117 (16.9%) |
| $150,000 or more | 251 (23.2%) | 125 (18.0%) |
| Total | 1,083 (100.0%) | 693 (100.0%) |
Monthly Housing Cost Tiers in Northwest Arctic Borough
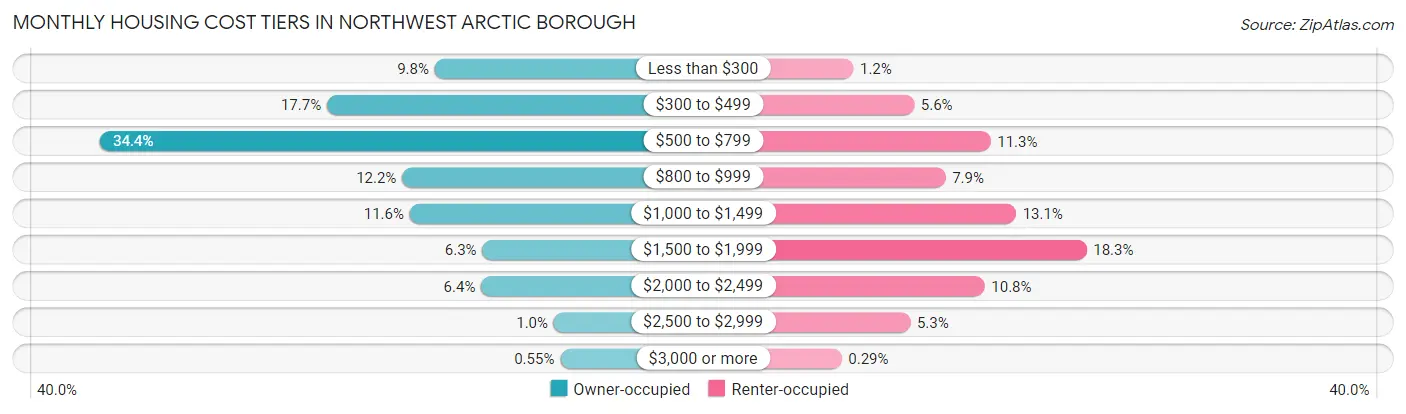
| Monthly Cost | Owner-occupied | Renter-occupied |
| Less than $300 | 106 (9.8%) | 8 (1.1%) |
| $300 to $499 | 192 (17.7%) | 39 (5.6%) |
| $500 to $799 | 373 (34.4%) | 78 (11.3%) |
| $800 to $999 | 132 (12.2%) | 55 (7.9%) |
| $1,000 to $1,499 | 126 (11.6%) | 91 (13.1%) |
| $1,500 to $1,999 | 68 (6.3%) | 127 (18.3%) |
| $2,000 to $2,499 | 69 (6.4%) | 75 (10.8%) |
| $2,500 to $2,999 | 11 (1.0%) | 37 (5.3%) |
| $3,000 or more | 6 (0.5%) | 2 (0.3%) |
| Total | 1,083 (100.0%) | 693 (100.0%) |
Physical Housing Characteristics in Northwest Arctic Borough
Housing Structures in Northwest Arctic Borough
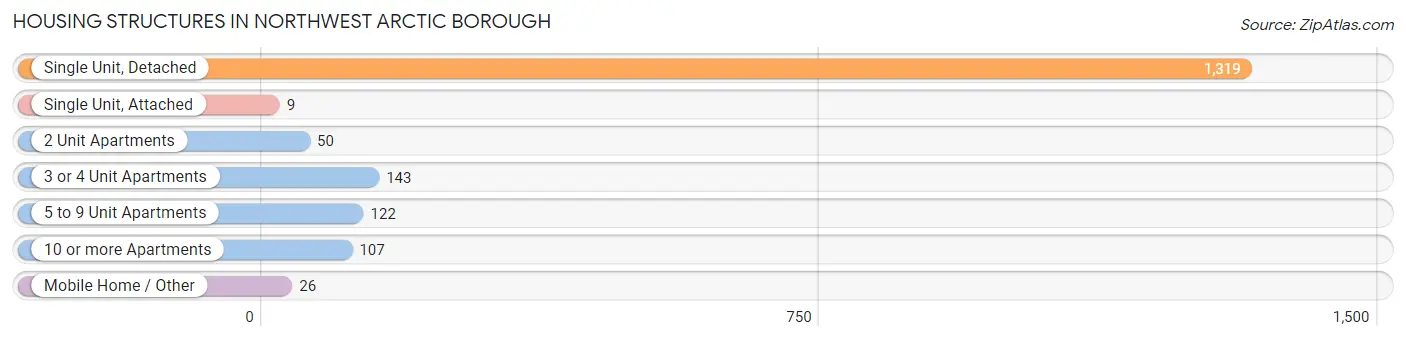
| Structure Type | # Housing Units | % Housing Units |
| Single Unit, Detached | 1,319 | 74.3% |
| Single Unit, Attached | 9 | 0.5% |
| 2 Unit Apartments | 50 | 2.8% |
| 3 or 4 Unit Apartments | 143 | 8.1% |
| 5 to 9 Unit Apartments | 122 | 6.9% |
| 10 or more Apartments | 107 | 6.0% |
| Mobile Home / Other | 26 | 1.5% |
| Total | 1,776 | 100.0% |
Housing Structures by Occupancy in Northwest Arctic Borough
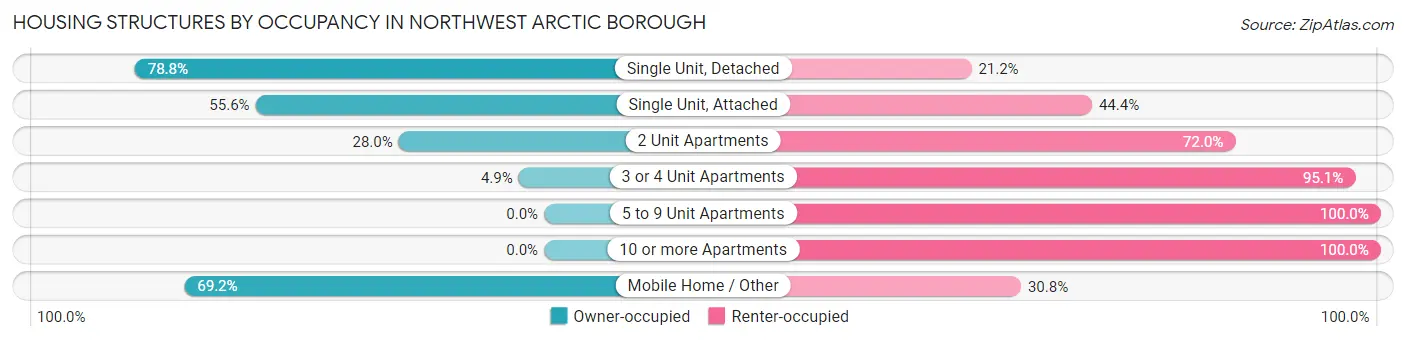
| Structure Type | Owner-occupied | Renter-occupied |
| Single Unit, Detached | 1,039 (78.8%) | 280 (21.2%) |
| Single Unit, Attached | 5 (55.6%) | 4 (44.4%) |
| 2 Unit Apartments | 14 (28.0%) | 36 (72.0%) |
| 3 or 4 Unit Apartments | 7 (4.9%) | 136 (95.1%) |
| 5 to 9 Unit Apartments | 0 (0.0%) | 122 (100.0%) |
| 10 or more Apartments | 0 (0.0%) | 107 (100.0%) |
| Mobile Home / Other | 18 (69.2%) | 8 (30.8%) |
| Total | 1,083 (61.0%) | 693 (39.0%) |
Housing Structures by Number of Rooms in Northwest Arctic Borough
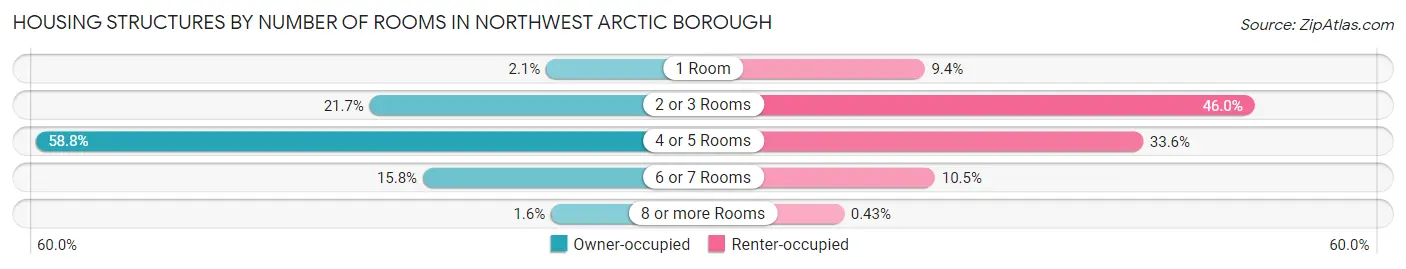
| Number of Rooms | Owner-occupied | Renter-occupied |
| 1 Room | 23 (2.1%) | 65 (9.4%) |
| 2 or 3 Rooms | 235 (21.7%) | 319 (46.0%) |
| 4 or 5 Rooms | 637 (58.8%) | 233 (33.6%) |
| 6 or 7 Rooms | 171 (15.8%) | 73 (10.5%) |
| 8 or more Rooms | 17 (1.6%) | 3 (0.4%) |
| Total | 1,083 (100.0%) | 693 (100.0%) |
Housing Structure by Heating Type in Northwest Arctic Borough
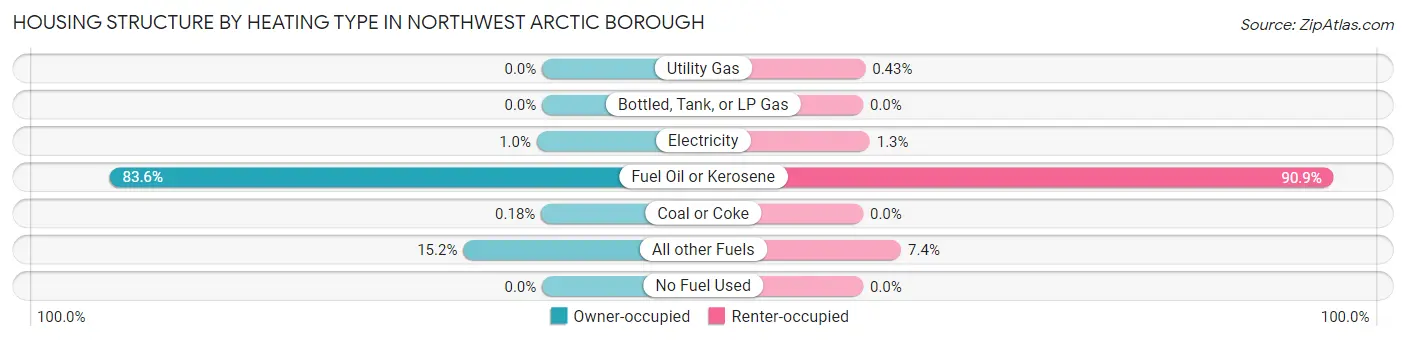
| Heating Type | Owner-occupied | Renter-occupied |
| Utility Gas | 0 (0.0%) | 3 (0.4%) |
| Bottled, Tank, or LP Gas | 0 (0.0%) | 0 (0.0%) |
| Electricity | 11 (1.0%) | 9 (1.3%) |
| Fuel Oil or Kerosene | 905 (83.6%) | 630 (90.9%) |
| Coal or Coke | 2 (0.2%) | 0 (0.0%) |
| All other Fuels | 165 (15.2%) | 51 (7.4%) |
| No Fuel Used | 0 (0.0%) | 0 (0.0%) |
| Total | 1,083 (100.0%) | 693 (100.0%) |
Household Vehicle Usage in Northwest Arctic Borough
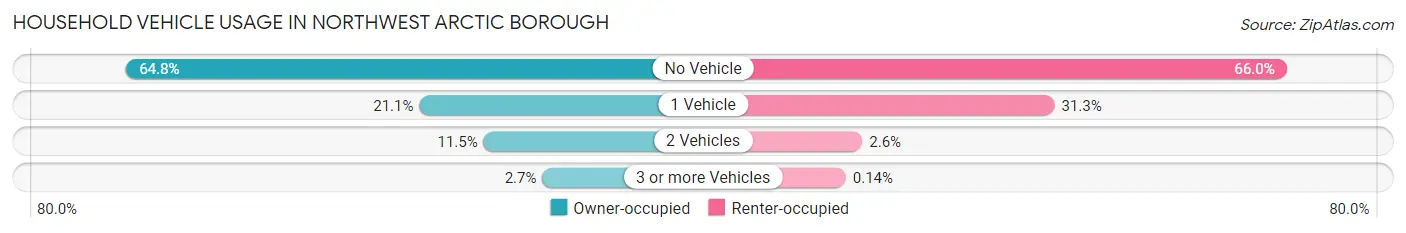
| Vehicles per Household | Owner-occupied | Renter-occupied |
| No Vehicle | 702 (64.8%) | 457 (65.9%) |
| 1 Vehicle | 228 (21.0%) | 217 (31.3%) |
| 2 Vehicles | 124 (11.5%) | 18 (2.6%) |
| 3 or more Vehicles | 29 (2.7%) | 1 (0.1%) |
| Total | 1,083 (100.0%) | 693 (100.0%) |
Real Estate & Mortgages in Northwest Arctic Borough
Real Estate and Mortgage Overview in Northwest Arctic Borough
| Characteristic | Without Mortgage | With Mortgage |
| Housing Units | 809 | 274 |
| Median Property Value | $110,100 | $236,600 |
| Median Household Income | $66,083 | $95 |
| Monthly Housing Costs | $609 | $6 |
| Real Estate Taxes | $199 | $265 |
Property Value by Mortgage Status in Northwest Arctic Borough
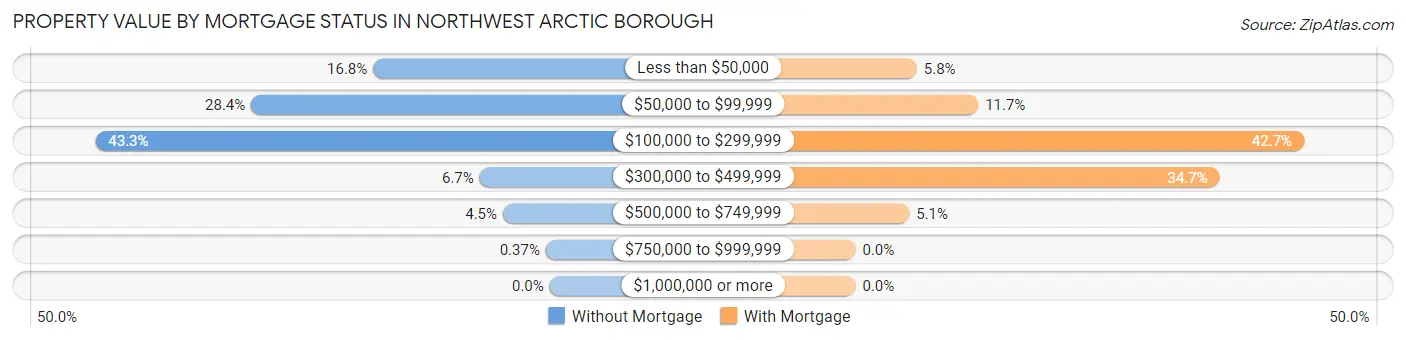
| Property Value | Without Mortgage | With Mortgage |
| Less than $50,000 | 136 (16.8%) | 16 (5.8%) |
| $50,000 to $99,999 | 230 (28.4%) | 32 (11.7%) |
| $100,000 to $299,999 | 350 (43.3%) | 117 (42.7%) |
| $300,000 to $499,999 | 54 (6.7%) | 95 (34.7%) |
| $500,000 to $749,999 | 36 (4.4%) | 14 (5.1%) |
| $750,000 to $999,999 | 3 (0.4%) | 0 (0.0%) |
| $1,000,000 or more | 0 (0.0%) | 0 (0.0%) |
| Total | 809 (100.0%) | 274 (100.0%) |
Household Income by Mortgage Status in Northwest Arctic Borough
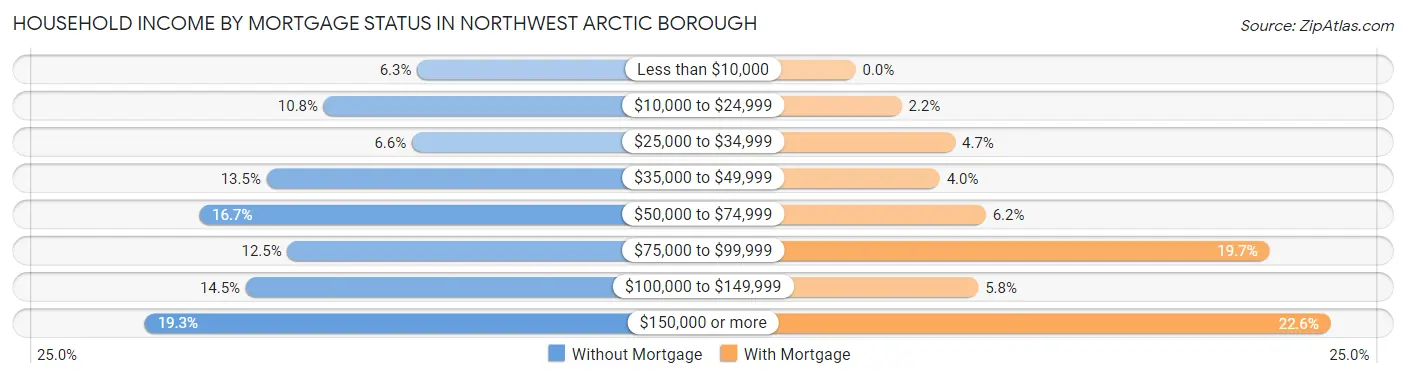
| Household Income | Without Mortgage | With Mortgage |
| Less than $10,000 | 51 (6.3%) | 0 (0.0%) |
| $10,000 to $24,999 | 87 (10.7%) | 6 (2.2%) |
| $25,000 to $34,999 | 53 (6.6%) | 13 (4.7%) |
| $35,000 to $49,999 | 109 (13.5%) | 11 (4.0%) |
| $50,000 to $74,999 | 135 (16.7%) | 17 (6.2%) |
| $75,000 to $99,999 | 101 (12.5%) | 54 (19.7%) |
| $100,000 to $149,999 | 117 (14.5%) | 16 (5.8%) |
| $150,000 or more | 156 (19.3%) | 62 (22.6%) |
| Total | 809 (100.0%) | 274 (100.0%) |
Property Value to Household Income Ratio in Northwest Arctic Borough
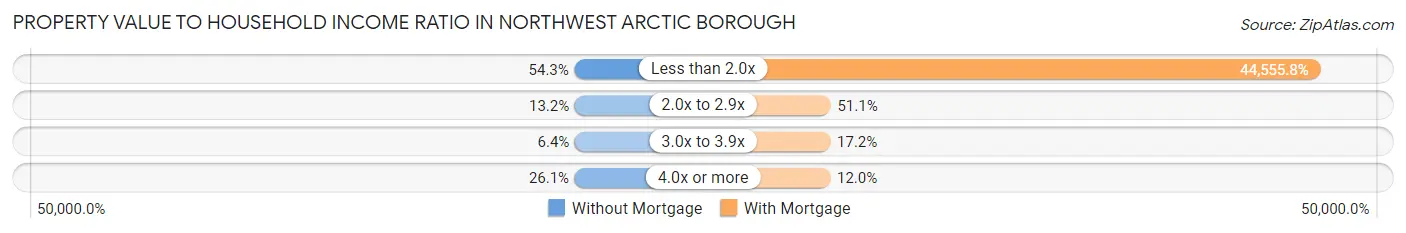
| Value-to-Income Ratio | Without Mortgage | With Mortgage |
| Less than 2.0x | 439 (54.3%) | 122,083 (44,555.8%) |
| 2.0x to 2.9x | 107 (13.2%) | 140 (51.1%) |
| 3.0x to 3.9x | 52 (6.4%) | 47 (17.2%) |
| 4.0x or more | 211 (26.1%) | 33 (12.0%) |
| Total | 809 (100.0%) | 274 (100.0%) |
Real Estate Taxes by Mortgage Status in Northwest Arctic Borough
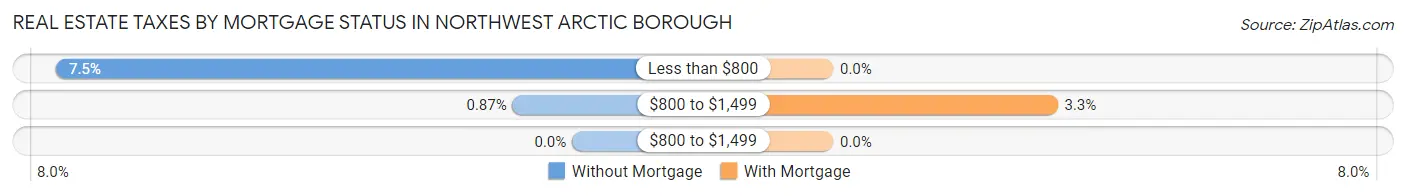
| Property Taxes | Without Mortgage | With Mortgage |
| Less than $800 | 61 (7.5%) | 0 (0.0%) |
| $800 to $1,499 | 7 (0.9%) | 9 (3.3%) |
| $800 to $1,499 | 0 (0.0%) | 0 (0.0%) |
| Total | 809 (100.0%) | 274 (100.0%) |
Health & Disability in Northwest Arctic Borough
Health Insurance Coverage by Age in Northwest Arctic Borough
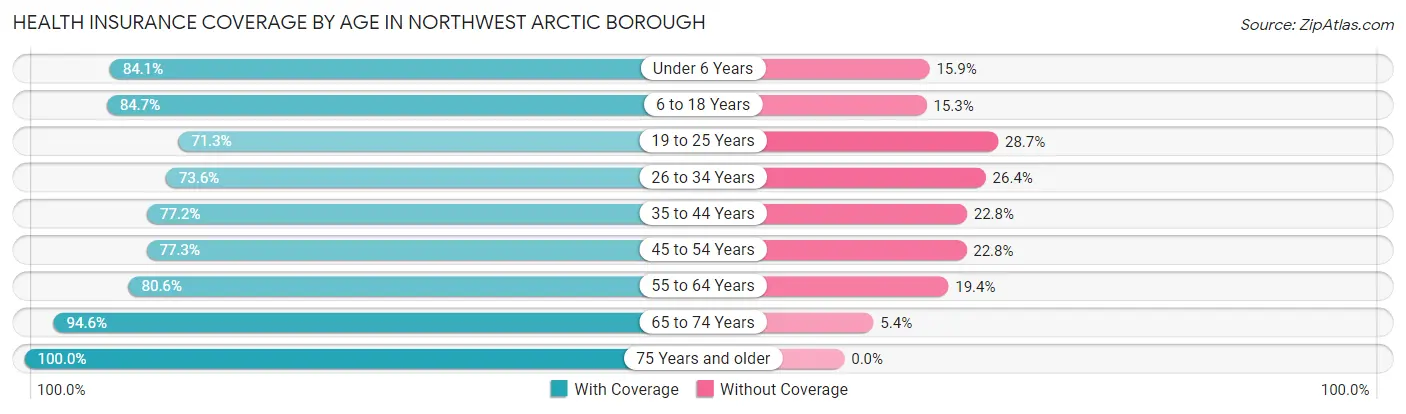
| Age Bracket | With Coverage | Without Coverage |
| Under 6 Years | 810 (84.1%) | 153 (15.9%) |
| 6 to 18 Years | 1,641 (84.7%) | 297 (15.3%) |
| 19 to 25 Years | 428 (71.3%) | 172 (28.7%) |
| 26 to 34 Years | 866 (73.6%) | 310 (26.4%) |
| 35 to 44 Years | 635 (77.2%) | 188 (22.8%) |
| 45 to 54 Years | 574 (77.2%) | 169 (22.8%) |
| 55 to 64 Years | 648 (80.6%) | 156 (19.4%) |
| 65 to 74 Years | 366 (94.6%) | 21 (5.4%) |
| 75 Years and older | 218 (100.0%) | 0 (0.0%) |
| Total | 6,186 (80.8%) | 1,466 (19.2%) |
Health Insurance Coverage by Citizenship Status in Northwest Arctic Borough
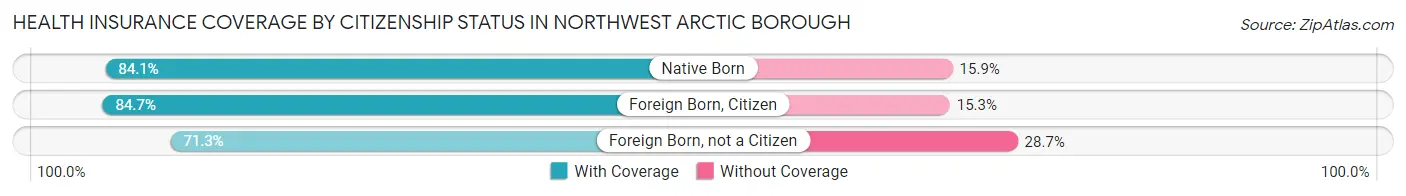
| Citizenship Status | With Coverage | Without Coverage |
| Native Born | 810 (84.1%) | 153 (15.9%) |
| Foreign Born, Citizen | 1,641 (84.7%) | 297 (15.3%) |
| Foreign Born, not a Citizen | 428 (71.3%) | 172 (28.7%) |
Health Insurance Coverage by Household Income in Northwest Arctic Borough
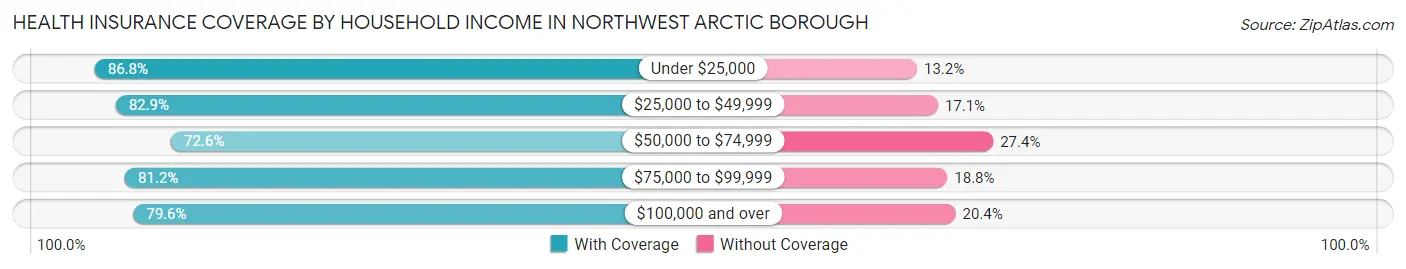
| Household Income | With Coverage | Without Coverage |
| Under $25,000 | 693 (86.8%) | 105 (13.2%) |
| $25,000 to $49,999 | 835 (82.9%) | 172 (17.1%) |
| $50,000 to $74,999 | 931 (72.6%) | 352 (27.4%) |
| $75,000 to $99,999 | 853 (81.2%) | 198 (18.8%) |
| $100,000 and over | 2,412 (79.6%) | 617 (20.4%) |
Public vs Private Health Insurance Coverage by Age in Northwest Arctic Borough
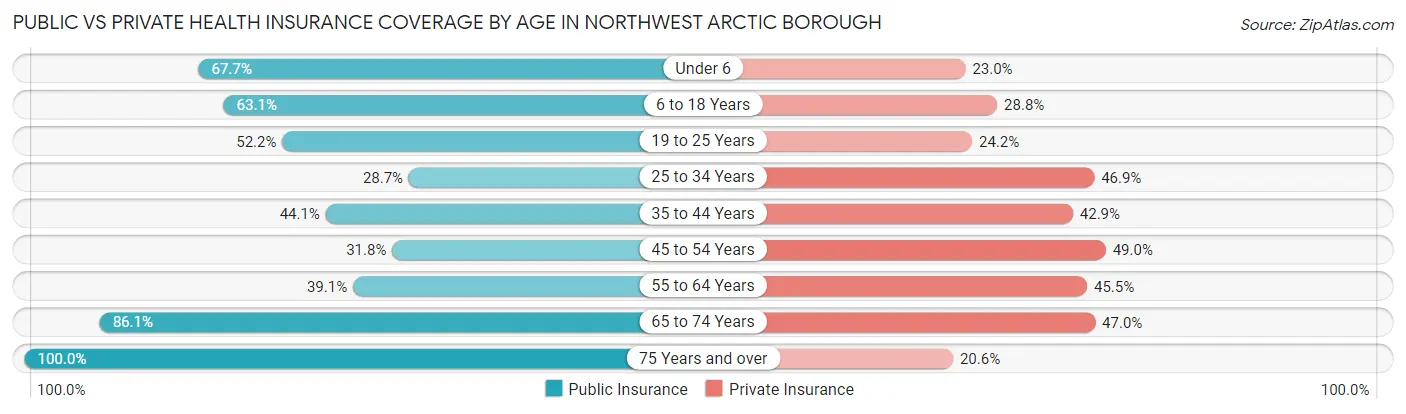
| Age Bracket | Public Insurance | Private Insurance |
| Under 6 | 652 (67.7%) | 221 (23.0%) |
| 6 to 18 Years | 1,222 (63.0%) | 559 (28.8%) |
| 19 to 25 Years | 313 (52.2%) | 145 (24.2%) |
| 25 to 34 Years | 337 (28.7%) | 551 (46.9%) |
| 35 to 44 Years | 363 (44.1%) | 353 (42.9%) |
| 45 to 54 Years | 236 (31.8%) | 364 (49.0%) |
| 55 to 64 Years | 314 (39.1%) | 366 (45.5%) |
| 65 to 74 Years | 333 (86.1%) | 182 (47.0%) |
| 75 Years and over | 218 (100.0%) | 45 (20.6%) |
| Total | 3,988 (52.1%) | 2,786 (36.4%) |
Disability Status by Sex by Age in Northwest Arctic Borough
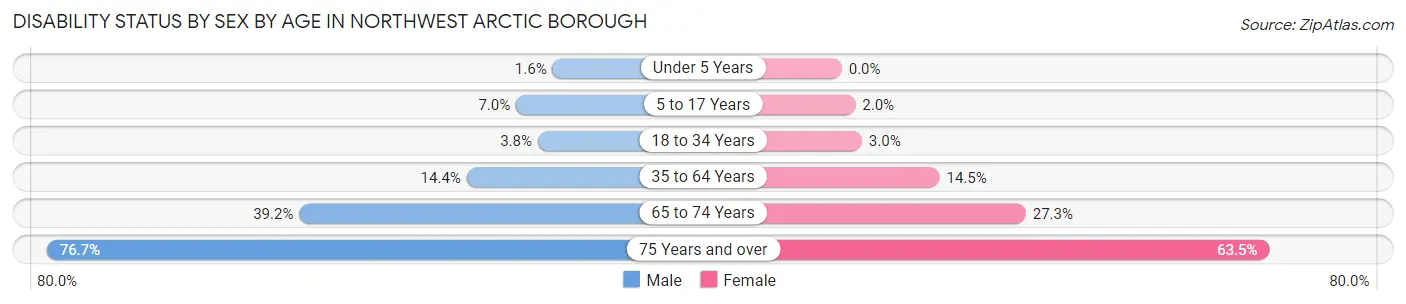
| Age Bracket | Male | Female |
| Under 5 Years | 6 (1.6%) | 0 (0.0%) |
| 5 to 17 Years | 76 (7.0%) | 18 (2.0%) |
| 18 to 34 Years | 39 (3.8%) | 26 (3.0%) |
| 35 to 64 Years | 185 (14.4%) | 157 (14.5%) |
| 65 to 74 Years | 80 (39.2%) | 50 (27.3%) |
| 75 Years and over | 79 (76.7%) | 73 (63.5%) |
Disability Class by Sex by Age in Northwest Arctic Borough
Disability Class: Hearing Difficulty
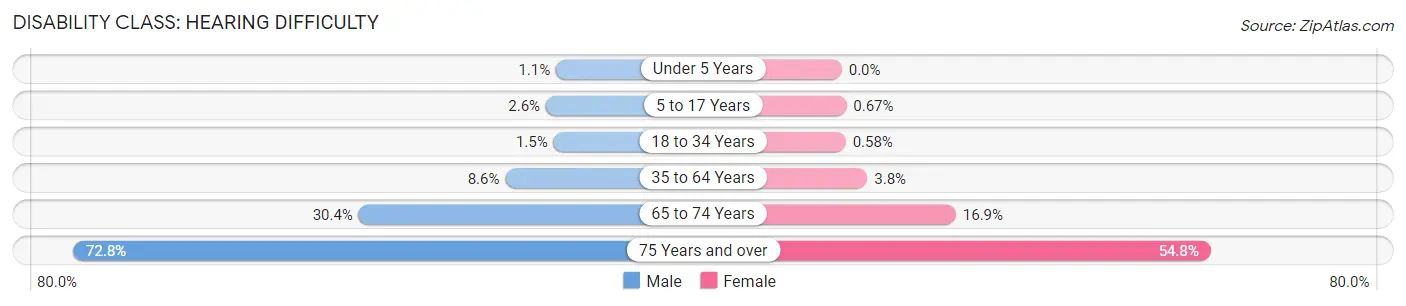
| Age Bracket | Male | Female |
| Under 5 Years | 4 (1.1%) | 0 (0.0%) |
| 5 to 17 Years | 28 (2.6%) | 6 (0.7%) |
| 18 to 34 Years | 15 (1.5%) | 5 (0.6%) |
| 35 to 64 Years | 111 (8.6%) | 41 (3.8%) |
| 65 to 74 Years | 62 (30.4%) | 31 (16.9%) |
| 75 Years and over | 75 (72.8%) | 63 (54.8%) |
Disability Class: Vision Difficulty
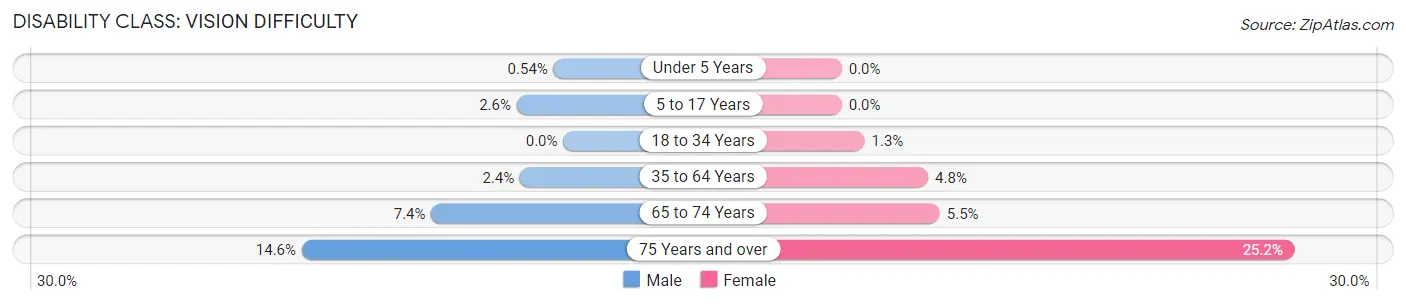
| Age Bracket | Male | Female |
| Under 5 Years | 2 (0.5%) | 0 (0.0%) |
| 5 to 17 Years | 28 (2.6%) | 0 (0.0%) |
| 18 to 34 Years | 0 (0.0%) | 11 (1.3%) |
| 35 to 64 Years | 31 (2.4%) | 52 (4.8%) |
| 65 to 74 Years | 15 (7.3%) | 10 (5.5%) |
| 75 Years and over | 15 (14.6%) | 29 (25.2%) |
Disability Class: Cognitive Difficulty
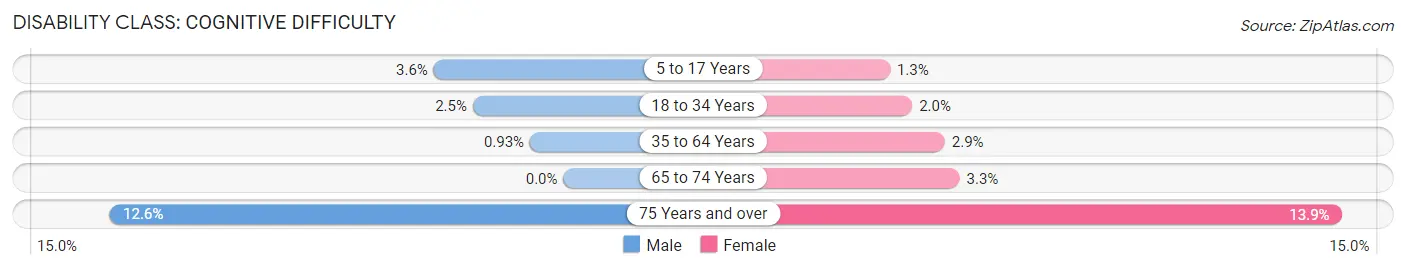
| Age Bracket | Male | Female |
| 5 to 17 Years | 39 (3.6%) | 12 (1.3%) |
| 18 to 34 Years | 26 (2.5%) | 17 (2.0%) |
| 35 to 64 Years | 12 (0.9%) | 31 (2.9%) |
| 65 to 74 Years | 0 (0.0%) | 6 (3.3%) |
| 75 Years and over | 13 (12.6%) | 16 (13.9%) |
Disability Class: Ambulatory Difficulty
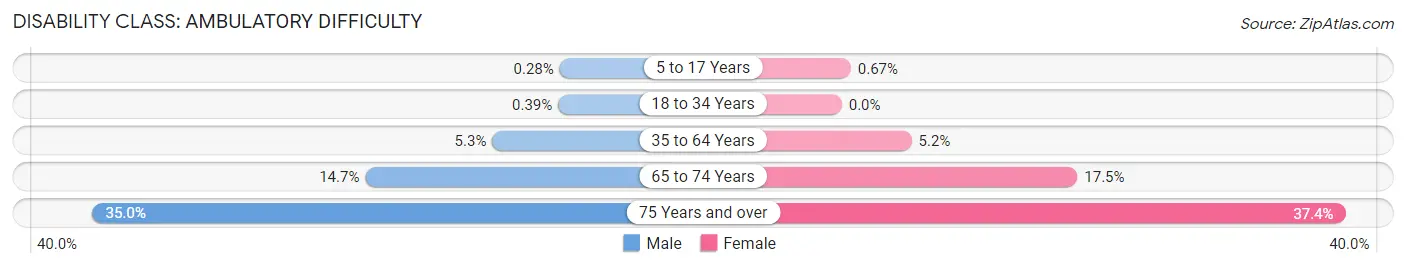
| Age Bracket | Male | Female |
| 5 to 17 Years | 3 (0.3%) | 6 (0.7%) |
| 18 to 34 Years | 4 (0.4%) | 0 (0.0%) |
| 35 to 64 Years | 68 (5.3%) | 56 (5.2%) |
| 65 to 74 Years | 30 (14.7%) | 32 (17.5%) |
| 75 Years and over | 36 (34.9%) | 43 (37.4%) |
Disability Class: Self-Care Difficulty
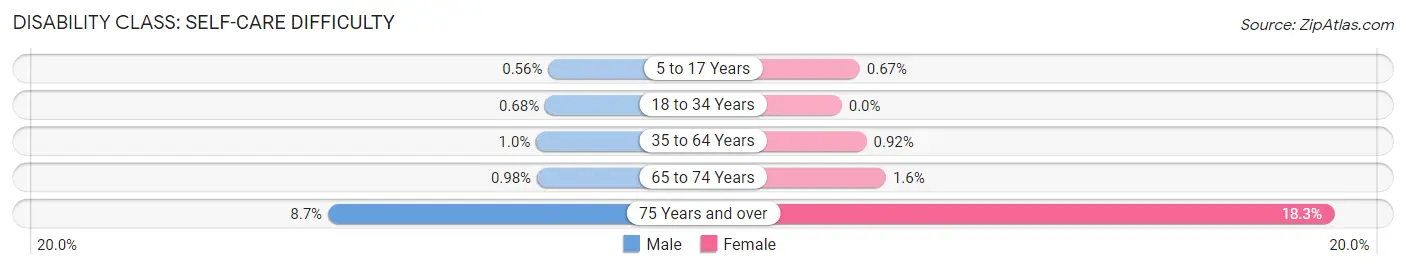
| Age Bracket | Male | Female |
| 5 to 17 Years | 6 (0.6%) | 6 (0.7%) |
| 18 to 34 Years | 7 (0.7%) | 0 (0.0%) |
| 35 to 64 Years | 13 (1.0%) | 10 (0.9%) |
| 65 to 74 Years | 2 (1.0%) | 3 (1.6%) |
| 75 Years and over | 9 (8.7%) | 21 (18.3%) |
Technology Access in Northwest Arctic Borough
Computing Device Access in Northwest Arctic Borough
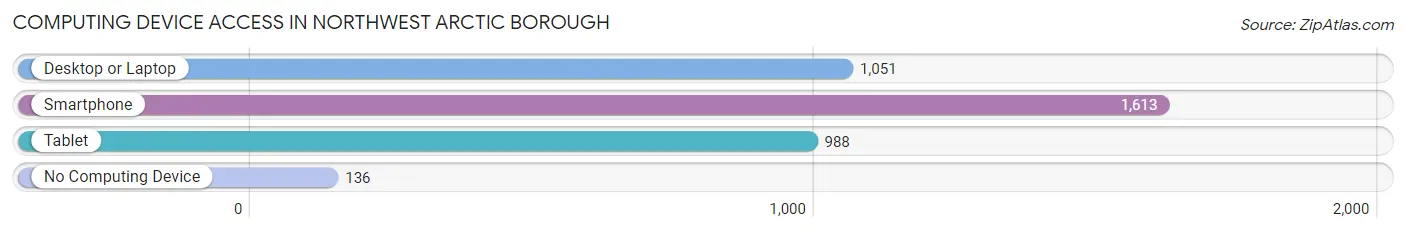
| Device Type | # Households | % Households |
| Desktop or Laptop | 1,051 | 59.2% |
| Smartphone | 1,613 | 90.8% |
| Tablet | 988 | 55.6% |
| No Computing Device | 136 | 7.7% |
| Total | 1,776 | 100.0% |
Internet Access in Northwest Arctic Borough
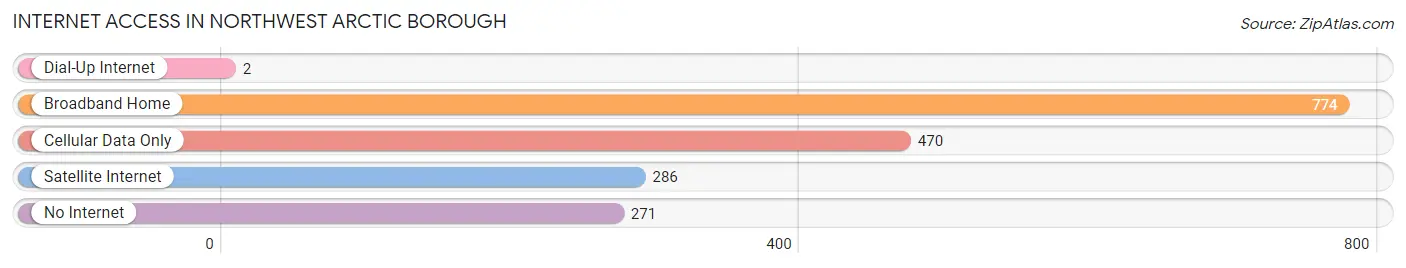
| Internet Type | # Households | % Households |
| Dial-Up Internet | 2 | 0.1% |
| Broadband Home | 774 | 43.6% |
| Cellular Data Only | 470 | 26.5% |
| Satellite Internet | 286 | 16.1% |
| No Internet | 271 | 15.3% |
| Total | 1,776 | 100.0% |
Northwest Arctic Borough Summary
Northwest Arctic Borough is a borough located in the U.S. state of Alaska. It is the second-largest borough in the state, covering an area of approximately 24,000 square miles. The borough is located in the northwest corner of the state, bordering the Chukchi Sea to the north and the Bering Sea to the south. The borough is home to a population of approximately 7,000 people, most of whom are Alaska Native.
History
The area that is now the Northwest Arctic Borough has been inhabited by Alaska Native people for thousands of years. The area was first explored by Europeans in the late 18th century, when Russian explorers arrived in the area. The area was later explored by American whalers and fur traders in the 19th century.
In the early 20th century, the area was part of the Seward Peninsula District, which was established in 1912. In 1975, the area was organized into the Northwest Arctic Borough, which was created by the Alaska State Legislature. The borough was created in order to provide local government services to the area's residents.
Geography
The Northwest Arctic Borough is located in the northwest corner of Alaska, bordering the Chukchi Sea to the north and the Bering Sea to the south. The borough covers an area of approximately 24,000 square miles, making it the second-largest borough in the state. The borough is divided into two regions: the North Slope and the Seward Peninsula.
The North Slope region is located in the northern part of the borough and is characterized by tundra and permafrost. The region is home to the Arctic National Wildlife Refuge, which is one of the largest protected areas in the United States. The Seward Peninsula region is located in the southern part of the borough and is characterized by mountains and glaciers.
Economy
The economy of the Northwest Arctic Borough is largely based on subsistence activities, such as hunting, fishing, and gathering. The borough is also home to several oil and gas fields, which provide jobs and revenue for the local economy. The borough also receives revenue from the Alaska Permanent Fund, which is a fund established by the state of Alaska to provide financial assistance to its residents.
Demographics
As of the 2010 census, the population of the Northwest Arctic Borough was 6,922. The population is largely Alaska Native, with approximately 85% of the population identifying as Alaska Native or American Indian. The largest Alaska Native group in the borough is the Inupiat, who make up approximately 75% of the population. The remaining population is made up of other Alaska Native groups, such as the Yup'ik and the Aleut, as well as non-Native people.
The median household income in the borough is $45,000, which is lower than the state median of $60,000. The poverty rate in the borough is also higher than the state average, with approximately 25% of the population living below the poverty line.
Conclusion
The Northwest Arctic Borough is a large and diverse borough located in the northwest corner of Alaska. The borough is home to a population of approximately 7,000 people, most of whom are Alaska Native. The economy of the borough is largely based on subsistence activities, such as hunting, fishing, and gathering. The borough also receives revenue from the Alaska Permanent Fund and from oil and gas fields. The median household income in the borough is lower than the state median, and the poverty rate is higher than the state average.
Common Questions
What is the Total Population of Northwest Arctic Borough?
Total Population of Northwest Arctic Borough is 7,682.
What is the Total Male Population of Northwest Arctic Borough?
Total Male Population of Northwest Arctic Borough is 4,105.
What is the Total Female Population of Northwest Arctic Borough?
Total Female Population of Northwest Arctic Borough is 3,577.
What is the Ratio of Males per 100 Females in Northwest Arctic Borough?
There are 114.76 Males per 100 Females in Northwest Arctic Borough.
What is the Ratio of Females per 100 Males in Northwest Arctic Borough?
There are 87.14 Females per 100 Males in Northwest Arctic Borough.
What is the Median Population Age in Northwest Arctic Borough?
Median Population Age in Northwest Arctic Borough is 29.2 Years.
What is the Average Family Size in Northwest Arctic Borough
Average Family Size in Northwest Arctic Borough is 4.7 People.
What is the Average Household Size in Northwest Arctic Borough
Average Household Size in Northwest Arctic Borough is 4.0 People.
What is Per Capita Income in Northwest Arctic Borough?
Per Capita income in Northwest Arctic Borough is $32,133.
What is the Median Family Income in Northwest Arctic Borough?
Median Family Income in Northwest Arctic Borough is $77,546.
What is the Median Household income in Northwest Arctic Borough?
Median Household Income in Northwest Arctic Borough is $77,647.
What is Income or Wage Gap in Northwest Arctic Borough?
Income or Wage Gap in Northwest Arctic Borough is 11.2%.
Women in Northwest Arctic Borough earn 88.8 cents for every dollar earned by a man.
What is Family Income Deficit in Northwest Arctic Borough?
Family Income Deficit in Northwest Arctic Borough is $13,991.
Families that are below poverty line in Northwest Arctic Borough earn $13,991 less on average than the poverty threshold level.
What is Inequality or Gini Index in Northwest Arctic Borough?
Inequality or Gini Index in Northwest Arctic Borough is 0.42.
How Large is the Labor Force in Northwest Arctic Borough?
There are 3,115 People in the Labor Forcein in Northwest Arctic Borough.
What is the Percentage of People in the Labor Force in Northwest Arctic Borough?
60.2% of People are in the Labor Force in Northwest Arctic Borough.
What is the Unemployment Rate in Northwest Arctic Borough?
Unemployment Rate in Northwest Arctic Borough is 15.5%.