North Slope Borough, AK
North Slope Borough Map
North Slope Borough Overview
10,924
TOTAL POPULATION
6,766
MALE POPULATION
4,158
FEMALE POPULATION
162.72
MALES / 100 FEMALES
61.45
FEMALES / 100 MALES
36.3
MEDIAN AGE
3.8
AVG FAMILY SIZE
3.3
AVG HOUSEHOLD SIZE
$61,841
PER CAPITA INCOME
$92,656
AVG FAMILY INCOME
$83,472
AVG HOUSEHOLD INCOME
24.7%
WAGE / INCOME GAP [ % ]
75.3¢/ $1
WAGE / INCOME GAP [ $ ]
$13,720
FAMILY INCOME DEFICIT
0.44
INEQUALITY / GINI INDEX
6,915
LABOR FORCE [ PEOPLE ]
78.9%
PERCENT IN LABOR FORCE
6.8%
UNEMPLOYMENT RATE
North Slope Borough Area Codes
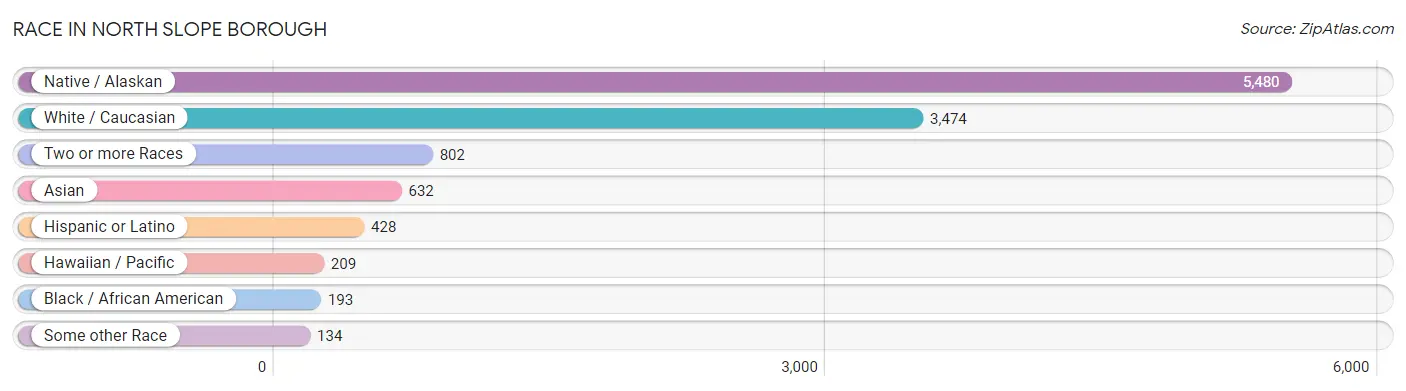
Race in North Slope Borough
The most populous races in North Slope Borough are Native / Alaskan (5,480 | 50.2%), White / Caucasian (3,474 | 31.8%), and Two or more Races (802 | 7.3%).
| Race | # Population | % Population |
| Asian | 632 | 5.8% |
| Black / African American | 193 | 1.8% |
| Hawaiian / Pacific | 209 | 1.9% |
| Hispanic or Latino | 428 | 3.9% |
| Native / Alaskan | 5,480 | 50.2% |
| White / Caucasian | 3,474 | 31.8% |
| Two or more Races | 802 | 7.3% |
| Some other Race | 134 | 1.2% |
| Total | 10,924 | 100.0% |
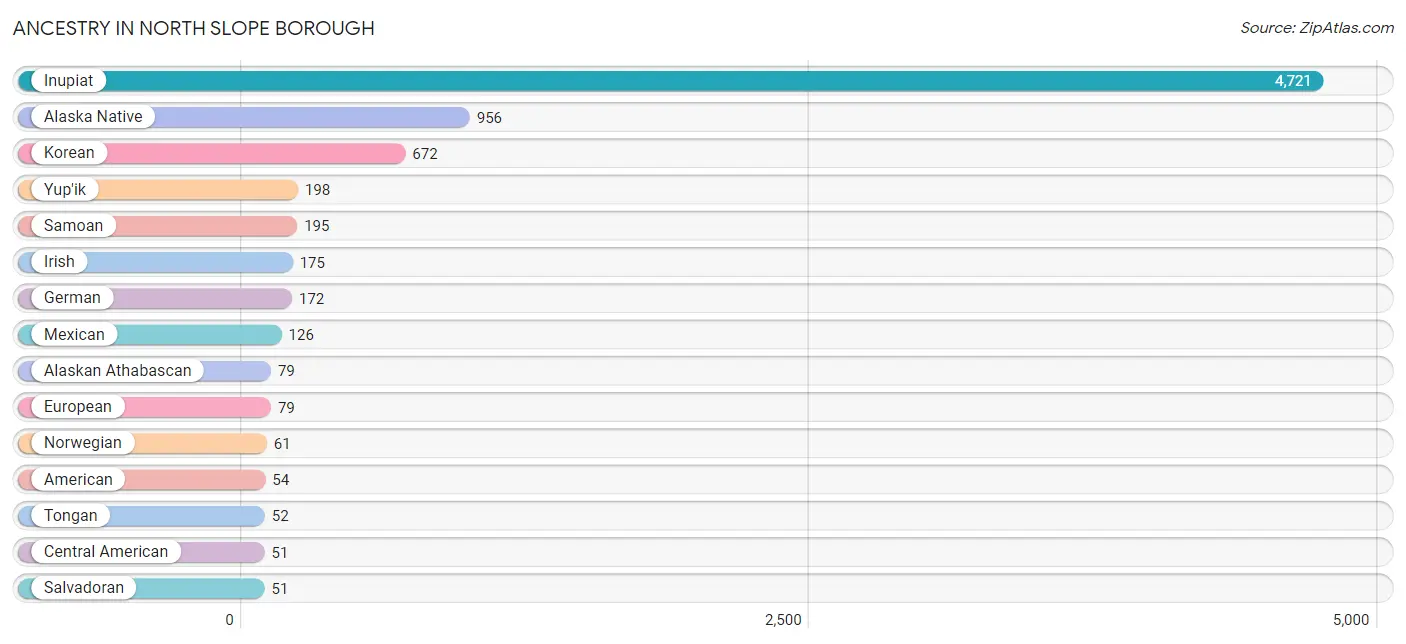
Ancestry in North Slope Borough
The most populous ancestries reported in North Slope Borough are Inupiat (4,721 | 43.2%), Alaska Native (956 | 8.7%), Korean (672 | 6.1%), Yup'ik (198 | 1.8%), and Samoan (195 | 1.8%), together accounting for 61.7% of all North Slope Borough residents.
| Ancestry | # Population | % Population |
| African | 3 | 0.0% |
| Alaska Native | 956 | 8.7% |
| Alaskan Athabascan | 79 | 0.7% |
| Aleut | 8 | 0.1% |
| American | 54 | 0.5% |
| Austrian | 1 | 0.0% |
| Bhutanese | 16 | 0.2% |
| British | 32 | 0.3% |
| Bulgarian | 9 | 0.1% |
| Burmese | 29 | 0.3% |
| Cajun | 1 | 0.0% |
| Canadian | 10 | 0.1% |
| Central American | 51 | 0.5% |
| Cherokee | 1 | 0.0% |
| Chippewa | 19 | 0.2% |
| Choctaw | 38 | 0.4% |
| Colombian | 7 | 0.1% |
| Creek | 29 | 0.3% |
| Cuban | 20 | 0.2% |
| Czech | 3 | 0.0% |
| Dominican | 47 | 0.4% |
| Dutch | 20 | 0.2% |
| English | 38 | 0.4% |
| European | 79 | 0.7% |
| French | 46 | 0.4% |
| French American Indian | 3 | 0.0% |
| French Canadian | 19 | 0.2% |
| German | 172 | 1.6% |
| Haitian | 45 | 0.4% |
| Hopi | 3 | 0.0% |
| Hungarian | 28 | 0.3% |
| Indian (Asian) | 20 | 0.2% |
| Inupiat | 4,721 | 43.2% |
| Irish | 175 | 1.6% |
| Italian | 45 | 0.4% |
| Kenyan | 7 | 0.1% |
| Korean | 672 | 6.1% |
| Macedonian | 11 | 0.1% |
| Mexican | 126 | 1.1% |
| Native Hawaiian | 48 | 0.4% |
| Norwegian | 61 | 0.6% |
| Pennsylvania German | 1 | 0.0% |
| Polish | 50 | 0.5% |
| Portuguese | 17 | 0.2% |
| Pueblo | 8 | 0.1% |
| Puerto Rican | 47 | 0.4% |
| Romanian | 1 | 0.0% |
| Russian | 8 | 0.1% |
| Salvadoran | 51 | 0.5% |
| Samoan | 195 | 1.8% |
| Scandinavian | 25 | 0.2% |
| Scottish | 3 | 0.0% |
| Shoshone | 12 | 0.1% |
| South American | 7 | 0.1% |
| Spaniard | 25 | 0.2% |
| Spanish | 20 | 0.2% |
| Subsaharan African | 10 | 0.1% |
| Swedish | 17 | 0.2% |
| Thai | 39 | 0.4% |
| Tlingit-Haida | 6 | 0.1% |
| Tongan | 52 | 0.5% |
| Turkish | 10 | 0.1% |
| Ukrainian | 1 | 0.0% |
| Yup'ik | 198 | 1.8% | View All 64 Rows |
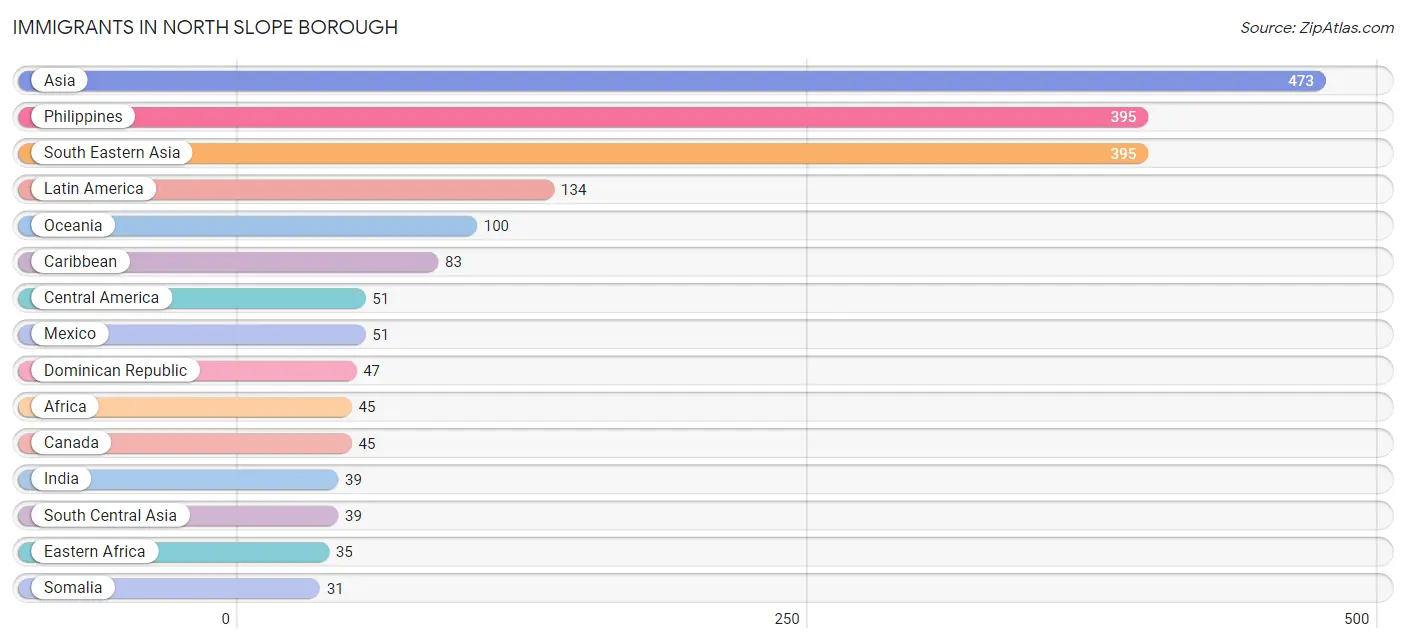
Immigrants in North Slope Borough
The most numerous immigrant groups reported in North Slope Borough came from Asia (473 | 4.3%), Philippines (395 | 3.6%), South Eastern Asia (395 | 3.6%), Latin America (134 | 1.2%), and Oceania (100 | 0.9%), together accounting for 13.7% of all North Slope Borough residents.
| Immigration Origin | # Population | % Population |
| Africa | 45 | 0.4% |
| Asia | 473 | 4.3% |
| Canada | 45 | 0.4% |
| Caribbean | 83 | 0.8% |
| Central America | 51 | 0.5% |
| Cuba | 20 | 0.2% |
| Dominican Republic | 47 | 0.4% |
| Eastern Africa | 35 | 0.3% |
| Eastern Asia | 29 | 0.3% |
| Eastern Europe | 18 | 0.2% |
| Egypt | 10 | 0.1% |
| England | 3 | 0.0% |
| Europe | 21 | 0.2% |
| Haiti | 16 | 0.2% |
| India | 39 | 0.4% |
| Kenya | 4 | 0.0% |
| Korea | 29 | 0.3% |
| Latin America | 134 | 1.2% |
| Mexico | 51 | 0.5% |
| North Macedonia | 11 | 0.1% |
| Northern Africa | 10 | 0.1% |
| Northern Europe | 3 | 0.0% |
| Oceania | 100 | 0.9% |
| Philippines | 395 | 3.6% |
| Poland | 7 | 0.1% |
| Somalia | 31 | 0.3% |
| South Central Asia | 39 | 0.4% |
| South Eastern Asia | 395 | 3.6% |
| Turkey | 10 | 0.1% |
| Western Asia | 10 | 0.1% | View All 30 Rows |
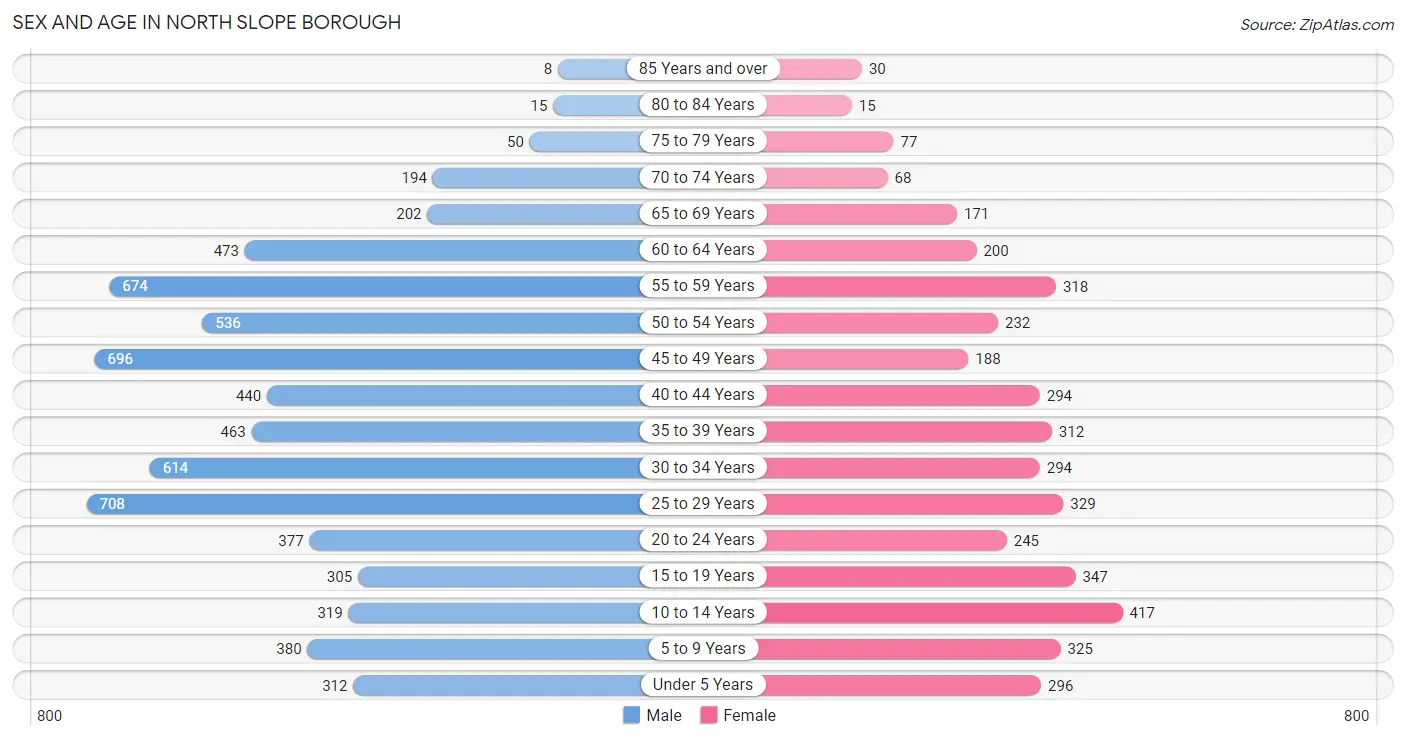
Sex and Age in North Slope Borough
Sex and Age in North Slope Borough
The most populous age groups in North Slope Borough are 25 to 29 Years (708 | 10.5%) for men and 10 to 14 Years (417 | 10.0%) for women.
| Age Bracket | Male | Female |
| Under 5 Years | 312 (4.6%) | 296 (7.1%) |
| 5 to 9 Years | 380 (5.6%) | 325 (7.8%) |
| 10 to 14 Years | 319 (4.7%) | 417 (10.0%) |
| 15 to 19 Years | 305 (4.5%) | 347 (8.4%) |
| 20 to 24 Years | 377 (5.6%) | 245 (5.9%) |
| 25 to 29 Years | 708 (10.5%) | 329 (7.9%) |
| 30 to 34 Years | 614 (9.1%) | 294 (7.1%) |
| 35 to 39 Years | 463 (6.8%) | 312 (7.5%) |
| 40 to 44 Years | 440 (6.5%) | 294 (7.1%) |
| 45 to 49 Years | 696 (10.3%) | 188 (4.5%) |
| 50 to 54 Years | 536 (7.9%) | 232 (5.6%) |
| 55 to 59 Years | 674 (10.0%) | 318 (7.6%) |
| 60 to 64 Years | 473 (7.0%) | 200 (4.8%) |
| 65 to 69 Years | 202 (3.0%) | 171 (4.1%) |
| 70 to 74 Years | 194 (2.9%) | 68 (1.6%) |
| 75 to 79 Years | 50 (0.7%) | 77 (1.8%) |
| 80 to 84 Years | 15 (0.2%) | 15 (0.4%) |
| 85 Years and over | 8 (0.1%) | 30 (0.7%) |
| Total | 6,766 (100.0%) | 4,158 (100.0%) |
Families and Households in North Slope Borough
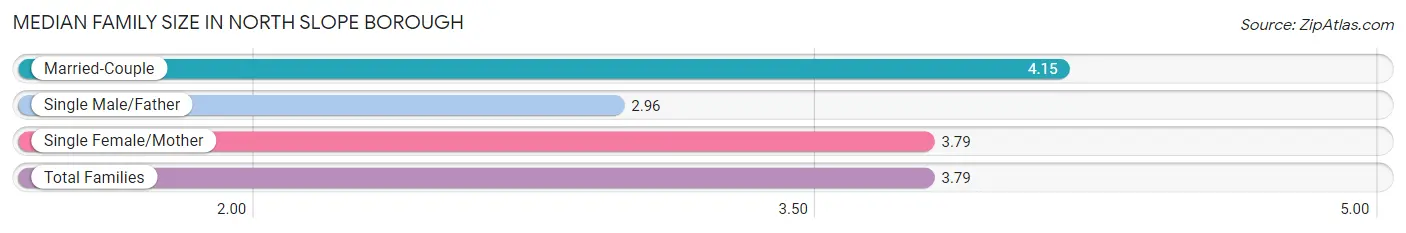
Median Family Size in North Slope Borough
The median family size in North Slope Borough is 3.79 persons per family, with married-couple families (794 | 51.1%) accounting for the largest median family size of 4.15 persons per family. On the other hand, single male/father families (354 | 22.8%) represent the smallest median family size with 2.96 persons per family.
| Family Type | # Families | Family Size |
| Married-Couple | 794 (51.1%) | 4.15 |
| Single Male/Father | 354 (22.8%) | 2.96 |
| Single Female/Mother | 407 (26.2%) | 3.79 |
| Total Families | 1,555 (100.0%) | 3.79 |
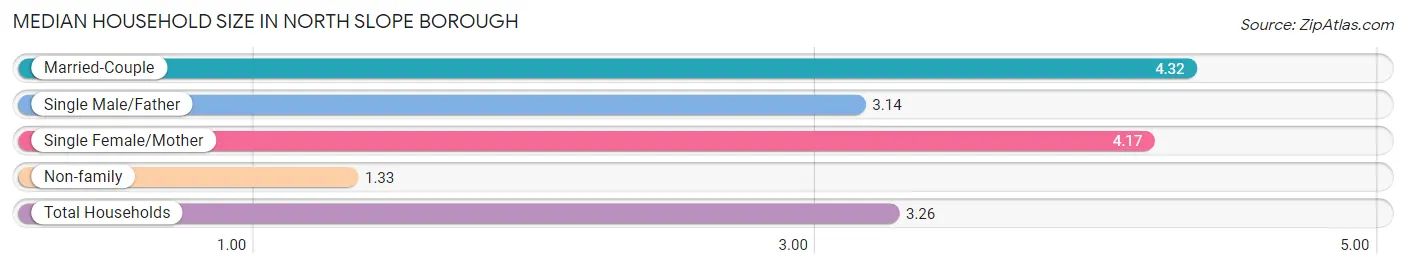
Median Household Size in North Slope Borough
The median household size in North Slope Borough is 3.26 persons per household, with married-couple households (794 | 36.6%) accounting for the largest median household size of 4.32 persons per household. non-family households (613 | 28.3%) represent the smallest median household size with 1.33 persons per household.
| Household Type | # Households | Household Size |
| Married-Couple | 794 (36.6%) | 4.32 |
| Single Male/Father | 354 (16.3%) | 3.14 |
| Single Female/Mother | 407 (18.8%) | 4.17 |
| Non-family | 613 (28.3%) | 1.33 |
| Total Households | 2,168 (100.0%) | 3.26 |
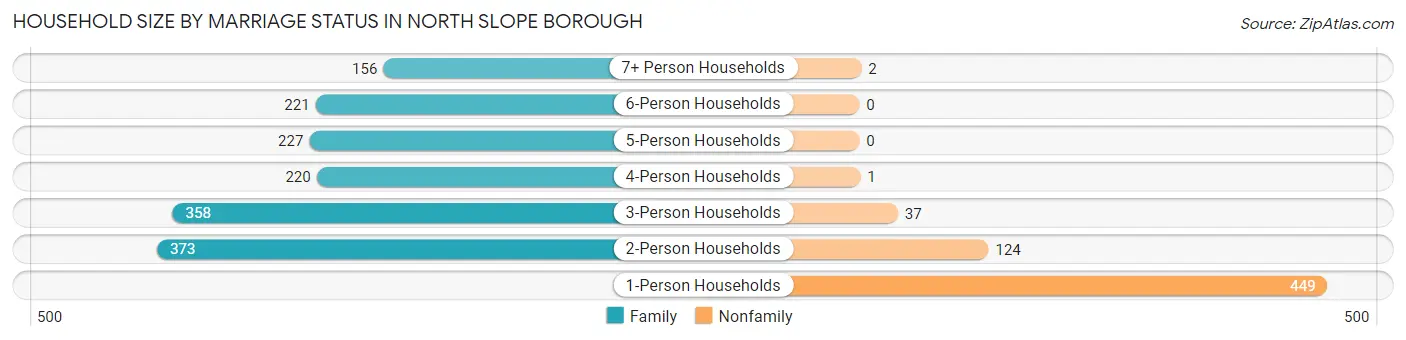
Household Size by Marriage Status in North Slope Borough
Out of a total of 2,168 households in North Slope Borough, 1,555 (71.7%) are family households, while 613 (28.3%) are nonfamily households. The most numerous type of family households are 2-person households, comprising 373, and the most common type of nonfamily households are 1-person households, comprising 449.
| Household Size | Family Households | Nonfamily Households |
| 1-Person Households | - | 449 (20.7%) |
| 2-Person Households | 373 (17.2%) | 124 (5.7%) |
| 3-Person Households | 358 (16.5%) | 37 (1.7%) |
| 4-Person Households | 220 (10.2%) | 1 (0.1%) |
| 5-Person Households | 227 (10.5%) | 0 (0.0%) |
| 6-Person Households | 221 (10.2%) | 0 (0.0%) |
| 7+ Person Households | 156 (7.2%) | 2 (0.1%) |
| Total | 1,555 (71.7%) | 613 (28.3%) |
Female Fertility in North Slope Borough
Fertility by Age in North Slope Borough
Average fertility rate in North Slope Borough is 34.0 births per 1,000 women. Women in the age bracket of 20 to 34 years have the highest fertility rate with 60.0 births per 1,000 women. Women in the age bracket of 20 to 34 years acount for 75.4% of all women with births.
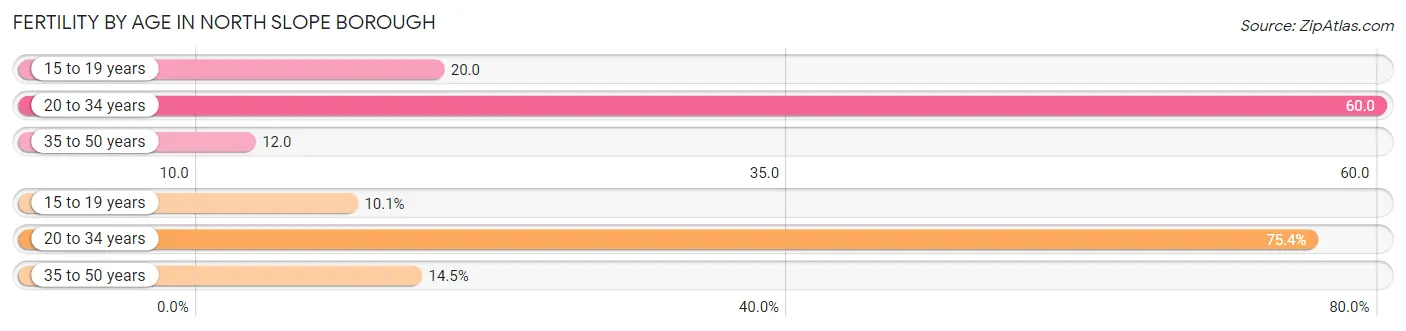
| Age Bracket | Women with Births | Births / 1,000 Women |
| 15 to 19 years | 7 (10.1%) | 20.0 |
| 20 to 34 years | 52 (75.4%) | 60.0 |
| 35 to 50 years | 10 (14.5%) | 12.0 |
| Total | 69 (100.0%) | 34.0 |
Fertility by Age by Marriage Status in North Slope Borough
26.1% of women with births (69) in North Slope Borough are married. The highest percentage of unmarried women with births falls into 15 to 19 years age bracket with 100.0% of them unmarried at the time of birth, while the lowest percentage of unmarried women with births belong to 35 to 50 years age bracket with 70.0% of them unmarried.
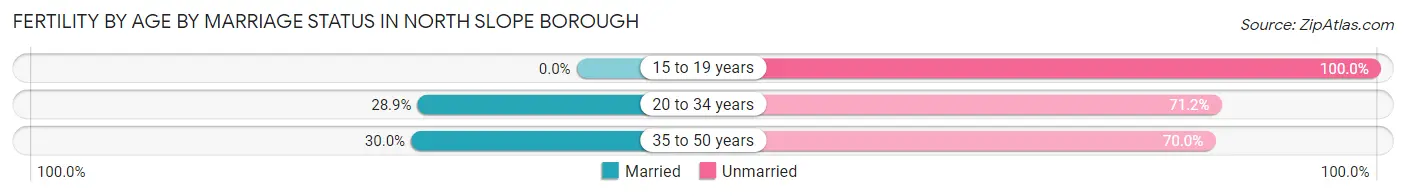
| Age Bracket | Married | Unmarried |
| 15 to 19 years | 0 (0.0%) | 7 (100.0%) |
| 20 to 34 years | 15 (28.8%) | 37 (71.2%) |
| 35 to 50 years | 3 (30.0%) | 7 (70.0%) |
| Total | 18 (26.1%) | 51 (73.9%) |
Fertility by Education in North Slope Borough
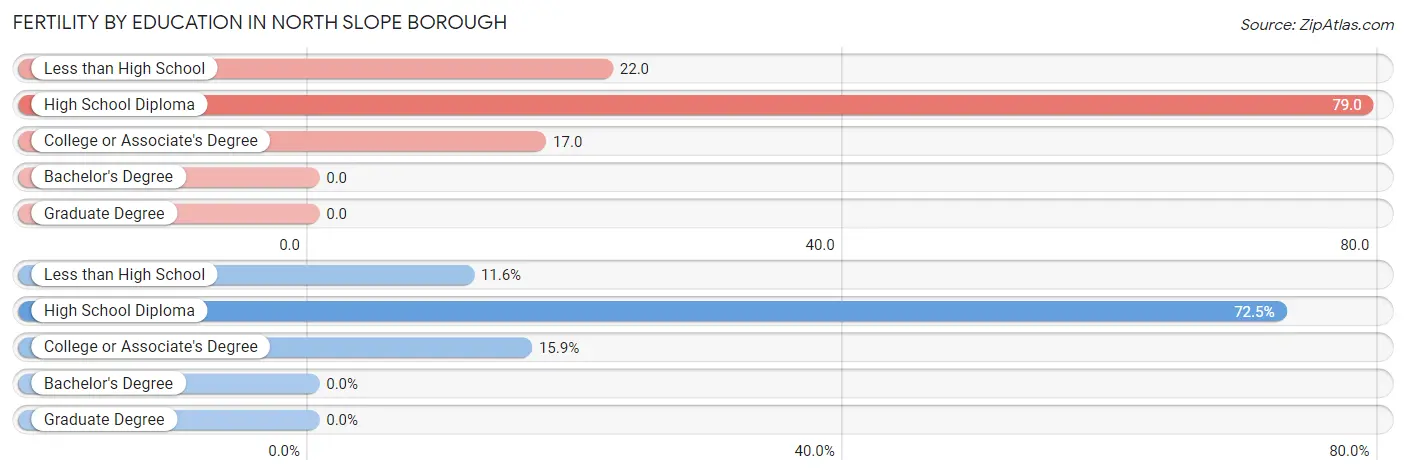
| Educational Attainment | Women with Births | Births / 1,000 Women |
| Less than High School | 8 (11.6%) | 22.0 |
| High School Diploma | 50 (72.5%) | 79.0 |
| College or Associate's Degree | 11 (15.9%) | 17.0 |
| Bachelor's Degree | 0 (0.0%) | 0.0 |
| Graduate Degree | 0 (0.0%) | 0.0 |
| Total | 69 (100.0%) | 34.0 |
Fertility by Education by Marriage Status in North Slope Borough
73.9% of women with births in North Slope Borough are unmarried. Women with the educational attainment of college or associate's degree are most likely to be married with 45.5% of them married at childbirth, while women with the educational attainment of less than high school are least likely to be married with 87.5% of them unmarried at childbirth.
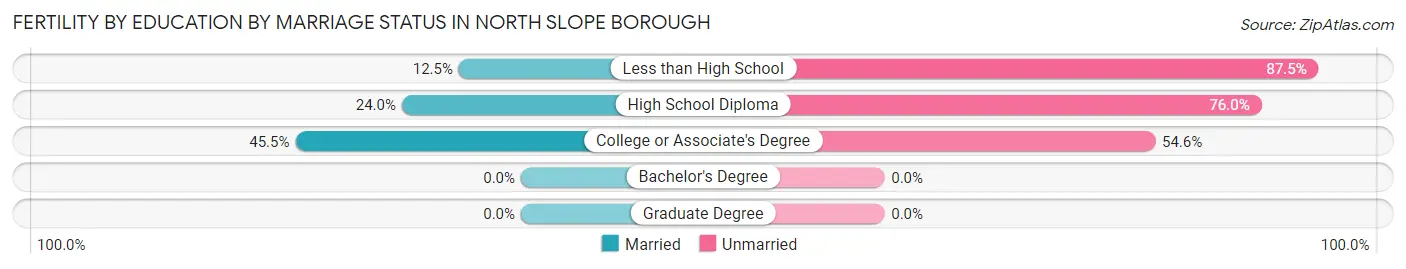
| Educational Attainment | Married | Unmarried |
| Less than High School | 1 (12.5%) | 7 (87.5%) |
| High School Diploma | 12 (24.0%) | 38 (76.0%) |
| College or Associate's Degree | 5 (45.5%) | 6 (54.5%) |
| Bachelor's Degree | 0 (0.0%) | 0 (0.0%) |
| Graduate Degree | 0 (0.0%) | 0 (0.0%) |
| Total | 18 (26.1%) | 51 (73.9%) |
Income in North Slope Borough
Income Overview in North Slope Borough
Per Capita Income in North Slope Borough is $61,841, while median incomes of families and households are $92,656 and $83,472 respectively.
| Characteristic | Number | Measure |
| Per Capita Income | 10,924 | $61,841 |
| Median Family Income | 1,555 | $92,656 |
| Mean Family Income | 1,555 | $117,542 |
| Median Household Income | 2,168 | $83,472 |
| Mean Household Income | 2,168 | $109,311 |
| Income Deficit | 1,555 | $13,720 |
| Wage / Income Gap (%) | 10,924 | 24.71% |
| Wage / Income Gap ($) | 10,924 | 75.29¢ per $1 |
| Gini / Inequality Index | 10,924 | 0.44 |
Earnings by Sex in North Slope Borough
Average Earnings in North Slope Borough are $69,594, $73,977 for men and $55,698 for women, a difference of 24.7%.
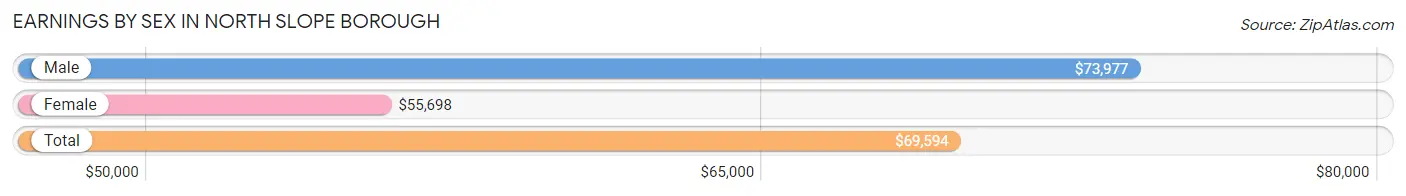
| Sex | Number | Average Earnings |
| Male | 4,787 (68.3%) | $73,977 |
| Female | 2,222 (31.7%) | $55,698 |
| Total | 7,009 (100.0%) | $69,594 |
Earnings by Sex by Income Bracket in North Slope Borough
The most common earnings brackets in North Slope Borough are $100,000+ for men (1,901 | 39.7%) and $100,000+ for women (414 | 18.6%).
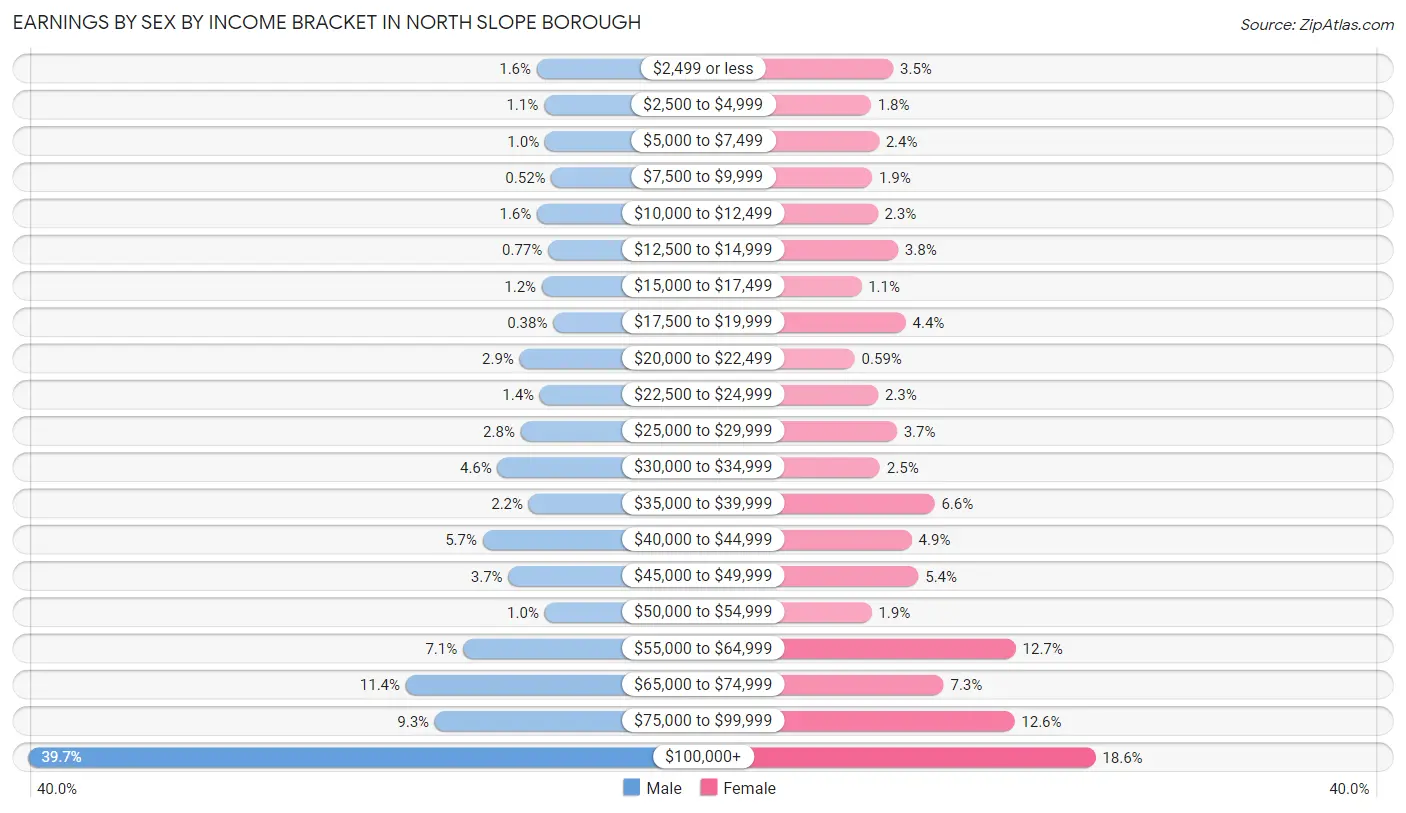
| Income | Male | Female |
| $2,499 or less | 77 (1.6%) | 77 (3.5%) |
| $2,500 to $4,999 | 51 (1.1%) | 40 (1.8%) |
| $5,000 to $7,499 | 48 (1.0%) | 53 (2.4%) |
| $7,500 to $9,999 | 25 (0.5%) | 42 (1.9%) |
| $10,000 to $12,499 | 76 (1.6%) | 51 (2.3%) |
| $12,500 to $14,999 | 37 (0.8%) | 85 (3.8%) |
| $15,000 to $17,499 | 59 (1.2%) | 24 (1.1%) |
| $17,500 to $19,999 | 18 (0.4%) | 98 (4.4%) |
| $20,000 to $22,499 | 139 (2.9%) | 13 (0.6%) |
| $22,500 to $24,999 | 66 (1.4%) | 52 (2.3%) |
| $25,000 to $29,999 | 135 (2.8%) | 83 (3.7%) |
| $30,000 to $34,999 | 218 (4.5%) | 55 (2.5%) |
| $35,000 to $39,999 | 106 (2.2%) | 146 (6.6%) |
| $40,000 to $44,999 | 271 (5.7%) | 108 (4.9%) |
| $45,000 to $49,999 | 179 (3.7%) | 119 (5.4%) |
| $50,000 to $54,999 | 49 (1.0%) | 41 (1.8%) |
| $55,000 to $64,999 | 342 (7.1%) | 281 (12.7%) |
| $65,000 to $74,999 | 547 (11.4%) | 161 (7.2%) |
| $75,000 to $99,999 | 443 (9.2%) | 279 (12.6%) |
| $100,000+ | 1,901 (39.7%) | 414 (18.6%) |
| Total | 4,787 (100.0%) | 2,222 (100.0%) |
Earnings by Sex by Educational Attainment in North Slope Borough
Average earnings in North Slope Borough are $82,500 for men and $58,444 for women, a difference of 29.2%. Men with an educational attainment of graduate degree enjoy the highest average annual earnings of $99,792, while those with less than high school education earn the least with $50,368. Women with an educational attainment of graduate degree earn the most with the average annual earnings of $106,094, while those with less than high school education have the smallest earnings of $39,583.
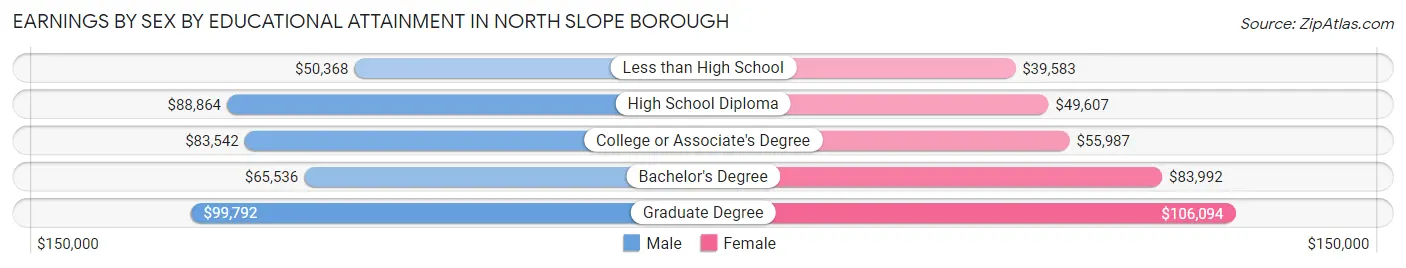
| Educational Attainment | Male Income | Female Income |
| Less than High School | $50,368 | $39,583 |
| High School Diploma | $88,864 | $49,607 |
| College or Associate's Degree | $83,542 | $55,987 |
| Bachelor's Degree | $65,536 | $83,992 |
| Graduate Degree | $99,792 | $106,094 |
| Total | $82,500 | $58,444 |
Family Income in North Slope Borough
Family Income Brackets in North Slope Borough
According to the North Slope Borough family income data, there are 323 families falling into the $200,000+ income range, which is the most common income bracket and makes up 20.8% of all families. Conversely, the $15,000 to $24,999 income bracket is the least frequent group with only 19 families (1.2%) belonging to this category.
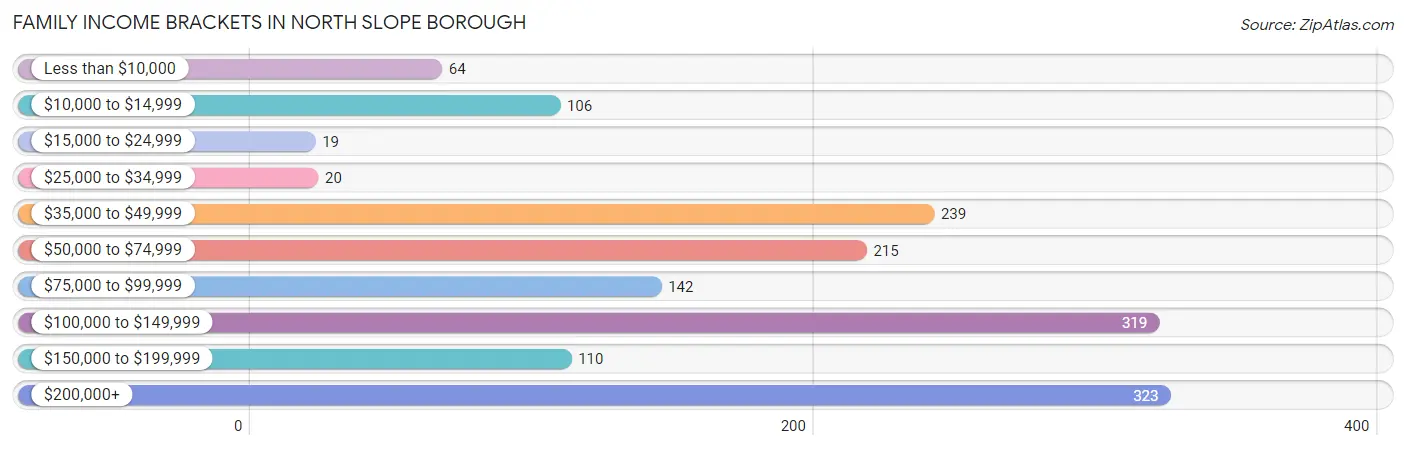
| Income Bracket | # Families | % Families |
| Less than $10,000 | 64 | 4.1% |
| $10,000 to $14,999 | 106 | 6.8% |
| $15,000 to $24,999 | 19 | 1.2% |
| $25,000 to $34,999 | 20 | 1.3% |
| $35,000 to $49,999 | 239 | 15.4% |
| $50,000 to $74,999 | 215 | 13.8% |
| $75,000 to $99,999 | 142 | 9.1% |
| $100,000 to $149,999 | 319 | 20.5% |
| $150,000 to $199,999 | 110 | 7.1% |
| $200,000+ | 323 | 20.8% |
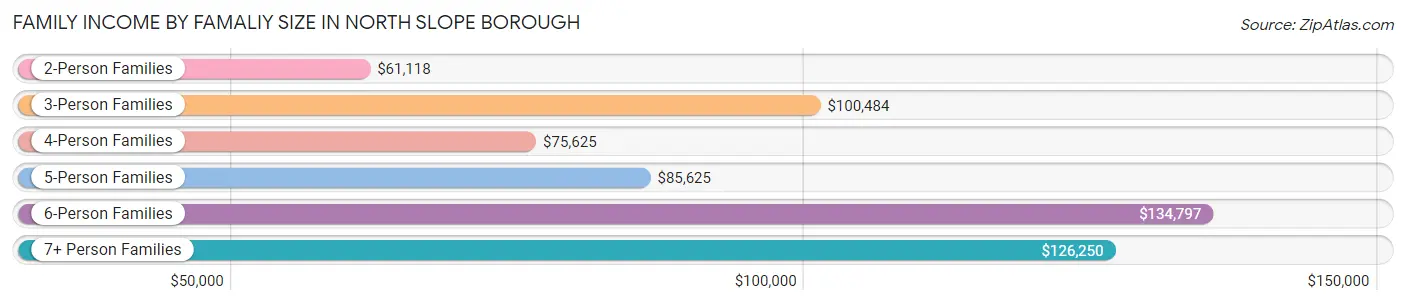
Family Income by Famaliy Size in North Slope Borough
6-person families (208 | 13.4%) account for the highest median family income in North Slope Borough with $134,797 per family, while 3-person families (384 | 24.7%) have the highest median income of $33,495 per family member.
| Income Bracket | # Families | Median Income |
| 2-Person Families | 409 (26.3%) | $61,118 |
| 3-Person Families | 384 (24.7%) | $100,484 |
| 4-Person Families | 263 (16.9%) | $75,625 |
| 5-Person Families | 173 (11.1%) | $85,625 |
| 6-Person Families | 208 (13.4%) | $134,797 |
| 7+ Person Families | 118 (7.6%) | $126,250 |
| Total | 1,555 (100.0%) | $92,656 |
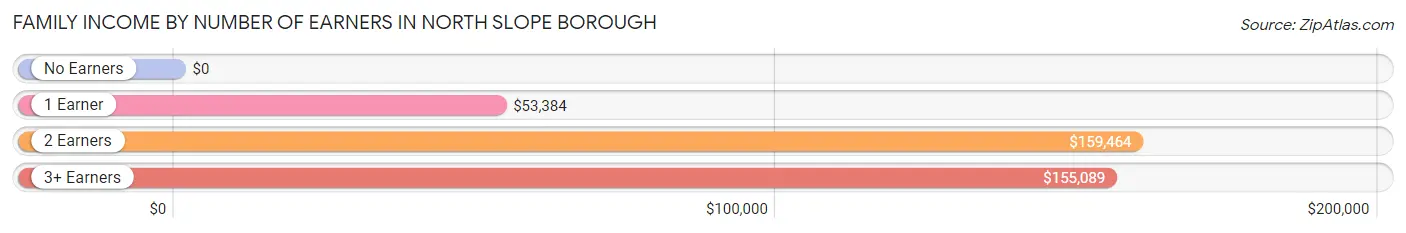
Family Income by Number of Earners in North Slope Borough
| Number of Earners | # Families | Median Income |
| No Earners | 238 (15.3%) | $0 |
| 1 Earner | 523 (33.6%) | $53,384 |
| 2 Earners | 555 (35.7%) | $159,464 |
| 3+ Earners | 239 (15.4%) | $155,089 |
| Total | 1,555 (100.0%) | $92,656 |
Household Income in North Slope Borough
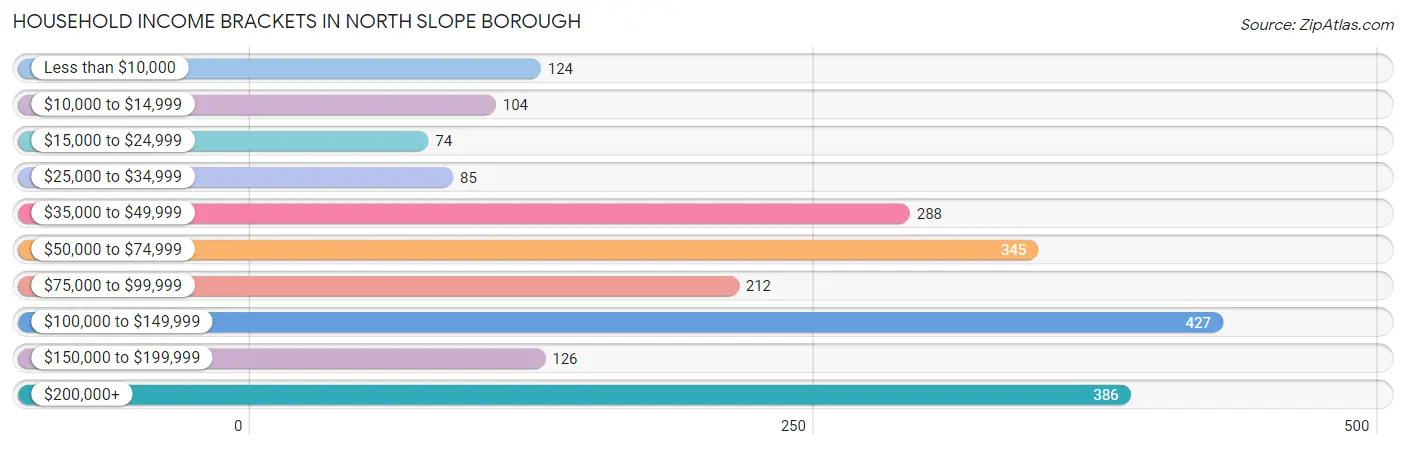
Household Income Brackets in North Slope Borough
With 427 households falling in the category, the $100,000 to $149,999 income range is the most frequent in North Slope Borough, accounting for 19.7% of all households. In contrast, only 74 households (3.4%) fall into the $15,000 to $24,999 income bracket, making it the least populous group.
| Income Bracket | # Households | % Households |
| Less than $10,000 | 124 | 5.7% |
| $10,000 to $14,999 | 104 | 4.8% |
| $15,000 to $24,999 | 74 | 3.4% |
| $25,000 to $34,999 | 85 | 3.9% |
| $35,000 to $49,999 | 288 | 13.3% |
| $50,000 to $74,999 | 345 | 15.9% |
| $75,000 to $99,999 | 212 | 9.8% |
| $100,000 to $149,999 | 427 | 19.7% |
| $150,000 to $199,999 | 126 | 5.8% |
| $200,000+ | 386 | 17.8% |
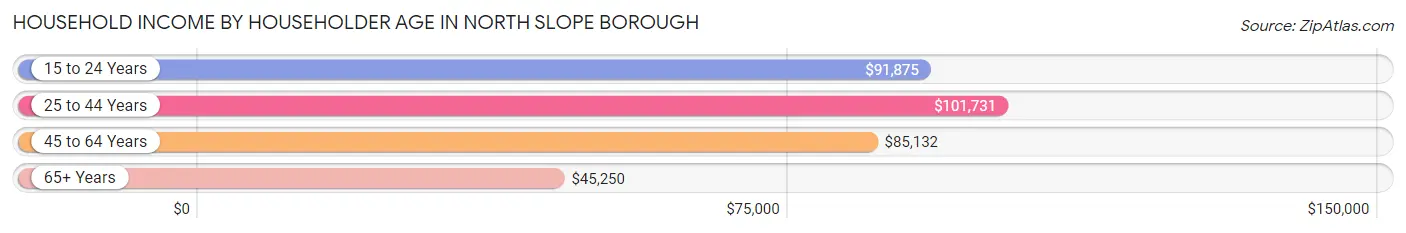
Household Income by Householder Age in North Slope Borough
The median household income in North Slope Borough is $83,472, with the highest median household income of $101,731 found in the 25 to 44 years age bracket for the primary householder. A total of 734 households (33.9%) fall into this category. Meanwhile, the 65+ years age bracket for the primary householder has the lowest median household income of $45,250, with 472 households (21.8%) in this group.
| Income Bracket | # Households | Median Income |
| 15 to 24 Years | 98 (4.5%) | $91,875 |
| 25 to 44 Years | 734 (33.9%) | $101,731 |
| 45 to 64 Years | 864 (39.9%) | $85,132 |
| 65+ Years | 472 (21.8%) | $45,250 |
| Total | 2,168 (100.0%) | $83,472 |
Poverty in North Slope Borough
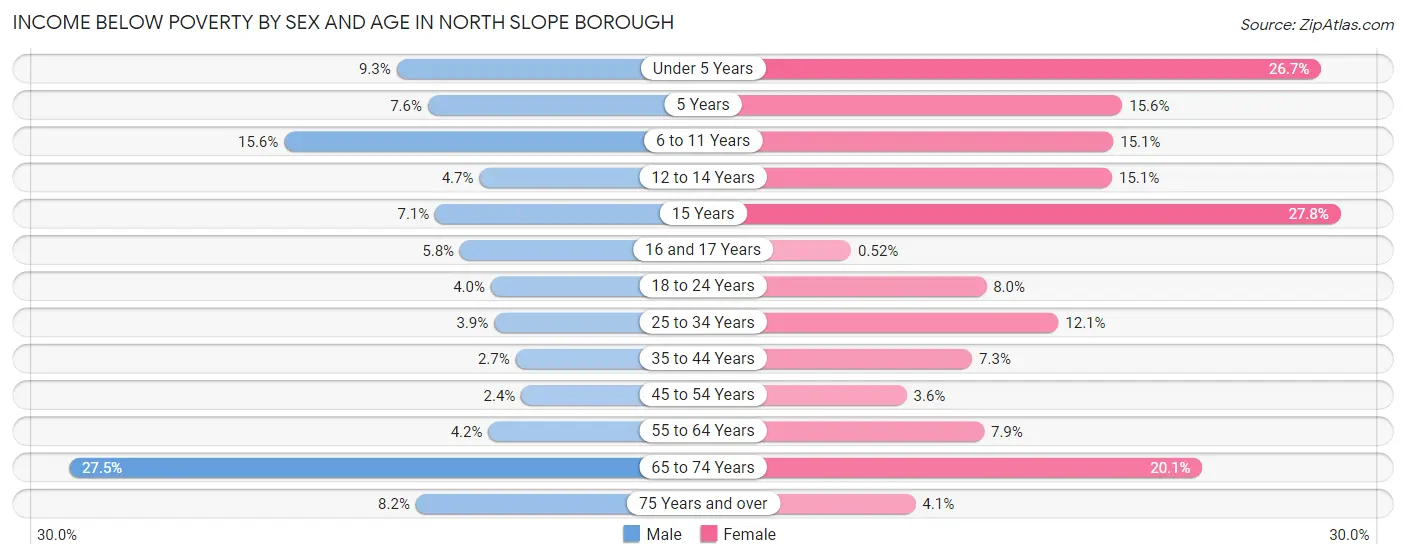
Income Below Poverty by Sex and Age in North Slope Borough
With 6.0% poverty level for males and 11.0% for females among the residents of North Slope Borough, 65 to 74 year old males and 15 year old females are the most vulnerable to poverty, with 109 males (27.5%) and 15 females (27.8%) in their respective age groups living below the poverty level.
| Age Bracket | Male | Female |
| Under 5 Years | 29 (9.3%) | 71 (26.7%) |
| 5 Years | 4 (7.5%) | 15 (15.6%) |
| 6 to 11 Years | 65 (15.5%) | 65 (15.1%) |
| 12 to 14 Years | 8 (4.7%) | 31 (15.0%) |
| 15 Years | 4 (7.1%) | 15 (27.8%) |
| 16 and 17 Years | 8 (5.8%) | 1 (0.5%) |
| 18 to 24 Years | 19 (4.0%) | 27 (8.0%) |
| 25 to 34 Years | 51 (3.9%) | 75 (12.1%) |
| 35 to 44 Years | 24 (2.7%) | 44 (7.3%) |
| 45 to 54 Years | 29 (2.4%) | 15 (3.6%) |
| 55 to 64 Years | 48 (4.2%) | 41 (7.9%) |
| 65 to 74 Years | 109 (27.5%) | 48 (20.1%) |
| 75 Years and over | 6 (8.2%) | 5 (4.1%) |
| Total | 404 (6.0%) | 453 (11.0%) |
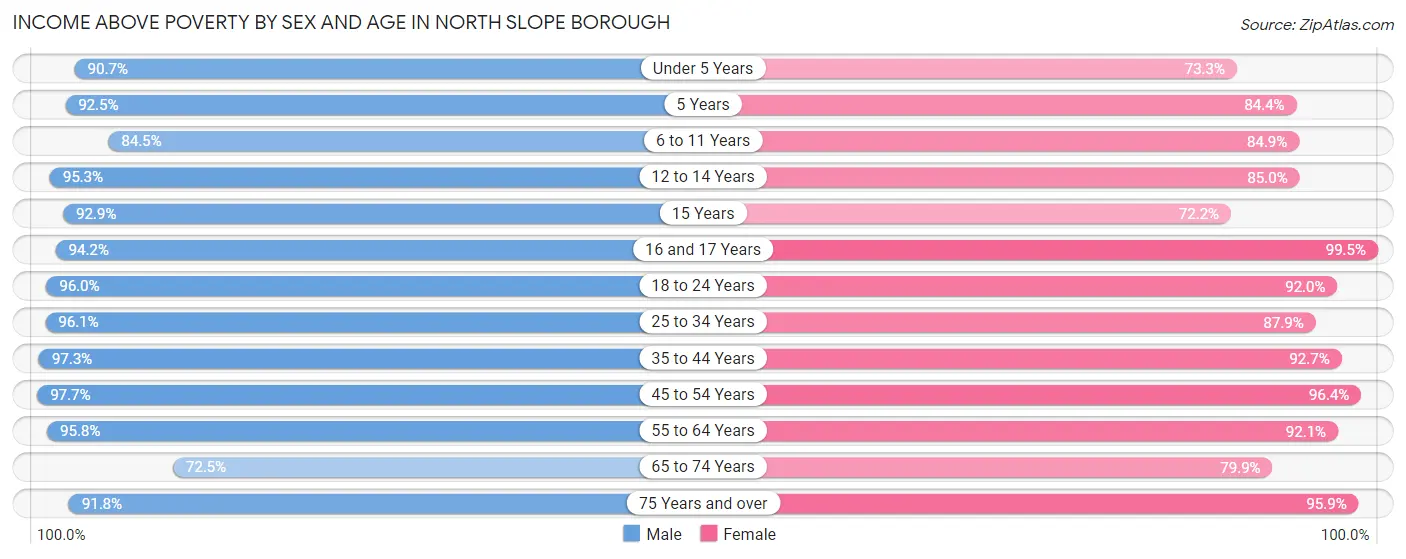
Income Above Poverty by Sex and Age in North Slope Borough
According to the poverty statistics in North Slope Borough, males aged 45 to 54 years and females aged 16 and 17 years are the age groups that are most secure financially, with 97.7% of males and 99.5% of females in these age groups living above the poverty line.
| Age Bracket | Male | Female |
| Under 5 Years | 283 (90.7%) | 195 (73.3%) |
| 5 Years | 49 (92.4%) | 81 (84.4%) |
| 6 to 11 Years | 353 (84.5%) | 365 (84.9%) |
| 12 to 14 Years | 163 (95.3%) | 175 (85.0%) |
| 15 Years | 52 (92.9%) | 39 (72.2%) |
| 16 and 17 Years | 131 (94.2%) | 191 (99.5%) |
| 18 to 24 Years | 451 (96.0%) | 309 (92.0%) |
| 25 to 34 Years | 1,271 (96.1%) | 547 (87.9%) |
| 35 to 44 Years | 878 (97.3%) | 562 (92.7%) |
| 45 to 54 Years | 1,203 (97.7%) | 400 (96.4%) |
| 55 to 64 Years | 1,099 (95.8%) | 477 (92.1%) |
| 65 to 74 Years | 287 (72.5%) | 191 (79.9%) |
| 75 Years and over | 67 (91.8%) | 117 (95.9%) |
| Total | 6,287 (94.0%) | 3,649 (89.0%) |
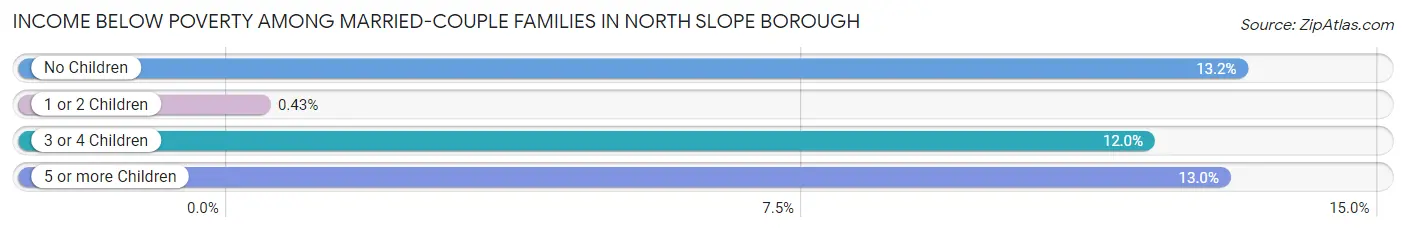
Income Below Poverty Among Married-Couple Families in North Slope Borough
The poverty statistics for married-couple families in North Slope Borough show that 9.2% or 73 of the total 794 families live below the poverty line. Families with no children have the highest poverty rate of 13.2%, comprising of 48 families. On the other hand, families with 1 or 2 children have the lowest poverty rate of 0.4%, which includes 1 families.
| Children | Above Poverty | Below Poverty |
| No Children | 316 (86.8%) | 48 (13.2%) |
| 1 or 2 Children | 233 (99.6%) | 1 (0.4%) |
| 3 or 4 Children | 125 (88.0%) | 17 (12.0%) |
| 5 or more Children | 47 (87.0%) | 7 (13.0%) |
| Total | 721 (90.8%) | 73 (9.2%) |
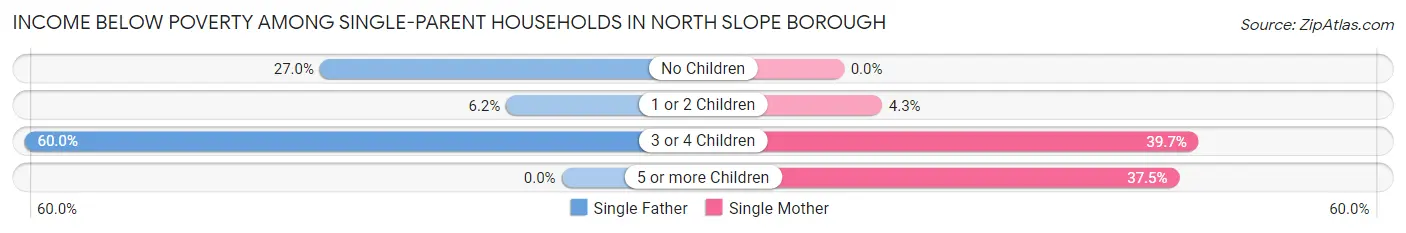
Income Below Poverty Among Single-Parent Households in North Slope Borough
According to the poverty data in North Slope Borough, 17.2% or 61 single-father households and 15.7% or 64 single-mother households are living below the poverty line. Among single-father households, those with 3 or 4 children have the highest poverty rate, with 12 households (60.0%) experiencing poverty. Likewise, among single-mother households, those with 3 or 4 children have the highest poverty rate, with 48 households (39.7%) falling below the poverty line.
| Children | Single Father | Single Mother |
| No Children | 37 (27.0%) | 0 (0.0%) |
| 1 or 2 Children | 12 (6.2%) | 10 (4.3%) |
| 3 or 4 Children | 12 (60.0%) | 48 (39.7%) |
| 5 or more Children | 0 (0.0%) | 6 (37.5%) |
| Total | 61 (17.2%) | 64 (15.7%) |
Income Below Poverty Among Married-Couple vs Single-Parent Households in North Slope Borough
The poverty data for North Slope Borough shows that 73 of the married-couple family households (9.2%) and 125 of the single-parent households (16.4%) are living below the poverty level. Within the married-couple family households, those with no children have the highest poverty rate, with 48 households (13.2%) falling below the poverty line. Among the single-parent households, those with 3 or 4 children have the highest poverty rate, with 60 household (42.5%) living below poverty.
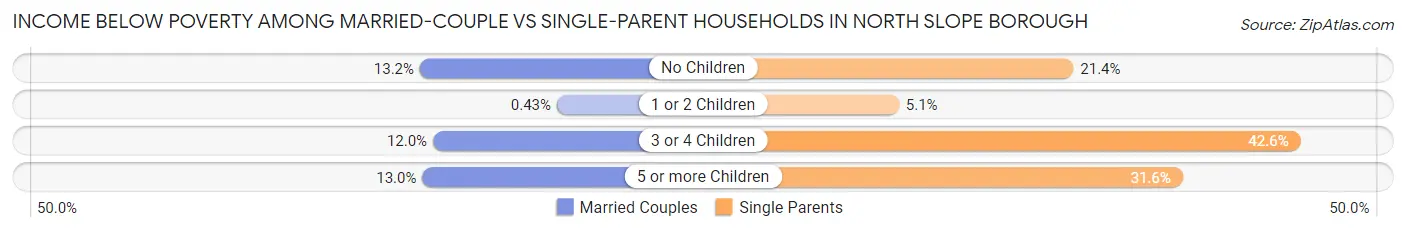
| Children | Married-Couple Families | Single-Parent Households |
| No Children | 48 (13.2%) | 37 (21.4%) |
| 1 or 2 Children | 1 (0.4%) | 22 (5.1%) |
| 3 or 4 Children | 17 (12.0%) | 60 (42.5%) |
| 5 or more Children | 7 (13.0%) | 6 (31.6%) |
| Total | 73 (9.2%) | 125 (16.4%) |
Employment Characteristics in North Slope Borough
Employment by Class of Employer in North Slope Borough
Among the 6,370 employed individuals in North Slope Borough, private company employees (4,225 | 66.3%), local government employees (1,280 | 20.1%), and state government employees (323 | 5.1%) make up the most common classes of employment.
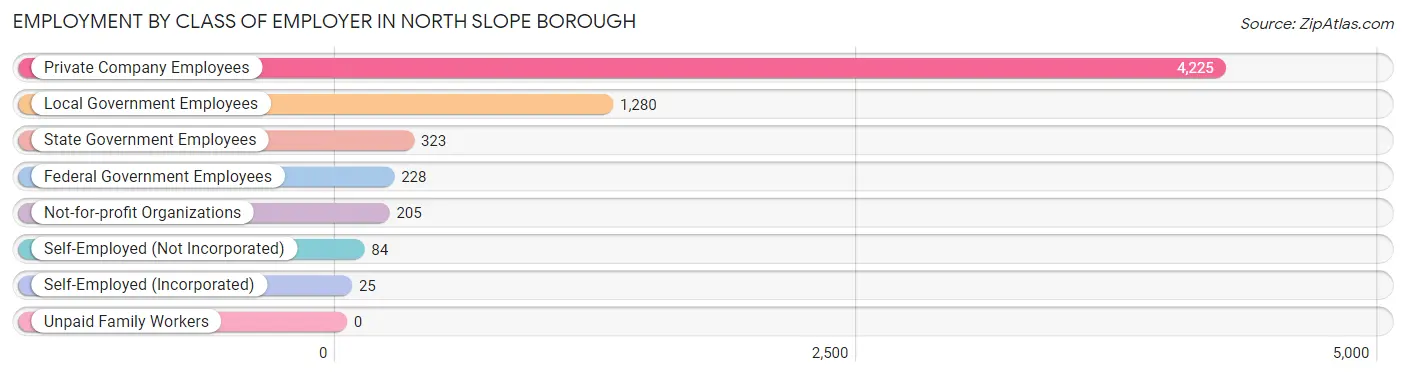
| Employer Class | # Employees | % Employees |
| Private Company Employees | 4,225 | 66.3% |
| Self-Employed (Incorporated) | 25 | 0.4% |
| Self-Employed (Not Incorporated) | 84 | 1.3% |
| Not-for-profit Organizations | 205 | 3.2% |
| Local Government Employees | 1,280 | 20.1% |
| State Government Employees | 323 | 5.1% |
| Federal Government Employees | 228 | 3.6% |
| Unpaid Family Workers | 0 | 0.0% |
| Total | 6,370 | 100.0% |
Employment Status by Age in North Slope Borough
According to the labor force statistics for North Slope Borough, out of the total population over 16 years of age (8,764), 78.9% or 6,915 individuals are in the labor force, with 6.8% or 470 of them unemployed. The age group with the highest labor force participation rate is 45 to 54 years, with 92.1% or 1,521 individuals in the labor force. Within the labor force, the 16 to 19 years age range has the highest percentage of unemployed individuals, with 37.2% or 52 of them being unemployed.
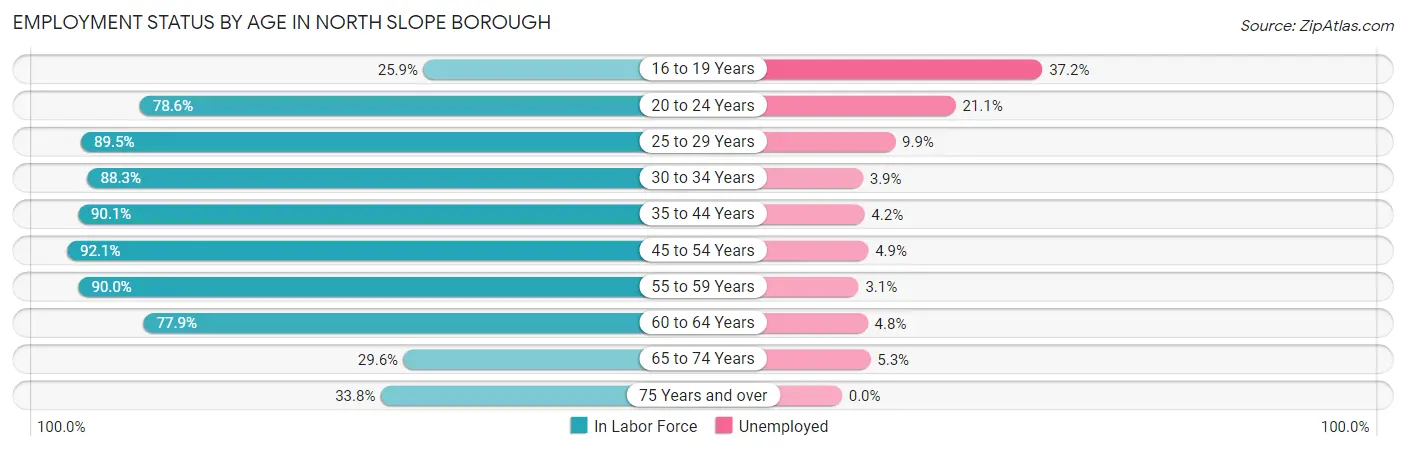
| Age Bracket | In Labor Force | Unemployed |
| 16 to 19 Years | 140 (25.9%) | 52 (37.2%) |
| 20 to 24 Years | 489 (78.6%) | 103 (21.1%) |
| 25 to 29 Years | 928 (89.5%) | 92 (9.9%) |
| 30 to 34 Years | 802 (88.3%) | 31 (3.9%) |
| 35 to 44 Years | 1,360 (90.1%) | 57 (4.2%) |
| 45 to 54 Years | 1,521 (92.1%) | 75 (4.9%) |
| 55 to 59 Years | 893 (90.0%) | 28 (3.1%) |
| 60 to 64 Years | 524 (77.9%) | 25 (4.8%) |
| 65 to 74 Years | 188 (29.6%) | 10 (5.3%) |
| 75 Years and over | 66 (33.8%) | 0 (0.0%) |
| Total | 6,915 (78.9%) | 470 (6.8%) |
Employment Status by Educational Attainment in North Slope Borough
According to labor force statistics for North Slope Borough, 89.0% of individuals (6,026) out of the total population between 25 and 64 years of age (6,771) are in the labor force, with 5.1% or 307 of them being unemployed. The group with the highest labor force participation rate are those with the educational attainment of bachelor's degree or higher, with 97.6% or 941 individuals in the labor force. Within the labor force, individuals with less than high school education have the highest percentage of unemployment, with 25.4% or 80 of them being unemployed.
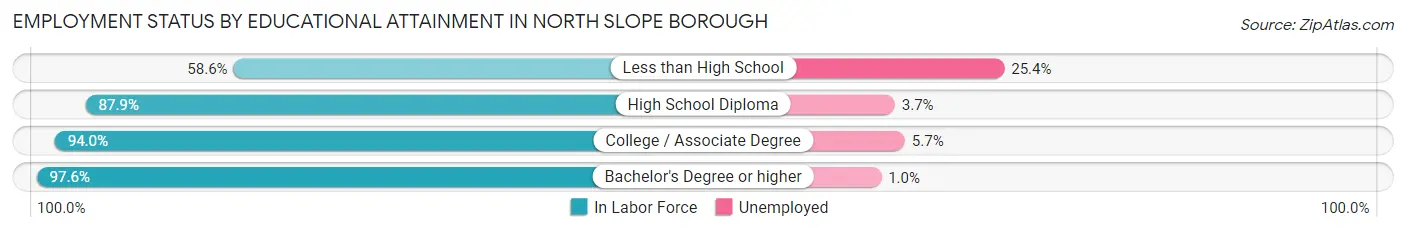
| Educational Attainment | In Labor Force | Unemployed |
| Less than High School | 315 (58.6%) | 137 (25.4%) |
| High School Diploma | 2,610 (87.9%) | 110 (3.7%) |
| College / Associate Degree | 2,162 (94.0%) | 131 (5.7%) |
| Bachelor's Degree or higher | 941 (97.6%) | 10 (1.0%) |
| Total | 6,026 (89.0%) | 345 (5.1%) |
Employment Occupations by Sex in North Slope Borough
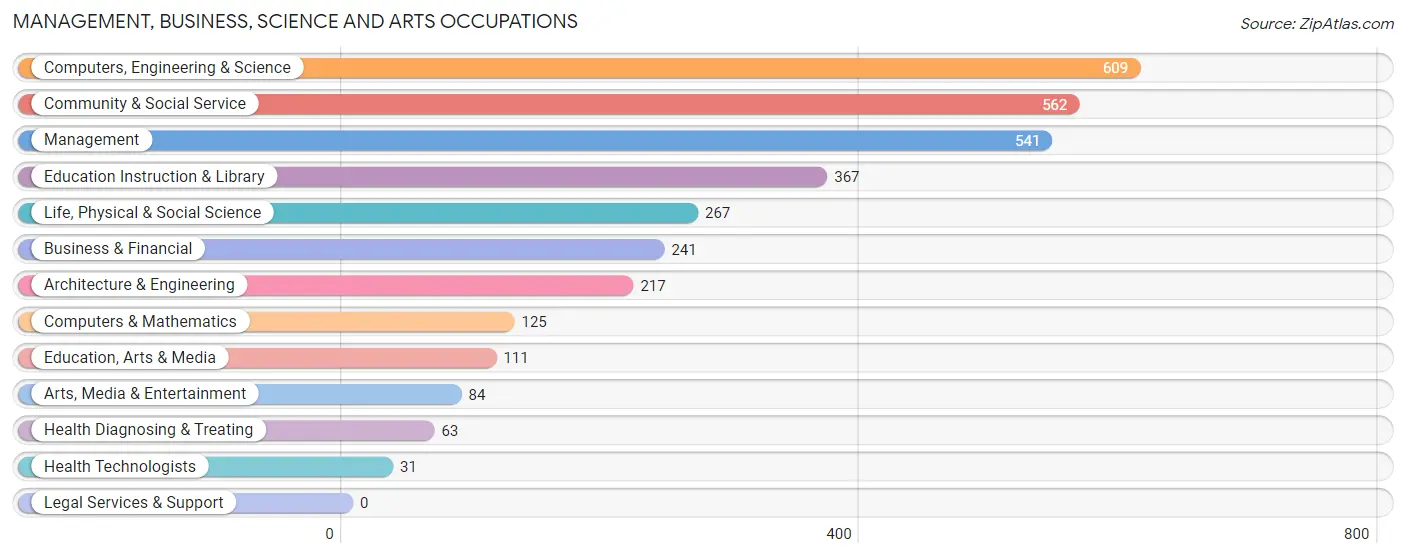
Management, Business, Science and Arts Occupations
The most common Management, Business, Science and Arts occupations in North Slope Borough are Computers, Engineering & Science (609 | 9.5%), Community & Social Service (562 | 8.7%), Management (541 | 8.4%), Education Instruction & Library (367 | 5.7%), and Life, Physical & Social Science (267 | 4.2%).
Management, Business, Science and Arts Occupations by Sex
Within the Management, Business, Science and Arts occupations in North Slope Borough, the most male-oriented occupations are Architecture & Engineering (78.8%), Computers, Engineering & Science (73.6%), and Life, Physical & Social Science (73.4%), while the most female-oriented occupations are Education, Arts & Media (73.0%), Business & Financial (72.6%), and Community & Social Service (67.4%).
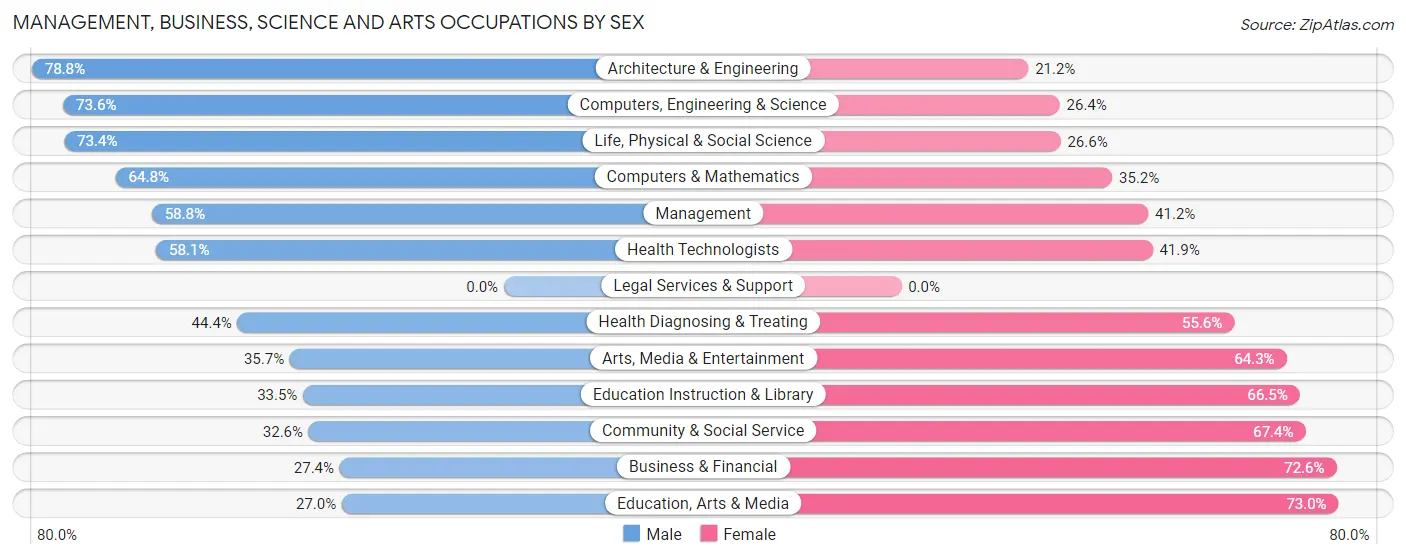
| Occupation | Male | Female |
| Management | 318 (58.8%) | 223 (41.2%) |
| Business & Financial | 66 (27.4%) | 175 (72.6%) |
| Computers, Engineering & Science | 448 (73.6%) | 161 (26.4%) |
| Computers & Mathematics | 81 (64.8%) | 44 (35.2%) |
| Architecture & Engineering | 171 (78.8%) | 46 (21.2%) |
| Life, Physical & Social Science | 196 (73.4%) | 71 (26.6%) |
| Community & Social Service | 183 (32.6%) | 379 (67.4%) |
| Education, Arts & Media | 30 (27.0%) | 81 (73.0%) |
| Legal Services & Support | 0 (0.0%) | 0 (0.0%) |
| Education Instruction & Library | 123 (33.5%) | 244 (66.5%) |
| Arts, Media & Entertainment | 30 (35.7%) | 54 (64.3%) |
| Health Diagnosing & Treating | 28 (44.4%) | 35 (55.6%) |
| Health Technologists | 18 (58.1%) | 13 (41.9%) |
| Total (Category) | 1,043 (51.7%) | 973 (48.3%) |
| Total (Overall) | 4,378 (68.1%) | 2,051 (31.9%) |
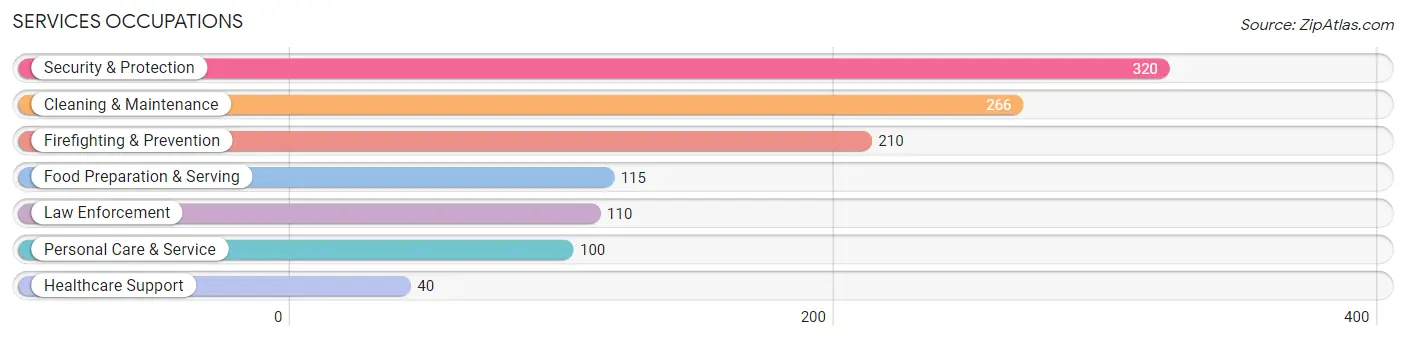
Services Occupations
The most common Services occupations in North Slope Borough are Security & Protection (320 | 5.0%), Cleaning & Maintenance (266 | 4.1%), Firefighting & Prevention (210 | 3.3%), Food Preparation & Serving (115 | 1.8%), and Law Enforcement (110 | 1.7%).
Services Occupations by Sex
Within the Services occupations in North Slope Borough, the most male-oriented occupations are Law Enforcement (84.6%), Security & Protection (82.8%), and Firefighting & Prevention (81.9%), while the most female-oriented occupations are Cleaning & Maintenance (50.4%), Healthcare Support (47.5%), and Personal Care & Service (34.0%).
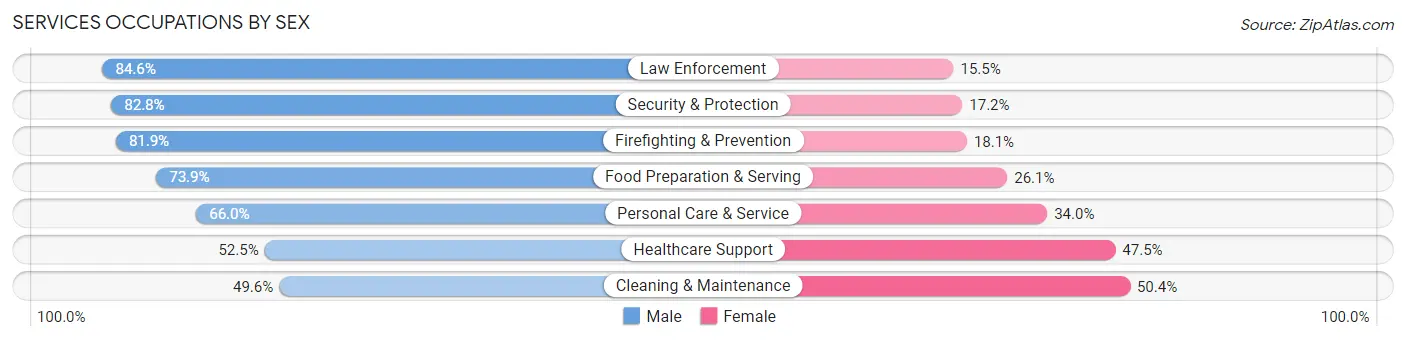
| Occupation | Male | Female |
| Healthcare Support | 21 (52.5%) | 19 (47.5%) |
| Security & Protection | 265 (82.8%) | 55 (17.2%) |
| Firefighting & Prevention | 172 (81.9%) | 38 (18.1%) |
| Law Enforcement | 93 (84.6%) | 17 (15.4%) |
| Food Preparation & Serving | 85 (73.9%) | 30 (26.1%) |
| Cleaning & Maintenance | 132 (49.6%) | 134 (50.4%) |
| Personal Care & Service | 66 (66.0%) | 34 (34.0%) |
| Total (Category) | 569 (67.7%) | 272 (32.3%) |
| Total (Overall) | 4,378 (68.1%) | 2,051 (31.9%) |
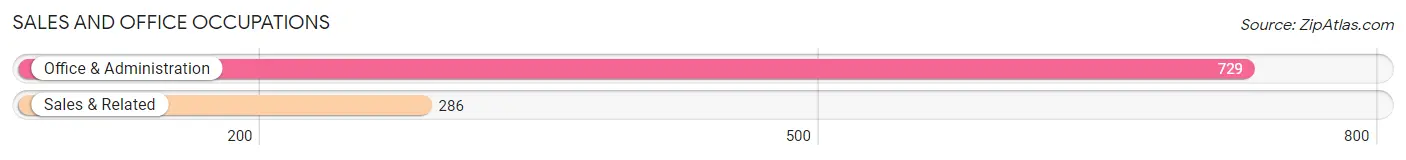
Sales and Office Occupations
The most common Sales and Office occupations in North Slope Borough are Office & Administration (729 | 11.3%), and Sales & Related (286 | 4.4%).
Sales and Office Occupations by Sex
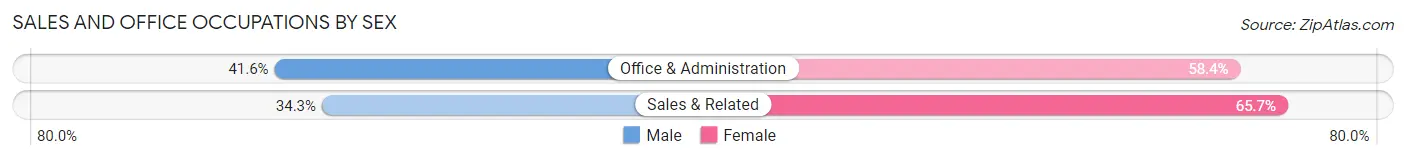
| Occupation | Male | Female |
| Sales & Related | 98 (34.3%) | 188 (65.7%) |
| Office & Administration | 303 (41.6%) | 426 (58.4%) |
| Total (Category) | 401 (39.5%) | 614 (60.5%) |
| Total (Overall) | 4,378 (68.1%) | 2,051 (31.9%) |
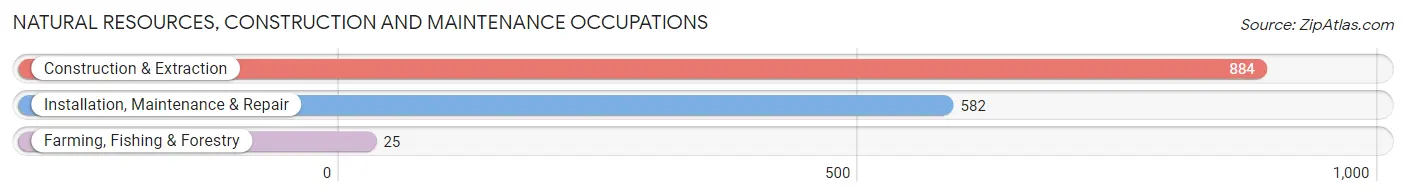
Natural Resources, Construction and Maintenance Occupations
The most common Natural Resources, Construction and Maintenance occupations in North Slope Borough are Construction & Extraction (884 | 13.8%), Installation, Maintenance & Repair (582 | 9.0%), and Farming, Fishing & Forestry (25 | 0.4%).
Natural Resources, Construction and Maintenance Occupations by Sex
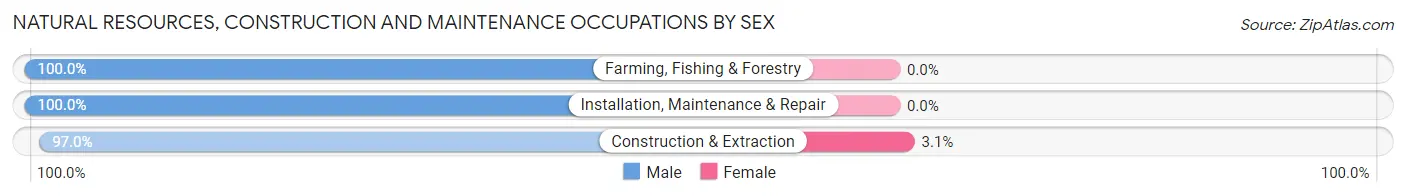
| Occupation | Male | Female |
| Farming, Fishing & Forestry | 25 (100.0%) | 0 (0.0%) |
| Construction & Extraction | 857 (97.0%) | 27 (3.0%) |
| Installation, Maintenance & Repair | 582 (100.0%) | 0 (0.0%) |
| Total (Category) | 1,464 (98.2%) | 27 (1.8%) |
| Total (Overall) | 4,378 (68.1%) | 2,051 (31.9%) |
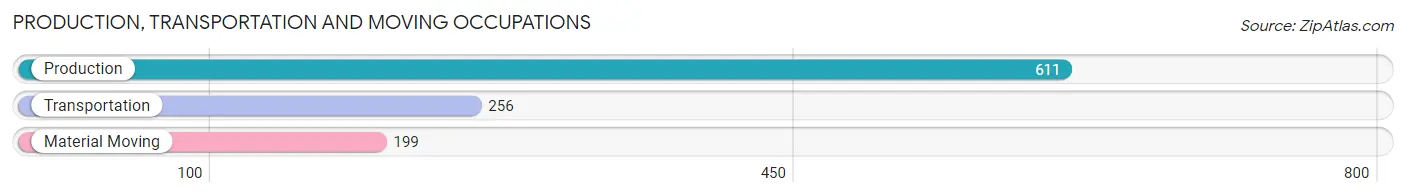
Production, Transportation and Moving Occupations
The most common Production, Transportation and Moving occupations in North Slope Borough are Production (611 | 9.5%), Transportation (256 | 4.0%), and Material Moving (199 | 3.1%).
Production, Transportation and Moving Occupations by Sex
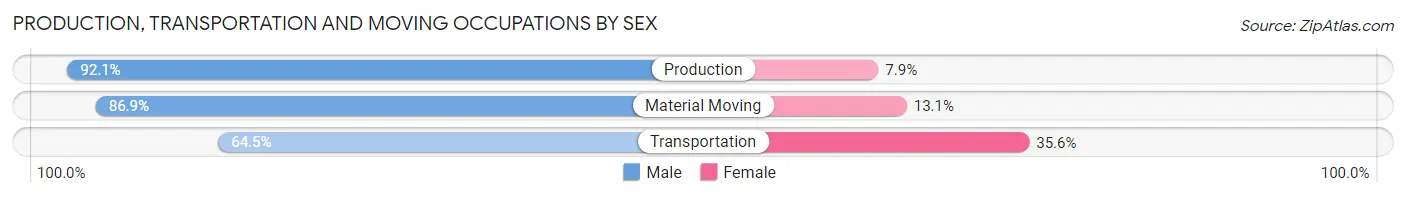
| Occupation | Male | Female |
| Production | 563 (92.1%) | 48 (7.9%) |
| Transportation | 165 (64.4%) | 91 (35.5%) |
| Material Moving | 173 (86.9%) | 26 (13.1%) |
| Total (Category) | 901 (84.5%) | 165 (15.5%) |
| Total (Overall) | 4,378 (68.1%) | 2,051 (31.9%) |
Employment Industries by Sex in North Slope Borough
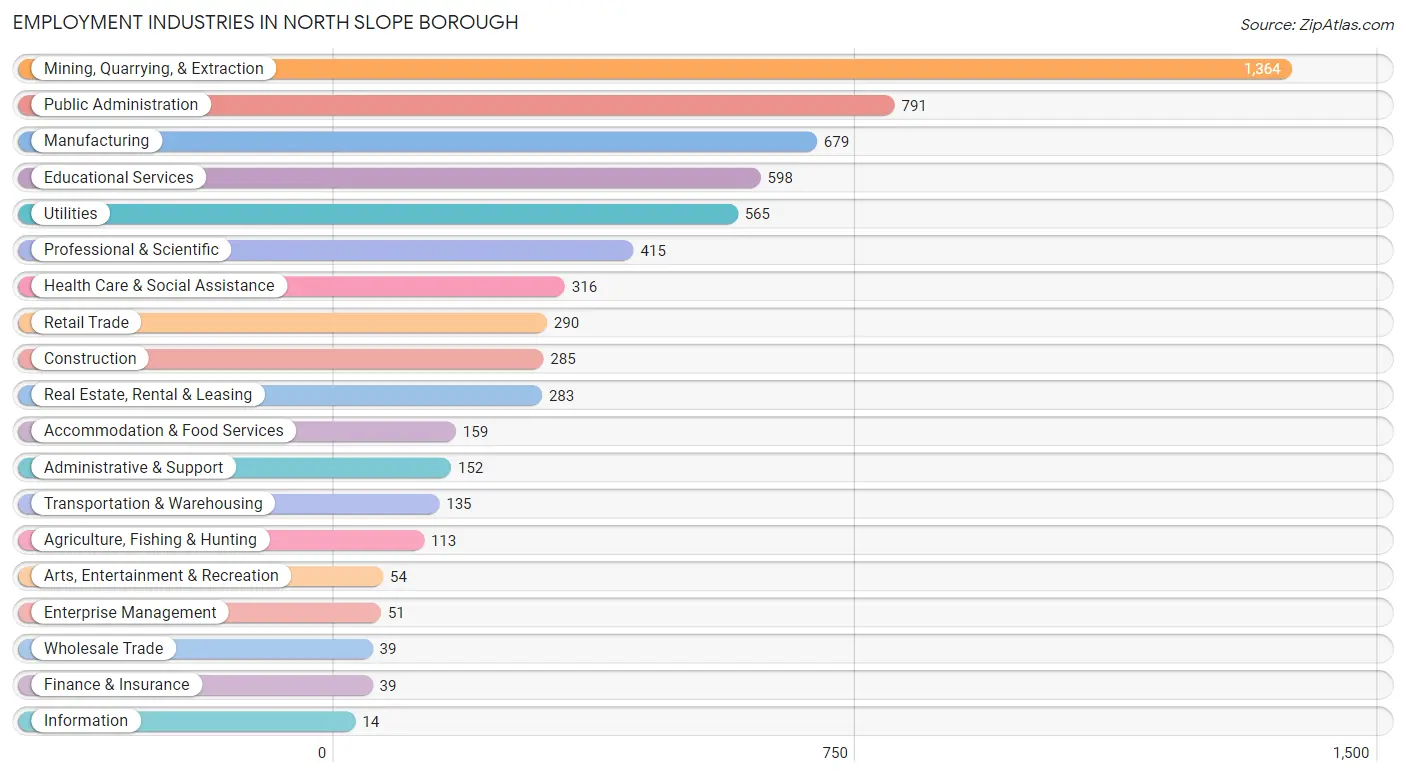
Employment Industries in North Slope Borough
The major employment industries in North Slope Borough include Mining, Quarrying, & Extraction (1,364 | 21.2%), Public Administration (791 | 12.3%), Manufacturing (679 | 10.6%), Educational Services (598 | 9.3%), and Utilities (565 | 8.8%).
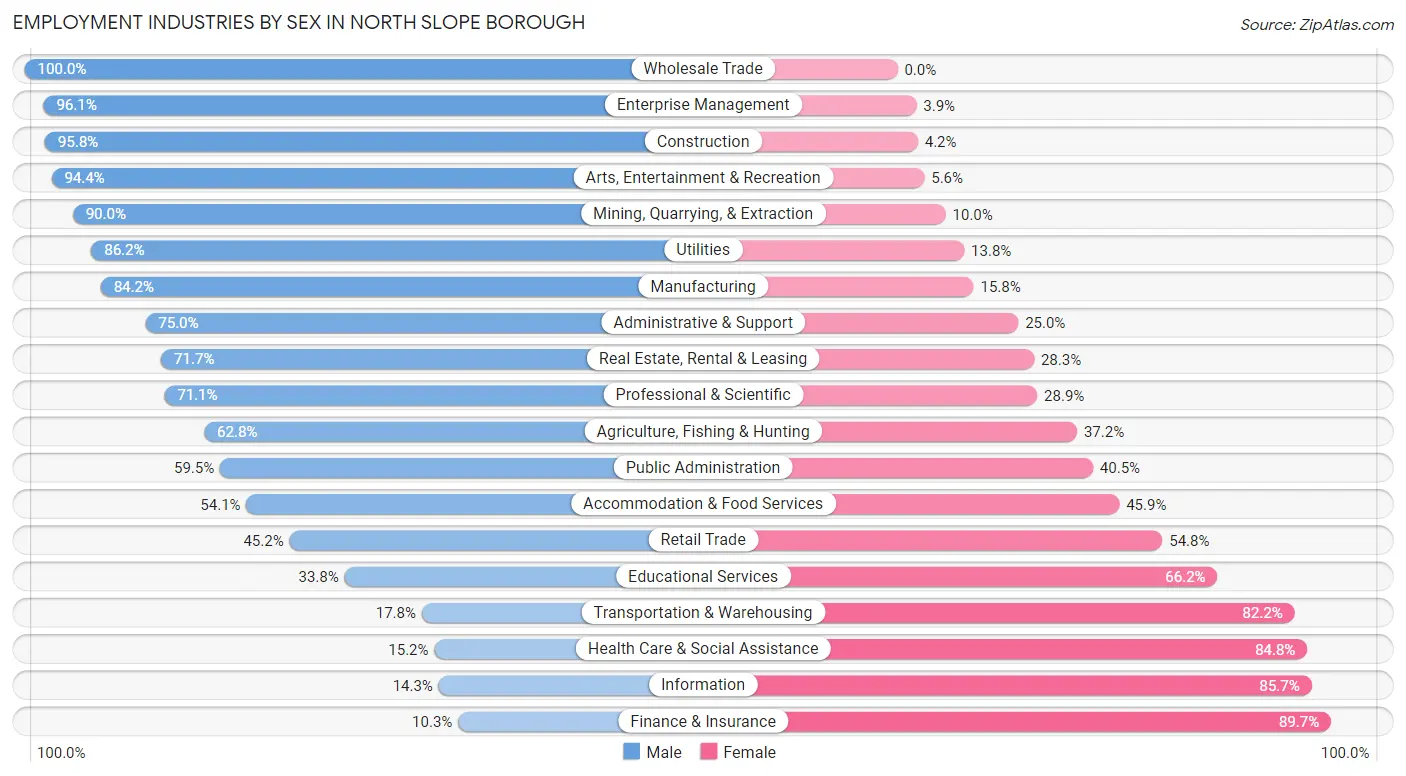
Employment Industries by Sex in North Slope Borough
The North Slope Borough industries that see more men than women are Wholesale Trade (100.0%), Enterprise Management (96.1%), and Construction (95.8%), whereas the industries that tend to have a higher number of women are Finance & Insurance (89.7%), Information (85.7%), and Health Care & Social Assistance (84.8%).
| Industry | Male | Female |
| Agriculture, Fishing & Hunting | 71 (62.8%) | 42 (37.2%) |
| Mining, Quarrying, & Extraction | 1,228 (90.0%) | 136 (10.0%) |
| Construction | 273 (95.8%) | 12 (4.2%) |
| Manufacturing | 572 (84.2%) | 107 (15.8%) |
| Wholesale Trade | 39 (100.0%) | 0 (0.0%) |
| Retail Trade | 131 (45.2%) | 159 (54.8%) |
| Transportation & Warehousing | 24 (17.8%) | 111 (82.2%) |
| Utilities | 487 (86.2%) | 78 (13.8%) |
| Information | 2 (14.3%) | 12 (85.7%) |
| Finance & Insurance | 4 (10.3%) | 35 (89.7%) |
| Real Estate, Rental & Leasing | 203 (71.7%) | 80 (28.3%) |
| Professional & Scientific | 295 (71.1%) | 120 (28.9%) |
| Enterprise Management | 49 (96.1%) | 2 (3.9%) |
| Administrative & Support | 114 (75.0%) | 38 (25.0%) |
| Educational Services | 202 (33.8%) | 396 (66.2%) |
| Health Care & Social Assistance | 48 (15.2%) | 268 (84.8%) |
| Arts, Entertainment & Recreation | 51 (94.4%) | 3 (5.6%) |
| Accommodation & Food Services | 86 (54.1%) | 73 (45.9%) |
| Public Administration | 471 (59.5%) | 320 (40.5%) |
| Total | 4,378 (68.1%) | 2,051 (31.9%) |
Education in North Slope Borough
School Enrollment in North Slope Borough
The most common levels of schooling among the 2,385 students in North Slope Borough are elementary school (639 | 26.8%), high school (588 | 24.6%), and middle school (500 | 21.0%).
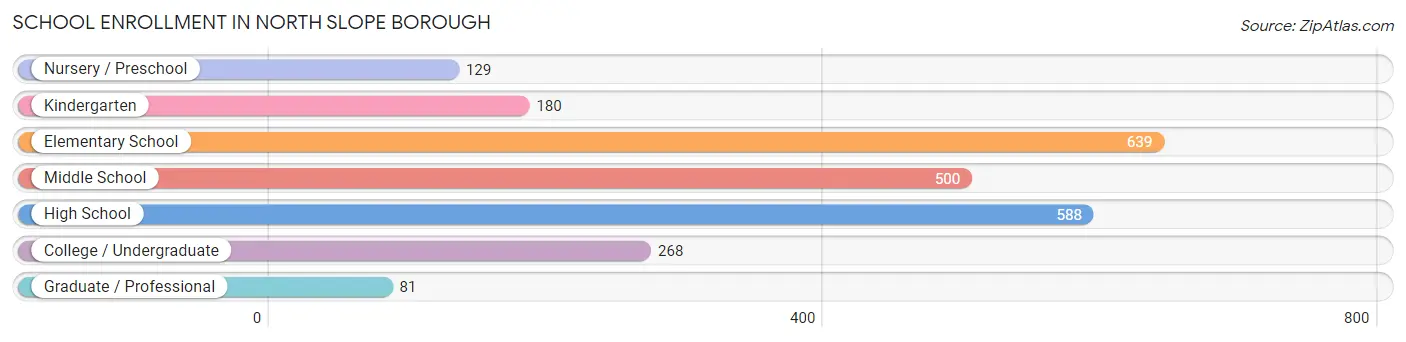
| School Level | # Students | % Students |
| Nursery / Preschool | 129 | 5.4% |
| Kindergarten | 180 | 7.5% |
| Elementary School | 639 | 26.8% |
| Middle School | 500 | 21.0% |
| High School | 588 | 24.6% |
| College / Undergraduate | 268 | 11.2% |
| Graduate / Professional | 81 | 3.4% |
| Total | 2,385 | 100.0% |
School Enrollment by Age by Funding Source in North Slope Borough
Out of a total of 2,385 students who are enrolled in schools in North Slope Borough, 122 (5.1%) attend a private institution, while the remaining 2,263 (94.9%) are enrolled in public schools. The age group of 25 to 34 year olds has the highest likelihood of being enrolled in private schools, with 19 (16.7% in the age bracket) enrolled. Conversely, the age group of 3 to 4 year olds has the lowest likelihood of being enrolled in a private school, with 150 (100.0% in the age bracket) attending a public institution.
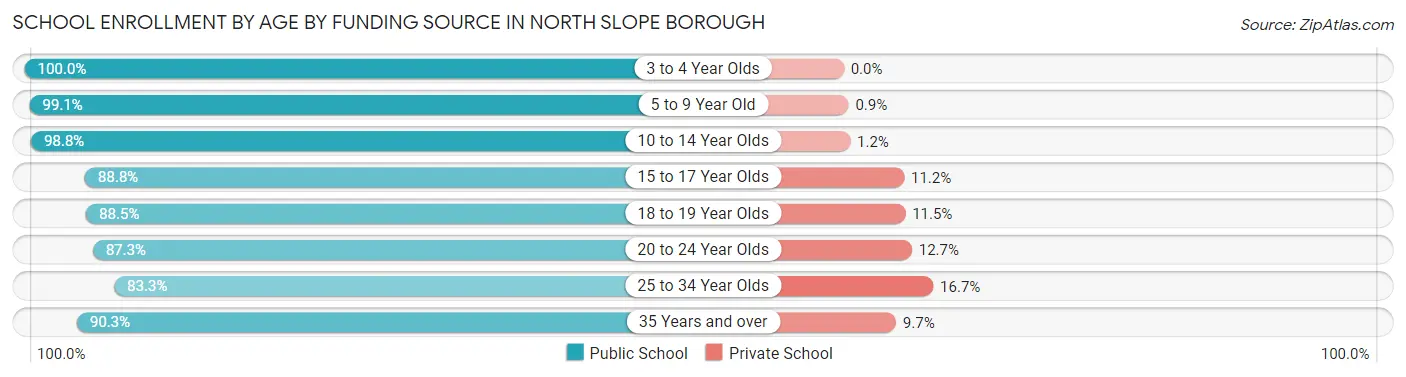
| Age Bracket | Public School | Private School |
| 3 to 4 Year Olds | 150 (100.0%) | 0 (0.0%) |
| 5 to 9 Year Old | 662 (99.1%) | 6 (0.9%) |
| 10 to 14 Year Olds | 666 (98.8%) | 8 (1.2%) |
| 15 to 17 Year Olds | 387 (88.8%) | 49 (11.2%) |
| 18 to 19 Year Olds | 85 (88.5%) | 11 (11.5%) |
| 20 to 24 Year Olds | 117 (87.3%) | 17 (12.7%) |
| 25 to 34 Year Olds | 95 (83.3%) | 19 (16.7%) |
| 35 Years and over | 102 (90.3%) | 11 (9.7%) |
| Total | 2,263 (94.9%) | 122 (5.1%) |
Educational Attainment by Field of Study in North Slope Borough
Engineering (173 | 14.6%), business (159 | 13.4%), education (148 | 12.5%), bio, nature & agricultural (144 | 12.2%), and physical & health sciences (113 | 9.6%) are the most common fields of study among 1,183 individuals in North Slope Borough who have obtained a bachelor's degree or higher.
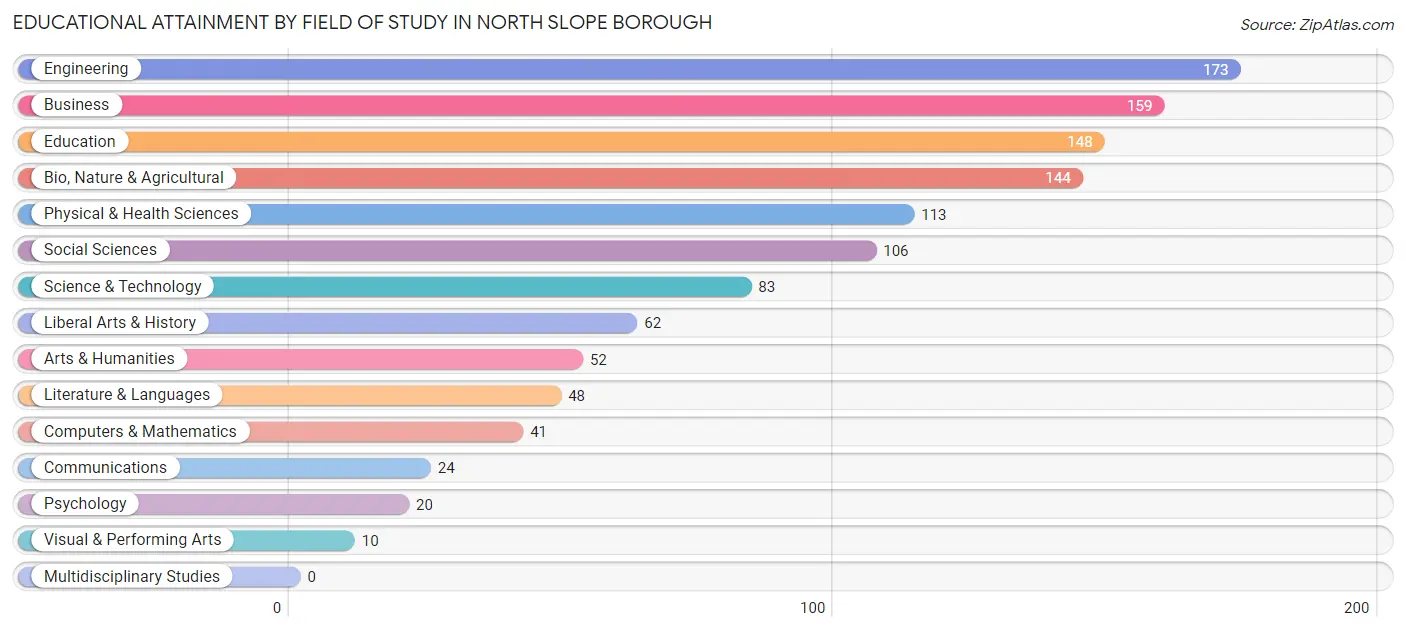
| Field of Study | # Graduates | % Graduates |
| Computers & Mathematics | 41 | 3.5% |
| Bio, Nature & Agricultural | 144 | 12.2% |
| Physical & Health Sciences | 113 | 9.6% |
| Psychology | 20 | 1.7% |
| Social Sciences | 106 | 9.0% |
| Engineering | 173 | 14.6% |
| Multidisciplinary Studies | 0 | 0.0% |
| Science & Technology | 83 | 7.0% |
| Business | 159 | 13.4% |
| Education | 148 | 12.5% |
| Literature & Languages | 48 | 4.1% |
| Liberal Arts & History | 62 | 5.2% |
| Visual & Performing Arts | 10 | 0.9% |
| Communications | 24 | 2.0% |
| Arts & Humanities | 52 | 4.4% |
| Total | 1,183 | 100.0% |
Transportation & Commute in North Slope Borough
Vehicle Availability by Sex in North Slope Borough
The most prevalent vehicle ownership categories in North Slope Borough are males with 1 vehicle (436, accounting for 33.2%) and females with 1 vehicle (481, making up 34.3%).
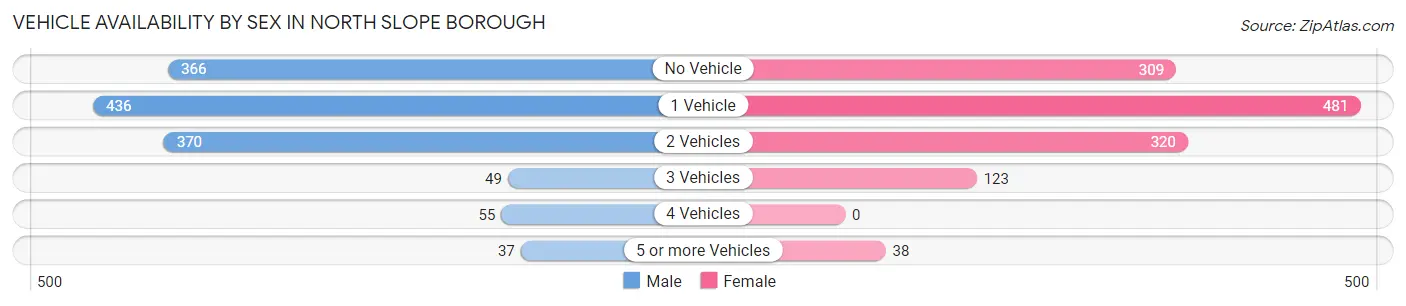
| Vehicles Available | Male | Female |
| No Vehicle | 366 (27.9%) | 309 (24.3%) |
| 1 Vehicle | 436 (33.2%) | 481 (37.8%) |
| 2 Vehicles | 370 (28.2%) | 320 (25.2%) |
| 3 Vehicles | 49 (3.7%) | 123 (9.7%) |
| 4 Vehicles | 55 (4.2%) | 0 (0.0%) |
| 5 or more Vehicles | 37 (2.8%) | 38 (3.0%) |
| Total | 1,313 (100.0%) | 1,271 (100.0%) |
Commute Time in North Slope Borough
The most frequently occuring commute durations in North Slope Borough are 5 to 9 minutes (3,084 commuters, 50.6%), less than 5 minutes (976 commuters, 16.0%), and 10 to 14 minutes (941 commuters, 15.4%).
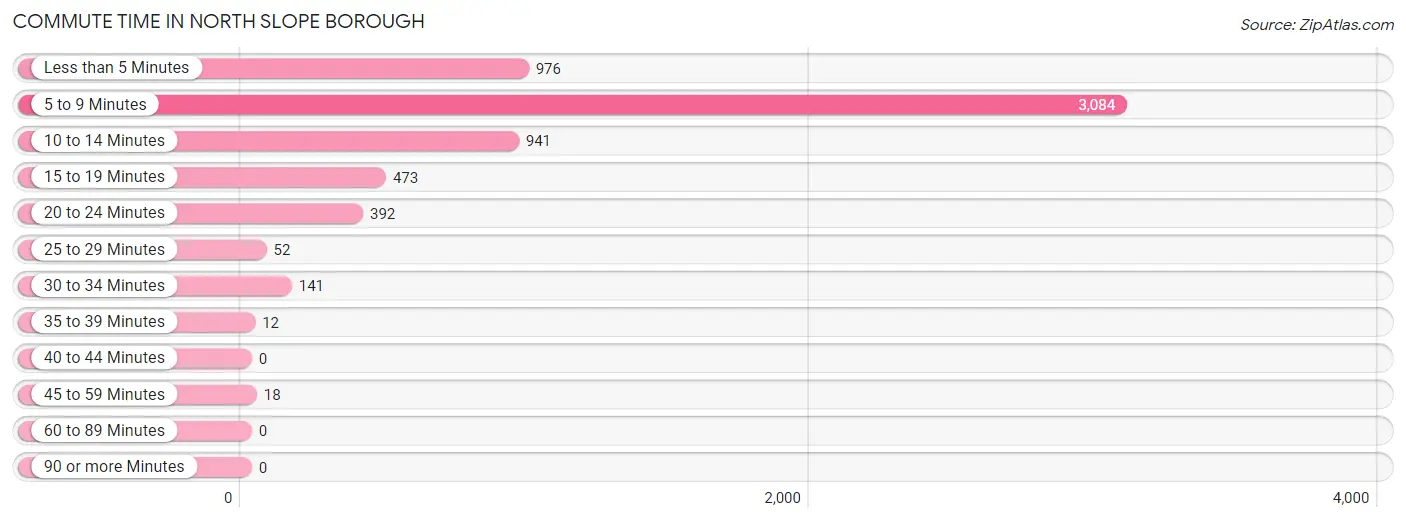
| Commute Time | # Commuters | % Commuters |
| Less than 5 Minutes | 976 | 16.0% |
| 5 to 9 Minutes | 3,084 | 50.6% |
| 10 to 14 Minutes | 941 | 15.4% |
| 15 to 19 Minutes | 473 | 7.8% |
| 20 to 24 Minutes | 392 | 6.4% |
| 25 to 29 Minutes | 52 | 0.9% |
| 30 to 34 Minutes | 141 | 2.3% |
| 35 to 39 Minutes | 12 | 0.2% |
| 40 to 44 Minutes | 0 | 0.0% |
| 45 to 59 Minutes | 18 | 0.3% |
| 60 to 89 Minutes | 0 | 0.0% |
| 90 or more Minutes | 0 | 0.0% |
Commute Time by Sex in North Slope Borough
The most common commute times in North Slope Borough are 5 to 9 minutes (2,116 commuters, 50.1%) for males and 5 to 9 minutes (968 commuters, 51.8%) for females.
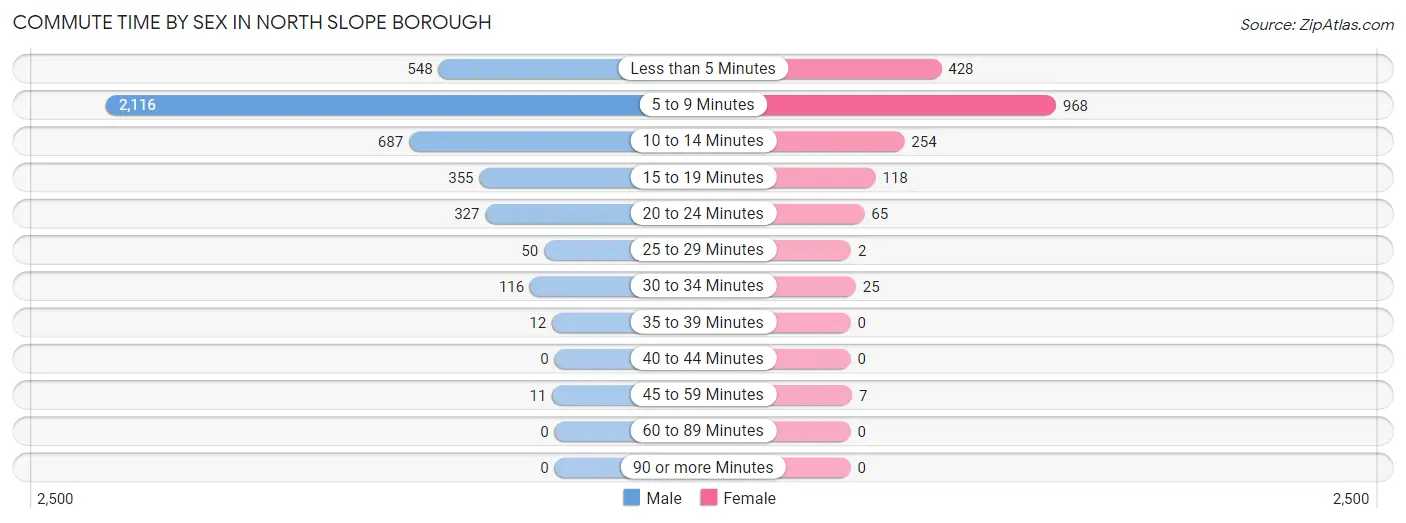
| Commute Time | Male | Female |
| Less than 5 Minutes | 548 (13.0%) | 428 (22.9%) |
| 5 to 9 Minutes | 2,116 (50.1%) | 968 (51.8%) |
| 10 to 14 Minutes | 687 (16.3%) | 254 (13.6%) |
| 15 to 19 Minutes | 355 (8.4%) | 118 (6.3%) |
| 20 to 24 Minutes | 327 (7.7%) | 65 (3.5%) |
| 25 to 29 Minutes | 50 (1.2%) | 2 (0.1%) |
| 30 to 34 Minutes | 116 (2.8%) | 25 (1.3%) |
| 35 to 39 Minutes | 12 (0.3%) | 0 (0.0%) |
| 40 to 44 Minutes | 0 (0.0%) | 0 (0.0%) |
| 45 to 59 Minutes | 11 (0.3%) | 7 (0.4%) |
| 60 to 89 Minutes | 0 (0.0%) | 0 (0.0%) |
| 90 or more Minutes | 0 (0.0%) | 0 (0.0%) |
Time of Departure to Work by Sex in North Slope Borough
The most frequent times of departure to work in North Slope Borough are 5:00 AM to 5:29 AM (847, 20.1%) for males and 8:00 AM to 8:29 AM (361, 19.3%) for females.
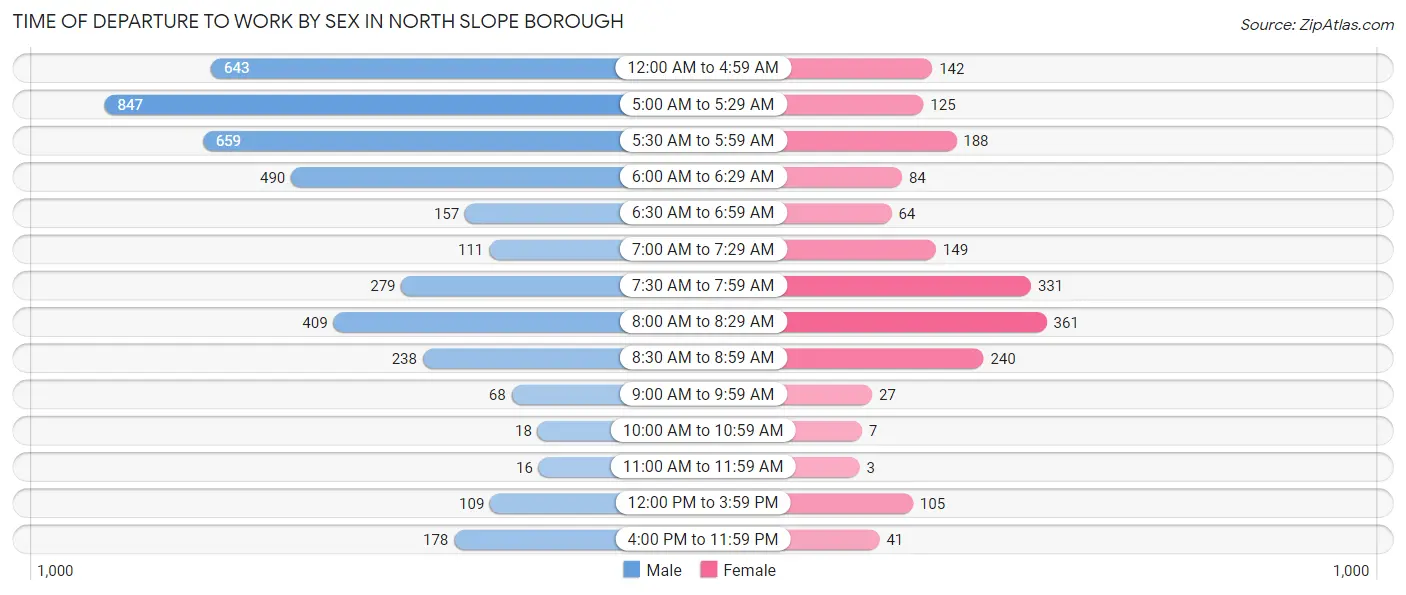
| Time of Departure | Male | Female |
| 12:00 AM to 4:59 AM | 643 (15.2%) | 142 (7.6%) |
| 5:00 AM to 5:29 AM | 847 (20.1%) | 125 (6.7%) |
| 5:30 AM to 5:59 AM | 659 (15.6%) | 188 (10.1%) |
| 6:00 AM to 6:29 AM | 490 (11.6%) | 84 (4.5%) |
| 6:30 AM to 6:59 AM | 157 (3.7%) | 64 (3.4%) |
| 7:00 AM to 7:29 AM | 111 (2.6%) | 149 (8.0%) |
| 7:30 AM to 7:59 AM | 279 (6.6%) | 331 (17.7%) |
| 8:00 AM to 8:29 AM | 409 (9.7%) | 361 (19.3%) |
| 8:30 AM to 8:59 AM | 238 (5.6%) | 240 (12.9%) |
| 9:00 AM to 9:59 AM | 68 (1.6%) | 27 (1.5%) |
| 10:00 AM to 10:59 AM | 18 (0.4%) | 7 (0.4%) |
| 11:00 AM to 11:59 AM | 16 (0.4%) | 3 (0.2%) |
| 12:00 PM to 3:59 PM | 109 (2.6%) | 105 (5.6%) |
| 4:00 PM to 11:59 PM | 178 (4.2%) | 41 (2.2%) |
| Total | 4,222 (100.0%) | 1,867 (100.0%) |
Housing Occupancy in North Slope Borough
Occupancy by Ownership in North Slope Borough
Of the total 2,168 dwellings in North Slope Borough, owner-occupied units account for 1,012 (46.7%), while renter-occupied units make up 1,156 (53.3%).

| Occupancy | # Housing Units | % Housing Units |
| Owner Occupied Housing Units | 1,012 | 46.7% |
| Renter-Occupied Housing Units | 1,156 | 53.3% |
| Total Occupied Housing Units | 2,168 | 100.0% |
Occupancy by Household Size in North Slope Borough
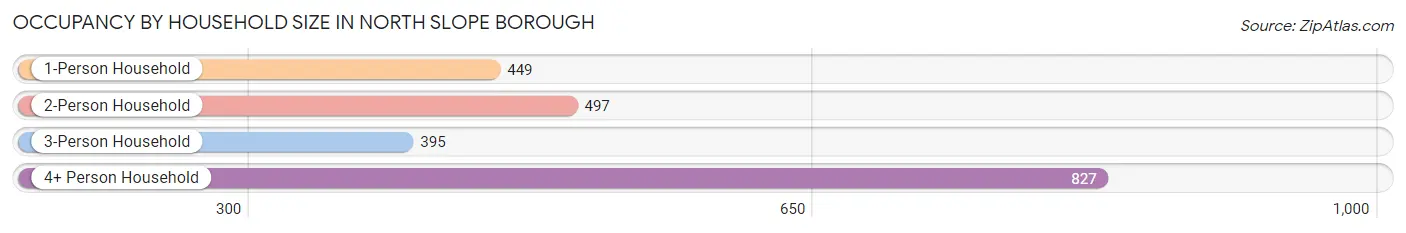
| Household Size | # Housing Units | % Housing Units |
| 1-Person Household | 449 | 20.7% |
| 2-Person Household | 497 | 22.9% |
| 3-Person Household | 395 | 18.2% |
| 4+ Person Household | 827 | 38.2% |
| Total Housing Units | 2,168 | 100.0% |
Occupancy by Ownership by Household Size in North Slope Borough
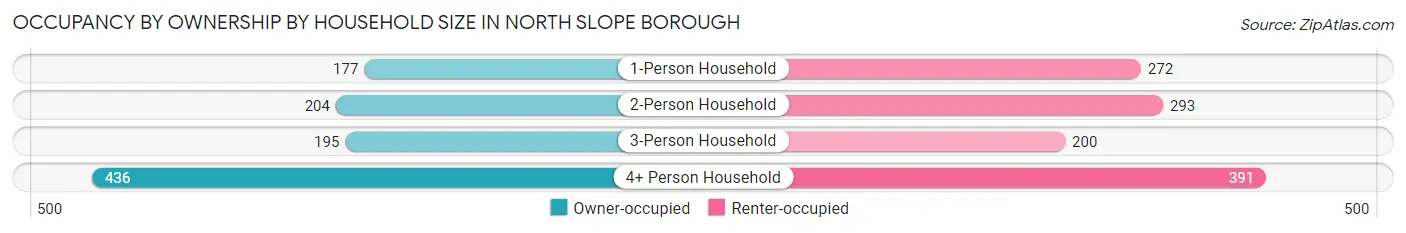
| Household Size | Owner-occupied | Renter-occupied |
| 1-Person Household | 177 (39.4%) | 272 (60.6%) |
| 2-Person Household | 204 (41.0%) | 293 (59.0%) |
| 3-Person Household | 195 (49.4%) | 200 (50.6%) |
| 4+ Person Household | 436 (52.7%) | 391 (47.3%) |
| Total Housing Units | 1,012 (46.7%) | 1,156 (53.3%) |
Occupancy by Educational Attainment in North Slope Borough
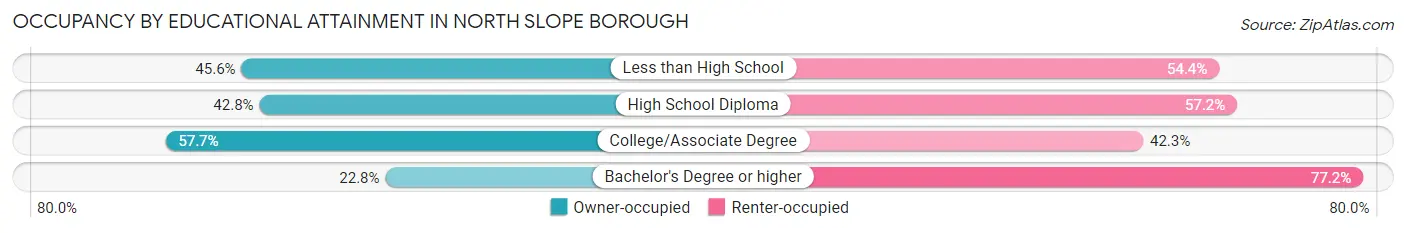
| Household Size | Owner-occupied | Renter-occupied |
| Less than High School | 135 (45.6%) | 161 (54.4%) |
| High School Diploma | 322 (42.8%) | 431 (57.2%) |
| College/Associate Degree | 496 (57.7%) | 364 (42.3%) |
| Bachelor's Degree or higher | 59 (22.8%) | 200 (77.2%) |
Occupancy by Age of Householder in North Slope Borough
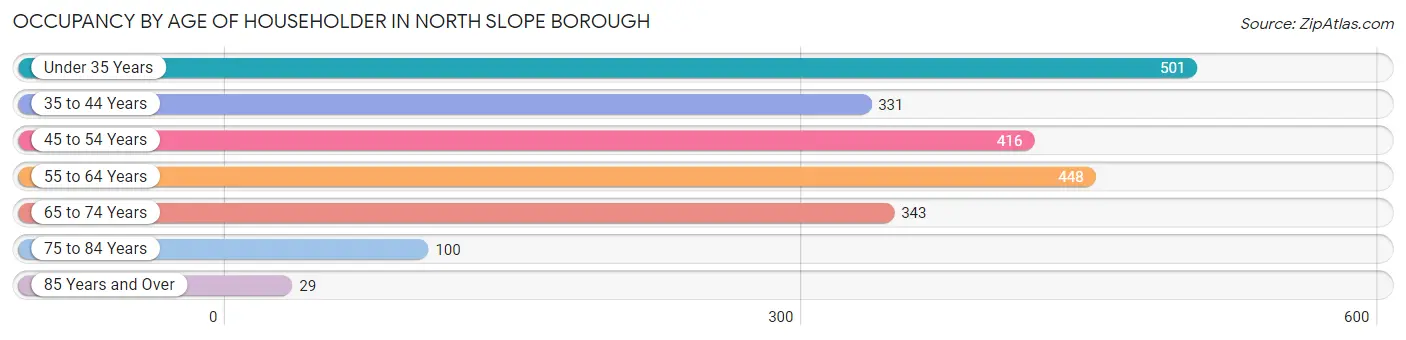
| Age Bracket | # Households | % Households |
| Under 35 Years | 501 | 23.1% |
| 35 to 44 Years | 331 | 15.3% |
| 45 to 54 Years | 416 | 19.2% |
| 55 to 64 Years | 448 | 20.7% |
| 65 to 74 Years | 343 | 15.8% |
| 75 to 84 Years | 100 | 4.6% |
| 85 Years and Over | 29 | 1.3% |
| Total | 2,168 | 100.0% |
Housing Finances in North Slope Borough
Median Income by Occupancy in North Slope Borough
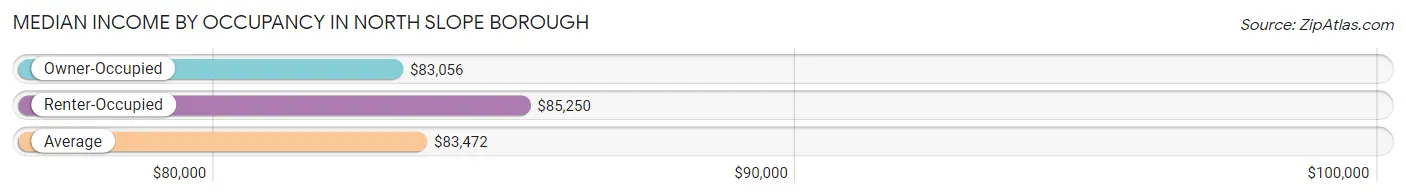
| Occupancy Type | # Households | Median Income |
| Owner-Occupied | 1,012 (46.7%) | $83,056 |
| Renter-Occupied | 1,156 (53.3%) | $85,250 |
| Average | 2,168 (100.0%) | $83,472 |
Occupancy by Householder Income Bracket in North Slope Borough
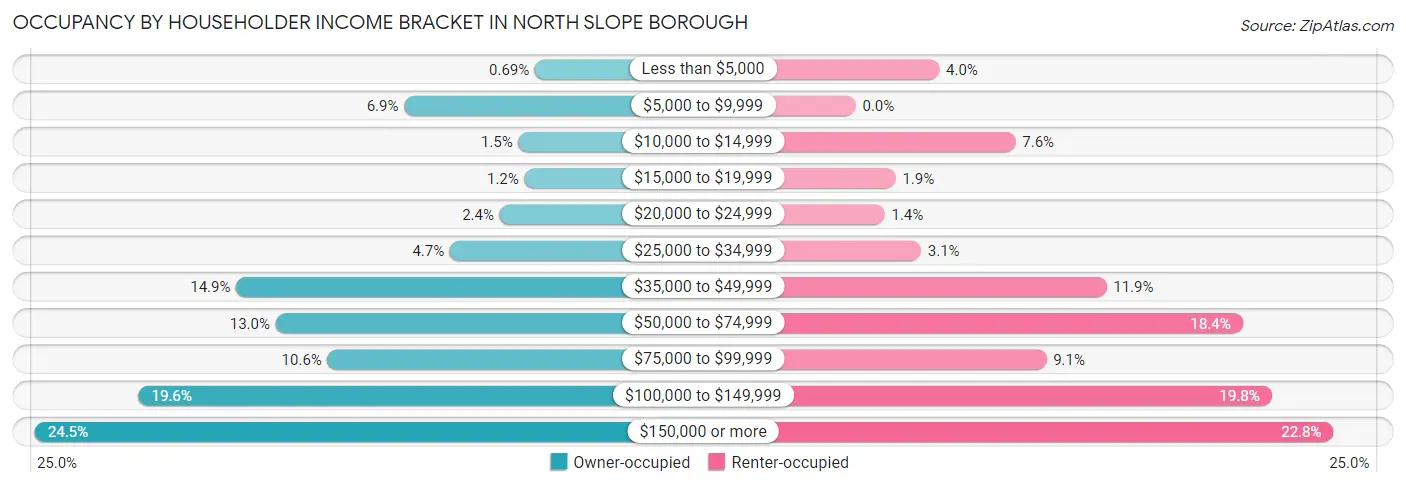
| Income Bracket | Owner-occupied | Renter-occupied |
| Less than $5,000 | 7 (0.7%) | 46 (4.0%) |
| $5,000 to $9,999 | 70 (6.9%) | 0 (0.0%) |
| $10,000 to $14,999 | 15 (1.5%) | 88 (7.6%) |
| $15,000 to $19,999 | 12 (1.2%) | 22 (1.9%) |
| $20,000 to $24,999 | 24 (2.4%) | 16 (1.4%) |
| $25,000 to $34,999 | 48 (4.7%) | 36 (3.1%) |
| $35,000 to $49,999 | 151 (14.9%) | 138 (11.9%) |
| $50,000 to $74,999 | 132 (13.0%) | 213 (18.4%) |
| $75,000 to $99,999 | 107 (10.6%) | 105 (9.1%) |
| $100,000 to $149,999 | 198 (19.6%) | 229 (19.8%) |
| $150,000 or more | 248 (24.5%) | 263 (22.8%) |
| Total | 1,012 (100.0%) | 1,156 (100.0%) |
Monthly Housing Cost Tiers in North Slope Borough
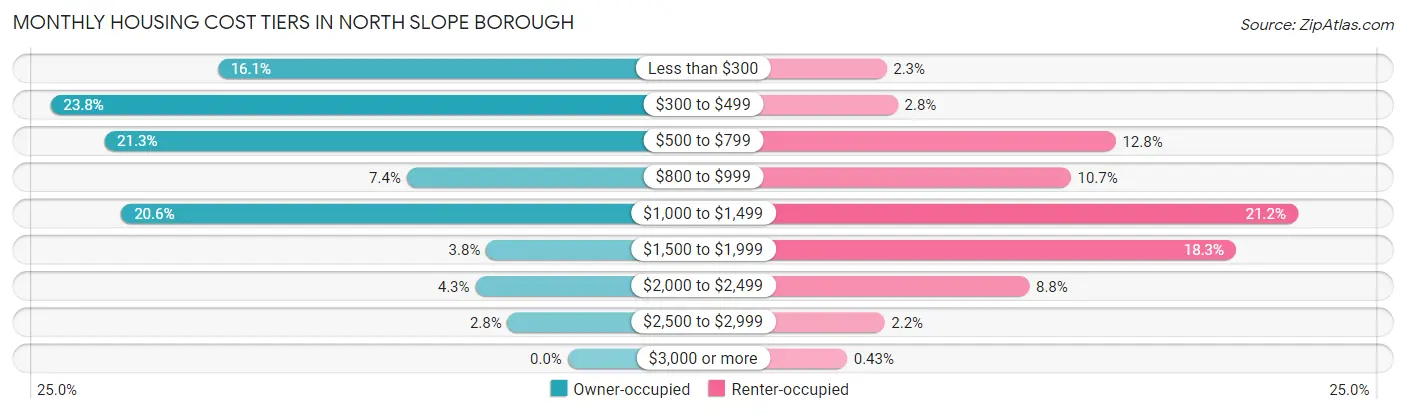
| Monthly Cost | Owner-occupied | Renter-occupied |
| Less than $300 | 163 (16.1%) | 26 (2.2%) |
| $300 to $499 | 241 (23.8%) | 32 (2.8%) |
| $500 to $799 | 216 (21.3%) | 148 (12.8%) |
| $800 to $999 | 75 (7.4%) | 124 (10.7%) |
| $1,000 to $1,499 | 208 (20.5%) | 245 (21.2%) |
| $1,500 to $1,999 | 38 (3.7%) | 212 (18.3%) |
| $2,000 to $2,499 | 43 (4.3%) | 102 (8.8%) |
| $2,500 to $2,999 | 28 (2.8%) | 25 (2.2%) |
| $3,000 or more | 0 (0.0%) | 5 (0.4%) |
| Total | 1,012 (100.0%) | 1,156 (100.0%) |
Physical Housing Characteristics in North Slope Borough
Housing Structures in North Slope Borough
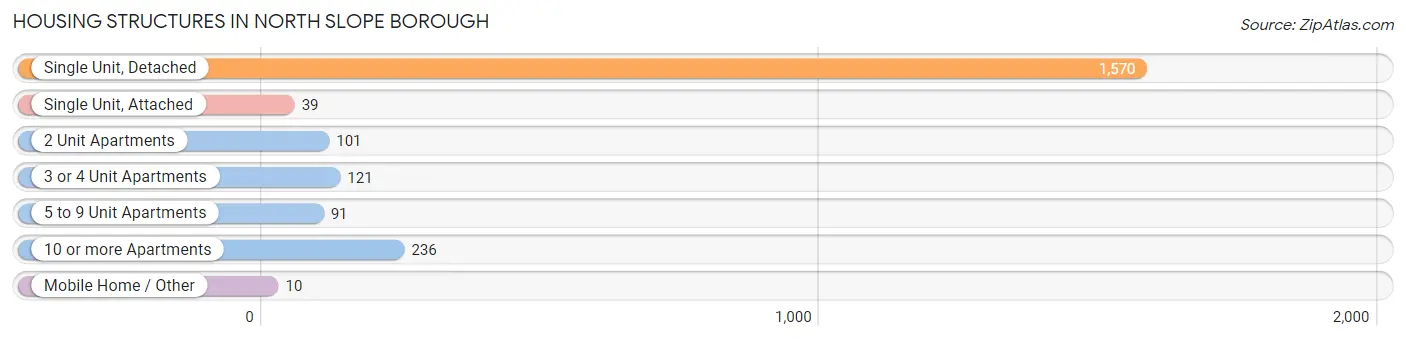
| Structure Type | # Housing Units | % Housing Units |
| Single Unit, Detached | 1,570 | 72.4% |
| Single Unit, Attached | 39 | 1.8% |
| 2 Unit Apartments | 101 | 4.7% |
| 3 or 4 Unit Apartments | 121 | 5.6% |
| 5 to 9 Unit Apartments | 91 | 4.2% |
| 10 or more Apartments | 236 | 10.9% |
| Mobile Home / Other | 10 | 0.5% |
| Total | 2,168 | 100.0% |
Housing Structures by Occupancy in North Slope Borough
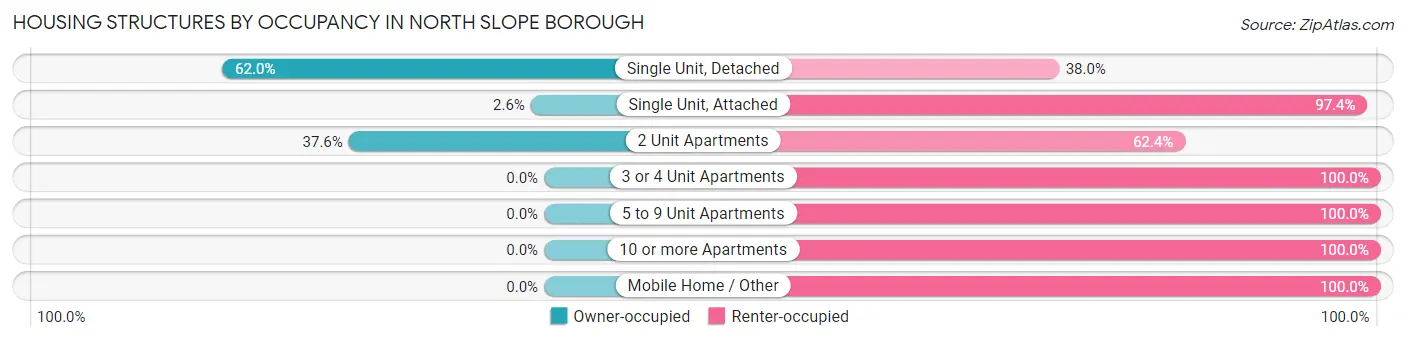
| Structure Type | Owner-occupied | Renter-occupied |
| Single Unit, Detached | 973 (62.0%) | 597 (38.0%) |
| Single Unit, Attached | 1 (2.6%) | 38 (97.4%) |
| 2 Unit Apartments | 38 (37.6%) | 63 (62.4%) |
| 3 or 4 Unit Apartments | 0 (0.0%) | 121 (100.0%) |
| 5 to 9 Unit Apartments | 0 (0.0%) | 91 (100.0%) |
| 10 or more Apartments | 0 (0.0%) | 236 (100.0%) |
| Mobile Home / Other | 0 (0.0%) | 10 (100.0%) |
| Total | 1,012 (46.7%) | 1,156 (53.3%) |
Housing Structures by Number of Rooms in North Slope Borough
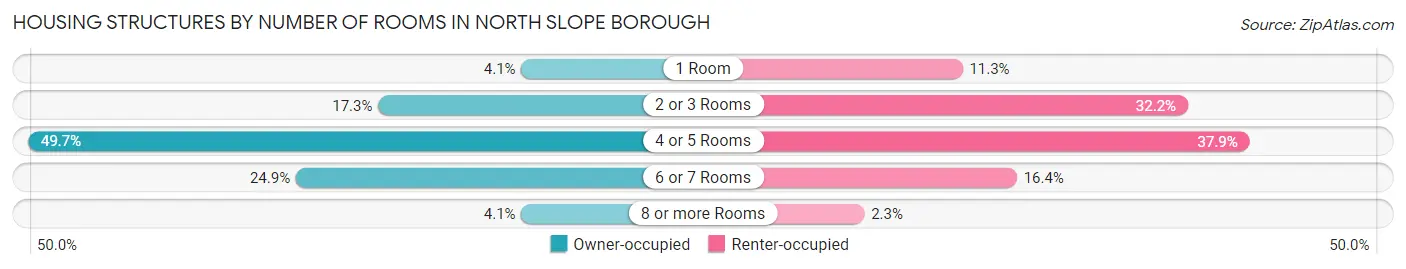
| Number of Rooms | Owner-occupied | Renter-occupied |
| 1 Room | 41 (4.1%) | 131 (11.3%) |
| 2 or 3 Rooms | 175 (17.3%) | 372 (32.2%) |
| 4 or 5 Rooms | 503 (49.7%) | 438 (37.9%) |
| 6 or 7 Rooms | 252 (24.9%) | 189 (16.4%) |
| 8 or more Rooms | 41 (4.1%) | 26 (2.2%) |
| Total | 1,012 (100.0%) | 1,156 (100.0%) |
Housing Structure by Heating Type in North Slope Borough
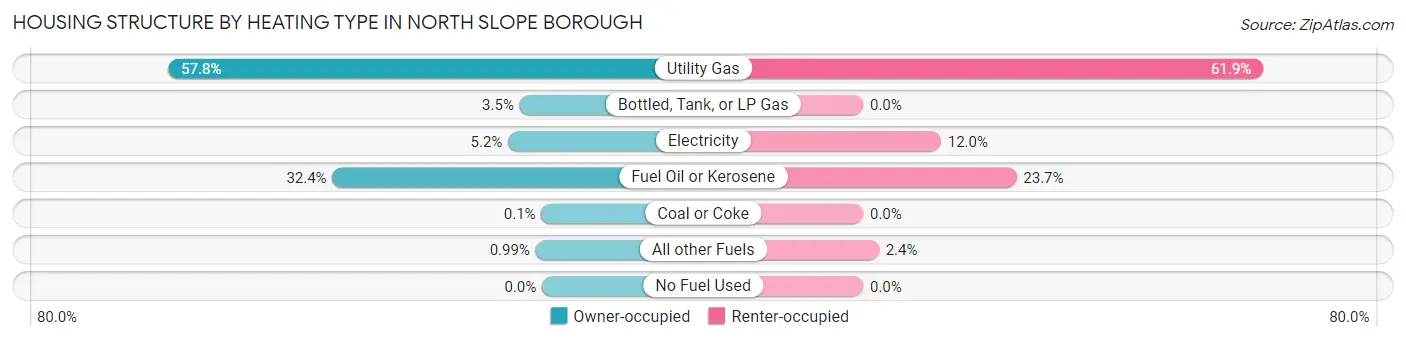
| Heating Type | Owner-occupied | Renter-occupied |
| Utility Gas | 585 (57.8%) | 715 (61.9%) |
| Bottled, Tank, or LP Gas | 35 (3.5%) | 0 (0.0%) |
| Electricity | 53 (5.2%) | 139 (12.0%) |
| Fuel Oil or Kerosene | 328 (32.4%) | 274 (23.7%) |
| Coal or Coke | 1 (0.1%) | 0 (0.0%) |
| All other Fuels | 10 (1.0%) | 28 (2.4%) |
| No Fuel Used | 0 (0.0%) | 0 (0.0%) |
| Total | 1,012 (100.0%) | 1,156 (100.0%) |
Household Vehicle Usage in North Slope Borough
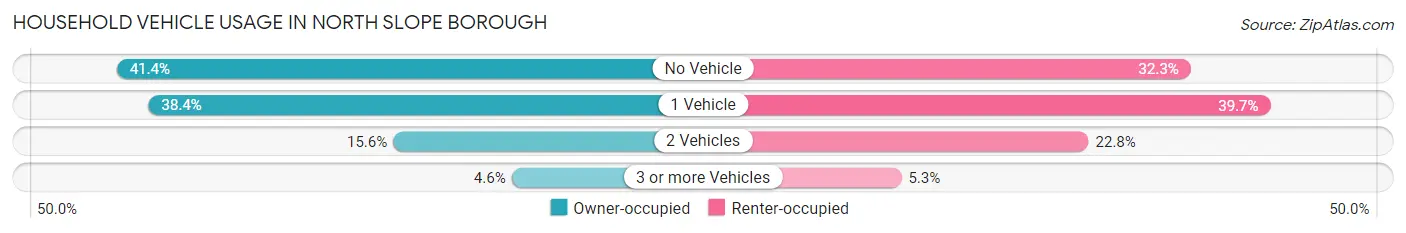
| Vehicles per Household | Owner-occupied | Renter-occupied |
| No Vehicle | 419 (41.4%) | 373 (32.3%) |
| 1 Vehicle | 389 (38.4%) | 459 (39.7%) |
| 2 Vehicles | 158 (15.6%) | 263 (22.8%) |
| 3 or more Vehicles | 46 (4.5%) | 61 (5.3%) |
| Total | 1,012 (100.0%) | 1,156 (100.0%) |
Real Estate & Mortgages in North Slope Borough
Real Estate and Mortgage Overview in North Slope Borough
| Characteristic | Without Mortgage | With Mortgage |
| Housing Units | 666 | 346 |
| Median Property Value | $137,200 | $288,100 |
| Median Household Income | $67,500 | $115 |
| Monthly Housing Costs | $410 | $0 |
| Real Estate Taxes | $2,108 | $221 |
Property Value by Mortgage Status in North Slope Borough
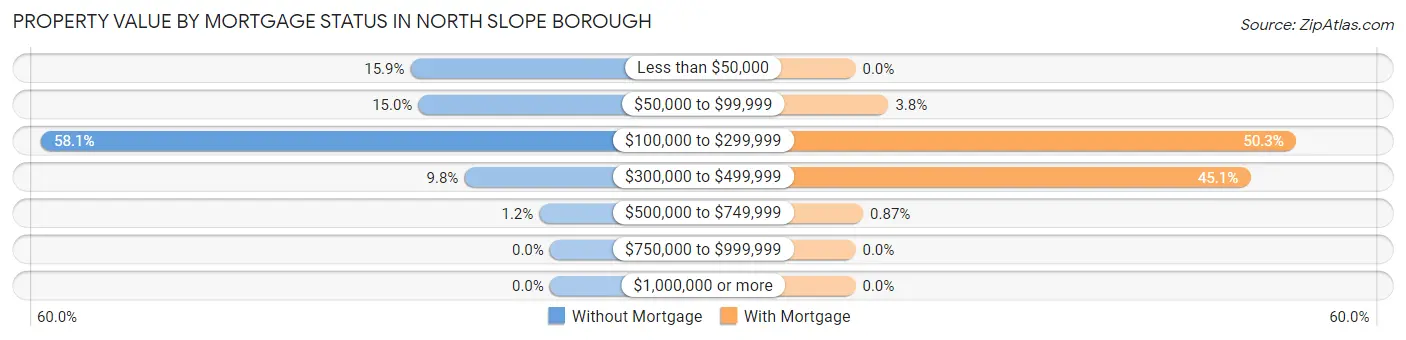
| Property Value | Without Mortgage | With Mortgage |
| Less than $50,000 | 106 (15.9%) | 0 (0.0%) |
| $50,000 to $99,999 | 100 (15.0%) | 13 (3.8%) |
| $100,000 to $299,999 | 387 (58.1%) | 174 (50.3%) |
| $300,000 to $499,999 | 65 (9.8%) | 156 (45.1%) |
| $500,000 to $749,999 | 8 (1.2%) | 3 (0.9%) |
| $750,000 to $999,999 | 0 (0.0%) | 0 (0.0%) |
| $1,000,000 or more | 0 (0.0%) | 0 (0.0%) |
| Total | 666 (100.0%) | 346 (100.0%) |
Household Income by Mortgage Status in North Slope Borough
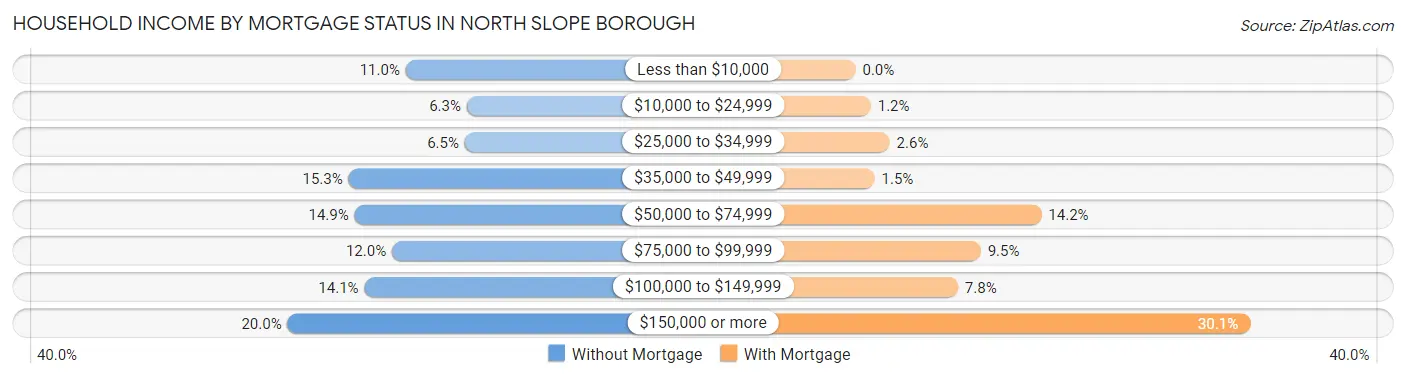
| Household Income | Without Mortgage | With Mortgage |
| Less than $10,000 | 73 (11.0%) | 0 (0.0%) |
| $10,000 to $24,999 | 42 (6.3%) | 4 (1.2%) |
| $25,000 to $34,999 | 43 (6.5%) | 9 (2.6%) |
| $35,000 to $49,999 | 102 (15.3%) | 5 (1.5%) |
| $50,000 to $74,999 | 99 (14.9%) | 49 (14.2%) |
| $75,000 to $99,999 | 80 (12.0%) | 33 (9.5%) |
| $100,000 to $149,999 | 94 (14.1%) | 27 (7.8%) |
| $150,000 or more | 133 (20.0%) | 104 (30.1%) |
| Total | 666 (100.0%) | 346 (100.0%) |
Property Value to Household Income Ratio in North Slope Borough
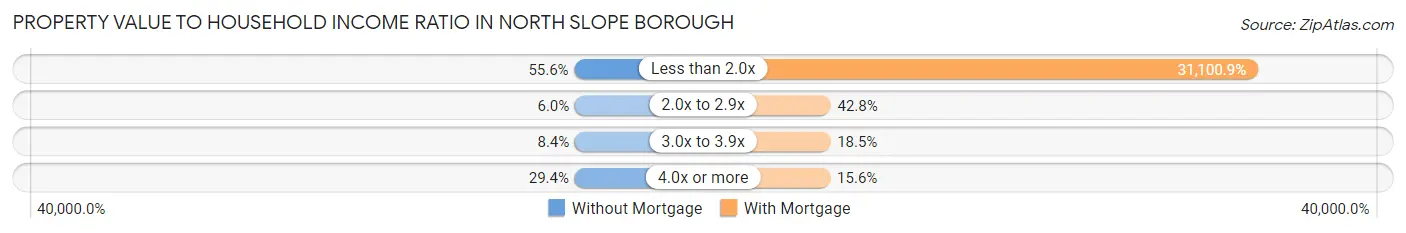
| Value-to-Income Ratio | Without Mortgage | With Mortgage |
| Less than 2.0x | 370 (55.6%) | 107,609 (31,100.9%) |
| 2.0x to 2.9x | 40 (6.0%) | 148 (42.8%) |
| 3.0x to 3.9x | 56 (8.4%) | 64 (18.5%) |
| 4.0x or more | 196 (29.4%) | 54 (15.6%) |
| Total | 666 (100.0%) | 346 (100.0%) |
Real Estate Taxes by Mortgage Status in North Slope Borough
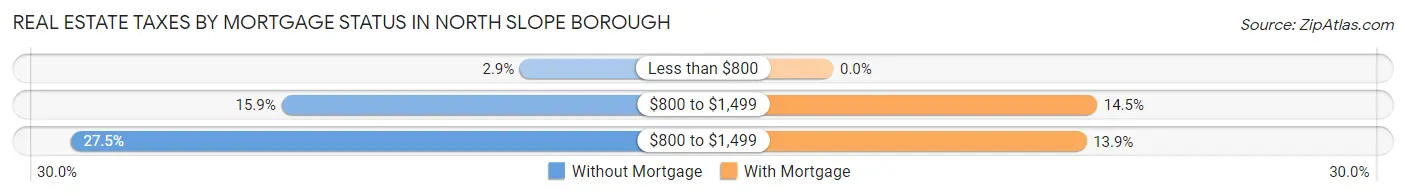
| Property Taxes | Without Mortgage | With Mortgage |
| Less than $800 | 19 (2.9%) | 0 (0.0%) |
| $800 to $1,499 | 106 (15.9%) | 50 (14.4%) |
| $800 to $1,499 | 183 (27.5%) | 48 (13.9%) |
| Total | 666 (100.0%) | 346 (100.0%) |
Health & Disability in North Slope Borough
Health Insurance Coverage by Age in North Slope Borough
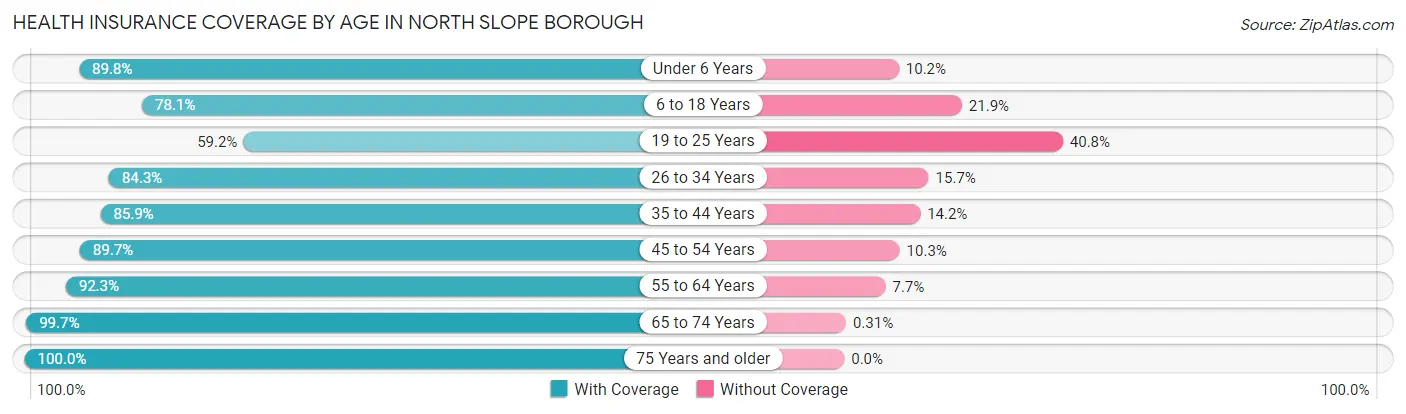
| Age Bracket | With Coverage | Without Coverage |
| Under 6 Years | 680 (89.8%) | 77 (10.2%) |
| 6 to 18 Years | 1,403 (78.1%) | 394 (21.9%) |
| 19 to 25 Years | 529 (59.2%) | 364 (40.8%) |
| 26 to 34 Years | 1,522 (84.3%) | 284 (15.7%) |
| 35 to 44 Years | 1,292 (85.9%) | 213 (14.1%) |
| 45 to 54 Years | 1,477 (89.7%) | 170 (10.3%) |
| 55 to 64 Years | 1,537 (92.3%) | 128 (7.7%) |
| 65 to 74 Years | 633 (99.7%) | 2 (0.3%) |
| 75 Years and older | 195 (100.0%) | 0 (0.0%) |
| Total | 9,268 (85.0%) | 1,632 (15.0%) |
Health Insurance Coverage by Citizenship Status in North Slope Borough
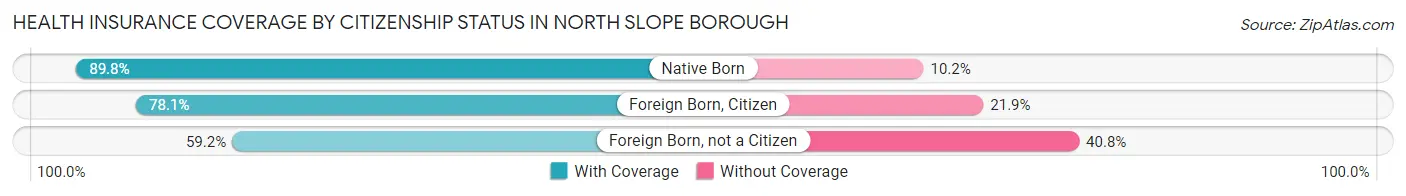
| Citizenship Status | With Coverage | Without Coverage |
| Native Born | 680 (89.8%) | 77 (10.2%) |
| Foreign Born, Citizen | 1,403 (78.1%) | 394 (21.9%) |
| Foreign Born, not a Citizen | 529 (59.2%) | 364 (40.8%) |
Health Insurance Coverage by Household Income in North Slope Borough
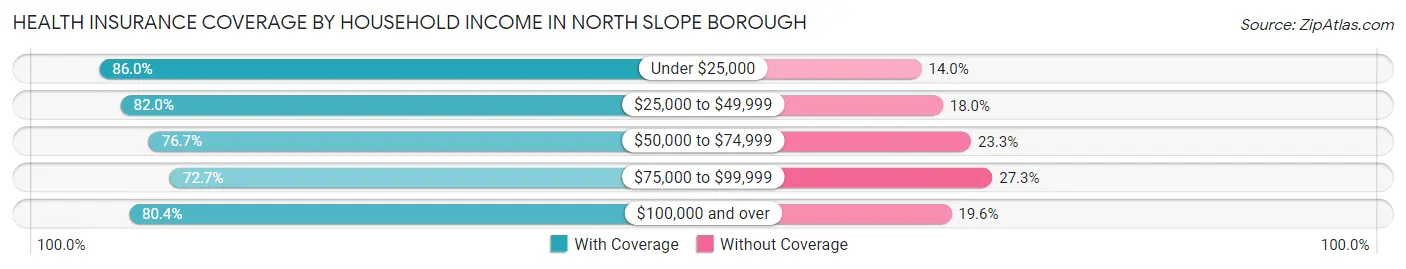
| Household Income | With Coverage | Without Coverage |
| Under $25,000 | 424 (86.0%) | 69 (14.0%) |
| $25,000 to $49,999 | 702 (82.0%) | 154 (18.0%) |
| $50,000 to $74,999 | 781 (76.7%) | 237 (23.3%) |
| $75,000 to $99,999 | 571 (72.7%) | 214 (27.3%) |
| $100,000 and over | 3,139 (80.4%) | 764 (19.6%) |
Public vs Private Health Insurance Coverage by Age in North Slope Borough
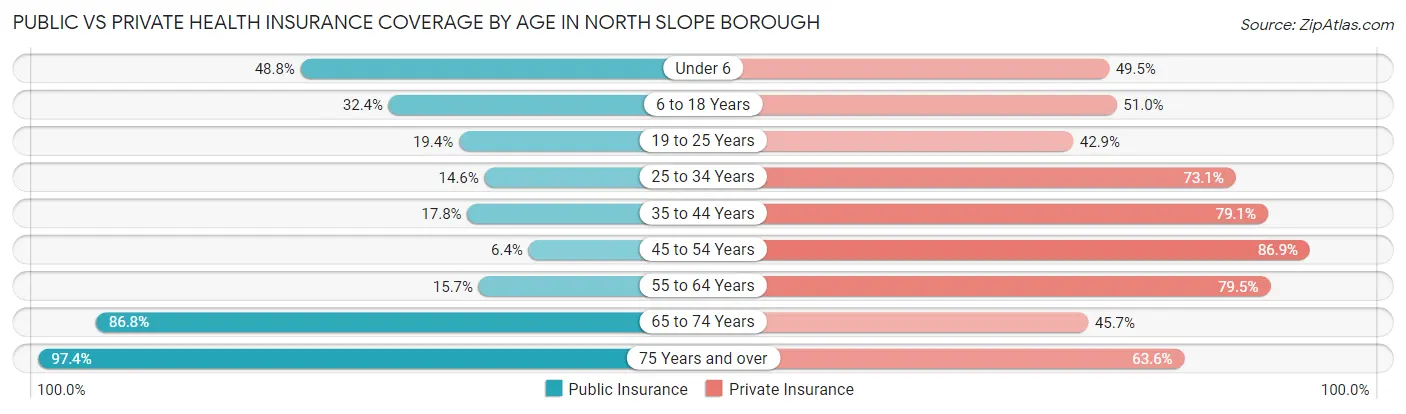
| Age Bracket | Public Insurance | Private Insurance |
| Under 6 | 369 (48.7%) | 375 (49.5%) |
| 6 to 18 Years | 582 (32.4%) | 916 (51.0%) |
| 19 to 25 Years | 173 (19.4%) | 383 (42.9%) |
| 25 to 34 Years | 264 (14.6%) | 1,320 (73.1%) |
| 35 to 44 Years | 268 (17.8%) | 1,190 (79.1%) |
| 45 to 54 Years | 106 (6.4%) | 1,431 (86.9%) |
| 55 to 64 Years | 261 (15.7%) | 1,324 (79.5%) |
| 65 to 74 Years | 551 (86.8%) | 290 (45.7%) |
| 75 Years and over | 190 (97.4%) | 124 (63.6%) |
| Total | 2,764 (25.4%) | 7,353 (67.5%) |
Disability Status by Sex by Age in North Slope Borough
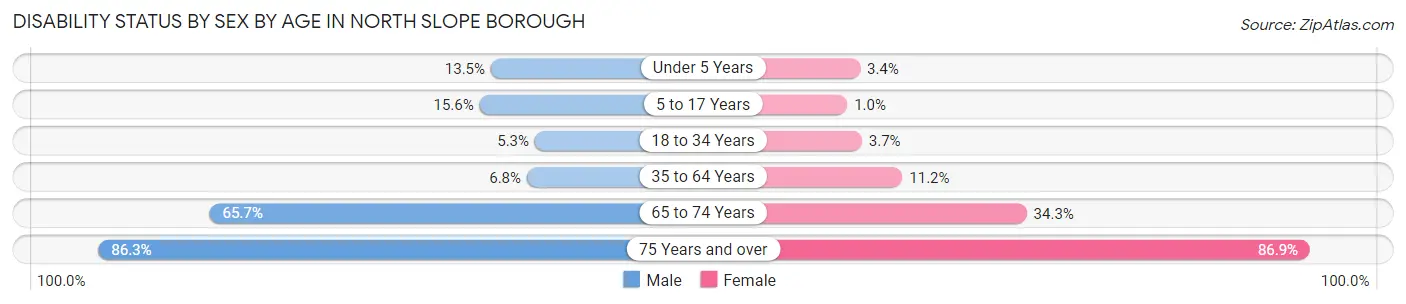
| Age Bracket | Male | Female |
| Under 5 Years | 42 (13.5%) | 10 (3.4%) |
| 5 to 17 Years | 139 (15.5%) | 10 (1.0%) |
| 18 to 34 Years | 95 (5.3%) | 36 (3.7%) |
| 35 to 64 Years | 222 (6.8%) | 173 (11.2%) |
| 65 to 74 Years | 260 (65.7%) | 82 (34.3%) |
| 75 Years and over | 63 (86.3%) | 106 (86.9%) |
Disability Class by Sex by Age in North Slope Borough
Disability Class: Hearing Difficulty
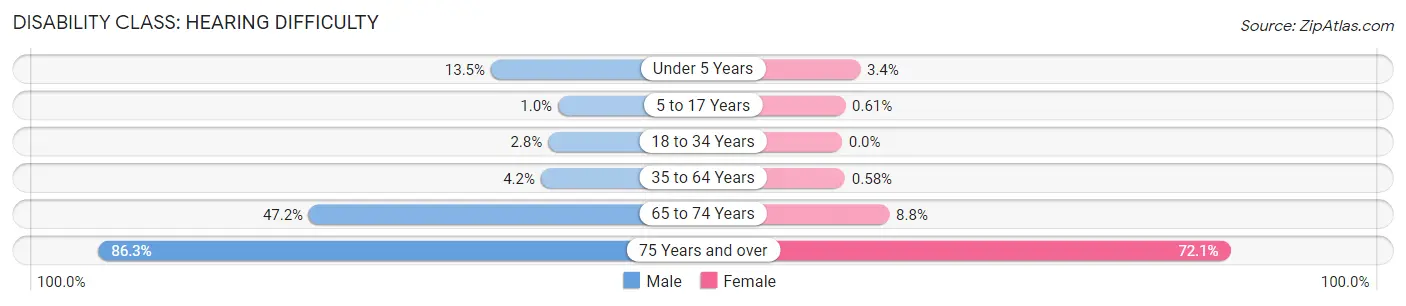
| Age Bracket | Male | Female |
| Under 5 Years | 42 (13.5%) | 10 (3.4%) |
| 5 to 17 Years | 9 (1.0%) | 6 (0.6%) |
| 18 to 34 Years | 51 (2.8%) | 0 (0.0%) |
| 35 to 64 Years | 137 (4.2%) | 9 (0.6%) |
| 65 to 74 Years | 187 (47.2%) | 21 (8.8%) |
| 75 Years and over | 63 (86.3%) | 88 (72.1%) |
Disability Class: Vision Difficulty
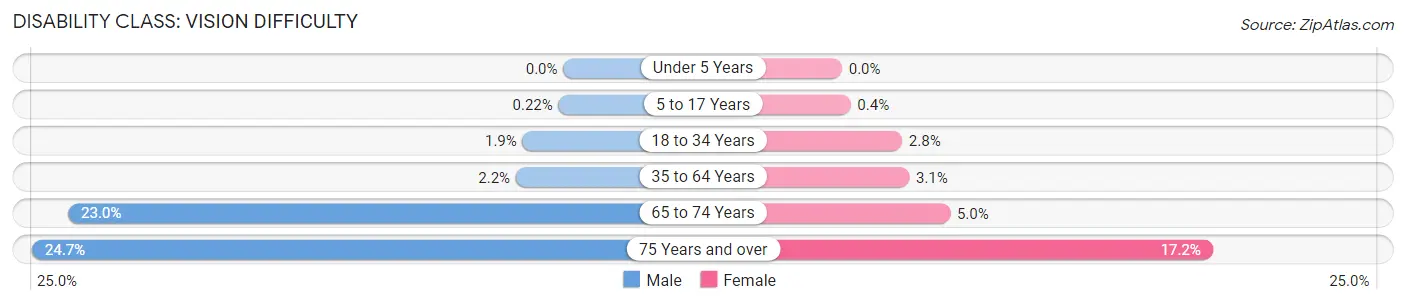
| Age Bracket | Male | Female |
| Under 5 Years | 0 (0.0%) | 0 (0.0%) |
| 5 to 17 Years | 2 (0.2%) | 4 (0.4%) |
| 18 to 34 Years | 34 (1.9%) | 27 (2.8%) |
| 35 to 64 Years | 72 (2.2%) | 48 (3.1%) |
| 65 to 74 Years | 91 (23.0%) | 12 (5.0%) |
| 75 Years and over | 18 (24.7%) | 21 (17.2%) |
Disability Class: Cognitive Difficulty
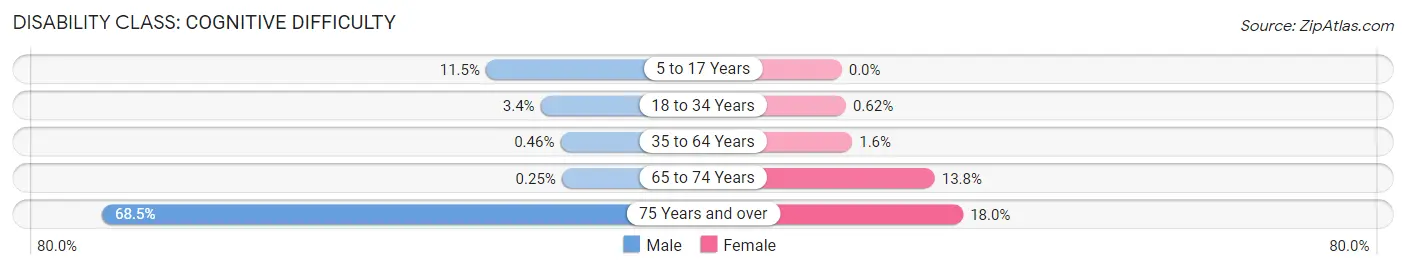
| Age Bracket | Male | Female |
| 5 to 17 Years | 103 (11.5%) | 0 (0.0%) |
| 18 to 34 Years | 61 (3.4%) | 6 (0.6%) |
| 35 to 64 Years | 15 (0.5%) | 24 (1.6%) |
| 65 to 74 Years | 1 (0.3%) | 33 (13.8%) |
| 75 Years and over | 50 (68.5%) | 22 (18.0%) |
Disability Class: Ambulatory Difficulty
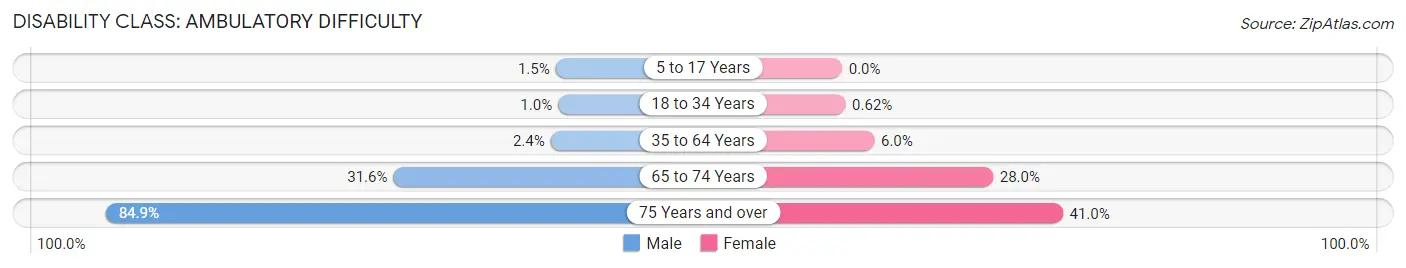
| Age Bracket | Male | Female |
| 5 to 17 Years | 13 (1.5%) | 0 (0.0%) |
| 18 to 34 Years | 18 (1.0%) | 6 (0.6%) |
| 35 to 64 Years | 78 (2.4%) | 92 (6.0%) |
| 65 to 74 Years | 125 (31.6%) | 67 (28.0%) |
| 75 Years and over | 62 (84.9%) | 50 (41.0%) |
Disability Class: Self-Care Difficulty
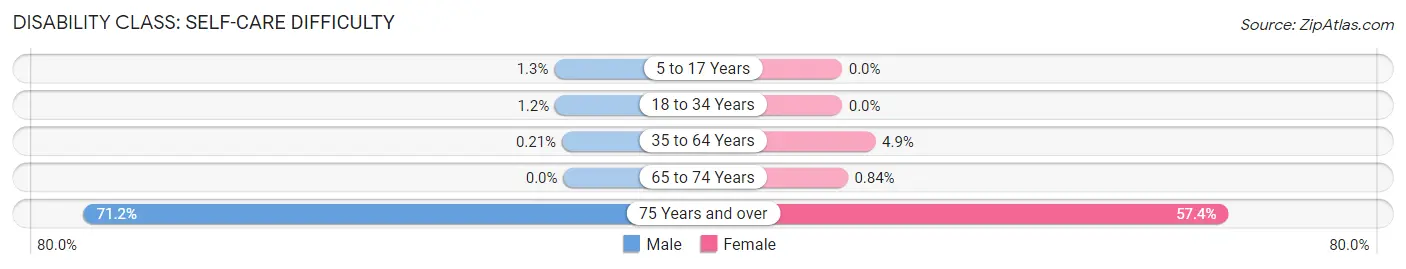
| Age Bracket | Male | Female |
| 5 to 17 Years | 12 (1.3%) | 0 (0.0%) |
| 18 to 34 Years | 22 (1.2%) | 0 (0.0%) |
| 35 to 64 Years | 7 (0.2%) | 76 (4.9%) |
| 65 to 74 Years | 0 (0.0%) | 2 (0.8%) |
| 75 Years and over | 52 (71.2%) | 70 (57.4%) |
Technology Access in North Slope Borough
Computing Device Access in North Slope Borough
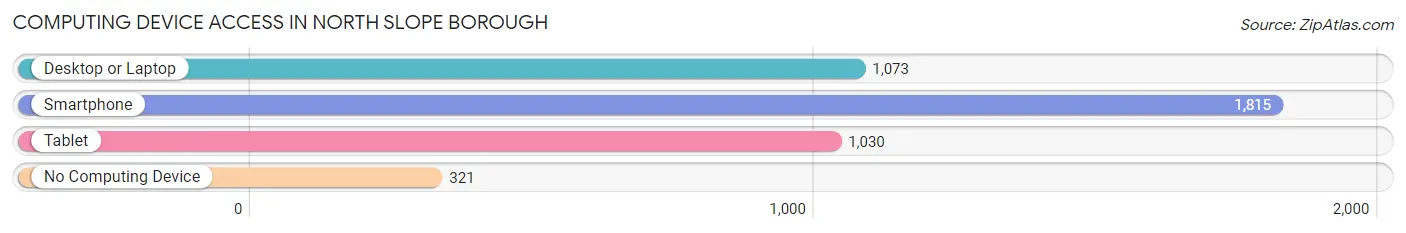
| Device Type | # Households | % Households |
| Desktop or Laptop | 1,073 | 49.5% |
| Smartphone | 1,815 | 83.7% |
| Tablet | 1,030 | 47.5% |
| No Computing Device | 321 | 14.8% |
| Total | 2,168 | 100.0% |
Internet Access in North Slope Borough
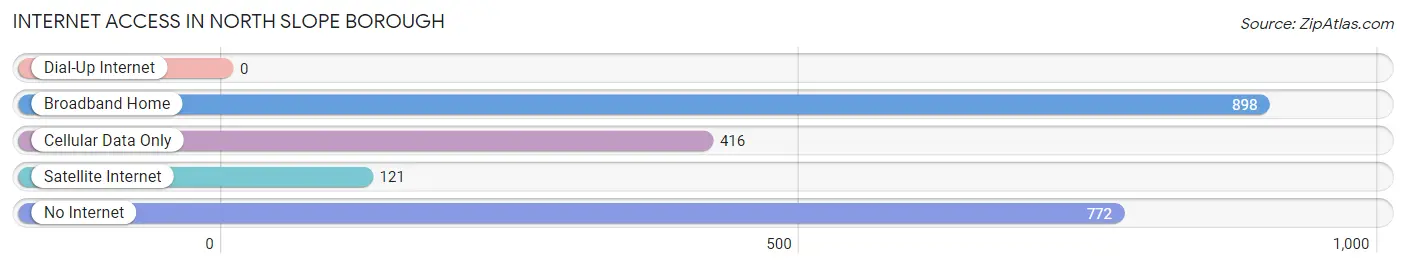
| Internet Type | # Households | % Households |
| Dial-Up Internet | 0 | 0.0% |
| Broadband Home | 898 | 41.4% |
| Cellular Data Only | 416 | 19.2% |
| Satellite Internet | 121 | 5.6% |
| No Internet | 772 | 35.6% |
| Total | 2,168 | 100.0% |
North Slope Borough Summary
The North Slope Borough is a borough located in the northernmost part of the U.S. state of Alaska. It is the largest and northernmost borough in the state, and is the most remote and least populated of all the boroughs. The borough covers an area of 94,796 square miles (245,890 km2), making it larger than the state of New York. It is bordered by the Arctic Ocean to the north, the Chukchi Sea to the west, the Beaufort Sea to the east, and the Yukon-Koyukuk Census Area to the south.
History
The North Slope Borough was established in 1972, when the Alaska State Legislature passed the North Slope Borough Act. The act created the borough from the northernmost part of the Alaska Territory, which had been established in 1912. The borough was created to provide local government services to the residents of the North Slope, which had previously been served by the state government.
The borough was initially governed by a three-member board of supervisors, which was later expanded to five members. The first board of supervisors was elected in 1974, and the first borough mayor was elected in 1976.
Geography
The North Slope Borough is located in the northernmost part of Alaska, and is bordered by the Arctic Ocean to the north, the Chukchi Sea to the west, the Beaufort Sea to the east, and the Yukon-Koyukuk Census Area to the south. The borough covers an area of 94,796 square miles (245,890 km2), making it larger than the state of New York.
The borough is divided into two regions: the North Slope and the Arctic Slope. The North Slope is located in the northern part of the borough and is characterized by tundra and permafrost. The Arctic Slope is located in the southern part of the borough and is characterized by mountains, glaciers, and ice fields.
The North Slope Borough is home to the Arctic National Wildlife Refuge, which is the largest protected wilderness area in the United States. The refuge covers an area of 19,286,722 acres (7,811,945 ha) and is home to a variety of wildlife, including polar bears, caribou, muskoxen, and wolves.
Economy
The economy of the North Slope Borough is largely based on oil and gas production. The borough is home to the Prudhoe Bay Oil Field, which is the largest oil field in North America. The oil field is operated by the Alaska Oil and Gas Conservation Commission, and is estimated to contain up to 25 billion barrels of oil.
In addition to oil and gas production, the North Slope Borough is also home to a variety of other industries, including fishing, hunting, and tourism. The borough is also home to a number of Native American tribes, including the Inupiat, Gwich’in, and Yup’ik.
Demographics
As of the 2010 census, the North Slope Borough had a population of 9,430. The population is largely composed of Native Americans, with the largest ethnic group being the Inupiat, who make up approximately 75% of the population. The other major ethnic groups in the borough are the Gwich’in (10%), Yup’ik (7%), and Alaska Native (5%).
The median household income in the North Slope Borough is $68,813, and the median family income is $77,917. The per capita income is $30,945. The unemployment rate in the borough is 8.2%.
Conclusion
The North Slope Borough is a remote and sparsely populated borough located in the northernmost part of Alaska. It is the largest and northernmost borough in the state, and is bordered by the Arctic Ocean to the north, the Chukchi Sea to the west, the Beaufort Sea to the east, and the Yukon-Koyukuk Census Area to the south. The borough was established in 1972, and is home to a variety of industries, including oil and gas production, fishing, hunting, and tourism. The population of the borough is largely composed of Native Americans, with the largest ethnic group being the Inupiat. The median household income in the borough is $68,813, and the unemployment rate is 8.2%.
Common Questions
What is the Total Population of North Slope Borough?
Total Population of North Slope Borough is 10,924.
What is the Total Male Population of North Slope Borough?
Total Male Population of North Slope Borough is 6,766.
What is the Total Female Population of North Slope Borough?
Total Female Population of North Slope Borough is 4,158.
What is the Ratio of Males per 100 Females in North Slope Borough?
There are 162.72 Males per 100 Females in North Slope Borough.
What is the Ratio of Females per 100 Males in North Slope Borough?
There are 61.45 Females per 100 Males in North Slope Borough.
What is the Median Population Age in North Slope Borough?
Median Population Age in North Slope Borough is 36.3 Years.
What is the Average Family Size in North Slope Borough
Average Family Size in North Slope Borough is 3.8 People.
What is the Average Household Size in North Slope Borough
Average Household Size in North Slope Borough is 3.3 People.
What is Per Capita Income in North Slope Borough?
Per Capita income in North Slope Borough is $61,841.
What is the Median Family Income in North Slope Borough?
Median Family Income in North Slope Borough is $92,656.
What is the Median Household income in North Slope Borough?
Median Household Income in North Slope Borough is $83,472.
What is Income or Wage Gap in North Slope Borough?
Income or Wage Gap in North Slope Borough is 24.7%.
Women in North Slope Borough earn 75.3 cents for every dollar earned by a man.
What is Family Income Deficit in North Slope Borough?
Family Income Deficit in North Slope Borough is $13,720.
Families that are below poverty line in North Slope Borough earn $13,720 less on average than the poverty threshold level.
What is Inequality or Gini Index in North Slope Borough?
Inequality or Gini Index in North Slope Borough is 0.44.
How Large is the Labor Force in North Slope Borough?
There are 6,915 People in the Labor Forcein in North Slope Borough.
What is the Percentage of People in the Labor Force in North Slope Borough?
78.9% of People are in the Labor Force in North Slope Borough.
What is the Unemployment Rate in North Slope Borough?
Unemployment Rate in North Slope Borough is 6.8%.