Nome Census Area, AK
Nome Census Area Map
Nome Census Area Overview
10,018
TOTAL POPULATION
5,237
MALE POPULATION
4,781
FEMALE POPULATION
109.54
MALES / 100 FEMALES
91.29
FEMALES / 100 MALES
29.1
MEDIAN AGE
3.8
AVG FAMILY SIZE
3.4
AVG HOUSEHOLD SIZE
$28,678
PER CAPITA INCOME
$70,588
AVG FAMILY INCOME
$70,121
AVG HOUSEHOLD INCOME
14.4%
WAGE / INCOME GAP [ % ]
85.6¢/ $1
WAGE / INCOME GAP [ $ ]
$11,568
FAMILY INCOME DEFICIT
0.44
INEQUALITY / GINI INDEX
4,560
LABOR FORCE [ PEOPLE ]
65.6%
PERCENT IN LABOR FORCE
16.5%
UNEMPLOYMENT RATE
Nome Census Area Area Codes
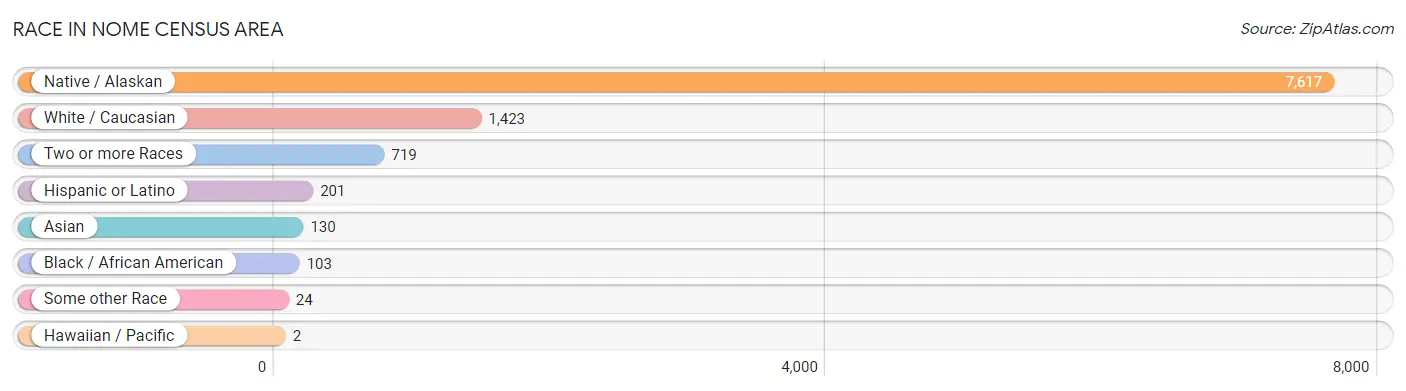
Race in Nome Census Area
The most populous races in Nome Census Area are Native / Alaskan (7,617 | 76.0%), White / Caucasian (1,423 | 14.2%), and Two or more Races (719 | 7.2%).
| Race | # Population | % Population |
| Asian | 130 | 1.3% |
| Black / African American | 103 | 1.0% |
| Hawaiian / Pacific | 2 | 0.0% |
| Hispanic or Latino | 201 | 2.0% |
| Native / Alaskan | 7,617 | 76.0% |
| White / Caucasian | 1,423 | 14.2% |
| Two or more Races | 719 | 7.2% |
| Some other Race | 24 | 0.2% |
| Total | 10,018 | 100.0% |
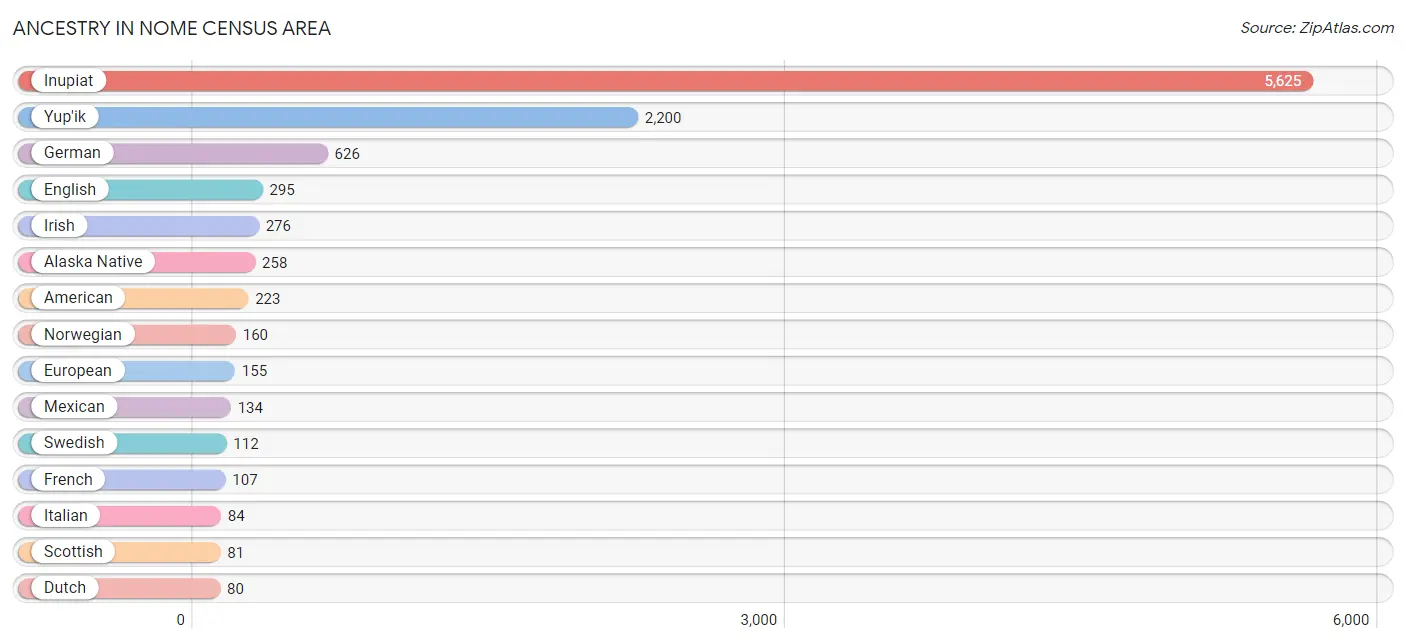
Ancestry in Nome Census Area
The most populous ancestries reported in Nome Census Area are Inupiat (5,625 | 56.1%), Yup'ik (2,200 | 22.0%), German (626 | 6.2%), English (295 | 2.9%), and Irish (276 | 2.8%), together accounting for 90.1% of all Nome Census Area residents.
| Ancestry | # Population | % Population |
| African | 44 | 0.4% |
| Alaska Native | 258 | 2.6% |
| Alaskan Athabascan | 26 | 0.3% |
| Aleut | 26 | 0.3% |
| American | 223 | 2.2% |
| Apache | 10 | 0.1% |
| Arab | 3 | 0.0% |
| Austrian | 6 | 0.1% |
| Belgian | 1 | 0.0% |
| Bhutanese | 32 | 0.3% |
| British | 42 | 0.4% |
| Burmese | 61 | 0.6% |
| Central American | 33 | 0.3% |
| Cherokee | 73 | 0.7% |
| Choctaw | 5 | 0.1% |
| Czech | 8 | 0.1% |
| Danish | 44 | 0.4% |
| Dutch | 80 | 0.8% |
| Eastern European | 9 | 0.1% |
| Egyptian | 3 | 0.0% |
| English | 295 | 2.9% |
| Estonian | 4 | 0.0% |
| European | 155 | 1.5% |
| Finnish | 25 | 0.3% |
| French | 107 | 1.1% |
| French Canadian | 13 | 0.1% |
| German | 626 | 6.2% |
| Greek | 5 | 0.1% |
| Haitian | 22 | 0.2% |
| Hungarian | 4 | 0.0% |
| Indian (Asian) | 14 | 0.1% |
| Inupiat | 5,625 | 56.1% |
| Irish | 276 | 2.8% |
| Israeli | 1 | 0.0% |
| Italian | 84 | 0.8% |
| Jamaican | 21 | 0.2% |
| Japanese | 33 | 0.3% |
| Korean | 38 | 0.4% |
| Latvian | 4 | 0.0% |
| Lithuanian | 6 | 0.1% |
| Mexican | 134 | 1.3% |
| Native Hawaiian | 5 | 0.1% |
| Navajo | 2 | 0.0% |
| Norwegian | 160 | 1.6% |
| Pakistani | 6 | 0.1% |
| Polish | 29 | 0.3% |
| Portuguese | 26 | 0.3% |
| Puerto Rican | 20 | 0.2% |
| Russian | 79 | 0.8% |
| Salvadoran | 33 | 0.3% |
| Samoan | 3 | 0.0% |
| Scandinavian | 37 | 0.4% |
| Scotch-Irish | 27 | 0.3% |
| Scottish | 81 | 0.8% |
| Slovak | 1 | 0.0% |
| South American | 4 | 0.0% |
| Spaniard | 3 | 0.0% |
| Sri Lankan | 67 | 0.7% |
| Subsaharan African | 54 | 0.5% |
| Swedish | 112 | 1.1% |
| Thai | 9 | 0.1% |
| Tlingit-Haida | 6 | 0.1% |
| Ukrainian | 1 | 0.0% |
| Venezuelan | 4 | 0.0% |
| Welsh | 4 | 0.0% |
| Yup'ik | 2,200 | 22.0% | View All 66 Rows |
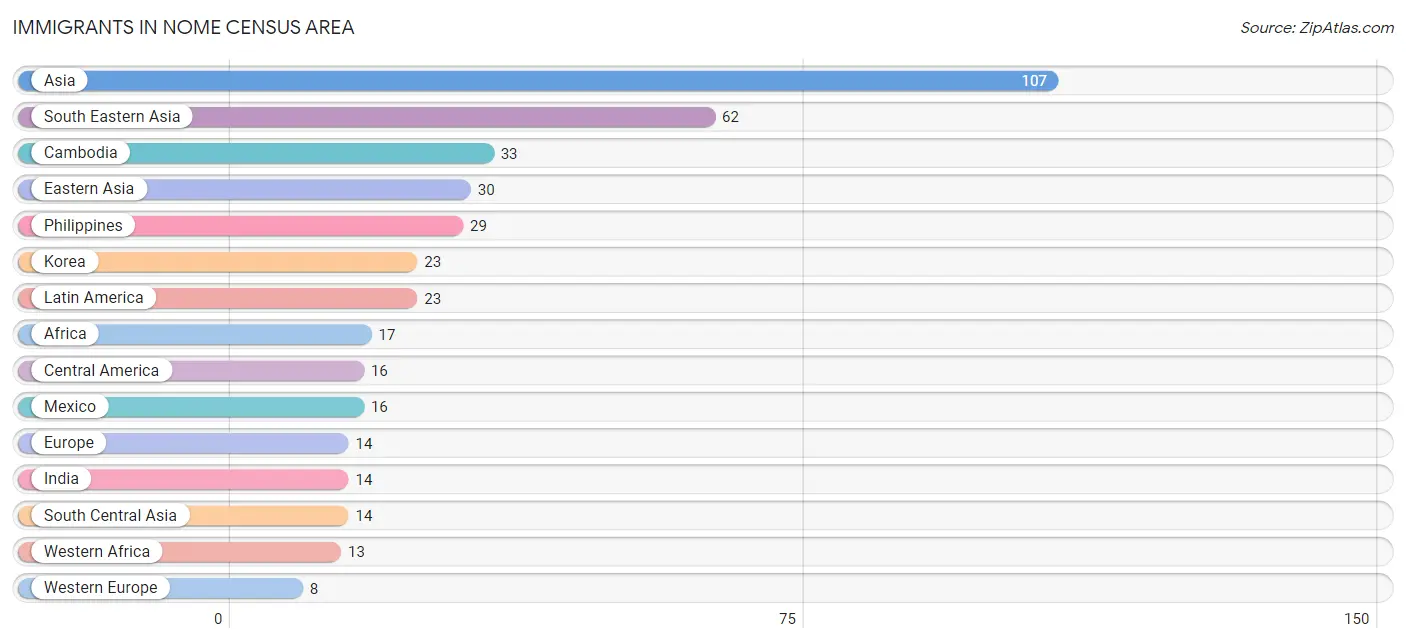
Immigrants in Nome Census Area
The most numerous immigrant groups reported in Nome Census Area came from Asia (107 | 1.1%), South Eastern Asia (62 | 0.6%), Cambodia (33 | 0.3%), Eastern Asia (30 | 0.3%), and Philippines (29 | 0.3%), together accounting for 2.6% of all Nome Census Area residents.
| Immigration Origin | # Population | % Population |
| Africa | 17 | 0.2% |
| Asia | 107 | 1.1% |
| Austria | 2 | 0.0% |
| Brazil | 2 | 0.0% |
| Cambodia | 33 | 0.3% |
| Caribbean | 5 | 0.1% |
| Central America | 16 | 0.2% |
| China | 7 | 0.1% |
| Eastern Asia | 30 | 0.3% |
| Eastern Europe | 6 | 0.1% |
| Egypt | 3 | 0.0% |
| Europe | 14 | 0.1% |
| Germany | 6 | 0.1% |
| Ghana | 6 | 0.1% |
| India | 14 | 0.1% |
| Israel | 1 | 0.0% |
| Jamaica | 5 | 0.1% |
| Korea | 23 | 0.2% |
| Latin America | 23 | 0.2% |
| Lithuania | 3 | 0.0% |
| Mexico | 16 | 0.2% |
| Morocco | 1 | 0.0% |
| Northern Africa | 4 | 0.0% |
| Oceania | 2 | 0.0% |
| Philippines | 29 | 0.3% |
| Russia | 2 | 0.0% |
| South America | 2 | 0.0% |
| South Central Asia | 14 | 0.1% |
| South Eastern Asia | 62 | 0.6% |
| Western Africa | 13 | 0.1% |
| Western Asia | 1 | 0.0% |
| Western Europe | 8 | 0.1% | View All 32 Rows |
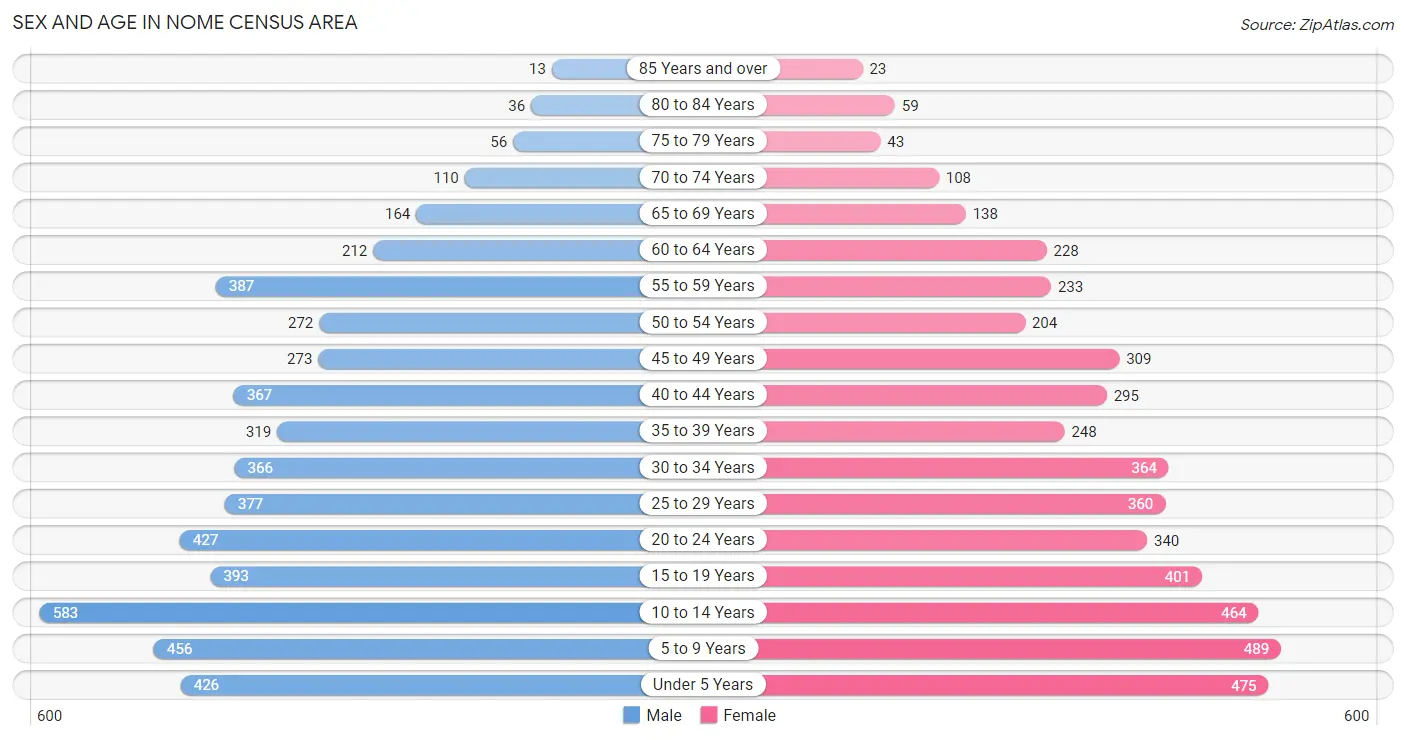
Sex and Age in Nome Census Area
Sex and Age in Nome Census Area
The most populous age groups in Nome Census Area are 10 to 14 Years (583 | 11.1%) for men and 5 to 9 Years (489 | 10.2%) for women.
| Age Bracket | Male | Female |
| Under 5 Years | 426 (8.1%) | 475 (9.9%) |
| 5 to 9 Years | 456 (8.7%) | 489 (10.2%) |
| 10 to 14 Years | 583 (11.1%) | 464 (9.7%) |
| 15 to 19 Years | 393 (7.5%) | 401 (8.4%) |
| 20 to 24 Years | 427 (8.2%) | 340 (7.1%) |
| 25 to 29 Years | 377 (7.2%) | 360 (7.5%) |
| 30 to 34 Years | 366 (7.0%) | 364 (7.6%) |
| 35 to 39 Years | 319 (6.1%) | 248 (5.2%) |
| 40 to 44 Years | 367 (7.0%) | 295 (6.2%) |
| 45 to 49 Years | 273 (5.2%) | 309 (6.5%) |
| 50 to 54 Years | 272 (5.2%) | 204 (4.3%) |
| 55 to 59 Years | 387 (7.4%) | 233 (4.9%) |
| 60 to 64 Years | 212 (4.1%) | 228 (4.8%) |
| 65 to 69 Years | 164 (3.1%) | 138 (2.9%) |
| 70 to 74 Years | 110 (2.1%) | 108 (2.3%) |
| 75 to 79 Years | 56 (1.1%) | 43 (0.9%) |
| 80 to 84 Years | 36 (0.7%) | 59 (1.2%) |
| 85 Years and over | 13 (0.3%) | 23 (0.5%) |
| Total | 5,237 (100.0%) | 4,781 (100.0%) |
Families and Households in Nome Census Area
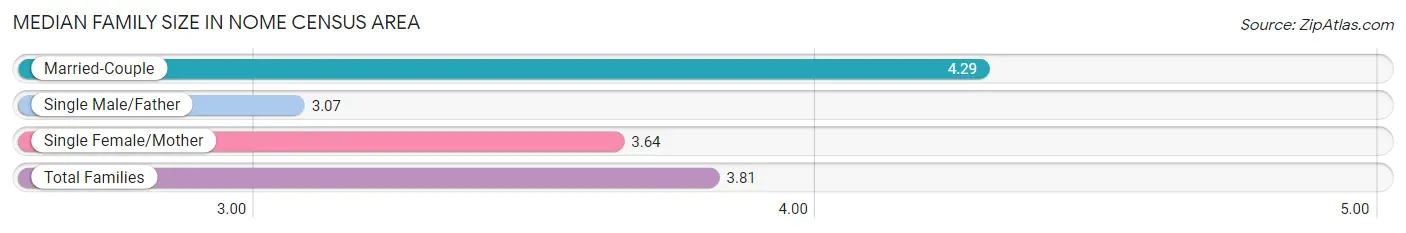
Median Family Size in Nome Census Area
The median family size in Nome Census Area is 3.81 persons per family, with married-couple families (965 | 47.1%) accounting for the largest median family size of 4.29 persons per family. On the other hand, single male/father families (472 | 23.1%) represent the smallest median family size with 3.07 persons per family.
| Family Type | # Families | Family Size |
| Married-Couple | 965 (47.1%) | 4.29 |
| Single Male/Father | 472 (23.1%) | 3.07 |
| Single Female/Mother | 611 (29.8%) | 3.64 |
| Total Families | 2,048 (100.0%) | 3.81 |
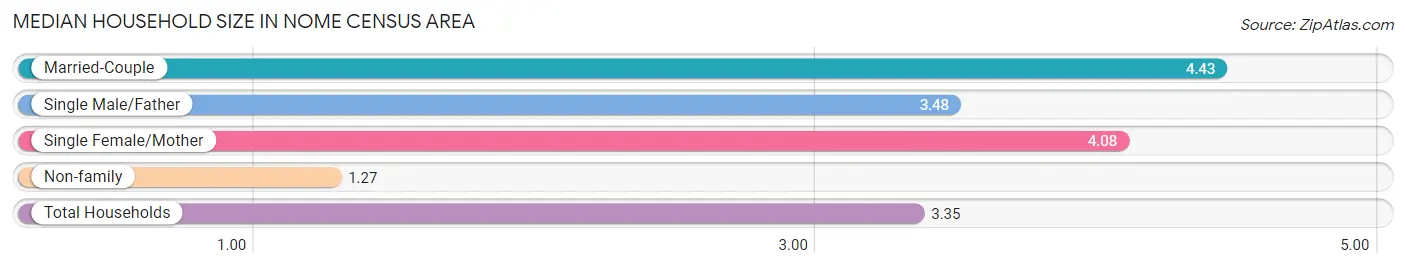
Median Household Size in Nome Census Area
The median household size in Nome Census Area is 3.35 persons per household, with married-couple households (965 | 34.6%) accounting for the largest median household size of 4.43 persons per household. non-family households (738 | 26.5%) represent the smallest median household size with 1.27 persons per household.
| Household Type | # Households | Household Size |
| Married-Couple | 965 (34.6%) | 4.43 |
| Single Male/Father | 472 (16.9%) | 3.48 |
| Single Female/Mother | 611 (21.9%) | 4.08 |
| Non-family | 738 (26.5%) | 1.27 |
| Total Households | 2,786 (100.0%) | 3.35 |
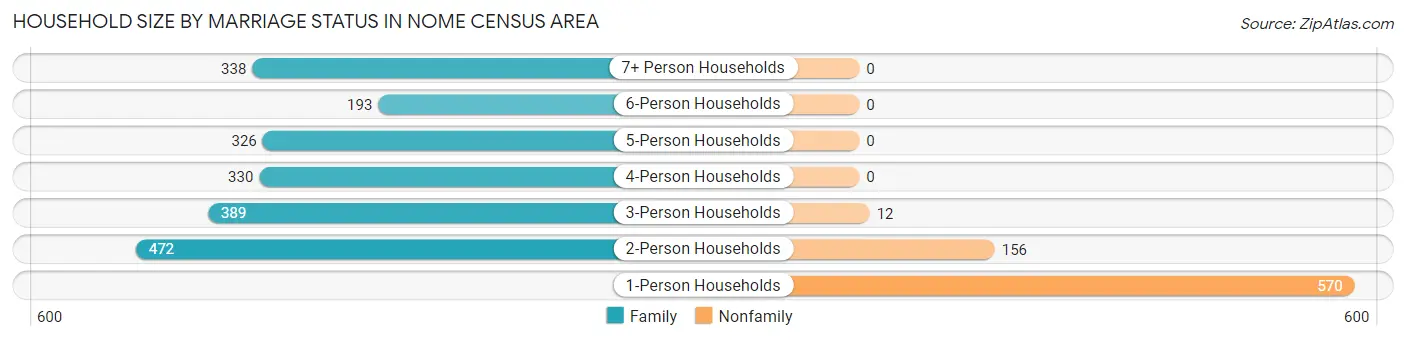
Household Size by Marriage Status in Nome Census Area
Out of a total of 2,786 households in Nome Census Area, 2,048 (73.5%) are family households, while 738 (26.5%) are nonfamily households. The most numerous type of family households are 2-person households, comprising 472, and the most common type of nonfamily households are 1-person households, comprising 570.
| Household Size | Family Households | Nonfamily Households |
| 1-Person Households | - | 570 (20.5%) |
| 2-Person Households | 472 (16.9%) | 156 (5.6%) |
| 3-Person Households | 389 (14.0%) | 12 (0.4%) |
| 4-Person Households | 330 (11.8%) | 0 (0.0%) |
| 5-Person Households | 326 (11.7%) | 0 (0.0%) |
| 6-Person Households | 193 (6.9%) | 0 (0.0%) |
| 7+ Person Households | 338 (12.1%) | 0 (0.0%) |
| Total | 2,048 (73.5%) | 738 (26.5%) |
Female Fertility in Nome Census Area
Fertility by Age in Nome Census Area
Average fertility rate in Nome Census Area is 81.0 births per 1,000 women. Women in the age bracket of 20 to 34 years have the highest fertility rate with 136.0 births per 1,000 women. Women in the age bracket of 20 to 34 years acount for 75.9% of all women with births.
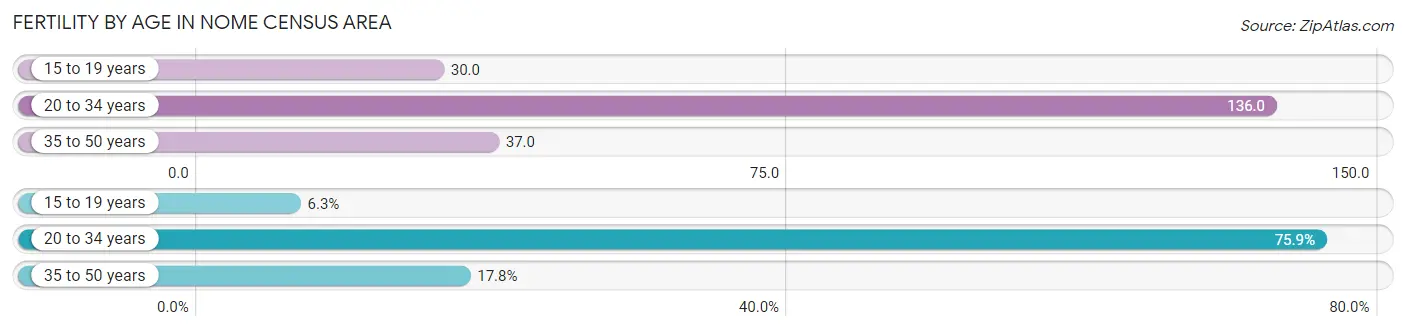
| Age Bracket | Women with Births | Births / 1,000 Women |
| 15 to 19 years | 12 (6.3%) | 30.0 |
| 20 to 34 years | 145 (75.9%) | 136.0 |
| 35 to 50 years | 34 (17.8%) | 37.0 |
| Total | 191 (100.0%) | 81.0 |
Fertility by Age by Marriage Status in Nome Census Area
27.2% of women with births (191) in Nome Census Area are married. The highest percentage of unmarried women with births falls into 15 to 19 years age bracket with 100.0% of them unmarried at the time of birth, while the lowest percentage of unmarried women with births belong to 35 to 50 years age bracket with 35.3% of them unmarried.
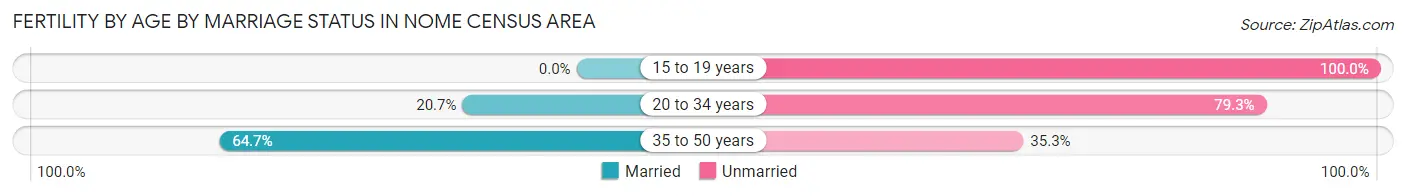
| Age Bracket | Married | Unmarried |
| 15 to 19 years | 0 (0.0%) | 12 (100.0%) |
| 20 to 34 years | 30 (20.7%) | 115 (79.3%) |
| 35 to 50 years | 22 (64.7%) | 12 (35.3%) |
| Total | 52 (27.2%) | 139 (72.8%) |
Fertility by Education in Nome Census Area
Average fertility rate in Nome Census Area is 81.0 births per 1,000 women. Women with the education attainment of graduate degree have the highest fertility rate of 117.0 births per 1,000 women, while women with the education attainment of less than high school have the lowest fertility at 43.0 births per 1,000 women. Women with the education attainment of high school diploma represent 45.0% of all women with births.
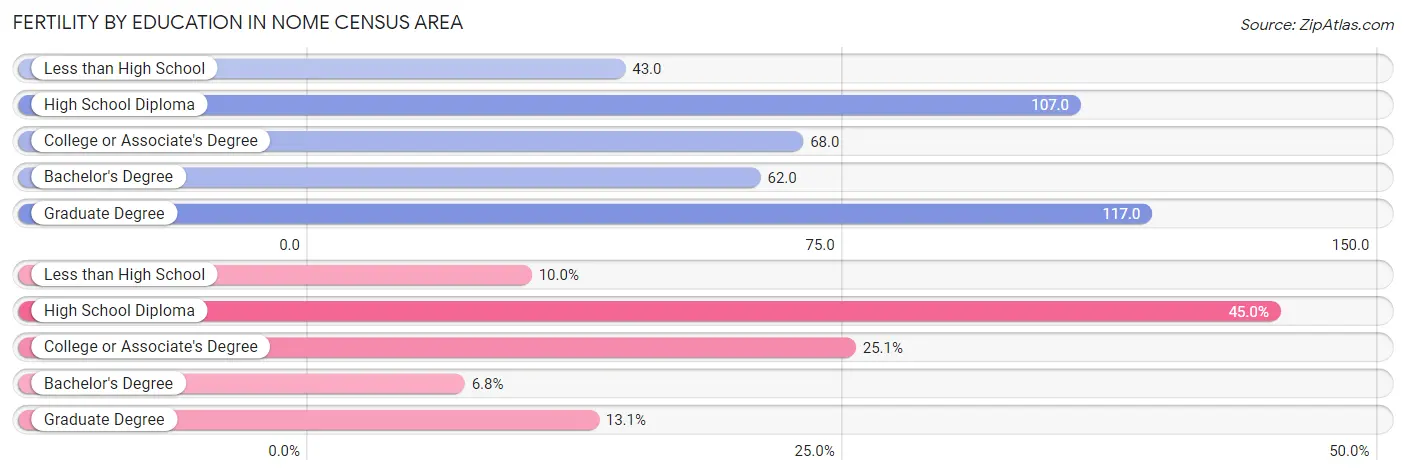
| Educational Attainment | Women with Births | Births / 1,000 Women |
| Less than High School | 19 (10.0%) | 43.0 |
| High School Diploma | 86 (45.0%) | 107.0 |
| College or Associate's Degree | 48 (25.1%) | 68.0 |
| Bachelor's Degree | 13 (6.8%) | 62.0 |
| Graduate Degree | 25 (13.1%) | 117.0 |
| Total | 191 (100.0%) | 81.0 |
Fertility by Education by Marriage Status in Nome Census Area
72.8% of women with births in Nome Census Area are unmarried. Women with the educational attainment of college or associate's degree are most likely to be married with 62.5% of them married at childbirth, while women with the educational attainment of graduate degree are least likely to be married with 100.0% of them unmarried at childbirth.
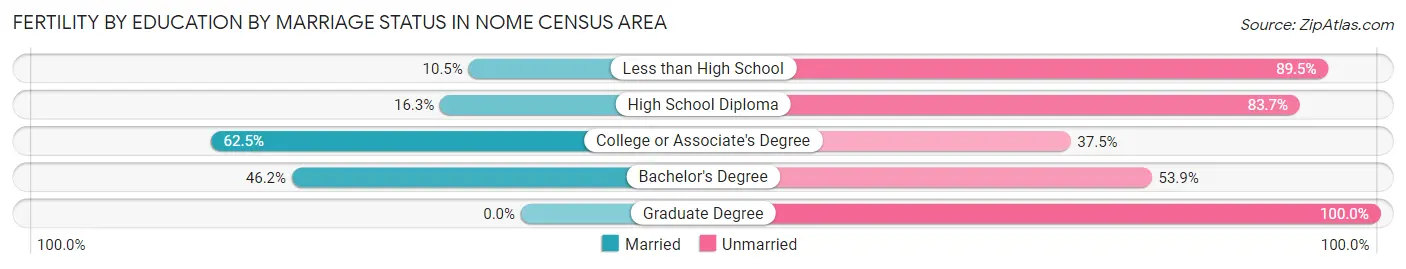
| Educational Attainment | Married | Unmarried |
| Less than High School | 2 (10.5%) | 17 (89.5%) |
| High School Diploma | 14 (16.3%) | 72 (83.7%) |
| College or Associate's Degree | 30 (62.5%) | 18 (37.5%) |
| Bachelor's Degree | 6 (46.2%) | 7 (53.8%) |
| Graduate Degree | 0 (0.0%) | 25 (100.0%) |
| Total | 52 (27.2%) | 139 (72.8%) |
Income in Nome Census Area
Income Overview in Nome Census Area
Per Capita Income in Nome Census Area is $28,678, while median incomes of families and households are $70,588 and $70,121 respectively.
| Characteristic | Number | Measure |
| Per Capita Income | 10,018 | $28,678 |
| Median Family Income | 2,048 | $70,588 |
| Mean Family Income | 2,048 | $93,607 |
| Median Household Income | 2,786 | $70,121 |
| Mean Household Income | 2,786 | $89,721 |
| Income Deficit | 2,048 | $11,568 |
| Wage / Income Gap (%) | 10,018 | 14.40% |
| Wage / Income Gap ($) | 10,018 | 85.60¢ per $1 |
| Gini / Inequality Index | 10,018 | 0.44 |
Earnings by Sex in Nome Census Area
Average Earnings in Nome Census Area are $37,964, $34,762 for men and $40,611 for women, a difference of 14.4%.
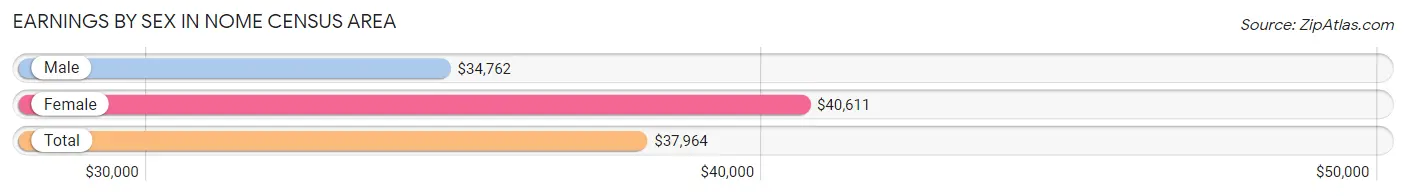
| Sex | Number | Average Earnings |
| Male | 2,598 (53.6%) | $34,762 |
| Female | 2,253 (46.4%) | $40,611 |
| Total | 4,851 (100.0%) | $37,964 |
Earnings by Sex by Income Bracket in Nome Census Area
The most common earnings brackets in Nome Census Area are $100,000+ for men (449 | 17.3%) and $75,000 to $99,999 for women (273 | 12.1%).
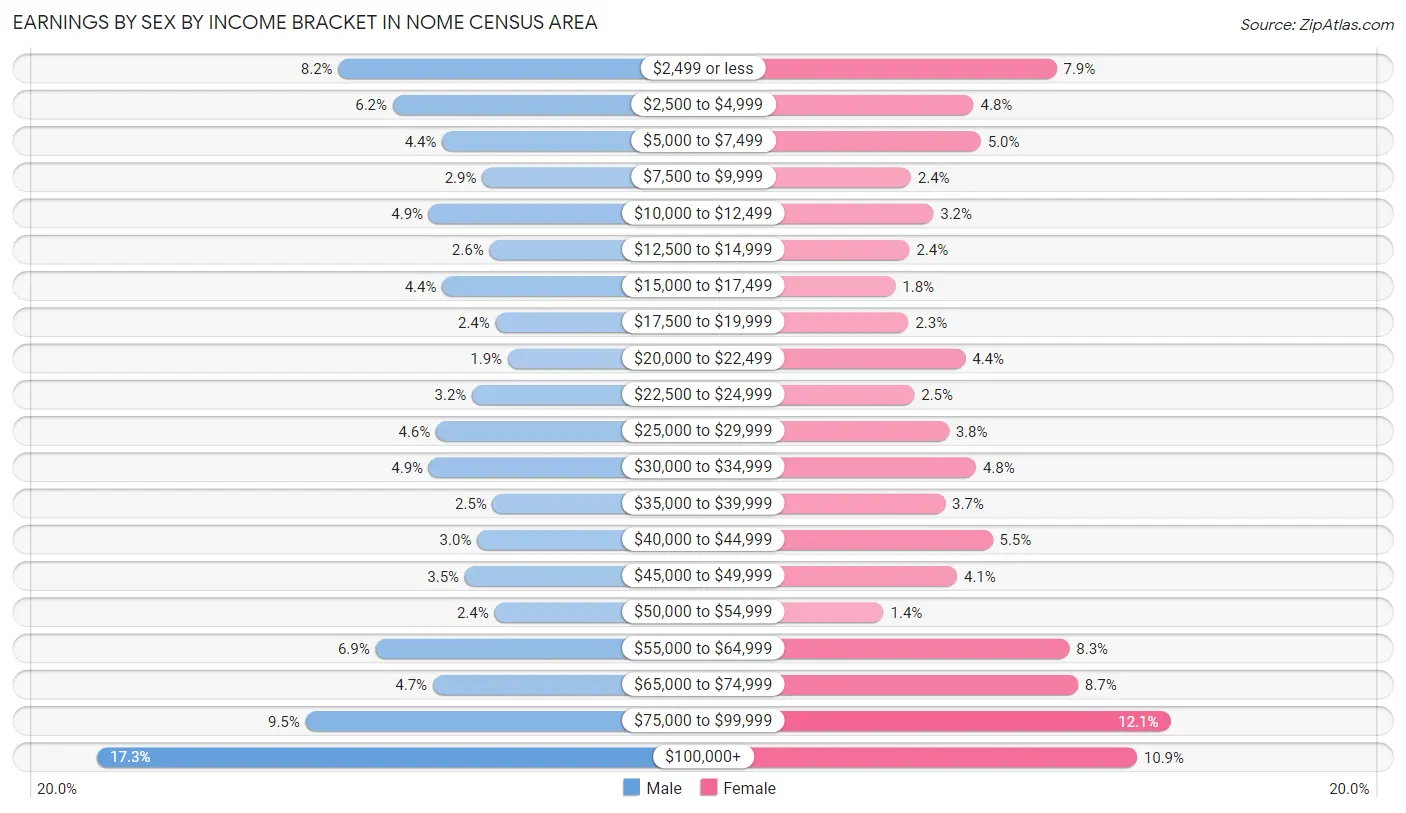
| Income | Male | Female |
| $2,499 or less | 214 (8.2%) | 177 (7.9%) |
| $2,500 to $4,999 | 161 (6.2%) | 107 (4.8%) |
| $5,000 to $7,499 | 113 (4.3%) | 113 (5.0%) |
| $7,500 to $9,999 | 74 (2.9%) | 54 (2.4%) |
| $10,000 to $12,499 | 126 (4.9%) | 73 (3.2%) |
| $12,500 to $14,999 | 67 (2.6%) | 53 (2.4%) |
| $15,000 to $17,499 | 113 (4.3%) | 41 (1.8%) |
| $17,500 to $19,999 | 61 (2.4%) | 52 (2.3%) |
| $20,000 to $22,499 | 49 (1.9%) | 100 (4.4%) |
| $22,500 to $24,999 | 84 (3.2%) | 57 (2.5%) |
| $25,000 to $29,999 | 119 (4.6%) | 86 (3.8%) |
| $30,000 to $34,999 | 126 (4.9%) | 109 (4.8%) |
| $35,000 to $39,999 | 64 (2.5%) | 83 (3.7%) |
| $40,000 to $44,999 | 79 (3.0%) | 123 (5.5%) |
| $45,000 to $49,999 | 91 (3.5%) | 93 (4.1%) |
| $50,000 to $54,999 | 62 (2.4%) | 31 (1.4%) |
| $55,000 to $64,999 | 178 (6.9%) | 188 (8.3%) |
| $65,000 to $74,999 | 122 (4.7%) | 195 (8.7%) |
| $75,000 to $99,999 | 246 (9.5%) | 273 (12.1%) |
| $100,000+ | 449 (17.3%) | 245 (10.9%) |
| Total | 2,598 (100.0%) | 2,253 (100.0%) |
Earnings by Sex by Educational Attainment in Nome Census Area
Average earnings in Nome Census Area are $47,034 for men and $47,240 for women, a difference of 0.4%. Men with an educational attainment of graduate degree enjoy the highest average annual earnings of $103,357, while those with less than high school education earn the least with $19,250. Women with an educational attainment of graduate degree earn the most with the average annual earnings of $89,904, while those with less than high school education have the smallest earnings of $15,938.
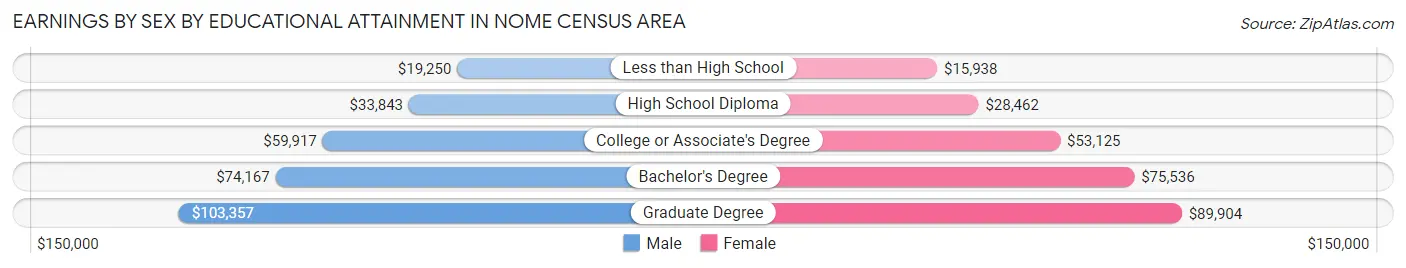
| Educational Attainment | Male Income | Female Income |
| Less than High School | $19,250 | $15,938 |
| High School Diploma | $33,843 | $28,462 |
| College or Associate's Degree | $59,917 | $53,125 |
| Bachelor's Degree | $74,167 | $75,536 |
| Graduate Degree | $103,357 | $89,904 |
| Total | $47,034 | $47,240 |
Family Income in Nome Census Area
Family Income Brackets in Nome Census Area
According to the Nome Census Area family income data, there are 377 families falling into the $50,000 to $74,999 income range, which is the most common income bracket and makes up 18.4% of all families. Conversely, the $10,000 to $14,999 income bracket is the least frequent group with only 53 families (2.6%) belonging to this category.
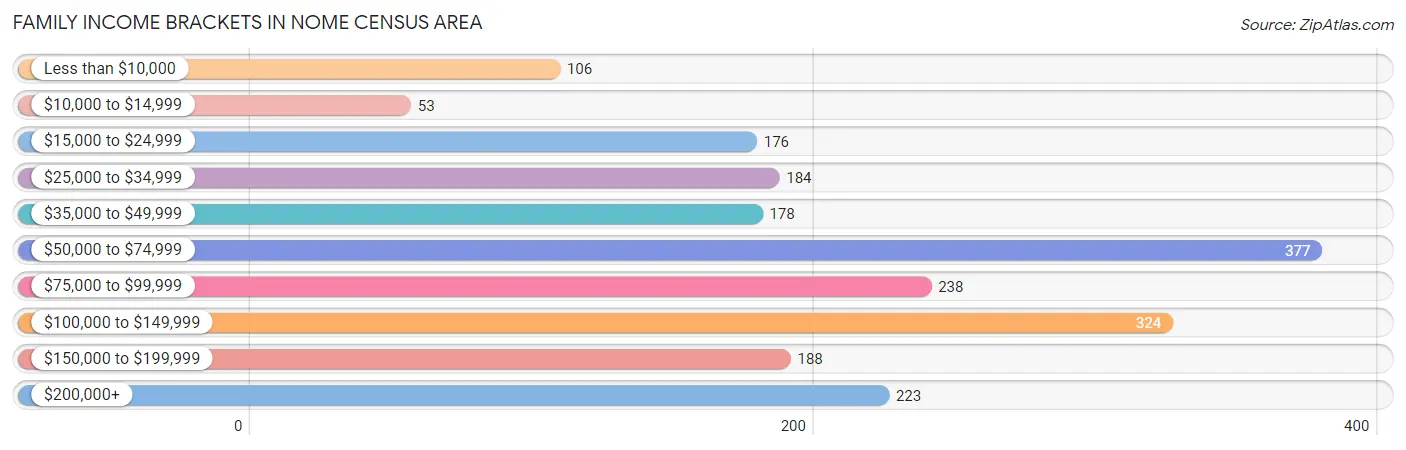
| Income Bracket | # Families | % Families |
| Less than $10,000 | 106 | 5.2% |
| $10,000 to $14,999 | 53 | 2.6% |
| $15,000 to $24,999 | 176 | 8.6% |
| $25,000 to $34,999 | 184 | 9.0% |
| $35,000 to $49,999 | 178 | 8.7% |
| $50,000 to $74,999 | 377 | 18.4% |
| $75,000 to $99,999 | 238 | 11.6% |
| $100,000 to $149,999 | 324 | 15.8% |
| $150,000 to $199,999 | 188 | 9.2% |
| $200,000+ | 223 | 10.9% |
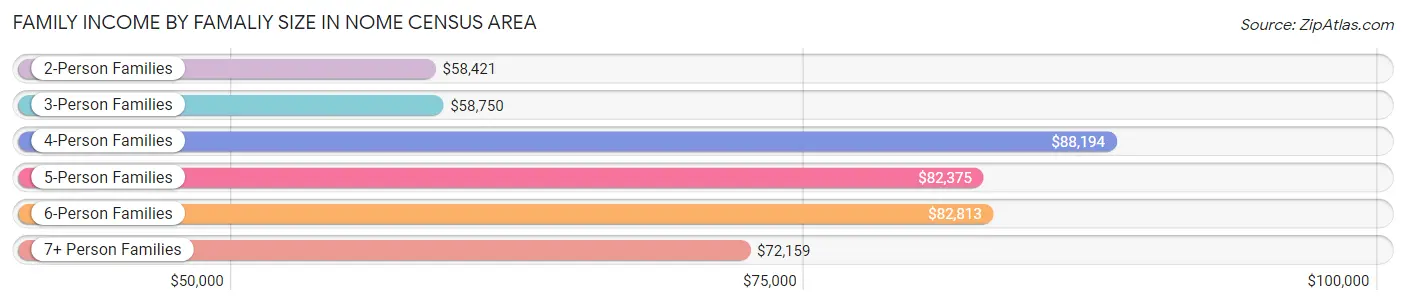
Family Income by Famaliy Size in Nome Census Area
4-person families (337 | 16.5%) account for the highest median family income in Nome Census Area with $88,194 per family, while 2-person families (596 | 29.1%) have the highest median income of $29,210 per family member.
| Income Bracket | # Families | Median Income |
| 2-Person Families | 596 (29.1%) | $58,421 |
| 3-Person Families | 366 (17.9%) | $58,750 |
| 4-Person Families | 337 (16.5%) | $88,194 |
| 5-Person Families | 285 (13.9%) | $82,375 |
| 6-Person Families | 187 (9.1%) | $82,813 |
| 7+ Person Families | 277 (13.5%) | $72,159 |
| Total | 2,048 (100.0%) | $70,588 |
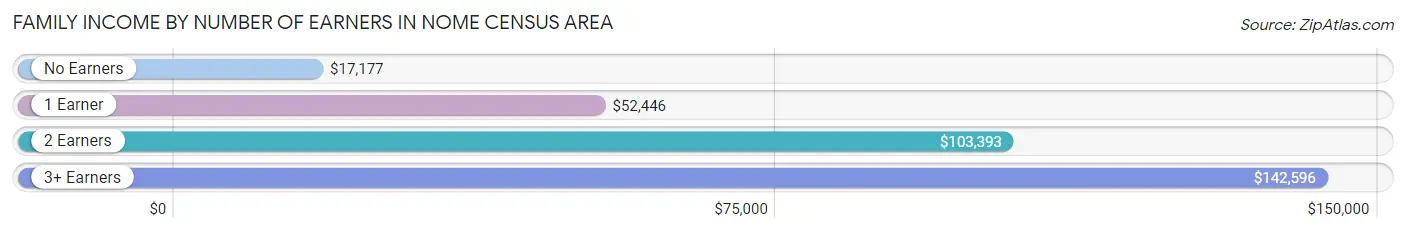
Family Income by Number of Earners in Nome Census Area
The median family income in Nome Census Area is $70,588, with families comprising 3+ earners (345) having the highest median family income of $142,596, while families with no earners (220) have the lowest median family income of $17,177, accounting for 16.9% and 10.7% of families, respectively.
| Number of Earners | # Families | Median Income |
| No Earners | 220 (10.7%) | $17,177 |
| 1 Earner | 761 (37.2%) | $52,446 |
| 2 Earners | 722 (35.2%) | $103,393 |
| 3+ Earners | 345 (16.9%) | $142,596 |
| Total | 2,048 (100.0%) | $70,588 |
Household Income in Nome Census Area
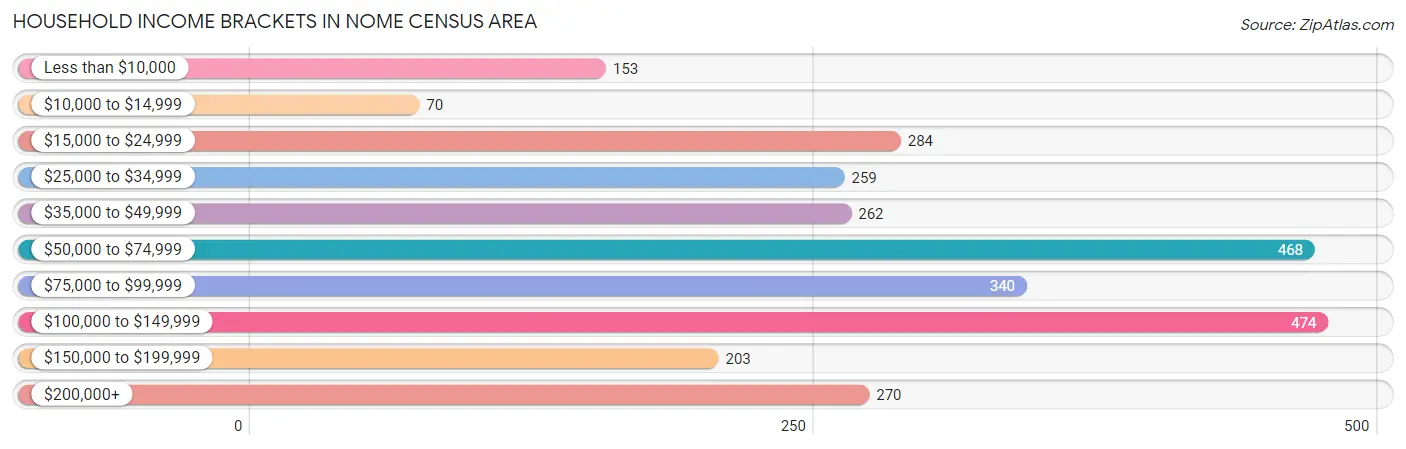
Household Income Brackets in Nome Census Area
With 474 households falling in the category, the $100,000 to $149,999 income range is the most frequent in Nome Census Area, accounting for 17.0% of all households. In contrast, only 70 households (2.5%) fall into the $10,000 to $14,999 income bracket, making it the least populous group.
| Income Bracket | # Households | % Households |
| Less than $10,000 | 153 | 5.5% |
| $10,000 to $14,999 | 70 | 2.5% |
| $15,000 to $24,999 | 284 | 10.2% |
| $25,000 to $34,999 | 259 | 9.3% |
| $35,000 to $49,999 | 262 | 9.4% |
| $50,000 to $74,999 | 468 | 16.8% |
| $75,000 to $99,999 | 340 | 12.2% |
| $100,000 to $149,999 | 474 | 17.0% |
| $150,000 to $199,999 | 203 | 7.3% |
| $200,000+ | 270 | 9.7% |
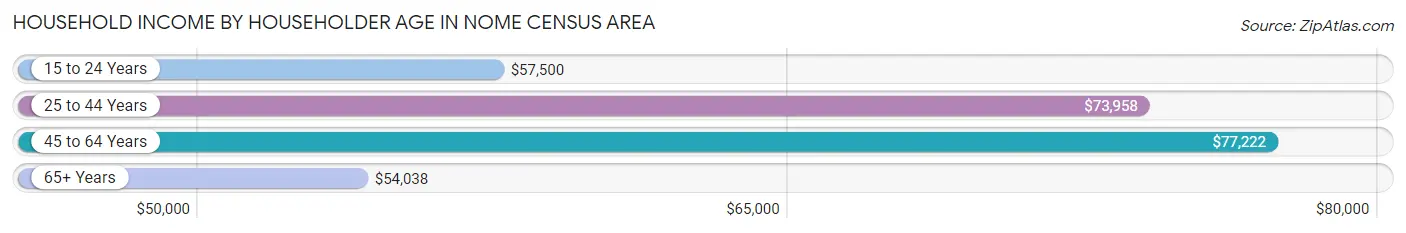
Household Income by Householder Age in Nome Census Area
The median household income in Nome Census Area is $70,121, with the highest median household income of $77,222 found in the 45 to 64 years age bracket for the primary householder. A total of 1,214 households (43.6%) fall into this category. Meanwhile, the 65+ years age bracket for the primary householder has the lowest median household income of $54,038, with 518 households (18.6%) in this group.
| Income Bracket | # Households | Median Income |
| 15 to 24 Years | 104 (3.7%) | $57,500 |
| 25 to 44 Years | 950 (34.1%) | $73,958 |
| 45 to 64 Years | 1,214 (43.6%) | $77,222 |
| 65+ Years | 518 (18.6%) | $54,038 |
| Total | 2,786 (100.0%) | $70,121 |
Poverty in Nome Census Area
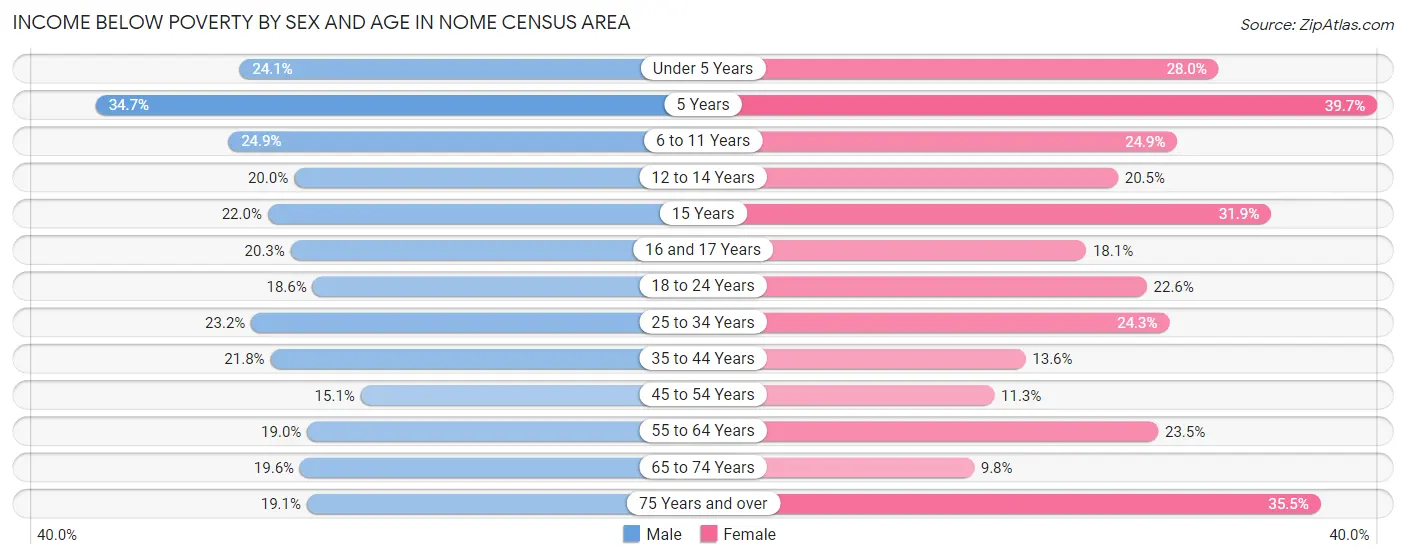
Income Below Poverty by Sex and Age in Nome Census Area
With 21.0% poverty level for males and 21.3% for females among the residents of Nome Census Area, 5 year old males and 5 year old females are the most vulnerable to poverty, with 25 males (34.7%) and 31 females (39.7%) in their respective age groups living below the poverty level.
| Age Bracket | Male | Female |
| Under 5 Years | 101 (24.0%) | 115 (28.0%) |
| 5 Years | 25 (34.7%) | 31 (39.7%) |
| 6 to 11 Years | 154 (24.9%) | 145 (24.9%) |
| 12 to 14 Years | 60 (20.0%) | 50 (20.5%) |
| 15 Years | 18 (22.0%) | 29 (31.9%) |
| 16 and 17 Years | 32 (20.3%) | 33 (18.1%) |
| 18 to 24 Years | 97 (18.6%) | 105 (22.6%) |
| 25 to 34 Years | 159 (23.2%) | 175 (24.3%) |
| 35 to 44 Years | 142 (21.7%) | 74 (13.6%) |
| 45 to 54 Years | 82 (15.0%) | 58 (11.3%) |
| 55 to 64 Years | 112 (19.0%) | 108 (23.5%) |
| 65 to 74 Years | 53 (19.6%) | 24 (9.8%) |
| 75 Years and over | 16 (19.1%) | 43 (35.5%) |
| Total | 1,051 (21.0%) | 990 (21.3%) |
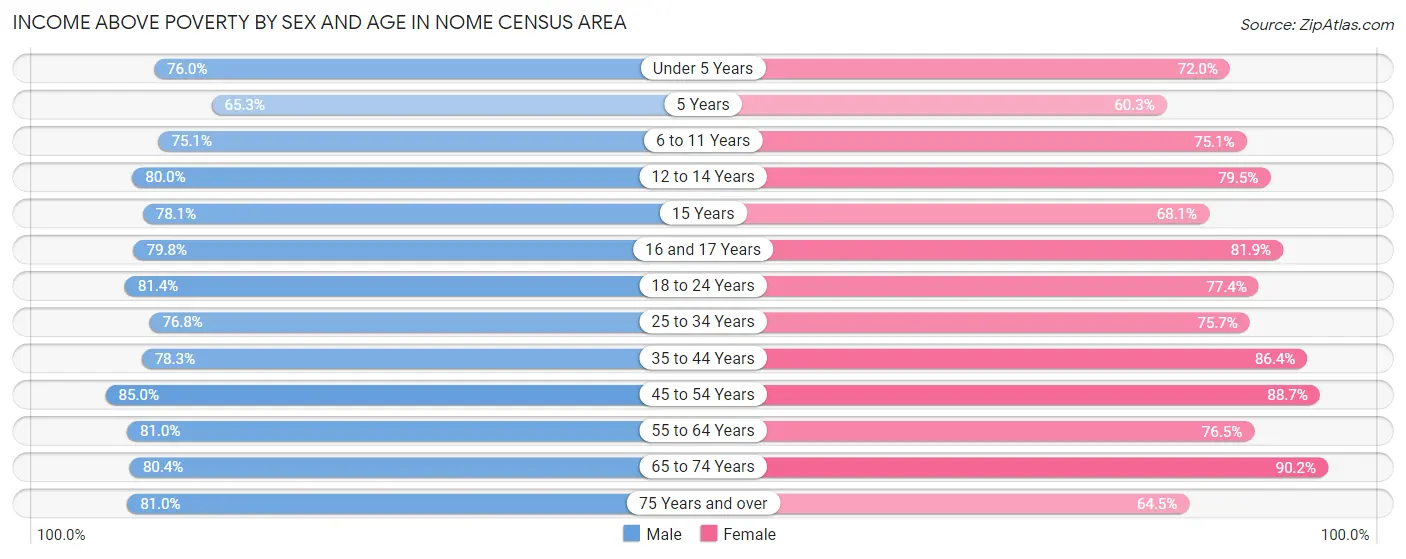
Income Above Poverty by Sex and Age in Nome Census Area
According to the poverty statistics in Nome Census Area, males aged 45 to 54 years and females aged 65 to 74 years are the age groups that are most secure financially, with 85.0% of males and 90.2% of females in these age groups living above the poverty line.
| Age Bracket | Male | Female |
| Under 5 Years | 319 (75.9%) | 296 (72.0%) |
| 5 Years | 47 (65.3%) | 47 (60.3%) |
| 6 to 11 Years | 465 (75.1%) | 437 (75.1%) |
| 12 to 14 Years | 240 (80.0%) | 194 (79.5%) |
| 15 Years | 64 (78.0%) | 62 (68.1%) |
| 16 and 17 Years | 126 (79.7%) | 149 (81.9%) |
| 18 to 24 Years | 424 (81.4%) | 359 (77.4%) |
| 25 to 34 Years | 527 (76.8%) | 545 (75.7%) |
| 35 to 44 Years | 511 (78.2%) | 469 (86.4%) |
| 45 to 54 Years | 463 (85.0%) | 455 (88.7%) |
| 55 to 64 Years | 477 (81.0%) | 352 (76.5%) |
| 65 to 74 Years | 218 (80.4%) | 221 (90.2%) |
| 75 Years and over | 68 (80.9%) | 78 (64.5%) |
| Total | 3,949 (79.0%) | 3,664 (78.7%) |
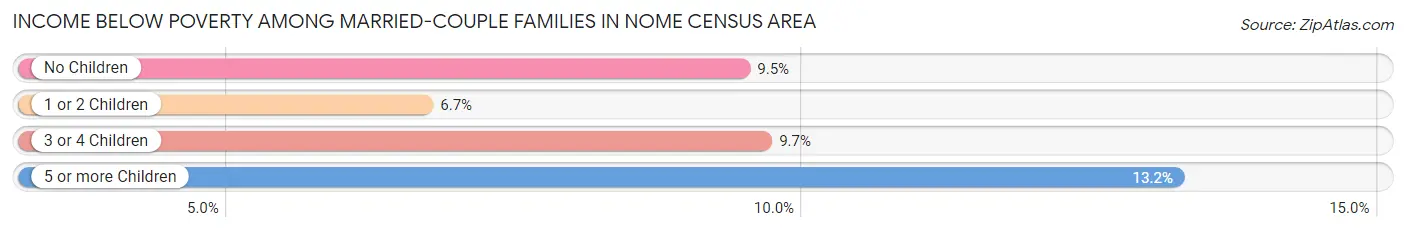
Income Below Poverty Among Married-Couple Families in Nome Census Area
The poverty statistics for married-couple families in Nome Census Area show that 8.7% or 84 of the total 965 families live below the poverty line. Families with 5 or more children have the highest poverty rate of 13.2%, comprising of 9 families. On the other hand, families with 1 or 2 children have the lowest poverty rate of 6.7%, which includes 25 families.
| Children | Above Poverty | Below Poverty |
| No Children | 268 (90.5%) | 28 (9.5%) |
| 1 or 2 Children | 348 (93.3%) | 25 (6.7%) |
| 3 or 4 Children | 206 (90.3%) | 22 (9.7%) |
| 5 or more Children | 59 (86.8%) | 9 (13.2%) |
| Total | 881 (91.3%) | 84 (8.7%) |
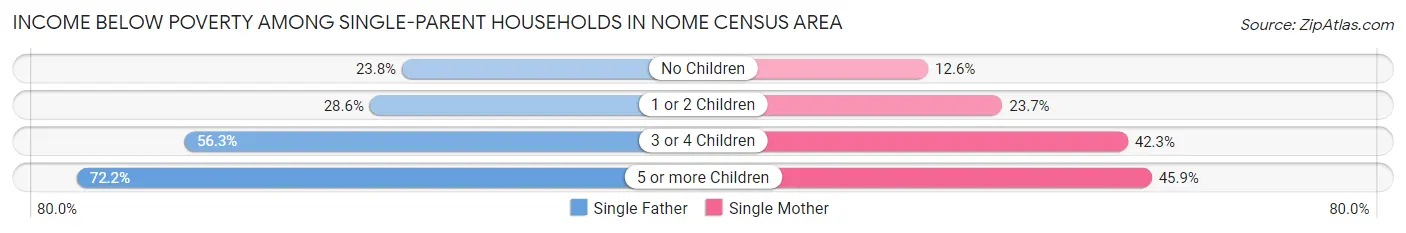
Income Below Poverty Among Single-Parent Households in Nome Census Area
According to the poverty data in Nome Census Area, 33.7% or 159 single-father households and 26.7% or 163 single-mother households are living below the poverty line. Among single-father households, those with 5 or more children have the highest poverty rate, with 13 households (72.2%) experiencing poverty. Likewise, among single-mother households, those with 5 or more children have the highest poverty rate, with 28 households (45.9%) falling below the poverty line.
| Children | Single Father | Single Mother |
| No Children | 29 (23.8%) | 18 (12.6%) |
| 1 or 2 Children | 72 (28.6%) | 70 (23.6%) |
| 3 or 4 Children | 45 (56.2%) | 47 (42.3%) |
| 5 or more Children | 13 (72.2%) | 28 (45.9%) |
| Total | 159 (33.7%) | 163 (26.7%) |
Income Below Poverty Among Married-Couple vs Single-Parent Households in Nome Census Area
The poverty data for Nome Census Area shows that 84 of the married-couple family households (8.7%) and 322 of the single-parent households (29.7%) are living below the poverty level. Within the married-couple family households, those with 5 or more children have the highest poverty rate, with 9 households (13.2%) falling below the poverty line. Among the single-parent households, those with 5 or more children have the highest poverty rate, with 41 household (51.9%) living below poverty.
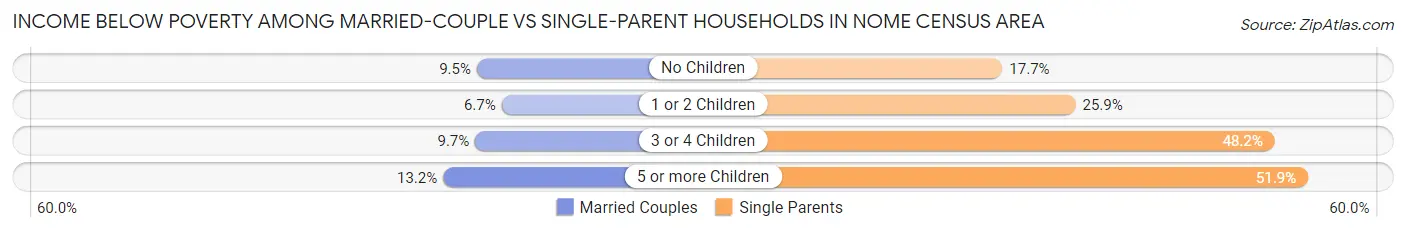
| Children | Married-Couple Families | Single-Parent Households |
| No Children | 28 (9.5%) | 47 (17.7%) |
| 1 or 2 Children | 25 (6.7%) | 142 (25.9%) |
| 3 or 4 Children | 22 (9.7%) | 92 (48.2%) |
| 5 or more Children | 9 (13.2%) | 41 (51.9%) |
| Total | 84 (8.7%) | 322 (29.7%) |
Employment Characteristics in Nome Census Area
Employment by Class of Employer in Nome Census Area
Among the 3,666 employed individuals in Nome Census Area, private company employees (943 | 25.7%), state government employees (909 | 24.8%), and not-for-profit organizations (781 | 21.3%) make up the most common classes of employment.
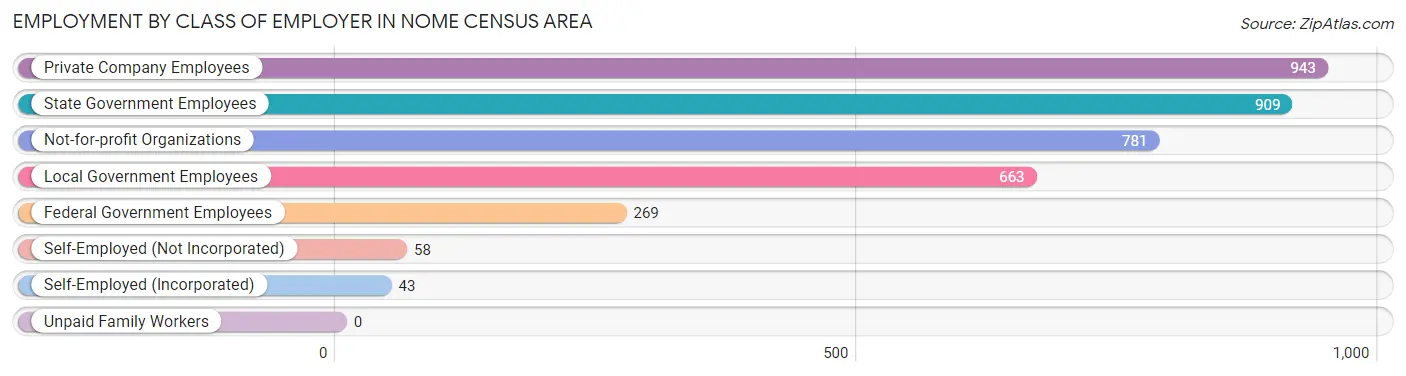
| Employer Class | # Employees | % Employees |
| Private Company Employees | 943 | 25.7% |
| Self-Employed (Incorporated) | 43 | 1.2% |
| Self-Employed (Not Incorporated) | 58 | 1.6% |
| Not-for-profit Organizations | 781 | 21.3% |
| Local Government Employees | 663 | 18.1% |
| State Government Employees | 909 | 24.8% |
| Federal Government Employees | 269 | 7.3% |
| Unpaid Family Workers | 0 | 0.0% |
| Total | 3,666 | 100.0% |
Employment Status by Age in Nome Census Area
According to the labor force statistics for Nome Census Area, out of the total population over 16 years of age (6,951), 65.6% or 4,560 individuals are in the labor force, with 16.5% or 752 of them unemployed. The age group with the highest labor force participation rate is 45 to 54 years, with 83.9% or 888 individuals in the labor force. Within the labor force, the 16 to 19 years age range has the highest percentage of unemployed individuals, with 30.1% or 56 of them being unemployed.
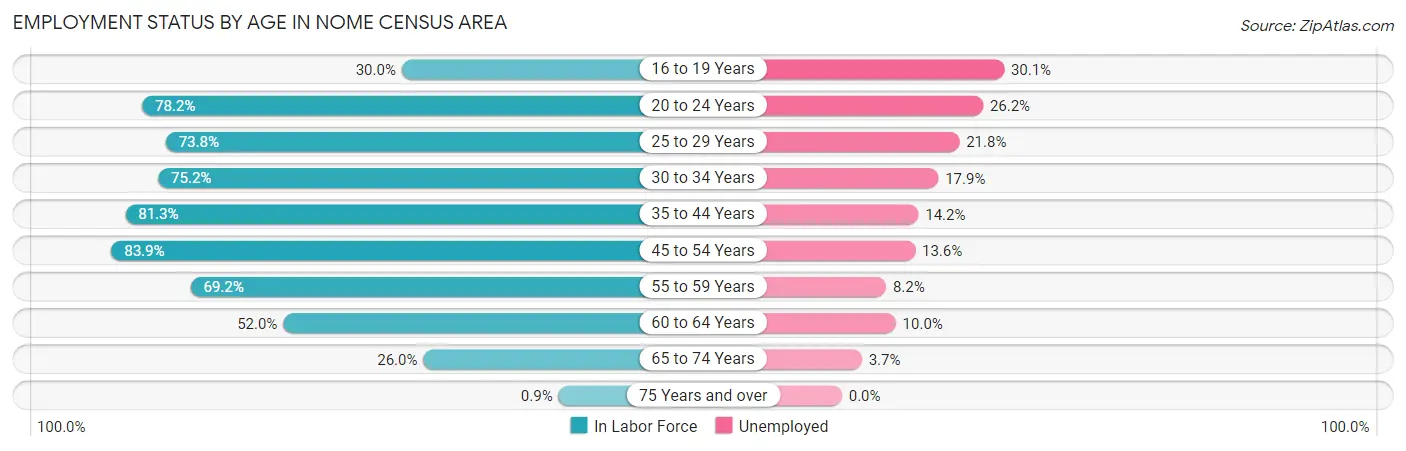
| Age Bracket | In Labor Force | Unemployed |
| 16 to 19 Years | 186 (30.0%) | 56 (30.1%) |
| 20 to 24 Years | 600 (78.2%) | 157 (26.2%) |
| 25 to 29 Years | 544 (73.8%) | 119 (21.8%) |
| 30 to 34 Years | 549 (75.2%) | 98 (17.9%) |
| 35 to 44 Years | 999 (81.3%) | 142 (14.2%) |
| 45 to 54 Years | 888 (83.9%) | 121 (13.6%) |
| 55 to 59 Years | 429 (69.2%) | 35 (8.2%) |
| 60 to 64 Years | 229 (52.0%) | 23 (10.0%) |
| 65 to 74 Years | 135 (26.0%) | 5 (3.7%) |
| 75 Years and over | 2 (0.9%) | 0 (0.0%) |
| Total | 4,560 (65.6%) | 752 (16.5%) |
Employment Status by Educational Attainment in Nome Census Area
According to labor force statistics for Nome Census Area, 75.6% of individuals (3,639) out of the total population between 25 and 64 years of age (4,814) are in the labor force, with 14.8% or 539 of them being unemployed. The group with the highest labor force participation rate are those with the educational attainment of bachelor's degree or higher, with 97.1% or 882 individuals in the labor force. Within the labor force, individuals with less than high school education have the highest percentage of unemployment, with 35.0% or 84 of them being unemployed.
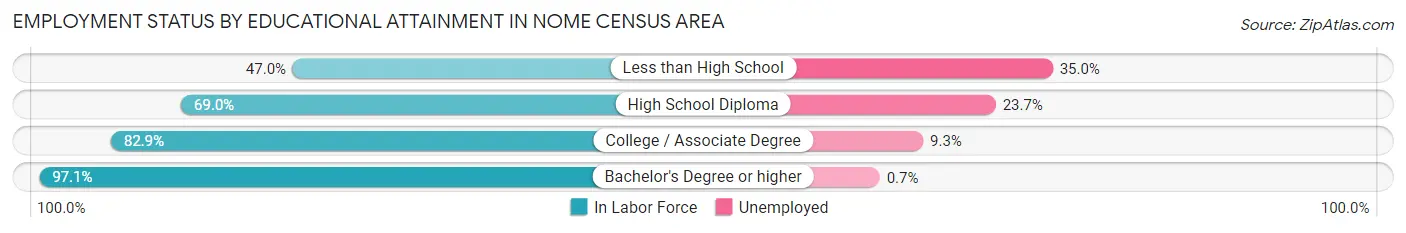
| Educational Attainment | In Labor Force | Unemployed |
| Less than High School | 240 (47.0%) | 179 (35.0%) |
| High School Diploma | 1,486 (69.0%) | 510 (23.7%) |
| College / Associate Degree | 1,030 (82.9%) | 116 (9.3%) |
| Bachelor's Degree or higher | 882 (97.1%) | 6 (0.7%) |
| Total | 3,639 (75.6%) | 712 (14.8%) |
Employment Occupations by Sex in Nome Census Area
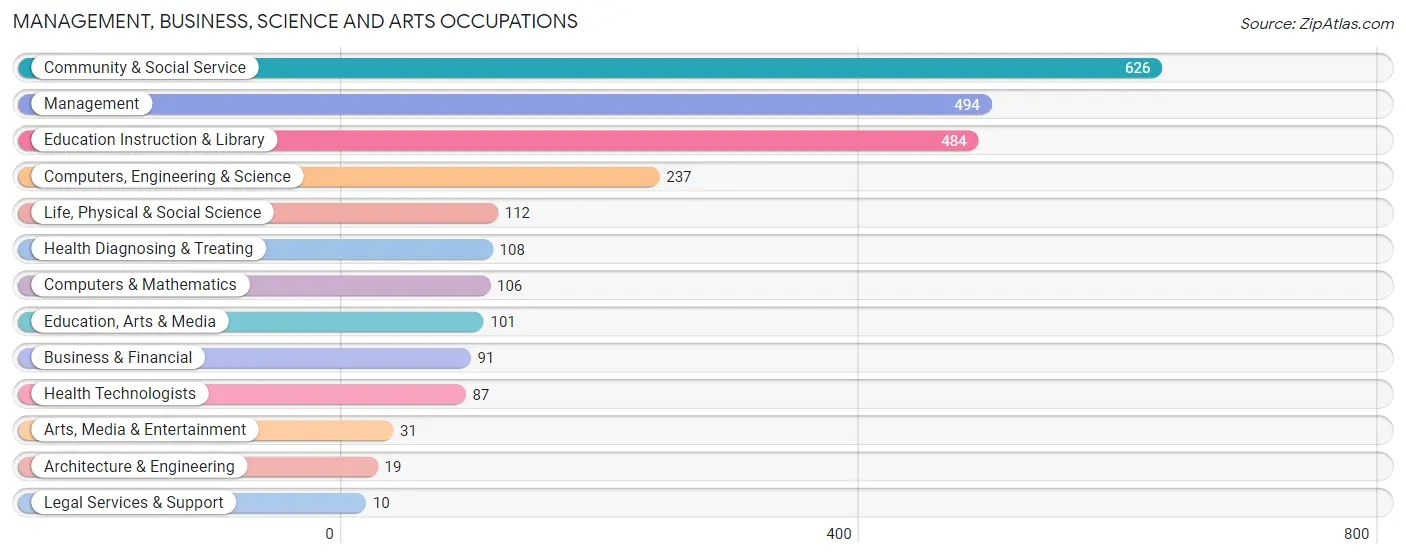
Management, Business, Science and Arts Occupations
The most common Management, Business, Science and Arts occupations in Nome Census Area are Community & Social Service (626 | 16.6%), Management (494 | 13.1%), Education Instruction & Library (484 | 12.8%), Computers, Engineering & Science (237 | 6.3%), and Life, Physical & Social Science (112 | 3.0%).
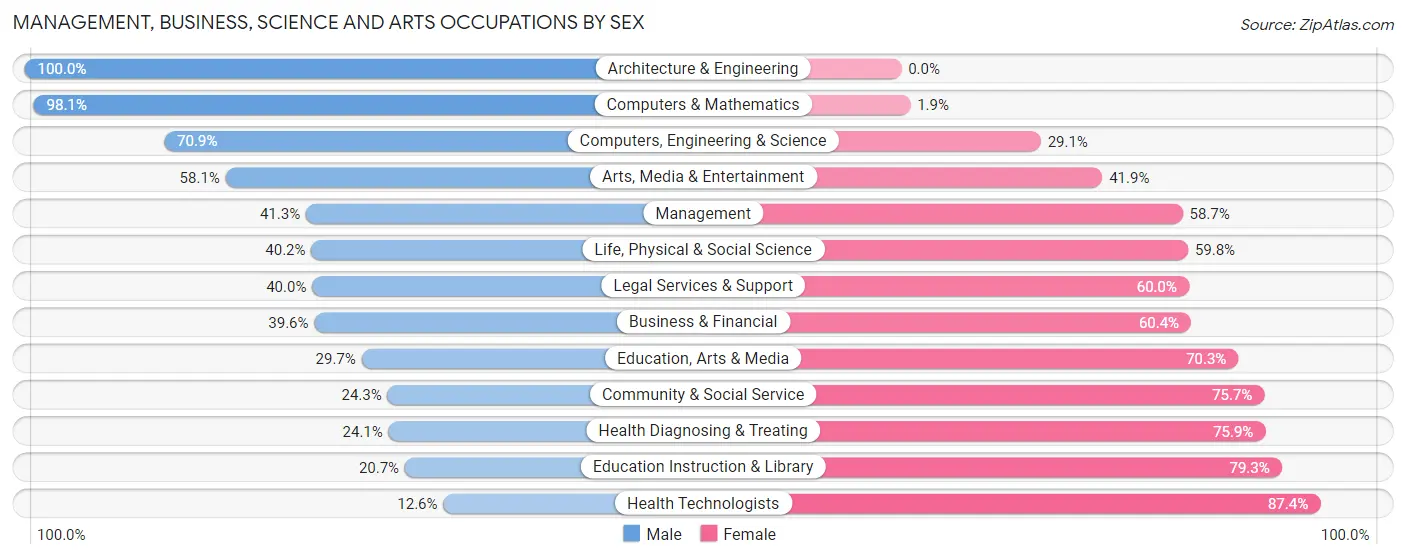
Management, Business, Science and Arts Occupations by Sex
Within the Management, Business, Science and Arts occupations in Nome Census Area, the most male-oriented occupations are Architecture & Engineering (100.0%), Computers & Mathematics (98.1%), and Computers, Engineering & Science (70.9%), while the most female-oriented occupations are Health Technologists (87.4%), Education Instruction & Library (79.3%), and Health Diagnosing & Treating (75.9%).
| Occupation | Male | Female |
| Management | 204 (41.3%) | 290 (58.7%) |
| Business & Financial | 36 (39.6%) | 55 (60.4%) |
| Computers, Engineering & Science | 168 (70.9%) | 69 (29.1%) |
| Computers & Mathematics | 104 (98.1%) | 2 (1.9%) |
| Architecture & Engineering | 19 (100.0%) | 0 (0.0%) |
| Life, Physical & Social Science | 45 (40.2%) | 67 (59.8%) |
| Community & Social Service | 152 (24.3%) | 474 (75.7%) |
| Education, Arts & Media | 30 (29.7%) | 71 (70.3%) |
| Legal Services & Support | 4 (40.0%) | 6 (60.0%) |
| Education Instruction & Library | 100 (20.7%) | 384 (79.3%) |
| Arts, Media & Entertainment | 18 (58.1%) | 13 (41.9%) |
| Health Diagnosing & Treating | 26 (24.1%) | 82 (75.9%) |
| Health Technologists | 11 (12.6%) | 76 (87.4%) |
| Total (Category) | 586 (37.7%) | 970 (62.3%) |
| Total (Overall) | 1,852 (49.1%) | 1,921 (50.9%) |
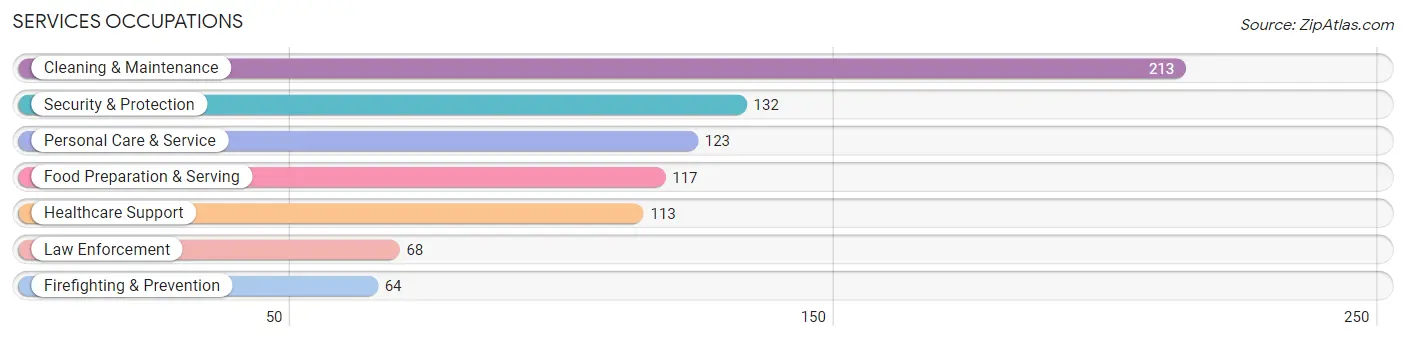
Services Occupations
The most common Services occupations in Nome Census Area are Cleaning & Maintenance (213 | 5.7%), Security & Protection (132 | 3.5%), Personal Care & Service (123 | 3.3%), Food Preparation & Serving (117 | 3.1%), and Healthcare Support (113 | 3.0%).
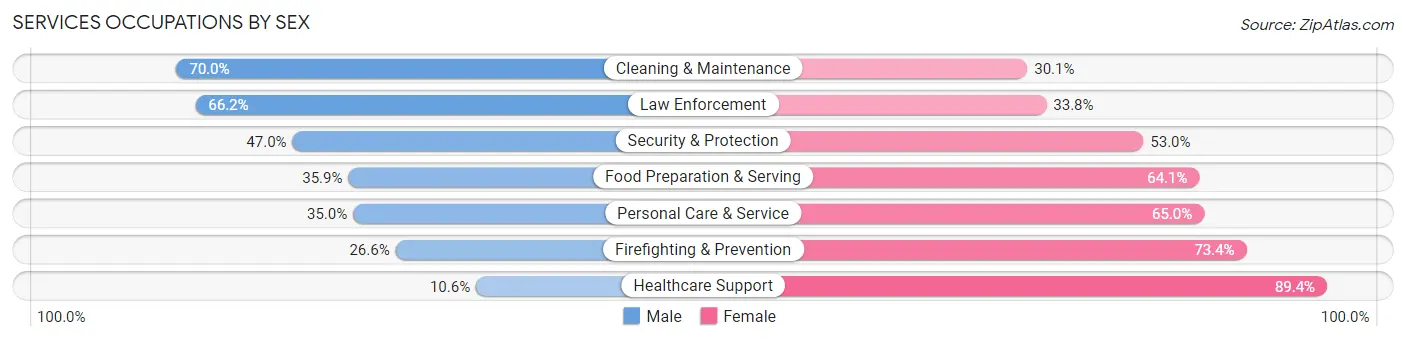
Services Occupations by Sex
Within the Services occupations in Nome Census Area, the most male-oriented occupations are Cleaning & Maintenance (70.0%), Law Enforcement (66.2%), and Security & Protection (47.0%), while the most female-oriented occupations are Healthcare Support (89.4%), Firefighting & Prevention (73.4%), and Personal Care & Service (65.0%).
| Occupation | Male | Female |
| Healthcare Support | 12 (10.6%) | 101 (89.4%) |
| Security & Protection | 62 (47.0%) | 70 (53.0%) |
| Firefighting & Prevention | 17 (26.6%) | 47 (73.4%) |
| Law Enforcement | 45 (66.2%) | 23 (33.8%) |
| Food Preparation & Serving | 42 (35.9%) | 75 (64.1%) |
| Cleaning & Maintenance | 149 (70.0%) | 64 (30.0%) |
| Personal Care & Service | 43 (35.0%) | 80 (65.0%) |
| Total (Category) | 308 (44.1%) | 390 (55.9%) |
| Total (Overall) | 1,852 (49.1%) | 1,921 (50.9%) |
Sales and Office Occupations
The most common Sales and Office occupations in Nome Census Area are Office & Administration (526 | 13.9%), and Sales & Related (227 | 6.0%).
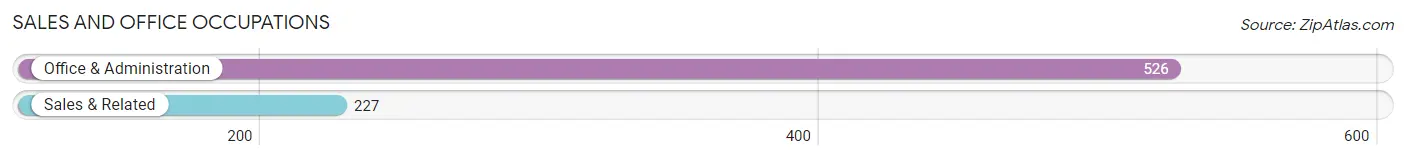
Sales and Office Occupations by Sex
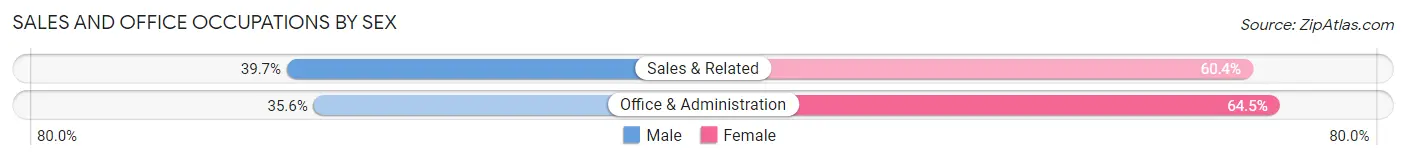
| Occupation | Male | Female |
| Sales & Related | 90 (39.7%) | 137 (60.4%) |
| Office & Administration | 187 (35.5%) | 339 (64.4%) |
| Total (Category) | 277 (36.8%) | 476 (63.2%) |
| Total (Overall) | 1,852 (49.1%) | 1,921 (50.9%) |
Natural Resources, Construction and Maintenance Occupations
The most common Natural Resources, Construction and Maintenance occupations in Nome Census Area are Construction & Extraction (175 | 4.6%), Installation, Maintenance & Repair (162 | 4.3%), and Farming, Fishing & Forestry (7 | 0.2%).
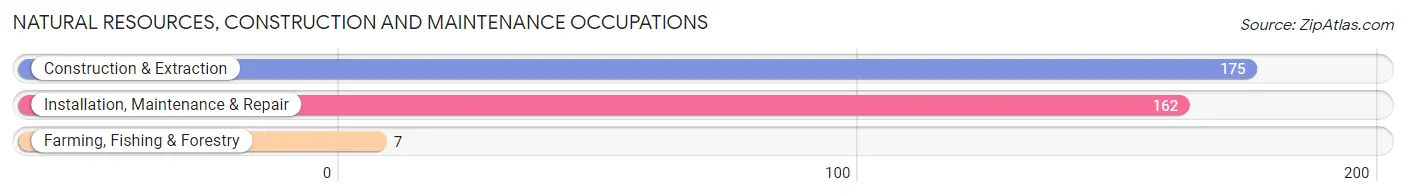
Natural Resources, Construction and Maintenance Occupations by Sex
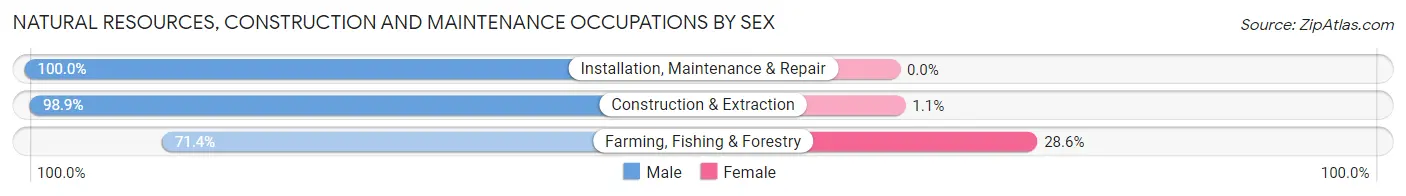
| Occupation | Male | Female |
| Farming, Fishing & Forestry | 5 (71.4%) | 2 (28.6%) |
| Construction & Extraction | 173 (98.9%) | 2 (1.1%) |
| Installation, Maintenance & Repair | 162 (100.0%) | 0 (0.0%) |
| Total (Category) | 340 (98.8%) | 4 (1.2%) |
| Total (Overall) | 1,852 (49.1%) | 1,921 (50.9%) |
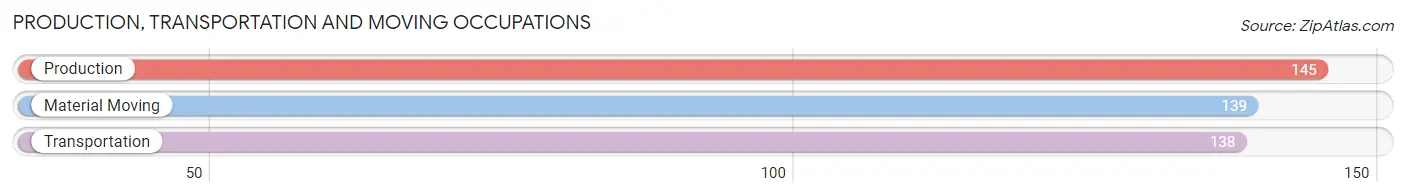
Production, Transportation and Moving Occupations
The most common Production, Transportation and Moving occupations in Nome Census Area are Production (145 | 3.8%), Material Moving (139 | 3.7%), and Transportation (138 | 3.7%).
Production, Transportation and Moving Occupations by Sex
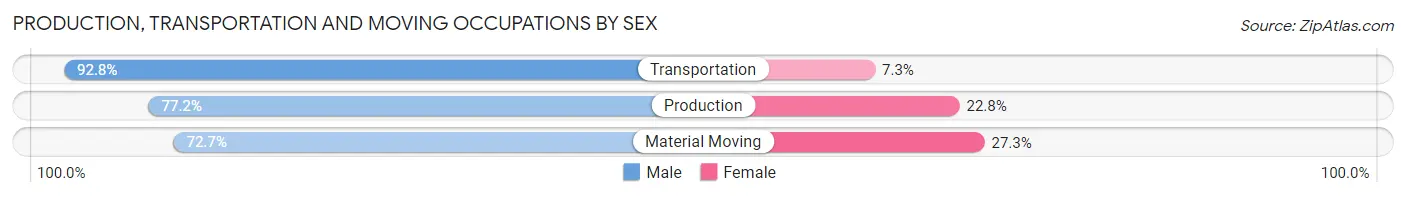
| Occupation | Male | Female |
| Production | 112 (77.2%) | 33 (22.8%) |
| Transportation | 128 (92.7%) | 10 (7.2%) |
| Material Moving | 101 (72.7%) | 38 (27.3%) |
| Total (Category) | 341 (80.8%) | 81 (19.2%) |
| Total (Overall) | 1,852 (49.1%) | 1,921 (50.9%) |
Employment Industries by Sex in Nome Census Area
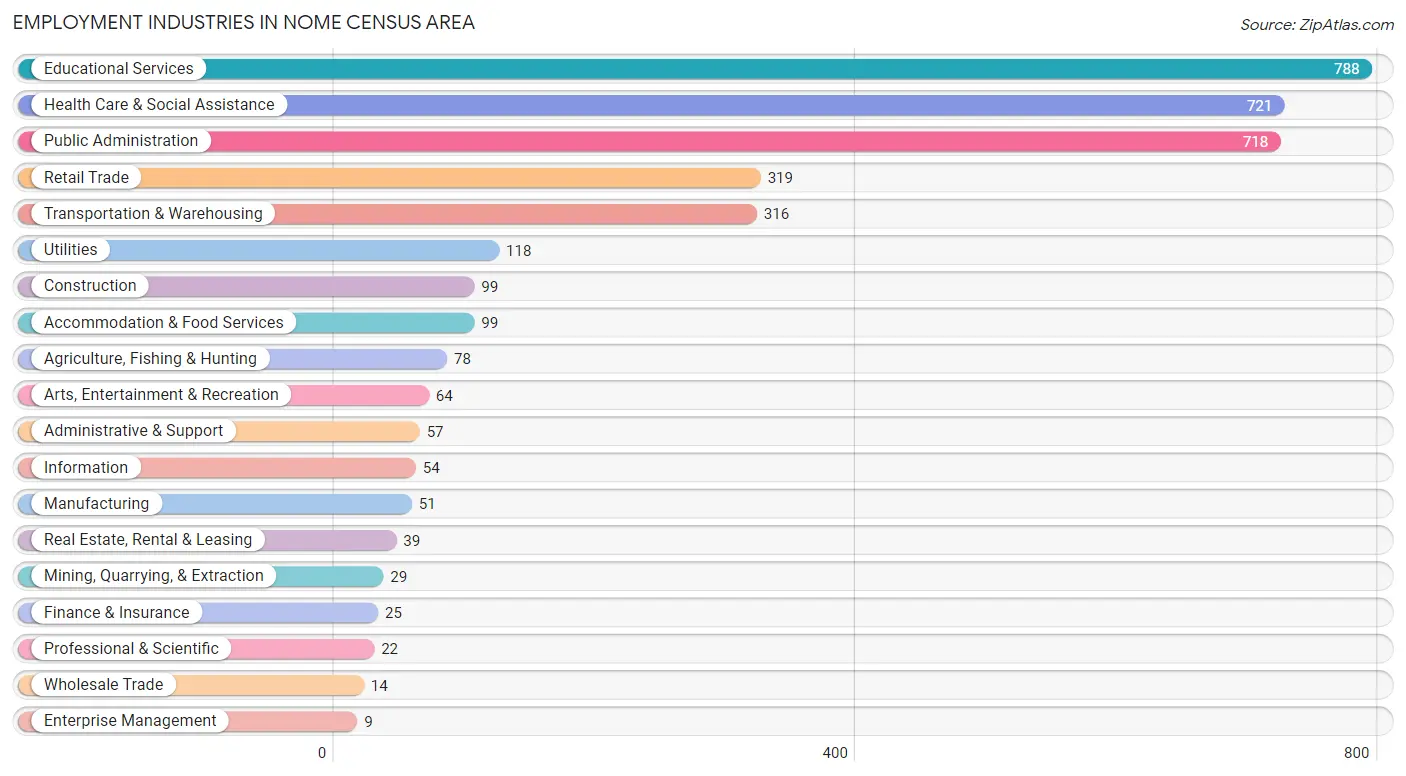
Employment Industries in Nome Census Area
The major employment industries in Nome Census Area include Educational Services (788 | 20.9%), Health Care & Social Assistance (721 | 19.1%), Public Administration (718 | 19.0%), Retail Trade (319 | 8.5%), and Transportation & Warehousing (316 | 8.4%).
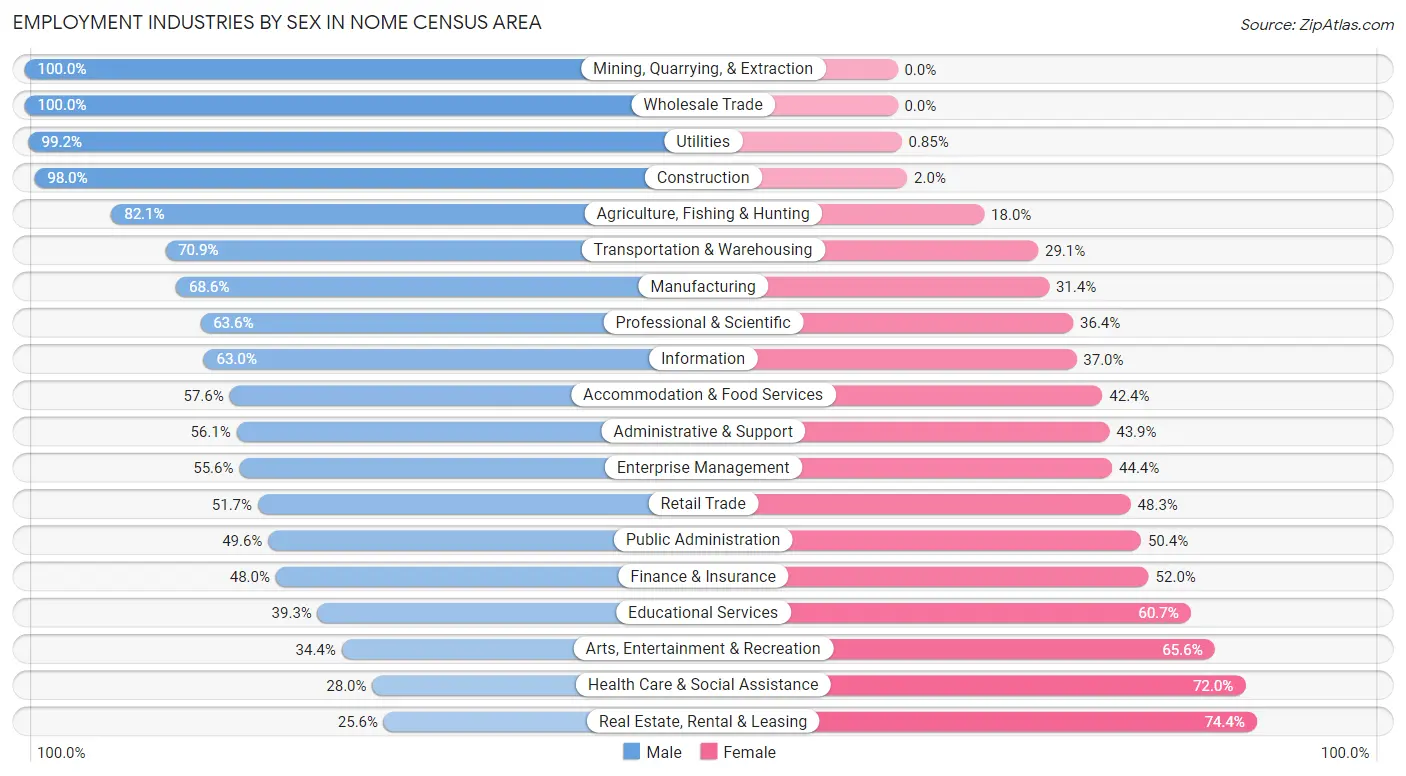
Employment Industries by Sex in Nome Census Area
The Nome Census Area industries that see more men than women are Mining, Quarrying, & Extraction (100.0%), Wholesale Trade (100.0%), and Utilities (99.2%), whereas the industries that tend to have a higher number of women are Real Estate, Rental & Leasing (74.4%), Health Care & Social Assistance (72.0%), and Arts, Entertainment & Recreation (65.6%).
| Industry | Male | Female |
| Agriculture, Fishing & Hunting | 64 (82.1%) | 14 (17.9%) |
| Mining, Quarrying, & Extraction | 29 (100.0%) | 0 (0.0%) |
| Construction | 97 (98.0%) | 2 (2.0%) |
| Manufacturing | 35 (68.6%) | 16 (31.4%) |
| Wholesale Trade | 14 (100.0%) | 0 (0.0%) |
| Retail Trade | 165 (51.7%) | 154 (48.3%) |
| Transportation & Warehousing | 224 (70.9%) | 92 (29.1%) |
| Utilities | 117 (99.2%) | 1 (0.9%) |
| Information | 34 (63.0%) | 20 (37.0%) |
| Finance & Insurance | 12 (48.0%) | 13 (52.0%) |
| Real Estate, Rental & Leasing | 10 (25.6%) | 29 (74.4%) |
| Professional & Scientific | 14 (63.6%) | 8 (36.4%) |
| Enterprise Management | 5 (55.6%) | 4 (44.4%) |
| Administrative & Support | 32 (56.1%) | 25 (43.9%) |
| Educational Services | 310 (39.3%) | 478 (60.7%) |
| Health Care & Social Assistance | 202 (28.0%) | 519 (72.0%) |
| Arts, Entertainment & Recreation | 22 (34.4%) | 42 (65.6%) |
| Accommodation & Food Services | 57 (57.6%) | 42 (42.4%) |
| Public Administration | 356 (49.6%) | 362 (50.4%) |
| Total | 1,852 (49.1%) | 1,921 (50.9%) |
Education in Nome Census Area
School Enrollment in Nome Census Area
The most common levels of schooling among the 3,017 students in Nome Census Area are elementary school (837 | 27.7%), middle school (833 | 27.6%), and high school (670 | 22.2%).
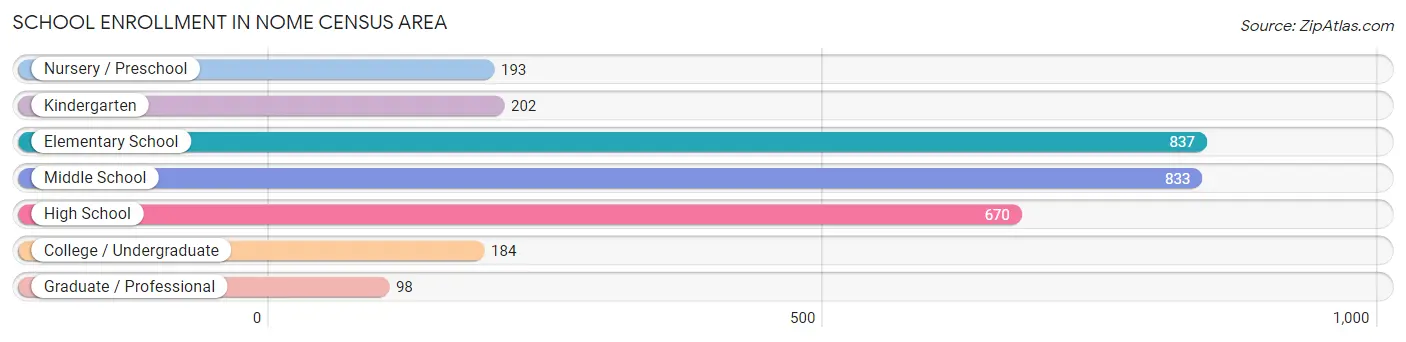
| School Level | # Students | % Students |
| Nursery / Preschool | 193 | 6.4% |
| Kindergarten | 202 | 6.7% |
| Elementary School | 837 | 27.7% |
| Middle School | 833 | 27.6% |
| High School | 670 | 22.2% |
| College / Undergraduate | 184 | 6.1% |
| Graduate / Professional | 98 | 3.3% |
| Total | 3,017 | 100.0% |
School Enrollment by Age by Funding Source in Nome Census Area
Out of a total of 3,017 students who are enrolled in schools in Nome Census Area, 115 (3.8%) attend a private institution, while the remaining 2,902 (96.2%) are enrolled in public schools. The age group of 25 to 34 year olds has the highest likelihood of being enrolled in private schools, with 12 (21.0% in the age bracket) enrolled. Conversely, the age group of 15 to 17 year olds has the lowest likelihood of being enrolled in a private school, with 501 (98.0% in the age bracket) attending a public institution.
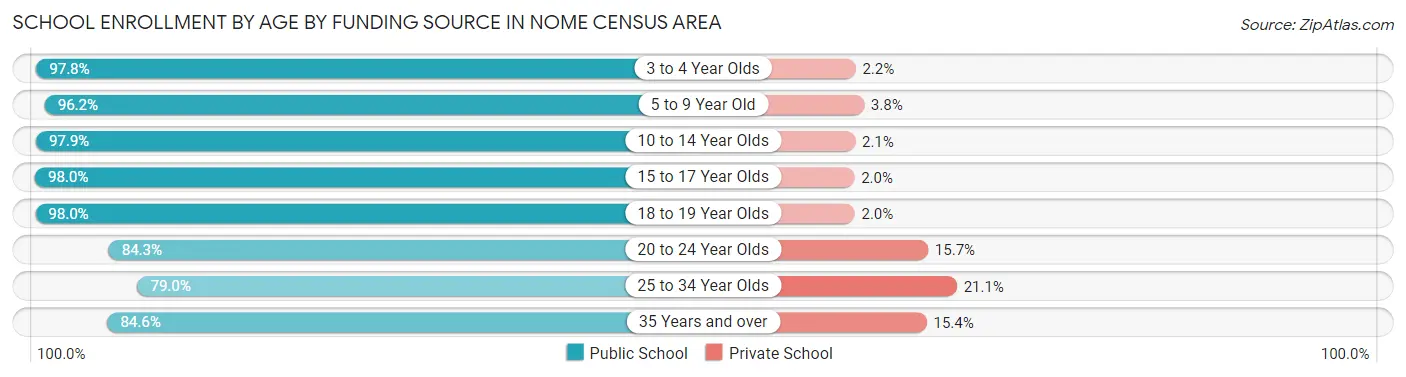
| Age Bracket | Public School | Private School |
| 3 to 4 Year Olds | 178 (97.8%) | 4 (2.2%) |
| 5 to 9 Year Old | 893 (96.2%) | 35 (3.8%) |
| 10 to 14 Year Olds | 1,018 (97.9%) | 22 (2.1%) |
| 15 to 17 Year Olds | 501 (98.0%) | 10 (2.0%) |
| 18 to 19 Year Olds | 97 (98.0%) | 2 (2.0%) |
| 20 to 24 Year Olds | 43 (84.3%) | 8 (15.7%) |
| 25 to 34 Year Olds | 45 (78.9%) | 12 (21.0%) |
| 35 Years and over | 126 (84.6%) | 23 (15.4%) |
| Total | 2,902 (96.2%) | 115 (3.8%) |
Educational Attainment by Field of Study in Nome Census Area
Education (398 | 34.4%), bio, nature & agricultural (105 | 9.1%), liberal arts & history (99 | 8.6%), science & technology (85 | 7.3%), and literature & languages (83 | 7.2%) are the most common fields of study among 1,156 individuals in Nome Census Area who have obtained a bachelor's degree or higher.
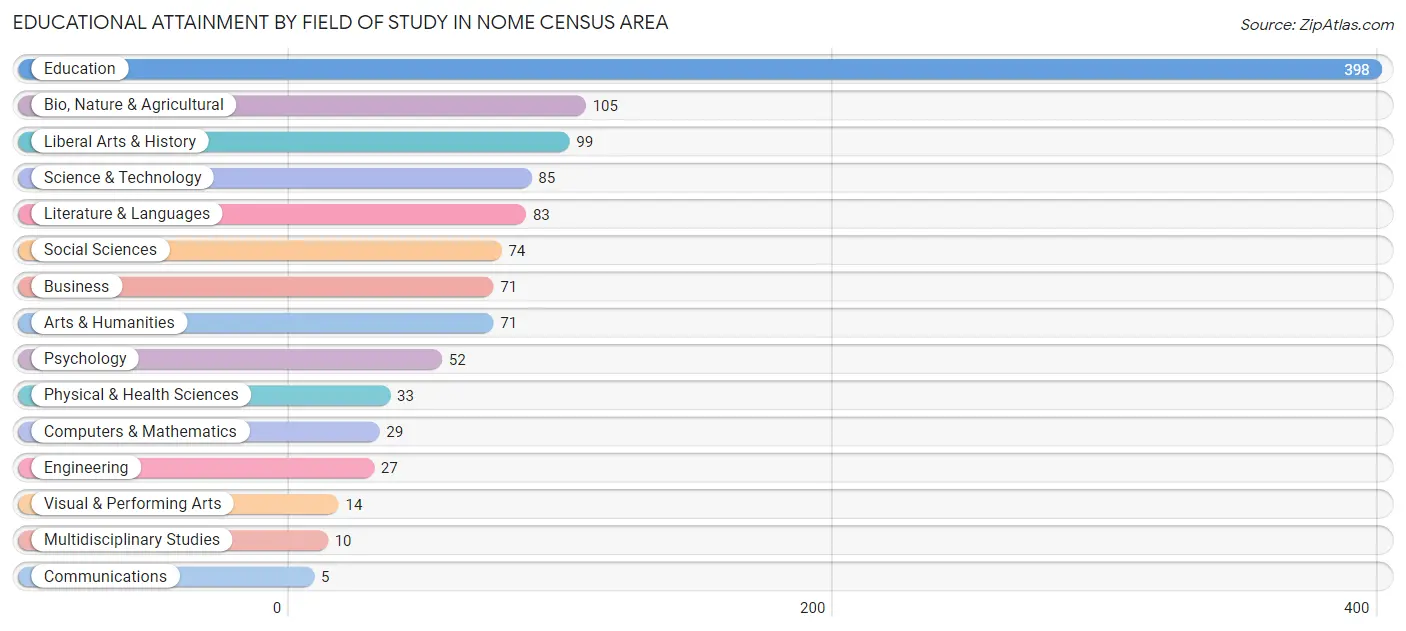
| Field of Study | # Graduates | % Graduates |
| Computers & Mathematics | 29 | 2.5% |
| Bio, Nature & Agricultural | 105 | 9.1% |
| Physical & Health Sciences | 33 | 2.9% |
| Psychology | 52 | 4.5% |
| Social Sciences | 74 | 6.4% |
| Engineering | 27 | 2.3% |
| Multidisciplinary Studies | 10 | 0.9% |
| Science & Technology | 85 | 7.3% |
| Business | 71 | 6.1% |
| Education | 398 | 34.4% |
| Literature & Languages | 83 | 7.2% |
| Liberal Arts & History | 99 | 8.6% |
| Visual & Performing Arts | 14 | 1.2% |
| Communications | 5 | 0.4% |
| Arts & Humanities | 71 | 6.1% |
| Total | 1,156 | 100.0% |
Transportation & Commute in Nome Census Area
Vehicle Availability by Sex in Nome Census Area
The most prevalent vehicle ownership categories in Nome Census Area are males with no vehicle (701, accounting for 45.2%) and females with no vehicle (722, making up 42.6%).
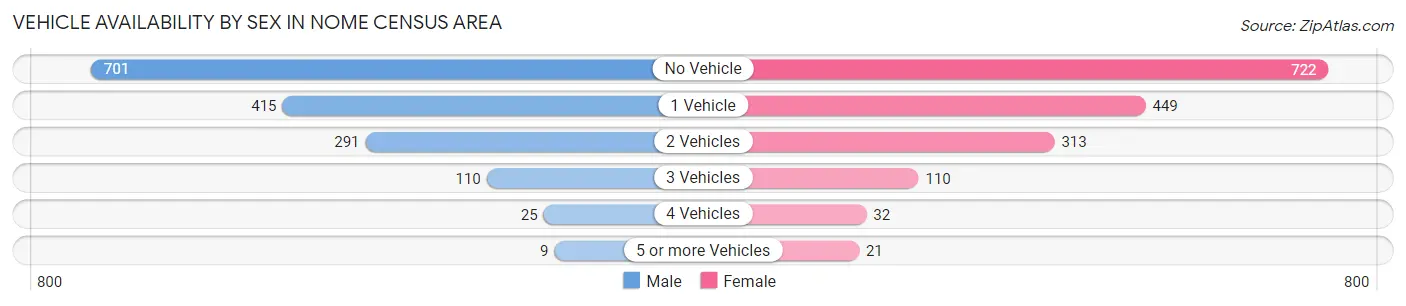
| Vehicles Available | Male | Female |
| No Vehicle | 701 (45.2%) | 722 (43.8%) |
| 1 Vehicle | 415 (26.8%) | 449 (27.3%) |
| 2 Vehicles | 291 (18.8%) | 313 (19.0%) |
| 3 Vehicles | 110 (7.1%) | 110 (6.7%) |
| 4 Vehicles | 25 (1.6%) | 32 (1.9%) |
| 5 or more Vehicles | 9 (0.6%) | 21 (1.3%) |
| Total | 1,551 (100.0%) | 1,647 (100.0%) |
Commute Time in Nome Census Area
The most frequently occuring commute durations in Nome Census Area are less than 5 minutes (1,796 commuters, 51.8%), 5 to 9 minutes (960 commuters, 27.7%), and 10 to 14 minutes (358 commuters, 10.3%).
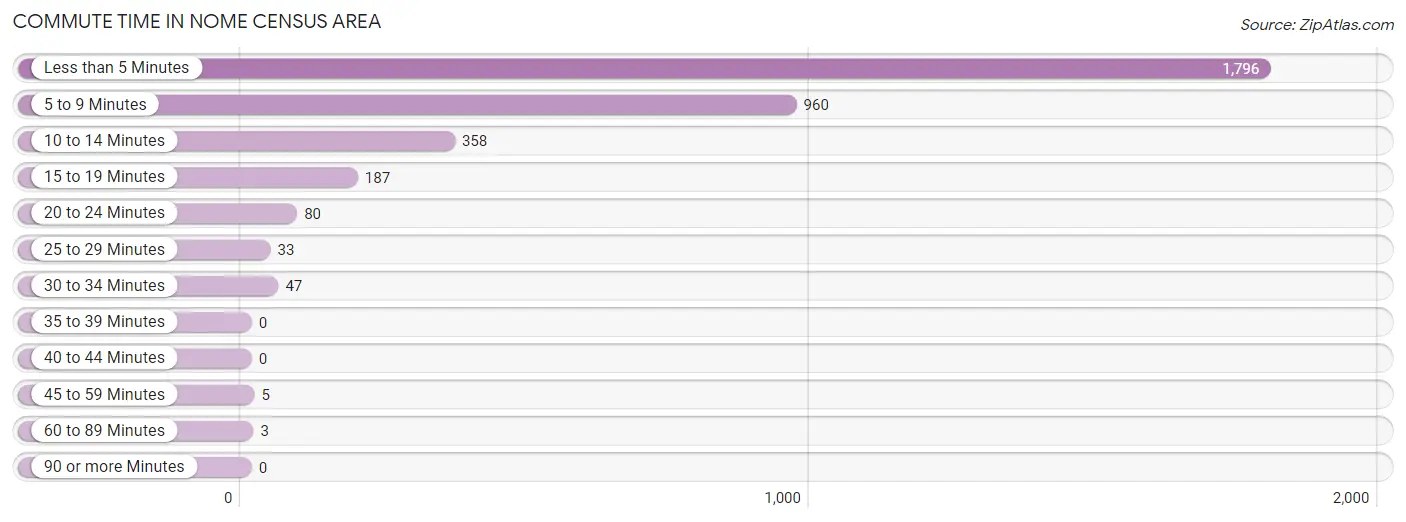
| Commute Time | # Commuters | % Commuters |
| Less than 5 Minutes | 1,796 | 51.8% |
| 5 to 9 Minutes | 960 | 27.7% |
| 10 to 14 Minutes | 358 | 10.3% |
| 15 to 19 Minutes | 187 | 5.4% |
| 20 to 24 Minutes | 80 | 2.3% |
| 25 to 29 Minutes | 33 | 0.9% |
| 30 to 34 Minutes | 47 | 1.3% |
| 35 to 39 Minutes | 0 | 0.0% |
| 40 to 44 Minutes | 0 | 0.0% |
| 45 to 59 Minutes | 5 | 0.1% |
| 60 to 89 Minutes | 3 | 0.1% |
| 90 or more Minutes | 0 | 0.0% |
Commute Time by Sex in Nome Census Area
The most common commute times in Nome Census Area are less than 5 minutes (925 commuters, 52.8%) for males and less than 5 minutes (871 commuters, 50.8%) for females.
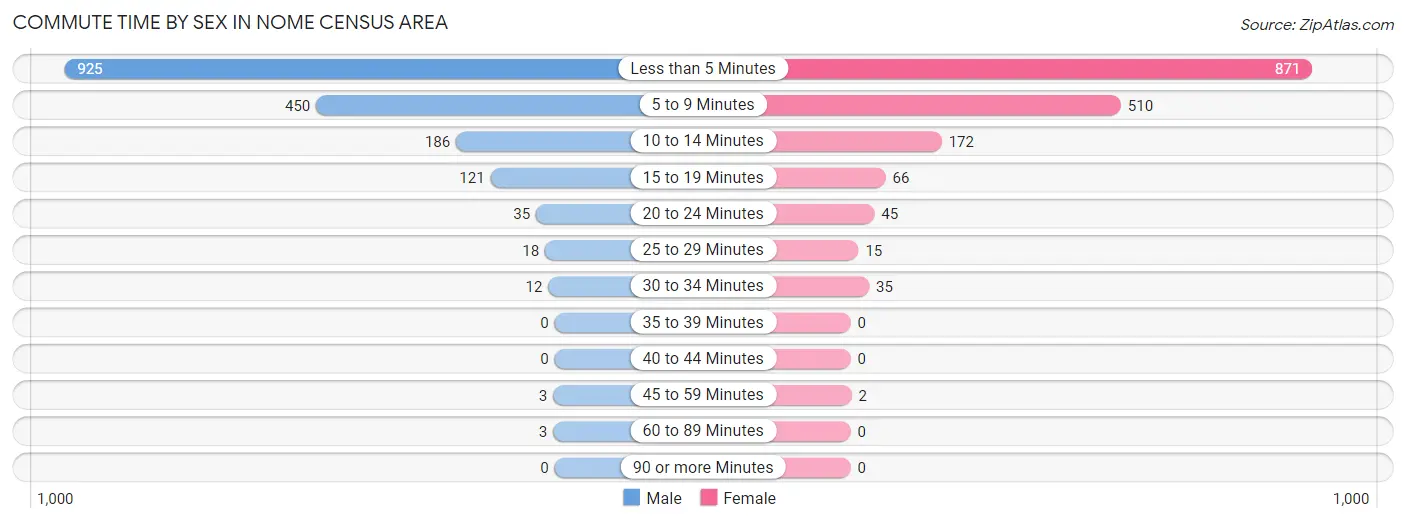
| Commute Time | Male | Female |
| Less than 5 Minutes | 925 (52.8%) | 871 (50.8%) |
| 5 to 9 Minutes | 450 (25.7%) | 510 (29.7%) |
| 10 to 14 Minutes | 186 (10.6%) | 172 (10.0%) |
| 15 to 19 Minutes | 121 (6.9%) | 66 (3.8%) |
| 20 to 24 Minutes | 35 (2.0%) | 45 (2.6%) |
| 25 to 29 Minutes | 18 (1.0%) | 15 (0.9%) |
| 30 to 34 Minutes | 12 (0.7%) | 35 (2.0%) |
| 35 to 39 Minutes | 0 (0.0%) | 0 (0.0%) |
| 40 to 44 Minutes | 0 (0.0%) | 0 (0.0%) |
| 45 to 59 Minutes | 3 (0.2%) | 2 (0.1%) |
| 60 to 89 Minutes | 3 (0.2%) | 0 (0.0%) |
| 90 or more Minutes | 0 (0.0%) | 0 (0.0%) |
Time of Departure to Work by Sex in Nome Census Area
The most frequent times of departure to work in Nome Census Area are 7:30 AM to 7:59 AM (430, 24.5%) for males and 7:30 AM to 7:59 AM (516, 30.1%) for females.
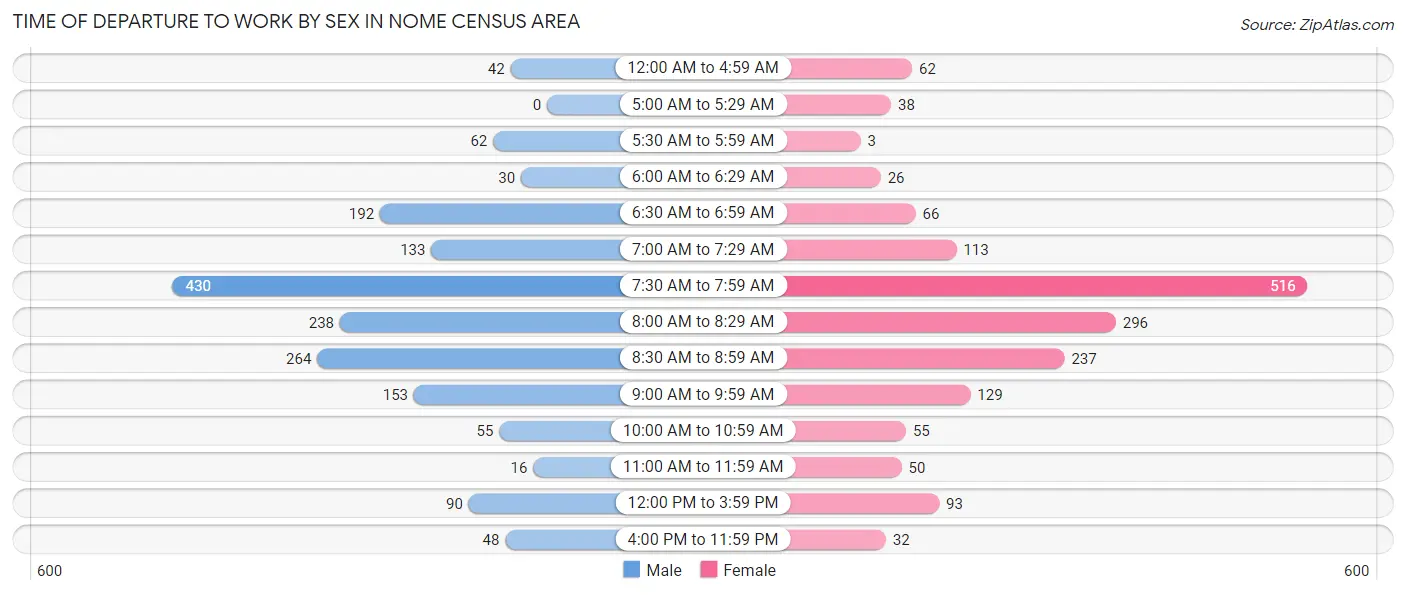
| Time of Departure | Male | Female |
| 12:00 AM to 4:59 AM | 42 (2.4%) | 62 (3.6%) |
| 5:00 AM to 5:29 AM | 0 (0.0%) | 38 (2.2%) |
| 5:30 AM to 5:59 AM | 62 (3.5%) | 3 (0.2%) |
| 6:00 AM to 6:29 AM | 30 (1.7%) | 26 (1.5%) |
| 6:30 AM to 6:59 AM | 192 (11.0%) | 66 (3.8%) |
| 7:00 AM to 7:29 AM | 133 (7.6%) | 113 (6.6%) |
| 7:30 AM to 7:59 AM | 430 (24.5%) | 516 (30.1%) |
| 8:00 AM to 8:29 AM | 238 (13.6%) | 296 (17.2%) |
| 8:30 AM to 8:59 AM | 264 (15.1%) | 237 (13.8%) |
| 9:00 AM to 9:59 AM | 153 (8.7%) | 129 (7.5%) |
| 10:00 AM to 10:59 AM | 55 (3.1%) | 55 (3.2%) |
| 11:00 AM to 11:59 AM | 16 (0.9%) | 50 (2.9%) |
| 12:00 PM to 3:59 PM | 90 (5.1%) | 93 (5.4%) |
| 4:00 PM to 11:59 PM | 48 (2.7%) | 32 (1.9%) |
| Total | 1,753 (100.0%) | 1,716 (100.0%) |
Housing Occupancy in Nome Census Area
Occupancy by Ownership in Nome Census Area
Of the total 2,786 dwellings in Nome Census Area, owner-occupied units account for 1,745 (62.6%), while renter-occupied units make up 1,041 (37.4%).
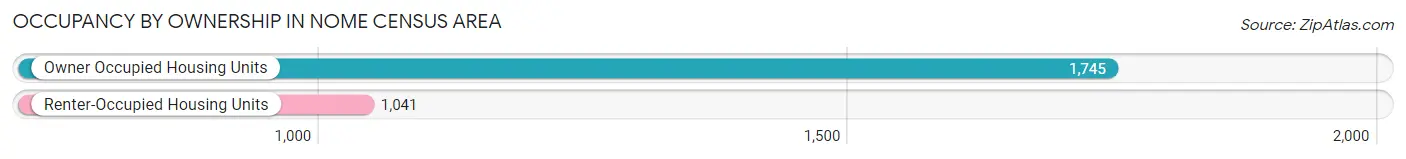
| Occupancy | # Housing Units | % Housing Units |
| Owner Occupied Housing Units | 1,745 | 62.6% |
| Renter-Occupied Housing Units | 1,041 | 37.4% |
| Total Occupied Housing Units | 2,786 | 100.0% |
Occupancy by Household Size in Nome Census Area
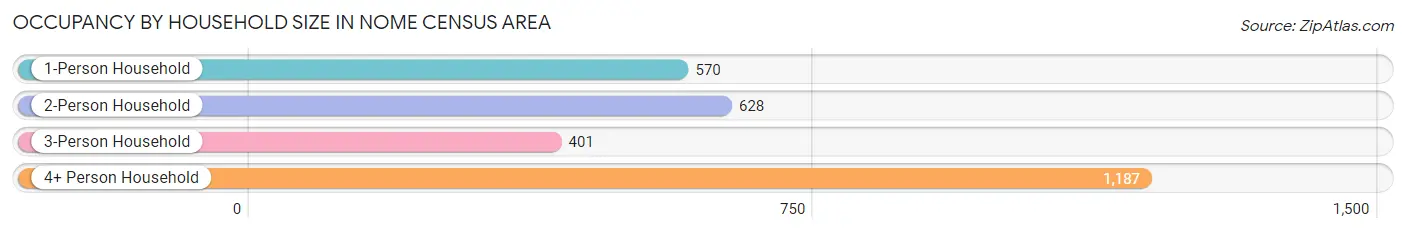
| Household Size | # Housing Units | % Housing Units |
| 1-Person Household | 570 | 20.5% |
| 2-Person Household | 628 | 22.5% |
| 3-Person Household | 401 | 14.4% |
| 4+ Person Household | 1,187 | 42.6% |
| Total Housing Units | 2,786 | 100.0% |
Occupancy by Ownership by Household Size in Nome Census Area
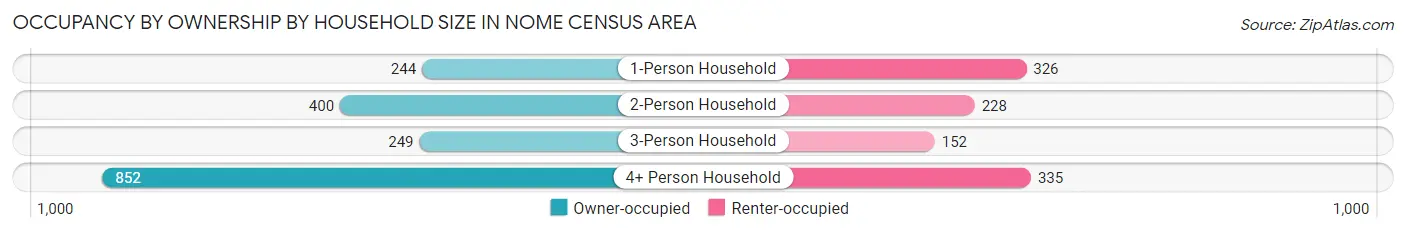
| Household Size | Owner-occupied | Renter-occupied |
| 1-Person Household | 244 (42.8%) | 326 (57.2%) |
| 2-Person Household | 400 (63.7%) | 228 (36.3%) |
| 3-Person Household | 249 (62.1%) | 152 (37.9%) |
| 4+ Person Household | 852 (71.8%) | 335 (28.2%) |
| Total Housing Units | 1,745 (62.6%) | 1,041 (37.4%) |
Occupancy by Educational Attainment in Nome Census Area
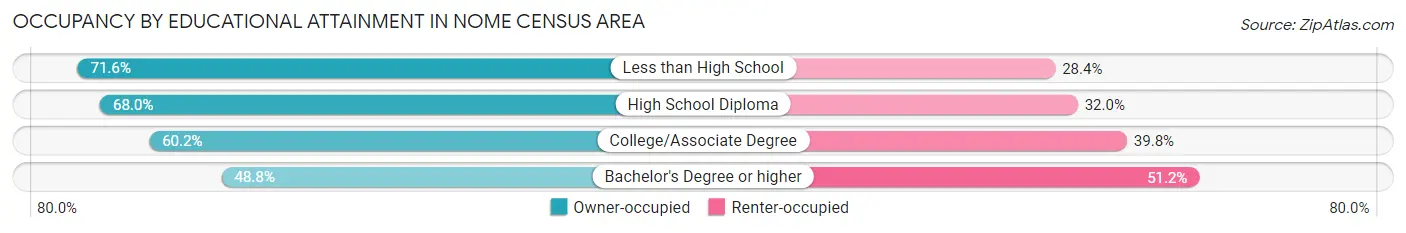
| Household Size | Owner-occupied | Renter-occupied |
| Less than High School | 232 (71.6%) | 92 (28.4%) |
| High School Diploma | 749 (68.0%) | 352 (32.0%) |
| College/Associate Degree | 527 (60.2%) | 348 (39.8%) |
| Bachelor's Degree or higher | 237 (48.8%) | 249 (51.2%) |
Occupancy by Age of Householder in Nome Census Area
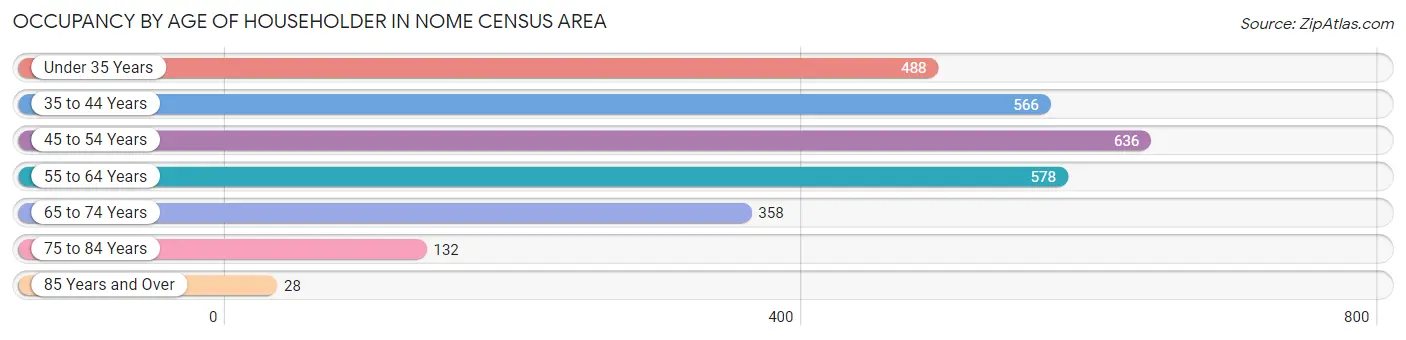
| Age Bracket | # Households | % Households |
| Under 35 Years | 488 | 17.5% |
| 35 to 44 Years | 566 | 20.3% |
| 45 to 54 Years | 636 | 22.8% |
| 55 to 64 Years | 578 | 20.7% |
| 65 to 74 Years | 358 | 12.9% |
| 75 to 84 Years | 132 | 4.7% |
| 85 Years and Over | 28 | 1.0% |
| Total | 2,786 | 100.0% |
Housing Finances in Nome Census Area
Median Income by Occupancy in Nome Census Area
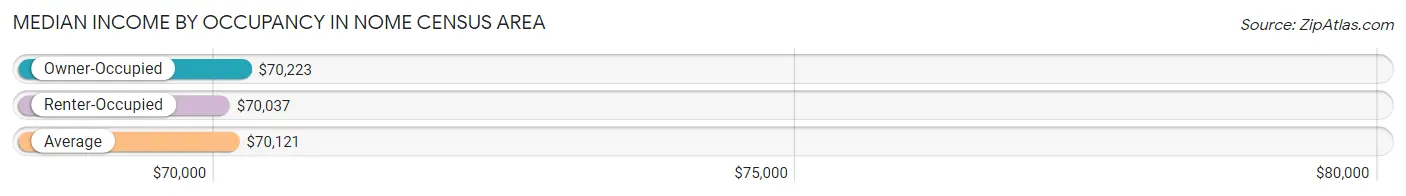
| Occupancy Type | # Households | Median Income |
| Owner-Occupied | 1,745 (62.6%) | $70,223 |
| Renter-Occupied | 1,041 (37.4%) | $70,037 |
| Average | 2,786 (100.0%) | $70,121 |
Occupancy by Householder Income Bracket in Nome Census Area
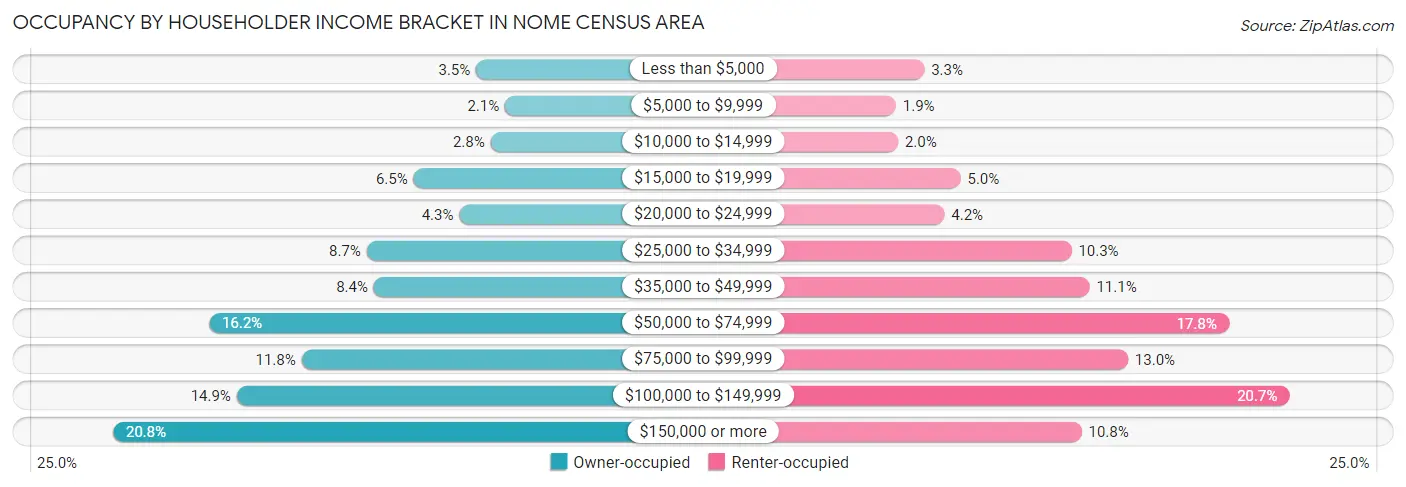
| Income Bracket | Owner-occupied | Renter-occupied |
| Less than $5,000 | 61 (3.5%) | 34 (3.3%) |
| $5,000 to $9,999 | 37 (2.1%) | 20 (1.9%) |
| $10,000 to $14,999 | 49 (2.8%) | 21 (2.0%) |
| $15,000 to $19,999 | 113 (6.5%) | 52 (5.0%) |
| $20,000 to $24,999 | 75 (4.3%) | 44 (4.2%) |
| $25,000 to $34,999 | 152 (8.7%) | 107 (10.3%) |
| $35,000 to $49,999 | 146 (8.4%) | 116 (11.1%) |
| $50,000 to $74,999 | 283 (16.2%) | 185 (17.8%) |
| $75,000 to $99,999 | 206 (11.8%) | 135 (13.0%) |
| $100,000 to $149,999 | 260 (14.9%) | 215 (20.6%) |
| $150,000 or more | 363 (20.8%) | 112 (10.8%) |
| Total | 1,745 (100.0%) | 1,041 (100.0%) |
Monthly Housing Cost Tiers in Nome Census Area
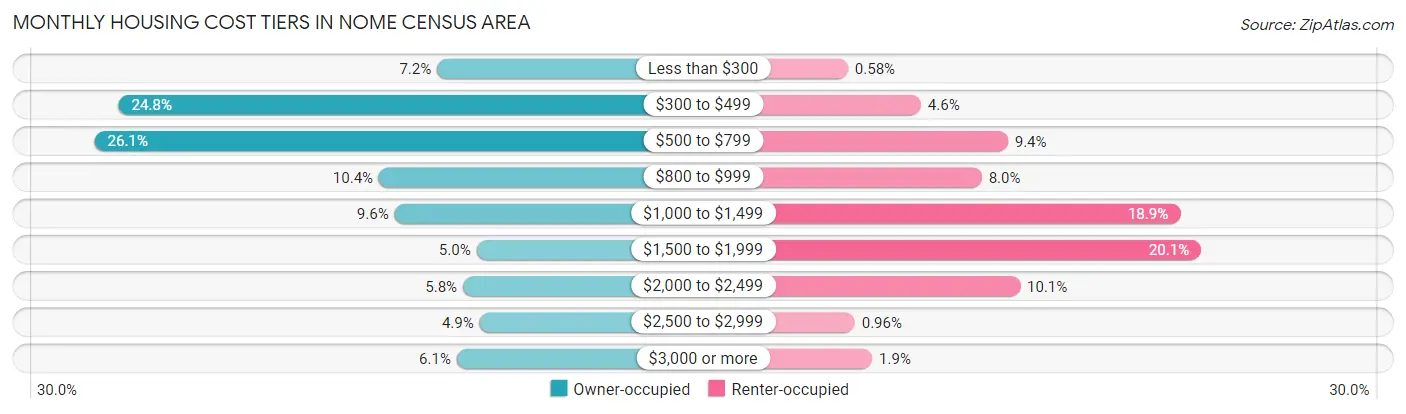
| Monthly Cost | Owner-occupied | Renter-occupied |
| Less than $300 | 126 (7.2%) | 6 (0.6%) |
| $300 to $499 | 433 (24.8%) | 48 (4.6%) |
| $500 to $799 | 456 (26.1%) | 98 (9.4%) |
| $800 to $999 | 182 (10.4%) | 83 (8.0%) |
| $1,000 to $1,499 | 167 (9.6%) | 197 (18.9%) |
| $1,500 to $1,999 | 88 (5.0%) | 209 (20.1%) |
| $2,000 to $2,499 | 101 (5.8%) | 105 (10.1%) |
| $2,500 to $2,999 | 85 (4.9%) | 10 (1.0%) |
| $3,000 or more | 107 (6.1%) | 20 (1.9%) |
| Total | 1,745 (100.0%) | 1,041 (100.0%) |
Physical Housing Characteristics in Nome Census Area
Housing Structures in Nome Census Area
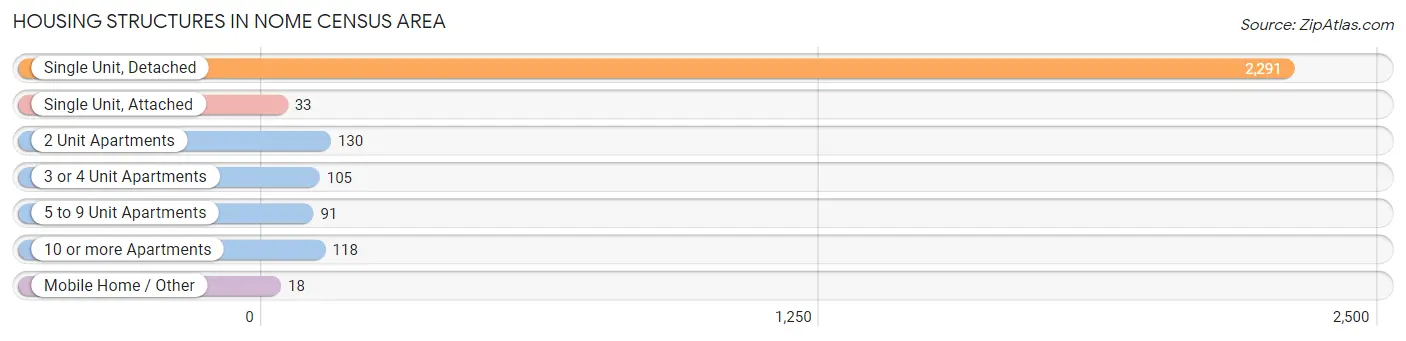
| Structure Type | # Housing Units | % Housing Units |
| Single Unit, Detached | 2,291 | 82.2% |
| Single Unit, Attached | 33 | 1.2% |
| 2 Unit Apartments | 130 | 4.7% |
| 3 or 4 Unit Apartments | 105 | 3.8% |
| 5 to 9 Unit Apartments | 91 | 3.3% |
| 10 or more Apartments | 118 | 4.2% |
| Mobile Home / Other | 18 | 0.6% |
| Total | 2,786 | 100.0% |
Housing Structures by Occupancy in Nome Census Area
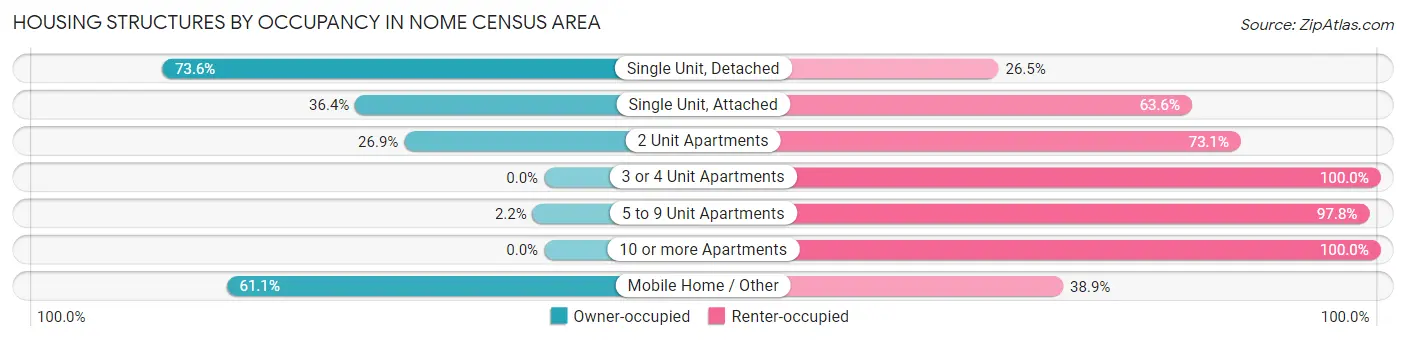
| Structure Type | Owner-occupied | Renter-occupied |
| Single Unit, Detached | 1,685 (73.6%) | 606 (26.5%) |
| Single Unit, Attached | 12 (36.4%) | 21 (63.6%) |
| 2 Unit Apartments | 35 (26.9%) | 95 (73.1%) |
| 3 or 4 Unit Apartments | 0 (0.0%) | 105 (100.0%) |
| 5 to 9 Unit Apartments | 2 (2.2%) | 89 (97.8%) |
| 10 or more Apartments | 0 (0.0%) | 118 (100.0%) |
| Mobile Home / Other | 11 (61.1%) | 7 (38.9%) |
| Total | 1,745 (62.6%) | 1,041 (37.4%) |
Housing Structures by Number of Rooms in Nome Census Area
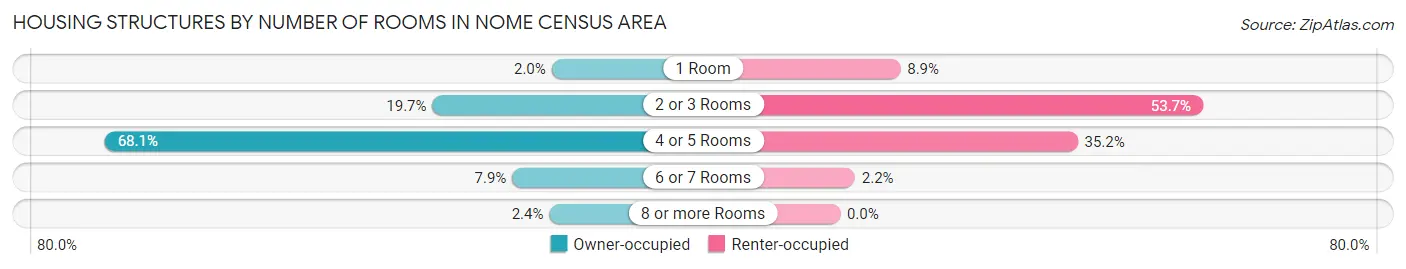
| Number of Rooms | Owner-occupied | Renter-occupied |
| 1 Room | 35 (2.0%) | 93 (8.9%) |
| 2 or 3 Rooms | 343 (19.7%) | 559 (53.7%) |
| 4 or 5 Rooms | 1,189 (68.1%) | 366 (35.2%) |
| 6 or 7 Rooms | 137 (7.9%) | 23 (2.2%) |
| 8 or more Rooms | 41 (2.4%) | 0 (0.0%) |
| Total | 1,745 (100.0%) | 1,041 (100.0%) |
Housing Structure by Heating Type in Nome Census Area
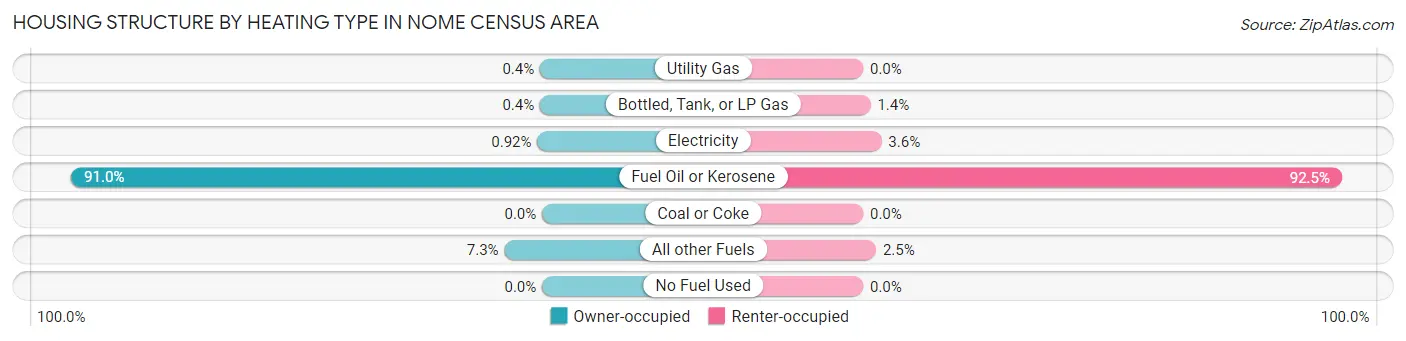
| Heating Type | Owner-occupied | Renter-occupied |
| Utility Gas | 7 (0.4%) | 0 (0.0%) |
| Bottled, Tank, or LP Gas | 7 (0.4%) | 15 (1.4%) |
| Electricity | 16 (0.9%) | 37 (3.5%) |
| Fuel Oil or Kerosene | 1,588 (91.0%) | 963 (92.5%) |
| Coal or Coke | 0 (0.0%) | 0 (0.0%) |
| All other Fuels | 127 (7.3%) | 26 (2.5%) |
| No Fuel Used | 0 (0.0%) | 0 (0.0%) |
| Total | 1,745 (100.0%) | 1,041 (100.0%) |
Household Vehicle Usage in Nome Census Area
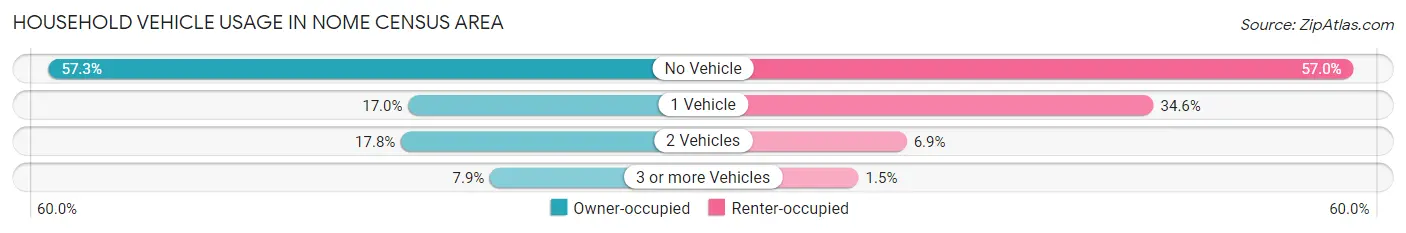
| Vehicles per Household | Owner-occupied | Renter-occupied |
| No Vehicle | 1,000 (57.3%) | 593 (57.0%) |
| 1 Vehicle | 297 (17.0%) | 360 (34.6%) |
| 2 Vehicles | 311 (17.8%) | 72 (6.9%) |
| 3 or more Vehicles | 137 (7.9%) | 16 (1.5%) |
| Total | 1,745 (100.0%) | 1,041 (100.0%) |
Real Estate & Mortgages in Nome Census Area
Real Estate and Mortgage Overview in Nome Census Area
| Characteristic | Without Mortgage | With Mortgage |
| Housing Units | 1,071 | 674 |
| Median Property Value | $108,100 | $281,500 |
| Median Household Income | $53,618 | $235 |
| Monthly Housing Costs | $509 | $107 |
| Real Estate Taxes | $2,400 | $316 |
Property Value by Mortgage Status in Nome Census Area
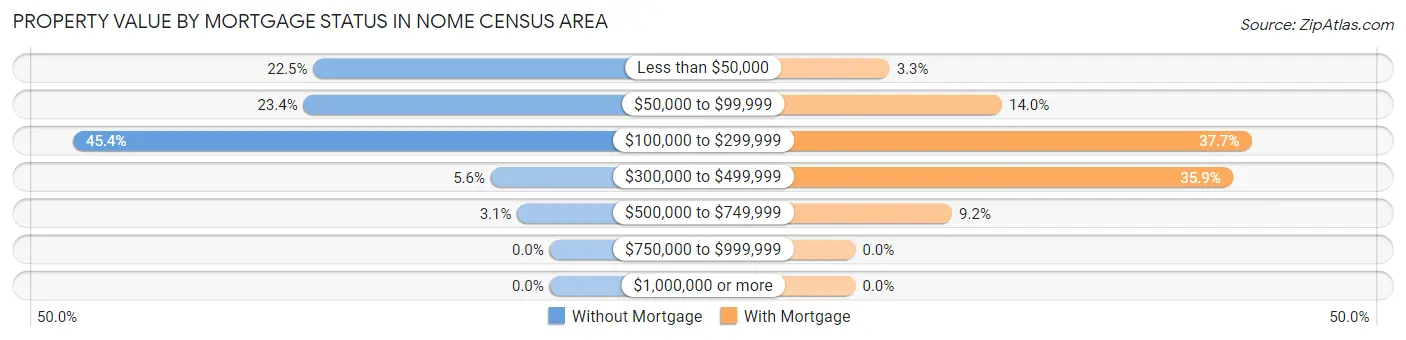
| Property Value | Without Mortgage | With Mortgage |
| Less than $50,000 | 241 (22.5%) | 22 (3.3%) |
| $50,000 to $99,999 | 251 (23.4%) | 94 (14.0%) |
| $100,000 to $299,999 | 486 (45.4%) | 254 (37.7%) |
| $300,000 to $499,999 | 60 (5.6%) | 242 (35.9%) |
| $500,000 to $749,999 | 33 (3.1%) | 62 (9.2%) |
| $750,000 to $999,999 | 0 (0.0%) | 0 (0.0%) |
| $1,000,000 or more | 0 (0.0%) | 0 (0.0%) |
| Total | 1,071 (100.0%) | 674 (100.0%) |
Household Income by Mortgage Status in Nome Census Area
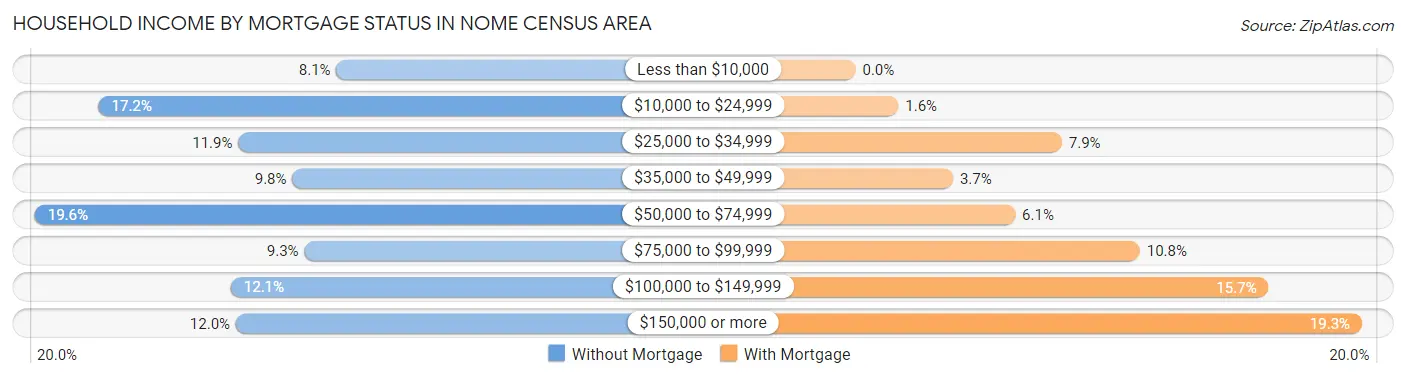
| Household Income | Without Mortgage | With Mortgage |
| Less than $10,000 | 87 (8.1%) | 0 (0.0%) |
| $10,000 to $24,999 | 184 (17.2%) | 11 (1.6%) |
| $25,000 to $34,999 | 127 (11.9%) | 53 (7.9%) |
| $35,000 to $49,999 | 105 (9.8%) | 25 (3.7%) |
| $50,000 to $74,999 | 210 (19.6%) | 41 (6.1%) |
| $75,000 to $99,999 | 100 (9.3%) | 73 (10.8%) |
| $100,000 to $149,999 | 130 (12.1%) | 106 (15.7%) |
| $150,000 or more | 128 (11.9%) | 130 (19.3%) |
| Total | 1,071 (100.0%) | 674 (100.0%) |
Property Value to Household Income Ratio in Nome Census Area
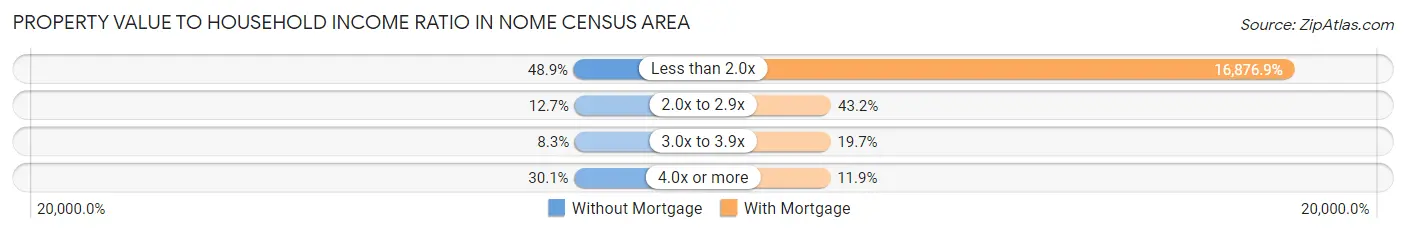
| Value-to-Income Ratio | Without Mortgage | With Mortgage |
| Less than 2.0x | 524 (48.9%) | 113,750 (16,876.8%) |
| 2.0x to 2.9x | 136 (12.7%) | 291 (43.2%) |
| 3.0x to 3.9x | 89 (8.3%) | 133 (19.7%) |
| 4.0x or more | 322 (30.1%) | 80 (11.9%) |
| Total | 1,071 (100.0%) | 674 (100.0%) |
Real Estate Taxes by Mortgage Status in Nome Census Area
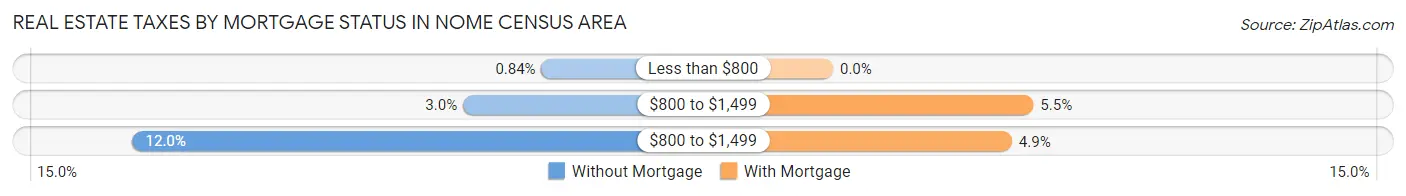
| Property Taxes | Without Mortgage | With Mortgage |
| Less than $800 | 9 (0.8%) | 0 (0.0%) |
| $800 to $1,499 | 32 (3.0%) | 37 (5.5%) |
| $800 to $1,499 | 129 (12.0%) | 33 (4.9%) |
| Total | 1,071 (100.0%) | 674 (100.0%) |
Health & Disability in Nome Census Area
Health Insurance Coverage by Age in Nome Census Area
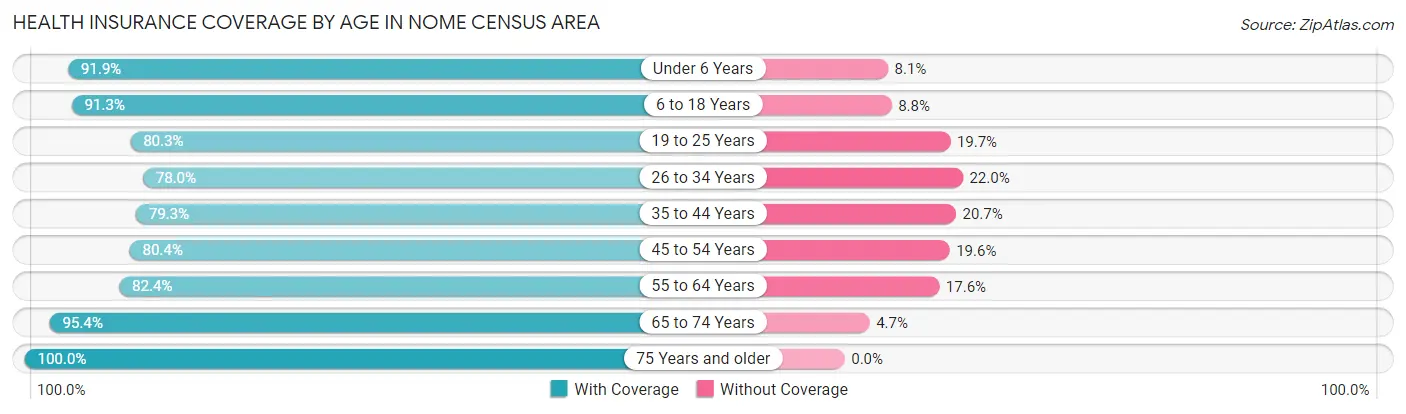
| Age Bracket | With Coverage | Without Coverage |
| Under 6 Years | 967 (91.9%) | 85 (8.1%) |
| 6 to 18 Years | 2,264 (91.2%) | 217 (8.7%) |
| 19 to 25 Years | 791 (80.3%) | 194 (19.7%) |
| 26 to 34 Years | 994 (78.0%) | 281 (22.0%) |
| 35 to 44 Years | 948 (79.3%) | 248 (20.7%) |
| 45 to 54 Years | 851 (80.4%) | 207 (19.6%) |
| 55 to 64 Years | 864 (82.4%) | 185 (17.6%) |
| 65 to 74 Years | 492 (95.4%) | 24 (4.6%) |
| 75 Years and older | 205 (100.0%) | 0 (0.0%) |
| Total | 8,376 (85.3%) | 1,441 (14.7%) |
Health Insurance Coverage by Citizenship Status in Nome Census Area
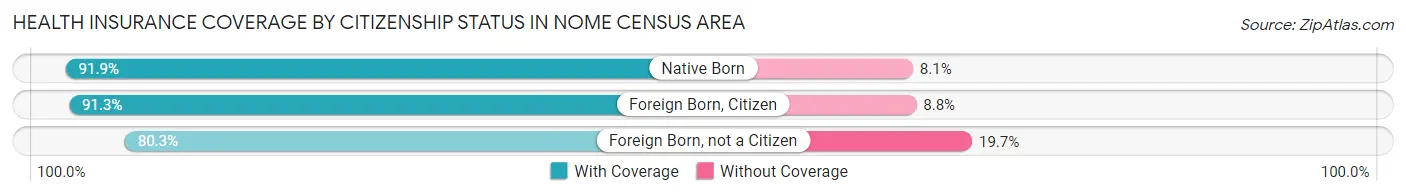
| Citizenship Status | With Coverage | Without Coverage |
| Native Born | 967 (91.9%) | 85 (8.1%) |
| Foreign Born, Citizen | 2,264 (91.2%) | 217 (8.7%) |
| Foreign Born, not a Citizen | 791 (80.3%) | 194 (19.7%) |
Health Insurance Coverage by Household Income in Nome Census Area
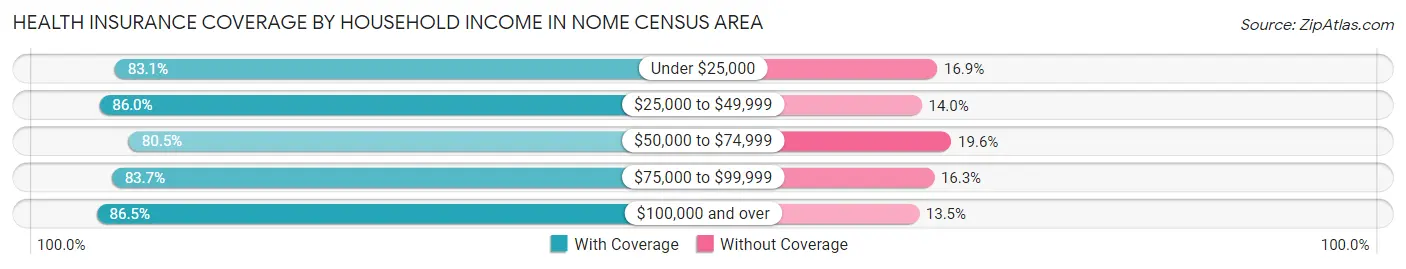
| Household Income | With Coverage | Without Coverage |
| Under $25,000 | 904 (83.1%) | 184 (16.9%) |
| $25,000 to $49,999 | 1,357 (86.0%) | 221 (14.0%) |
| $50,000 to $74,999 | 1,300 (80.4%) | 316 (19.6%) |
| $75,000 to $99,999 | 1,112 (83.7%) | 217 (16.3%) |
| $100,000 and over | 3,223 (86.5%) | 503 (13.5%) |
Public vs Private Health Insurance Coverage by Age in Nome Census Area
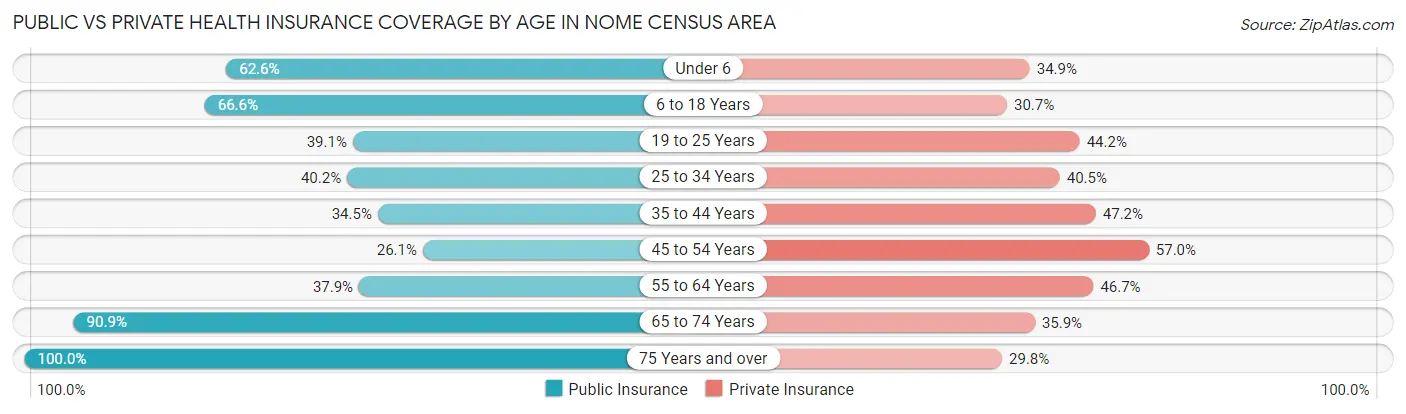
| Age Bracket | Public Insurance | Private Insurance |
| Under 6 | 658 (62.5%) | 367 (34.9%) |
| 6 to 18 Years | 1,651 (66.5%) | 761 (30.7%) |
| 19 to 25 Years | 385 (39.1%) | 435 (44.2%) |
| 25 to 34 Years | 512 (40.2%) | 516 (40.5%) |
| 35 to 44 Years | 412 (34.4%) | 564 (47.2%) |
| 45 to 54 Years | 276 (26.1%) | 603 (57.0%) |
| 55 to 64 Years | 398 (37.9%) | 490 (46.7%) |
| 65 to 74 Years | 469 (90.9%) | 185 (35.8%) |
| 75 Years and over | 205 (100.0%) | 61 (29.8%) |
| Total | 4,966 (50.6%) | 3,982 (40.6%) |
Disability Status by Sex by Age in Nome Census Area
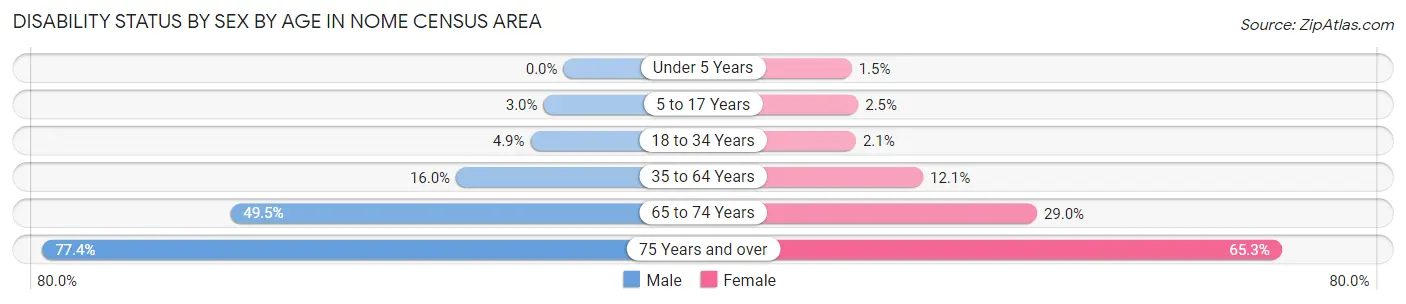
| Age Bracket | Male | Female |
| Under 5 Years | 0 (0.0%) | 7 (1.5%) |
| 5 to 17 Years | 38 (3.0%) | 30 (2.5%) |
| 18 to 34 Years | 59 (4.9%) | 25 (2.1%) |
| 35 to 64 Years | 285 (16.0%) | 183 (12.1%) |
| 65 to 74 Years | 134 (49.4%) | 71 (29.0%) |
| 75 Years and over | 65 (77.4%) | 79 (65.3%) |
Disability Class by Sex by Age in Nome Census Area
Disability Class: Hearing Difficulty
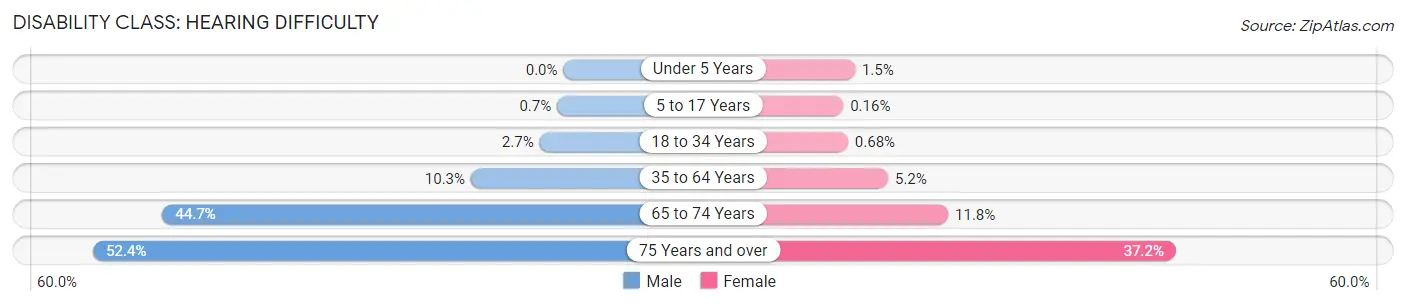
| Age Bracket | Male | Female |
| Under 5 Years | 0 (0.0%) | 7 (1.5%) |
| 5 to 17 Years | 9 (0.7%) | 2 (0.2%) |
| 18 to 34 Years | 32 (2.7%) | 8 (0.7%) |
| 35 to 64 Years | 184 (10.3%) | 78 (5.1%) |
| 65 to 74 Years | 121 (44.7%) | 29 (11.8%) |
| 75 Years and over | 44 (52.4%) | 45 (37.2%) |
Disability Class: Vision Difficulty
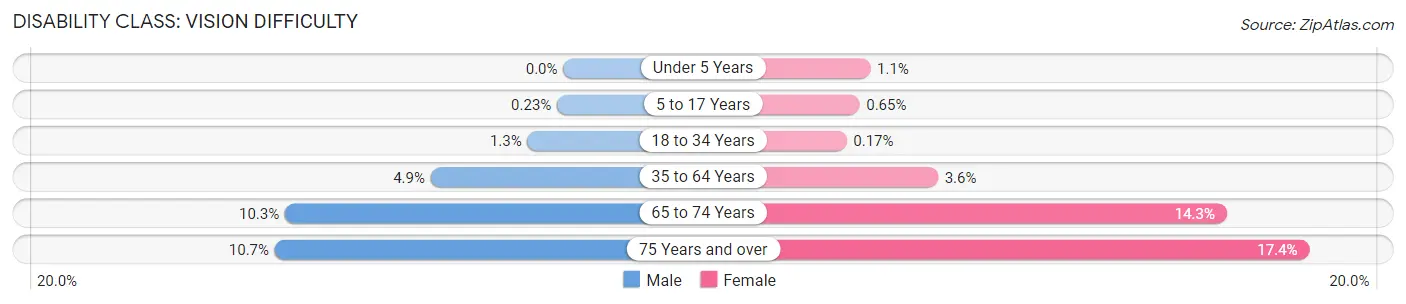
| Age Bracket | Male | Female |
| Under 5 Years | 0 (0.0%) | 5 (1.1%) |
| 5 to 17 Years | 3 (0.2%) | 8 (0.6%) |
| 18 to 34 Years | 16 (1.3%) | 2 (0.2%) |
| 35 to 64 Years | 88 (4.9%) | 54 (3.6%) |
| 65 to 74 Years | 28 (10.3%) | 35 (14.3%) |
| 75 Years and over | 9 (10.7%) | 21 (17.4%) |
Disability Class: Cognitive Difficulty
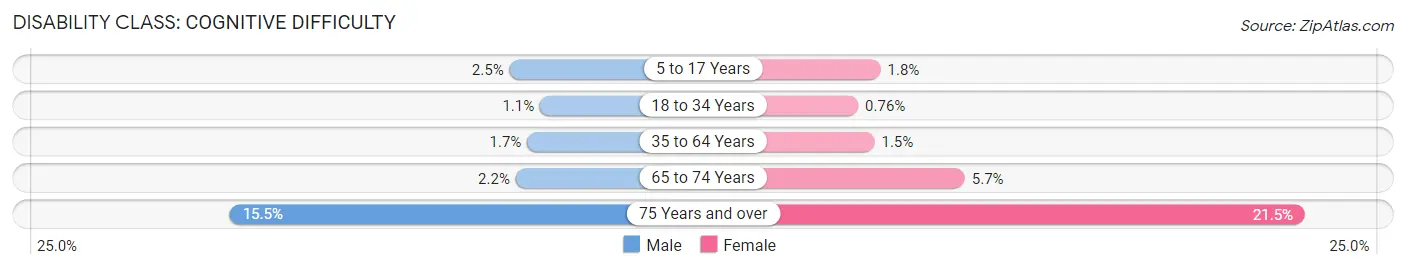
| Age Bracket | Male | Female |
| 5 to 17 Years | 32 (2.5%) | 22 (1.8%) |
| 18 to 34 Years | 13 (1.1%) | 9 (0.8%) |
| 35 to 64 Years | 30 (1.7%) | 23 (1.5%) |
| 65 to 74 Years | 6 (2.2%) | 14 (5.7%) |
| 75 Years and over | 13 (15.5%) | 26 (21.5%) |
Disability Class: Ambulatory Difficulty
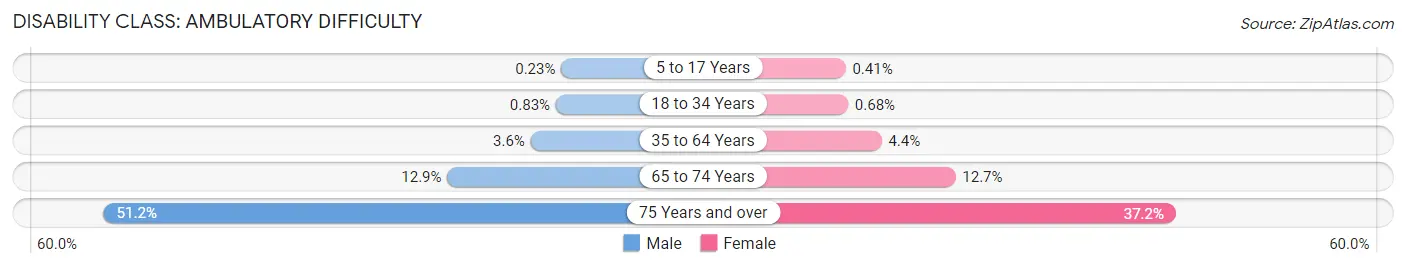
| Age Bracket | Male | Female |
| 5 to 17 Years | 3 (0.2%) | 5 (0.4%) |
| 18 to 34 Years | 10 (0.8%) | 8 (0.7%) |
| 35 to 64 Years | 65 (3.6%) | 67 (4.4%) |
| 65 to 74 Years | 35 (12.9%) | 31 (12.7%) |
| 75 Years and over | 43 (51.2%) | 45 (37.2%) |
Disability Class: Self-Care Difficulty
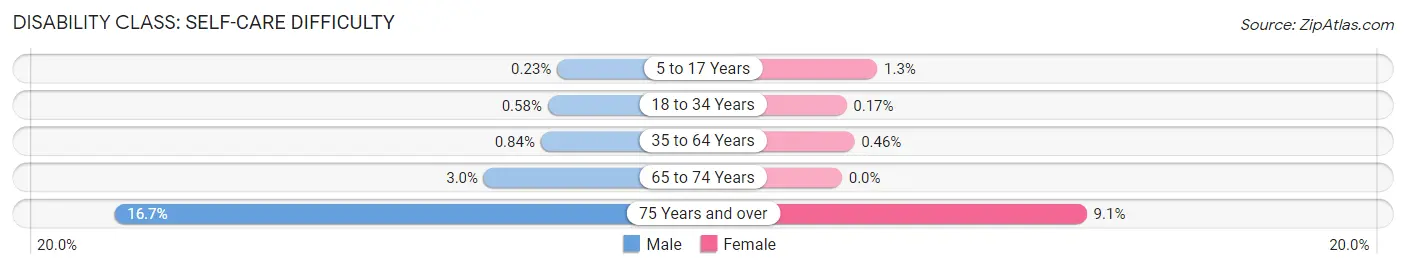
| Age Bracket | Male | Female |
| 5 to 17 Years | 3 (0.2%) | 16 (1.3%) |
| 18 to 34 Years | 7 (0.6%) | 2 (0.2%) |
| 35 to 64 Years | 15 (0.8%) | 7 (0.5%) |
| 65 to 74 Years | 8 (2.9%) | 0 (0.0%) |
| 75 Years and over | 14 (16.7%) | 11 (9.1%) |
Technology Access in Nome Census Area
Computing Device Access in Nome Census Area
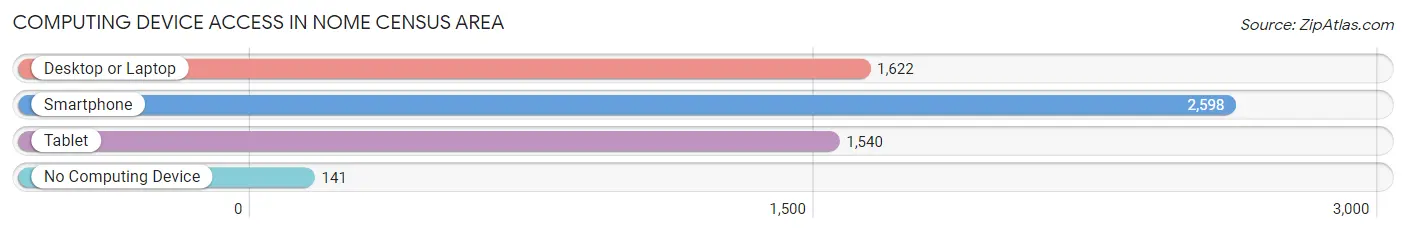
| Device Type | # Households | % Households |
| Desktop or Laptop | 1,622 | 58.2% |
| Smartphone | 2,598 | 93.2% |
| Tablet | 1,540 | 55.3% |
| No Computing Device | 141 | 5.1% |
| Total | 2,786 | 100.0% |
Internet Access in Nome Census Area
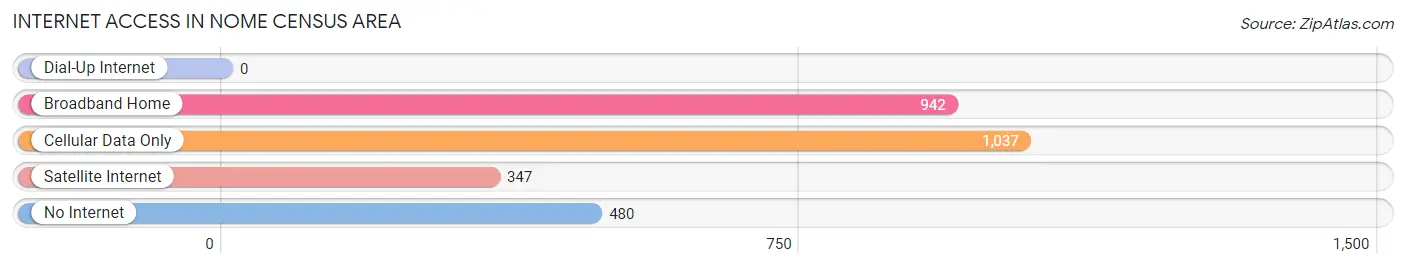
| Internet Type | # Households | % Households |
| Dial-Up Internet | 0 | 0.0% |
| Broadband Home | 942 | 33.8% |
| Cellular Data Only | 1,037 | 37.2% |
| Satellite Internet | 347 | 12.5% |
| No Internet | 480 | 17.2% |
| Total | 2,786 | 100.0% |
Nome Census Area Summary
Nome Census Area is a census area located in the U.S. state of Alaska. It is located in the western part of the state, and is bordered by the Bering Sea to the north, the Yukon-Kuskokwim Delta to the east, the Seward Peninsula to the south, and the Norton Sound to the west. The area covers an area of 25,000 square miles, making it the largest census area in the state. As of the 2010 census, the population was 9,492, making it the fourth least populous county in Alaska.
Geography
Nome Census Area is located in the western part of Alaska, and is bordered by the Bering Sea to the north, the Yukon-Kuskokwim Delta to the east, the Seward Peninsula to the south, and the Norton Sound to the west. The area covers an area of 25,000 square miles, making it the largest census area in the state. The terrain is mostly flat, with some rolling hills and mountains in the northern and eastern parts of the area. The climate is generally cold and dry, with temperatures ranging from -20 to 70 degrees Fahrenheit.
History
The area that is now Nome Census Area was first inhabited by the Inupiat people, who have lived in the region for thousands of years. The area was first explored by Europeans in the late 18th century, and was later claimed by the United States in 1867 as part of the Alaska Purchase. The area was initially part of the Seward Peninsula, but was later split off to form its own census area in 1910.
Economy
The economy of Nome Census Area is largely based on fishing, hunting, and trapping. The area is home to a large commercial fishing industry, with salmon, halibut, and crab being the main catches. The area is also home to a large number of subsistence hunters and trappers, who rely on the area's abundant wildlife for sustenance. Tourism is also an important part of the economy, with visitors coming to the area to take advantage of its natural beauty and outdoor activities.
Demographics
As of the 2010 census, the population of Nome Census Area was 9,492, making it the fourth least populous county in Alaska. The population is largely Native American, with the majority being Inupiat. The median household income is $50,813, and the median age is 33. The area has a high rate of poverty, with 24.3% of the population living below the poverty line.
Nome Census Area is a unique and diverse area of Alaska, with a rich history, culture, and economy. The area is home to a large number of Native Americans, and is an important part of the state's economy. The area is also home to a large number of subsistence hunters and trappers, and is a popular destination for tourists looking to take advantage of its natural beauty and outdoor activities.
Common Questions
What is the Total Population of Nome Census Area?
Total Population of Nome Census Area is 10,018.
What is the Total Male Population of Nome Census Area?
Total Male Population of Nome Census Area is 5,237.
What is the Total Female Population of Nome Census Area?
Total Female Population of Nome Census Area is 4,781.
What is the Ratio of Males per 100 Females in Nome Census Area?
There are 109.54 Males per 100 Females in Nome Census Area.
What is the Ratio of Females per 100 Males in Nome Census Area?
There are 91.29 Females per 100 Males in Nome Census Area.
What is the Median Population Age in Nome Census Area?
Median Population Age in Nome Census Area is 29.1 Years.
What is the Average Family Size in Nome Census Area
Average Family Size in Nome Census Area is 3.8 People.
What is the Average Household Size in Nome Census Area
Average Household Size in Nome Census Area is 3.4 People.
What is Per Capita Income in Nome Census Area?
Per Capita income in Nome Census Area is $28,678.
What is the Median Family Income in Nome Census Area?
Median Family Income in Nome Census Area is $70,588.
What is the Median Household income in Nome Census Area?
Median Household Income in Nome Census Area is $70,121.
What is Income or Wage Gap in Nome Census Area?
Income or Wage Gap in Nome Census Area is 14.4%.
Women in Nome Census Area earn 85.6 cents for every dollar earned by a man.
What is Family Income Deficit in Nome Census Area?
Family Income Deficit in Nome Census Area is $11,568.
Families that are below poverty line in Nome Census Area earn $11,568 less on average than the poverty threshold level.
What is Inequality or Gini Index in Nome Census Area?
Inequality or Gini Index in Nome Census Area is 0.44.
How Large is the Labor Force in Nome Census Area?
There are 4,560 People in the Labor Forcein in Nome Census Area.
What is the Percentage of People in the Labor Force in Nome Census Area?
65.6% of People are in the Labor Force in Nome Census Area.
What is the Unemployment Rate in Nome Census Area?
Unemployment Rate in Nome Census Area is 16.5%.