Matanuska-Susitna Borough, AK
Matanuska-Susitna Borough Map
Matanuska-Susitna Borough Overview
108,661
TOTAL POPULATION
56,811
MALE POPULATION
51,850
FEMALE POPULATION
109.57
MALES / 100 FEMALES
91.27
FEMALES / 100 MALES
36.3
MEDIAN AGE
3.2
AVG FAMILY SIZE
2.7
AVG HOUSEHOLD SIZE
$39,201
PER CAPITA INCOME
$100,753
AVG FAMILY INCOME
$86,435
AVG HOUSEHOLD INCOME
32.8%
WAGE / INCOME GAP [ % ]
67.2¢/ $1
WAGE / INCOME GAP [ $ ]
$11,572
FAMILY INCOME DEFICIT
0.42
INEQUALITY / GINI INDEX
50,375
LABOR FORCE [ PEOPLE ]
60.3%
PERCENT IN LABOR FORCE
7.0%
UNEMPLOYMENT RATE
Matanuska-Susitna Borough Area Codes
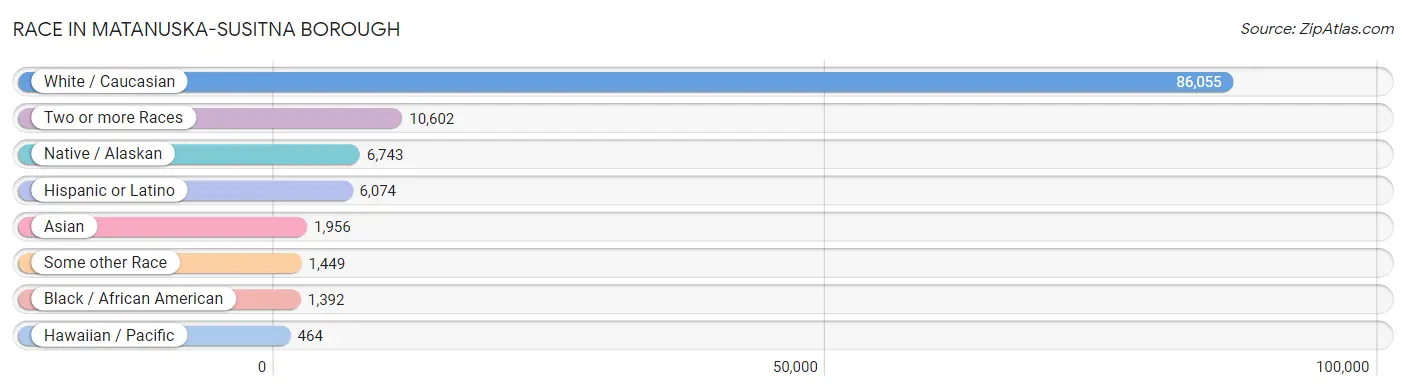
Race in Matanuska-Susitna Borough
The most populous races in Matanuska-Susitna Borough are White / Caucasian (86,055 | 79.2%), Two or more Races (10,602 | 9.8%), and Native / Alaskan (6,743 | 6.2%).
| Race | # Population | % Population |
| Asian | 1,956 | 1.8% |
| Black / African American | 1,392 | 1.3% |
| Hawaiian / Pacific | 464 | 0.4% |
| Hispanic or Latino | 6,074 | 5.6% |
| Native / Alaskan | 6,743 | 6.2% |
| White / Caucasian | 86,055 | 79.2% |
| Two or more Races | 10,602 | 9.8% |
| Some other Race | 1,449 | 1.3% |
| Total | 108,661 | 100.0% |
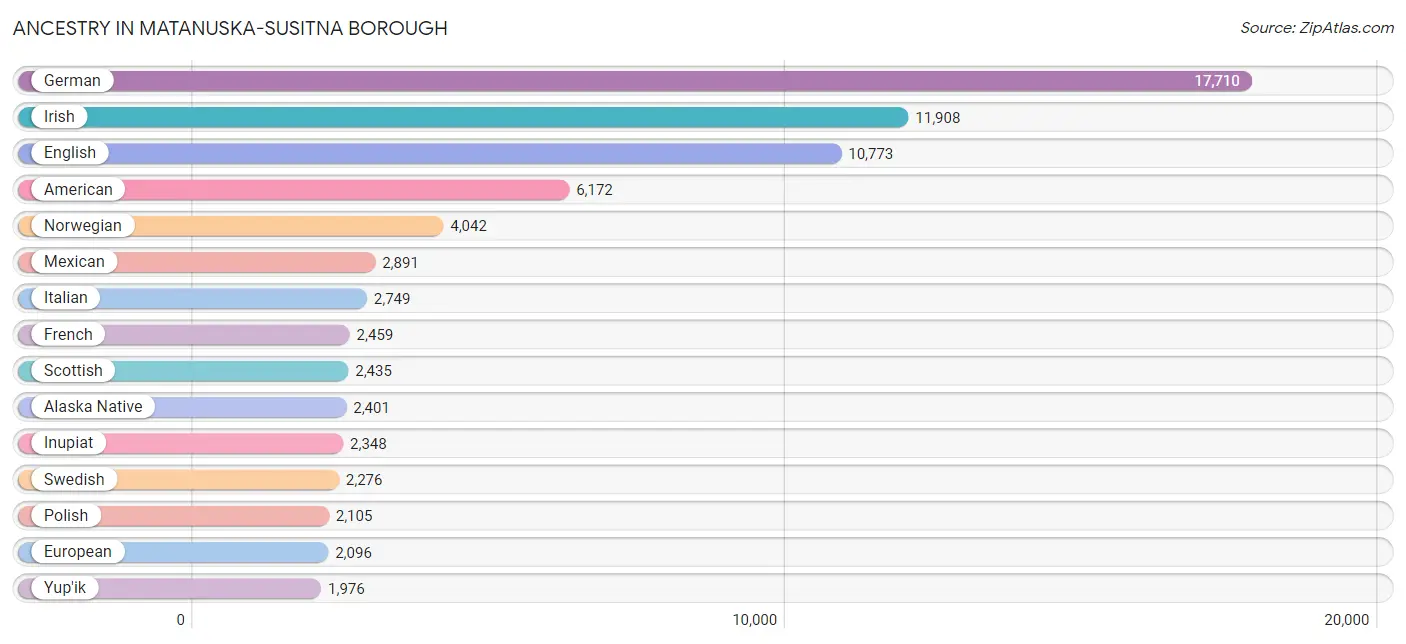
Ancestry in Matanuska-Susitna Borough
The most populous ancestries reported in Matanuska-Susitna Borough are German (17,710 | 16.3%), Irish (11,908 | 11.0%), English (10,773 | 9.9%), American (6,172 | 5.7%), and Norwegian (4,042 | 3.7%), together accounting for 46.6% of all Matanuska-Susitna Borough residents.
| Ancestry | # Population | % Population |
| African | 161 | 0.2% |
| Alaska Native | 2,401 | 2.2% |
| Alaskan Athabascan | 1,807 | 1.7% |
| Albanian | 10 | 0.0% |
| Aleut | 1,493 | 1.4% |
| American | 6,172 | 5.7% |
| Apache | 110 | 0.1% |
| Arab | 148 | 0.1% |
| Argentinean | 21 | 0.0% |
| Armenian | 18 | 0.0% |
| Australian | 42 | 0.0% |
| Austrian | 161 | 0.2% |
| Bangladeshi | 419 | 0.4% |
| Basque | 17 | 0.0% |
| Belgian | 25 | 0.0% |
| Bhutanese | 379 | 0.4% |
| Blackfeet | 142 | 0.1% |
| Brazilian | 5 | 0.0% |
| British | 632 | 0.6% |
| Bulgarian | 51 | 0.1% |
| Burmese | 380 | 0.4% |
| Cajun | 69 | 0.1% |
| Canadian | 208 | 0.2% |
| Cape Verdean | 4 | 0.0% |
| Celtic | 35 | 0.0% |
| Central American | 590 | 0.5% |
| Central American Indian | 11 | 0.0% |
| Cherokee | 952 | 0.9% |
| Cheyenne | 99 | 0.1% |
| Chickasaw | 61 | 0.1% |
| Chilean | 25 | 0.0% |
| Chippewa | 161 | 0.2% |
| Choctaw | 179 | 0.2% |
| Colombian | 221 | 0.2% |
| Colville | 7 | 0.0% |
| Costa Rican | 82 | 0.1% |
| Cree | 72 | 0.1% |
| Creek | 12 | 0.0% |
| Croatian | 68 | 0.1% |
| Crow | 28 | 0.0% |
| Cuban | 238 | 0.2% |
| Czech | 705 | 0.6% |
| Czechoslovakian | 111 | 0.1% |
| Danish | 802 | 0.7% |
| Dominican | 60 | 0.1% |
| Dutch | 1,688 | 1.5% |
| Eastern European | 180 | 0.2% |
| Egyptian | 6 | 0.0% |
| English | 10,773 | 9.9% |
| Estonian | 26 | 0.0% |
| European | 2,096 | 1.9% |
| Finnish | 860 | 0.8% |
| French | 2,459 | 2.3% |
| French American Indian | 85 | 0.1% |
| French Canadian | 759 | 0.7% |
| German | 17,710 | 16.3% |
| Greek | 176 | 0.2% |
| Guamanian / Chamorro | 206 | 0.2% |
| Guatemalan | 62 | 0.1% |
| Guyanese | 15 | 0.0% |
| Honduran | 193 | 0.2% |
| Hopi | 72 | 0.1% |
| Houma | 55 | 0.1% |
| Hungarian | 297 | 0.3% |
| Icelander | 21 | 0.0% |
| Indian (Asian) | 568 | 0.5% |
| Inupiat | 2,348 | 2.2% |
| Iranian | 59 | 0.1% |
| Iraqi | 5 | 0.0% |
| Irish | 11,908 | 11.0% |
| Iroquois | 75 | 0.1% |
| Israeli | 4 | 0.0% |
| Italian | 2,749 | 2.5% |
| Jamaican | 17 | 0.0% |
| Japanese | 109 | 0.1% |
| Kiowa | 9 | 0.0% |
| Korean | 1,857 | 1.7% |
| Laotian | 60 | 0.1% |
| Latvian | 6 | 0.0% |
| Lebanese | 75 | 0.1% |
| Lithuanian | 149 | 0.1% |
| Luxembourger | 4 | 0.0% |
| Macedonian | 6 | 0.0% |
| Malaysian | 65 | 0.1% |
| Menominee | 7 | 0.0% |
| Mexican | 2,891 | 2.7% |
| Mexican American Indian | 6 | 0.0% |
| Moroccan | 8 | 0.0% |
| Native Hawaiian | 639 | 0.6% |
| Navajo | 29 | 0.0% |
| New Zealander | 7 | 0.0% |
| Nicaraguan | 109 | 0.1% |
| Nigerian | 11 | 0.0% |
| Northern European | 419 | 0.4% |
| Norwegian | 4,042 | 3.7% |
| Osage | 19 | 0.0% |
| Paiute | 8 | 0.0% |
| Pakistani | 90 | 0.1% |
| Panamanian | 106 | 0.1% |
| Pennsylvania German | 25 | 0.0% |
| Peruvian | 13 | 0.0% |
| Polish | 2,105 | 1.9% |
| Portuguese | 331 | 0.3% |
| Potawatomi | 48 | 0.0% |
| Pueblo | 27 | 0.0% |
| Puerto Rican | 871 | 0.8% |
| Puget Sound Salish | 92 | 0.1% |
| Romanian | 88 | 0.1% |
| Russian | 1,084 | 1.0% |
| Salvadoran | 38 | 0.0% |
| Samoan | 253 | 0.2% |
| Scandinavian | 991 | 0.9% |
| Scotch-Irish | 1,659 | 1.5% |
| Scottish | 2,435 | 2.2% |
| Seminole | 19 | 0.0% |
| Serbian | 46 | 0.0% |
| Shoshone | 11 | 0.0% |
| Sioux | 246 | 0.2% |
| Slavic | 47 | 0.0% |
| Slovak | 100 | 0.1% |
| Slovene | 36 | 0.0% |
| Somali | 17 | 0.0% |
| South American | 339 | 0.3% |
| Spaniard | 363 | 0.3% |
| Spanish | 354 | 0.3% |
| Spanish American | 32 | 0.0% |
| Sri Lankan | 161 | 0.2% |
| Subsaharan African | 214 | 0.2% |
| Swedish | 2,276 | 2.1% |
| Swiss | 327 | 0.3% |
| Syrian | 48 | 0.0% |
| Thai | 114 | 0.1% |
| Tlingit-Haida | 380 | 0.4% |
| Tongan | 31 | 0.0% |
| Trinidadian and Tobagonian | 31 | 0.0% |
| Tsimshian | 97 | 0.1% |
| Turkish | 14 | 0.0% |
| Ukrainian | 767 | 0.7% |
| Uruguayan | 8 | 0.0% |
| Ute | 62 | 0.1% |
| Venezuelan | 51 | 0.1% |
| Welsh | 768 | 0.7% |
| Yakama | 21 | 0.0% |
| Yugoslavian | 41 | 0.0% |
| Yup'ik | 1,976 | 1.8% | View All 145 Rows |
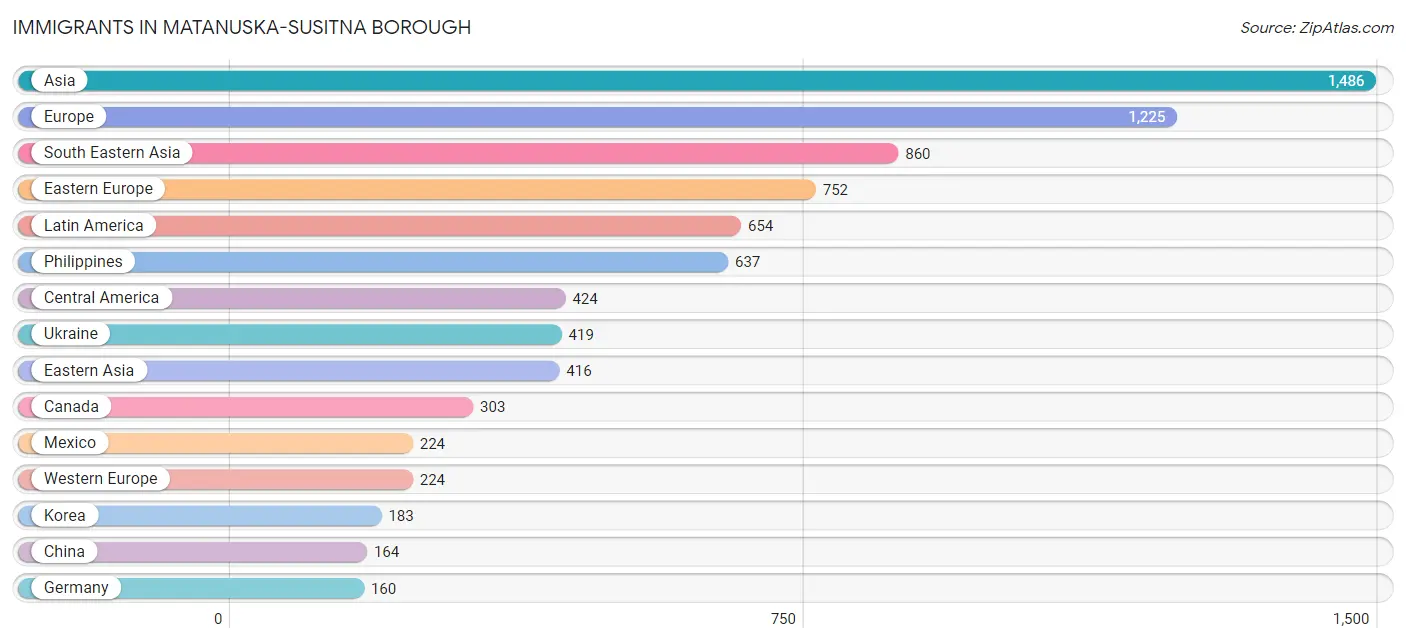
Immigrants in Matanuska-Susitna Borough
The most numerous immigrant groups reported in Matanuska-Susitna Borough came from Asia (1,486 | 1.4%), Europe (1,225 | 1.1%), South Eastern Asia (860 | 0.8%), Eastern Europe (752 | 0.7%), and Latin America (654 | 0.6%), together accounting for 4.6% of all Matanuska-Susitna Borough residents.
| Immigration Origin | # Population | % Population |
| Africa | 25 | 0.0% |
| Argentina | 28 | 0.0% |
| Asia | 1,486 | 1.4% |
| Australia | 20 | 0.0% |
| Austria | 5 | 0.0% |
| Azores | 13 | 0.0% |
| Belarus | 15 | 0.0% |
| Belgium | 13 | 0.0% |
| Brazil | 42 | 0.0% |
| Bulgaria | 29 | 0.0% |
| Cambodia | 35 | 0.0% |
| Canada | 303 | 0.3% |
| Caribbean | 97 | 0.1% |
| Central America | 424 | 0.4% |
| China | 164 | 0.2% |
| Colombia | 24 | 0.0% |
| Cuba | 81 | 0.1% |
| Czechoslovakia | 13 | 0.0% |
| Denmark | 3 | 0.0% |
| Dominican Republic | 6 | 0.0% |
| Eastern Africa | 4 | 0.0% |
| Eastern Asia | 416 | 0.4% |
| Eastern Europe | 752 | 0.7% |
| El Salvador | 20 | 0.0% |
| England | 70 | 0.1% |
| Europe | 1,225 | 1.1% |
| France | 25 | 0.0% |
| Germany | 160 | 0.2% |
| Ghana | 7 | 0.0% |
| Greece | 10 | 0.0% |
| Guatemala | 21 | 0.0% |
| Honduras | 89 | 0.1% |
| Hong Kong | 8 | 0.0% |
| India | 46 | 0.0% |
| Indonesia | 5 | 0.0% |
| Iran | 12 | 0.0% |
| Iraq | 5 | 0.0% |
| Italy | 33 | 0.0% |
| Japan | 69 | 0.1% |
| Kazakhstan | 50 | 0.1% |
| Korea | 183 | 0.2% |
| Laos | 105 | 0.1% |
| Latin America | 654 | 0.6% |
| Mexico | 224 | 0.2% |
| Middle Africa | 3 | 0.0% |
| Moldova | 50 | 0.1% |
| Netherlands | 15 | 0.0% |
| Nicaragua | 42 | 0.0% |
| Northern Africa | 4 | 0.0% |
| Northern Europe | 155 | 0.1% |
| Norway | 23 | 0.0% |
| Oceania | 105 | 0.1% |
| Panama | 28 | 0.0% |
| Peru | 13 | 0.0% |
| Philippines | 637 | 0.6% |
| Poland | 72 | 0.1% |
| Portugal | 28 | 0.0% |
| Romania | 4 | 0.0% |
| Russia | 145 | 0.1% |
| Scotland | 12 | 0.0% |
| South America | 133 | 0.1% |
| South Central Asia | 129 | 0.1% |
| South Eastern Asia | 860 | 0.8% |
| Southern Europe | 94 | 0.1% |
| Spain | 23 | 0.0% |
| Sweden | 22 | 0.0% |
| Switzerland | 6 | 0.0% |
| Syria | 50 | 0.1% |
| Taiwan | 24 | 0.0% |
| Thailand | 61 | 0.1% |
| Trinidad and Tobago | 10 | 0.0% |
| Turkey | 15 | 0.0% |
| Ukraine | 419 | 0.4% |
| Uzbekistan | 21 | 0.0% |
| Venezuela | 18 | 0.0% |
| Vietnam | 17 | 0.0% |
| Western Africa | 7 | 0.0% |
| Western Asia | 81 | 0.1% |
| Western Europe | 224 | 0.2% | View All 79 Rows |
Sex and Age in Matanuska-Susitna Borough
Sex and Age in Matanuska-Susitna Borough
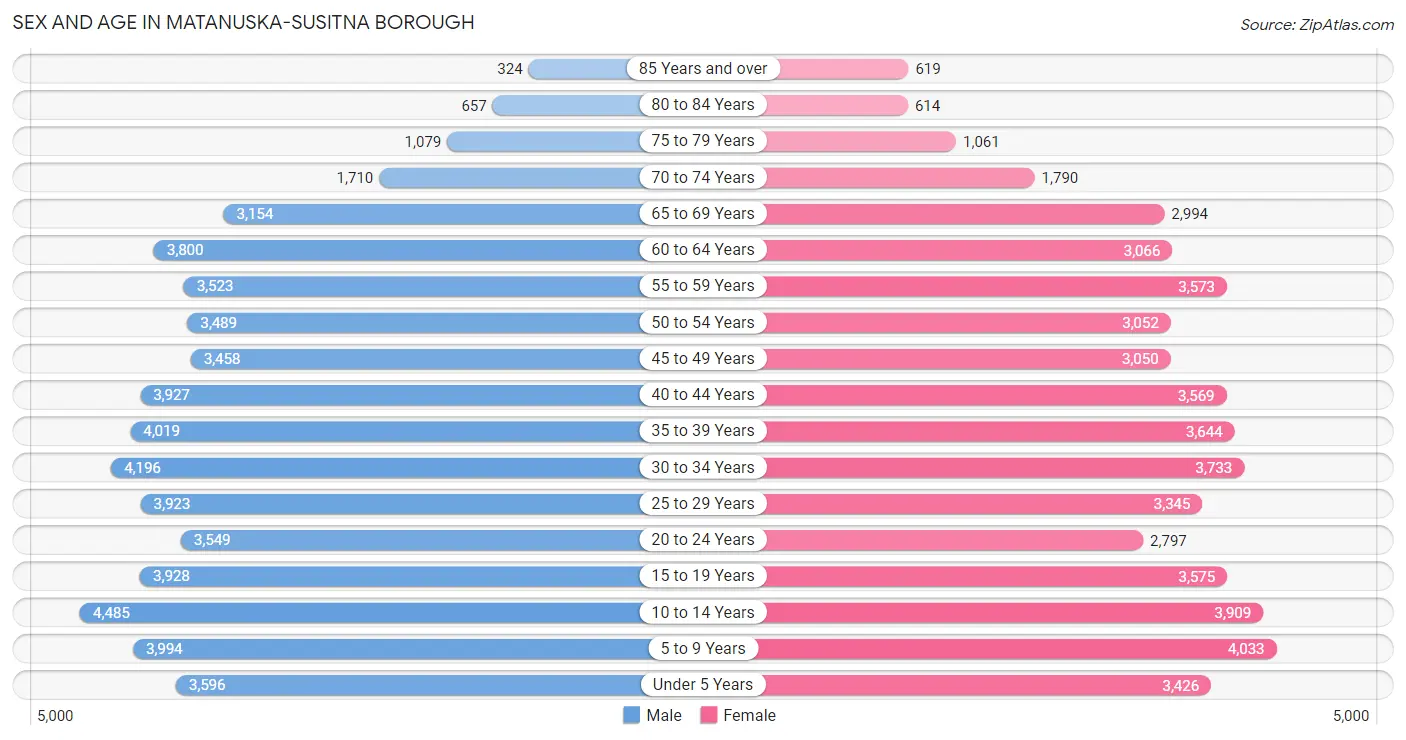
The most populous age groups in Matanuska-Susitna Borough are 10 to 14 Years (4,485 | 7.9%) for men and 5 to 9 Years (4,033 | 7.8%) for women.
| Age Bracket | Male | Female |
| Under 5 Years | 3,596 (6.3%) | 3,426 (6.6%) |
| 5 to 9 Years | 3,994 (7.0%) | 4,033 (7.8%) |
| 10 to 14 Years | 4,485 (7.9%) | 3,909 (7.5%) |
| 15 to 19 Years | 3,928 (6.9%) | 3,575 (6.9%) |
| 20 to 24 Years | 3,549 (6.2%) | 2,797 (5.4%) |
| 25 to 29 Years | 3,923 (6.9%) | 3,345 (6.5%) |
| 30 to 34 Years | 4,196 (7.4%) | 3,733 (7.2%) |
| 35 to 39 Years | 4,019 (7.1%) | 3,644 (7.0%) |
| 40 to 44 Years | 3,927 (6.9%) | 3,569 (6.9%) |
| 45 to 49 Years | 3,458 (6.1%) | 3,050 (5.9%) |
| 50 to 54 Years | 3,489 (6.1%) | 3,052 (5.9%) |
| 55 to 59 Years | 3,523 (6.2%) | 3,573 (6.9%) |
| 60 to 64 Years | 3,800 (6.7%) | 3,066 (5.9%) |
| 65 to 69 Years | 3,154 (5.6%) | 2,994 (5.8%) |
| 70 to 74 Years | 1,710 (3.0%) | 1,790 (3.5%) |
| 75 to 79 Years | 1,079 (1.9%) | 1,061 (2.1%) |
| 80 to 84 Years | 657 (1.2%) | 614 (1.2%) |
| 85 Years and over | 324 (0.6%) | 619 (1.2%) |
| Total | 56,811 (100.0%) | 51,850 (100.0%) |
Families and Households in Matanuska-Susitna Borough
Median Family Size in Matanuska-Susitna Borough
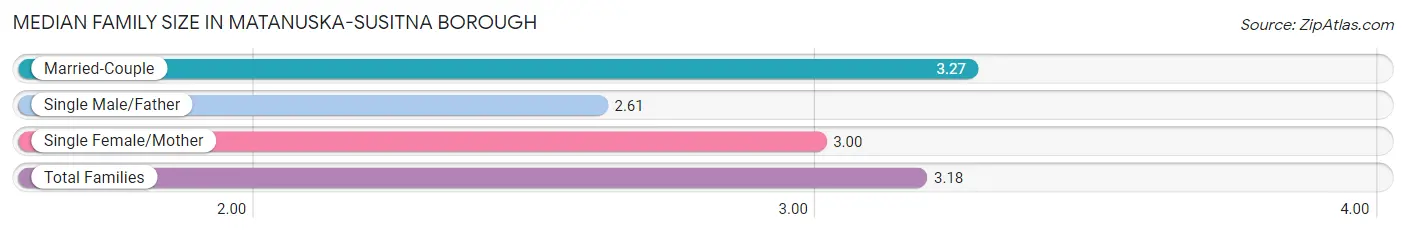
The median family size in Matanuska-Susitna Borough is 3.18 persons per family, with married-couple families (21,752 | 78.2%) accounting for the largest median family size of 3.27 persons per family. On the other hand, single male/father families (2,617 | 9.4%) represent the smallest median family size with 2.61 persons per family.
| Family Type | # Families | Family Size |
| Married-Couple | 21,752 (78.2%) | 3.27 |
| Single Male/Father | 2,617 (9.4%) | 2.61 |
| Single Female/Mother | 3,461 (12.4%) | 3.00 |
| Total Families | 27,830 (100.0%) | 3.18 |
Median Household Size in Matanuska-Susitna Borough
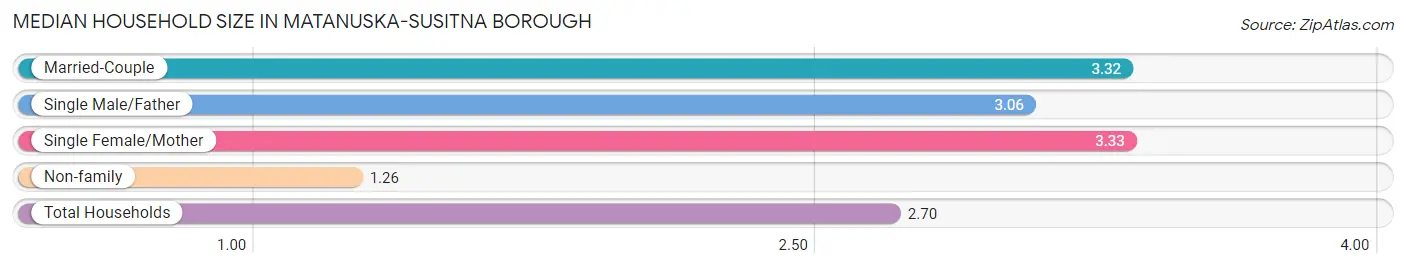
The median household size in Matanuska-Susitna Borough is 2.70 persons per household, with single female/mother households (3,461 | 8.8%) accounting for the largest median household size of 3.33 persons per household. non-family households (11,460 | 29.2%) represent the smallest median household size with 1.26 persons per household.
| Household Type | # Households | Household Size |
| Married-Couple | 21,752 (55.4%) | 3.32 |
| Single Male/Father | 2,617 (6.7%) | 3.06 |
| Single Female/Mother | 3,461 (8.8%) | 3.33 |
| Non-family | 11,460 (29.2%) | 1.26 |
| Total Households | 39,290 (100.0%) | 2.70 |
Household Size by Marriage Status in Matanuska-Susitna Borough
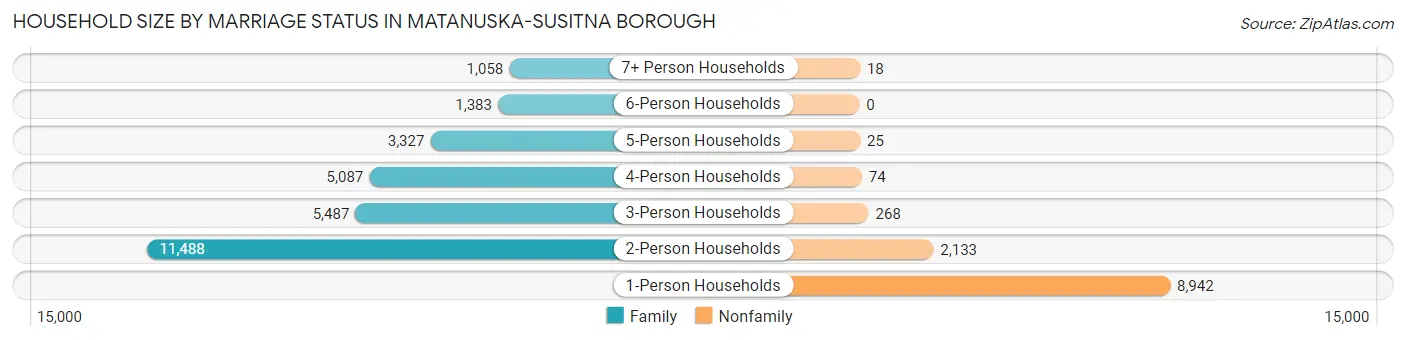
Out of a total of 39,290 households in Matanuska-Susitna Borough, 27,830 (70.8%) are family households, while 11,460 (29.2%) are nonfamily households. The most numerous type of family households are 2-person households, comprising 11,488, and the most common type of nonfamily households are 1-person households, comprising 8,942.
| Household Size | Family Households | Nonfamily Households |
| 1-Person Households | - | 8,942 (22.8%) |
| 2-Person Households | 11,488 (29.2%) | 2,133 (5.4%) |
| 3-Person Households | 5,487 (14.0%) | 268 (0.7%) |
| 4-Person Households | 5,087 (13.0%) | 74 (0.2%) |
| 5-Person Households | 3,327 (8.5%) | 25 (0.1%) |
| 6-Person Households | 1,383 (3.5%) | 0 (0.0%) |
| 7+ Person Households | 1,058 (2.7%) | 18 (0.1%) |
| Total | 27,830 (70.8%) | 11,460 (29.2%) |
Female Fertility in Matanuska-Susitna Borough
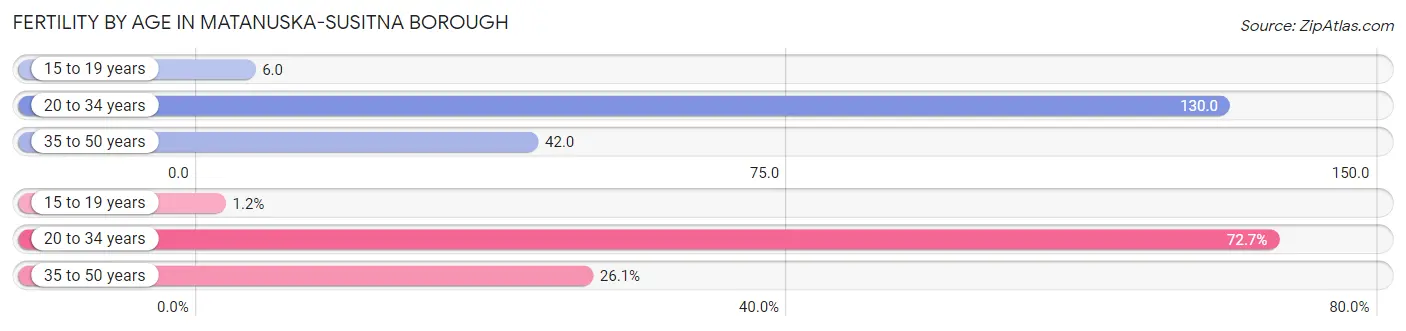
Fertility by Age in Matanuska-Susitna Borough
Average fertility rate in Matanuska-Susitna Borough is 72.0 births per 1,000 women. Women in the age bracket of 20 to 34 years have the highest fertility rate with 130.0 births per 1,000 women. Women in the age bracket of 20 to 34 years acount for 72.7% of all women with births.
| Age Bracket | Women with Births | Births / 1,000 Women |
| 15 to 19 years | 21 (1.2%) | 6.0 |
| 20 to 34 years | 1,280 (72.7%) | 130.0 |
| 35 to 50 years | 460 (26.1%) | 42.0 |
| Total | 1,761 (100.0%) | 72.0 |
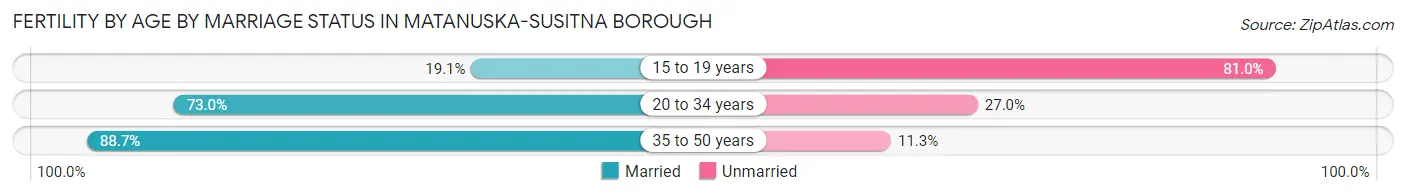
Fertility by Age by Marriage Status in Matanuska-Susitna Borough
76.5% of women with births (1,761) in Matanuska-Susitna Borough are married. The highest percentage of unmarried women with births falls into 15 to 19 years age bracket with 80.9% of them unmarried at the time of birth, while the lowest percentage of unmarried women with births belong to 35 to 50 years age bracket with 11.3% of them unmarried.
| Age Bracket | Married | Unmarried |
| 15 to 19 years | 4 (19.1%) | 17 (80.9%) |
| 20 to 34 years | 934 (73.0%) | 346 (27.0%) |
| 35 to 50 years | 408 (88.7%) | 52 (11.3%) |
| Total | 1,347 (76.5%) | 414 (23.5%) |
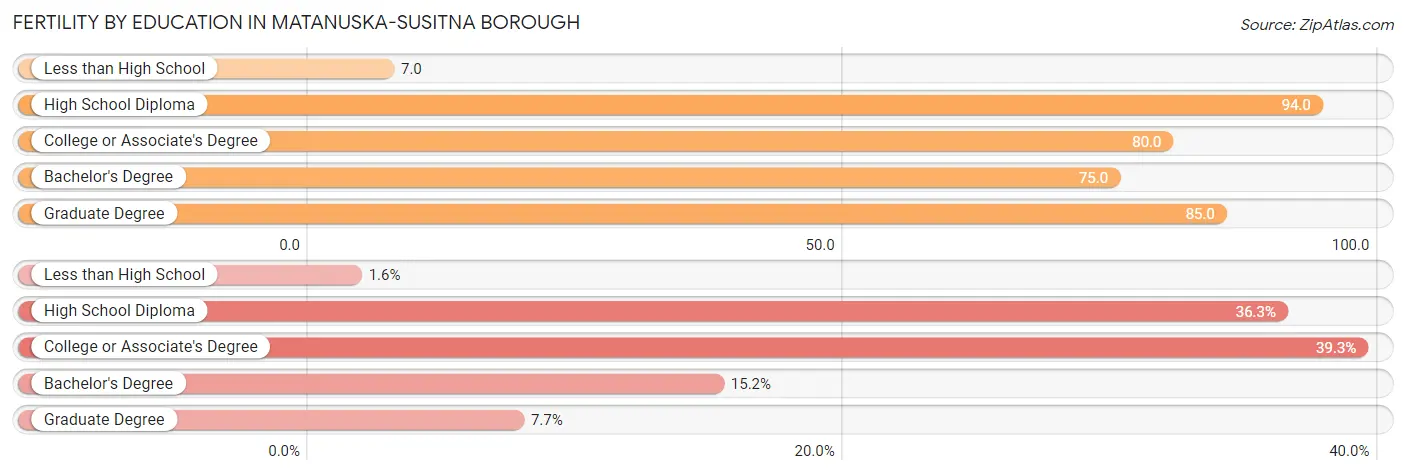
Fertility by Education in Matanuska-Susitna Borough
Average fertility rate in Matanuska-Susitna Borough is 72.0 births per 1,000 women. Women with the education attainment of high school diploma have the highest fertility rate of 94.0 births per 1,000 women, while women with the education attainment of less than high school have the lowest fertility at 7.0 births per 1,000 women. Women with the education attainment of college or associate's degree represent 39.3% of all women with births.
| Educational Attainment | Women with Births | Births / 1,000 Women |
| Less than High School | 28 (1.6%) | 7.0 |
| High School Diploma | 639 (36.3%) | 94.0 |
| College or Associate's Degree | 692 (39.3%) | 80.0 |
| Bachelor's Degree | 267 (15.2%) | 75.0 |
| Graduate Degree | 135 (7.7%) | 85.0 |
| Total | 1,761 (100.0%) | 72.0 |
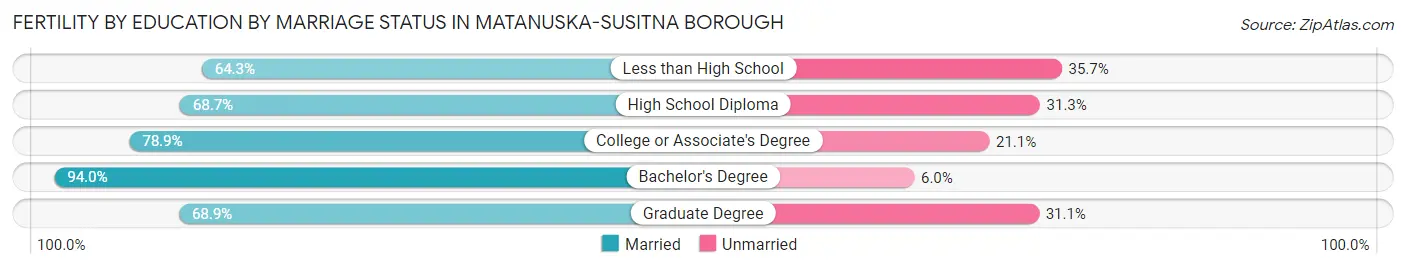
Fertility by Education by Marriage Status in Matanuska-Susitna Borough
23.5% of women with births in Matanuska-Susitna Borough are unmarried. Women with the educational attainment of bachelor's degree are most likely to be married with 94.0% of them married at childbirth, while women with the educational attainment of less than high school are least likely to be married with 35.7% of them unmarried at childbirth.
| Educational Attainment | Married | Unmarried |
| Less than High School | 18 (64.3%) | 10 (35.7%) |
| High School Diploma | 439 (68.7%) | 200 (31.3%) |
| College or Associate's Degree | 546 (78.9%) | 146 (21.1%) |
| Bachelor's Degree | 251 (94.0%) | 16 (6.0%) |
| Graduate Degree | 93 (68.9%) | 42 (31.1%) |
| Total | 1,347 (76.5%) | 414 (23.5%) |
Income in Matanuska-Susitna Borough
Income Overview in Matanuska-Susitna Borough
Per Capita Income in Matanuska-Susitna Borough is $39,201, while median incomes of families and households are $100,753 and $86,435 respectively.
| Characteristic | Number | Measure |
| Per Capita Income | 108,661 | $39,201 |
| Median Family Income | 27,830 | $100,753 |
| Mean Family Income | 27,830 | $120,400 |
| Median Household Income | 39,290 | $86,435 |
| Mean Household Income | 39,290 | $106,734 |
| Income Deficit | 27,830 | $11,572 |
| Wage / Income Gap (%) | 108,661 | 32.80% |
| Wage / Income Gap ($) | 108,661 | 67.20¢ per $1 |
| Gini / Inequality Index | 108,661 | 0.42 |
Earnings by Sex in Matanuska-Susitna Borough
Average Earnings in Matanuska-Susitna Borough are $49,561, $59,119 for men and $39,730 for women, a difference of 32.8%.
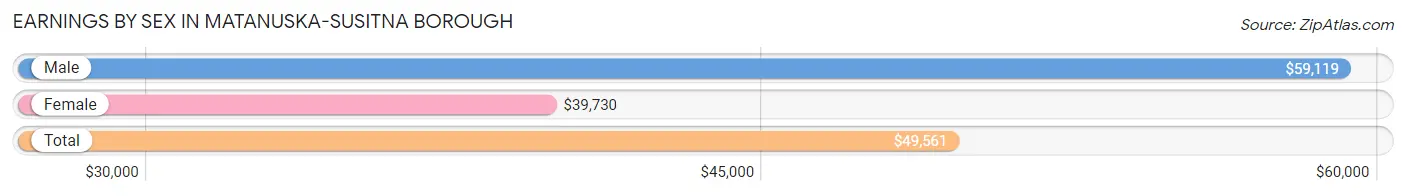
| Sex | Number | Average Earnings |
| Male | 30,485 (56.7%) | $59,119 |
| Female | 23,304 (43.3%) | $39,730 |
| Total | 53,789 (100.0%) | $49,561 |
Earnings by Sex by Income Bracket in Matanuska-Susitna Borough
The most common earnings brackets in Matanuska-Susitna Borough are $100,000+ for men (7,330 | 24.0%) and $75,000 to $99,999 for women (2,719 | 11.7%).
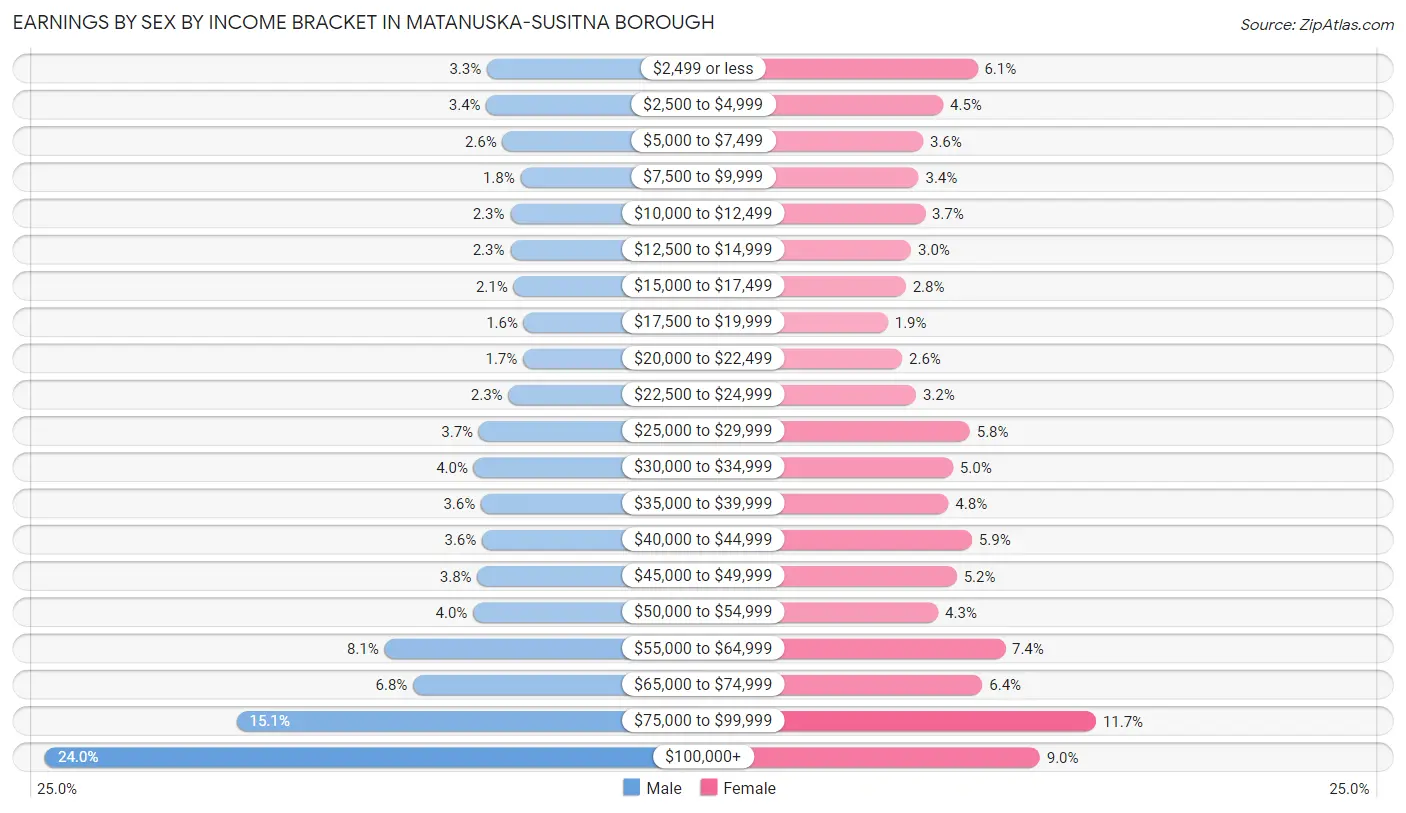
| Income | Male | Female |
| $2,499 or less | 1,019 (3.3%) | 1,427 (6.1%) |
| $2,500 to $4,999 | 1,027 (3.4%) | 1,052 (4.5%) |
| $5,000 to $7,499 | 796 (2.6%) | 833 (3.6%) |
| $7,500 to $9,999 | 539 (1.8%) | 784 (3.4%) |
| $10,000 to $12,499 | 685 (2.2%) | 852 (3.7%) |
| $12,500 to $14,999 | 686 (2.2%) | 702 (3.0%) |
| $15,000 to $17,499 | 640 (2.1%) | 644 (2.8%) |
| $17,500 to $19,999 | 493 (1.6%) | 448 (1.9%) |
| $20,000 to $22,499 | 504 (1.7%) | 604 (2.6%) |
| $22,500 to $24,999 | 713 (2.3%) | 755 (3.2%) |
| $25,000 to $29,999 | 1,133 (3.7%) | 1,343 (5.8%) |
| $30,000 to $34,999 | 1,207 (4.0%) | 1,158 (5.0%) |
| $35,000 to $39,999 | 1,105 (3.6%) | 1,109 (4.8%) |
| $40,000 to $44,999 | 1,089 (3.6%) | 1,366 (5.9%) |
| $45,000 to $49,999 | 1,155 (3.8%) | 1,199 (5.1%) |
| $50,000 to $54,999 | 1,216 (4.0%) | 997 (4.3%) |
| $55,000 to $64,999 | 2,482 (8.1%) | 1,726 (7.4%) |
| $65,000 to $74,999 | 2,072 (6.8%) | 1,480 (6.4%) |
| $75,000 to $99,999 | 4,594 (15.1%) | 2,719 (11.7%) |
| $100,000+ | 7,330 (24.0%) | 2,106 (9.0%) |
| Total | 30,485 (100.0%) | 23,304 (100.0%) |
Earnings by Sex by Educational Attainment in Matanuska-Susitna Borough
Average earnings in Matanuska-Susitna Borough are $67,542 for men and $44,972 for women, a difference of 33.4%. Men with an educational attainment of graduate degree enjoy the highest average annual earnings of $91,518, while those with less than high school education earn the least with $46,944. Women with an educational attainment of graduate degree earn the most with the average annual earnings of $75,378, while those with less than high school education have the smallest earnings of $32,212.
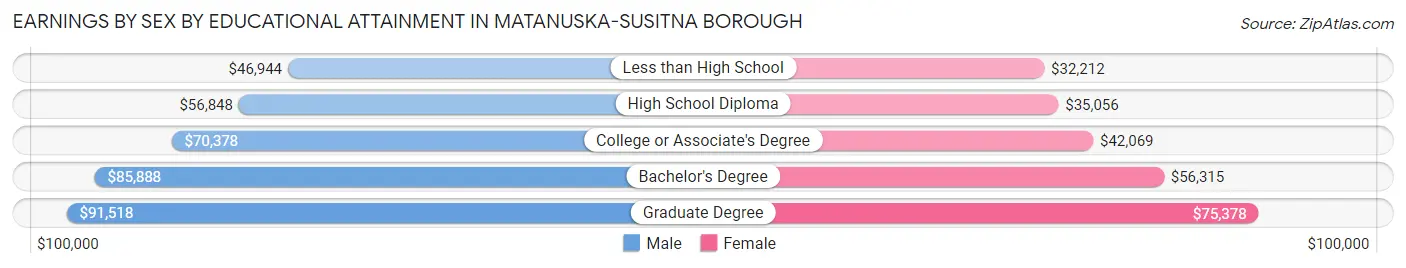
| Educational Attainment | Male Income | Female Income |
| Less than High School | $46,944 | $32,212 |
| High School Diploma | $56,848 | $35,056 |
| College or Associate's Degree | $70,378 | $42,069 |
| Bachelor's Degree | $85,888 | $56,315 |
| Graduate Degree | $91,518 | $75,378 |
| Total | $67,542 | $44,972 |
Family Income in Matanuska-Susitna Borough
Family Income Brackets in Matanuska-Susitna Borough
According to the Matanuska-Susitna Borough family income data, there are 6,512 families falling into the $100,000 to $149,999 income range, which is the most common income bracket and makes up 23.4% of all families. Conversely, the $10,000 to $14,999 income bracket is the least frequent group with only 445 families (1.6%) belonging to this category.

| Income Bracket | # Families | % Families |
| Less than $10,000 | 779 | 2.8% |
| $10,000 to $14,999 | 445 | 1.6% |
| $15,000 to $24,999 | 946 | 3.4% |
| $25,000 to $34,999 | 1,113 | 4.0% |
| $35,000 to $49,999 | 2,226 | 8.0% |
| $50,000 to $74,999 | 3,785 | 13.6% |
| $75,000 to $99,999 | 4,536 | 16.3% |
| $100,000 to $149,999 | 6,512 | 23.4% |
| $150,000 to $199,999 | 3,729 | 13.4% |
| $200,000+ | 3,785 | 13.6% |
Family Income by Famaliy Size in Matanuska-Susitna Borough
6-person families (1,190 | 4.3%) account for the highest median family income in Matanuska-Susitna Borough with $140,385 per family, while 2-person families (12,483 | 44.9%) have the highest median income of $43,488 per family member.
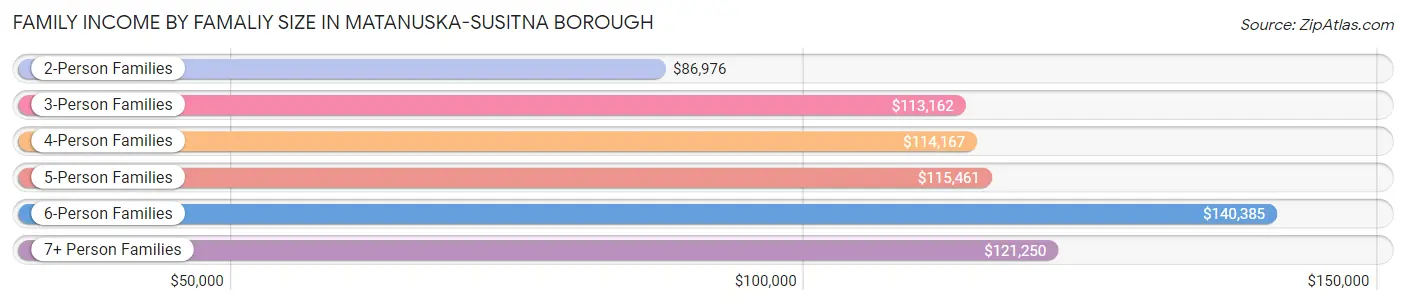
| Income Bracket | # Families | Median Income |
| 2-Person Families | 12,483 (44.9%) | $86,976 |
| 3-Person Families | 5,290 (19.0%) | $113,162 |
| 4-Person Families | 5,046 (18.1%) | $114,167 |
| 5-Person Families | 2,949 (10.6%) | $115,461 |
| 6-Person Families | 1,190 (4.3%) | $140,385 |
| 7+ Person Families | 872 (3.1%) | $121,250 |
| Total | 27,830 (100.0%) | $100,753 |
Family Income by Number of Earners in Matanuska-Susitna Borough
The median family income in Matanuska-Susitna Borough is $100,753, with families comprising 3+ earners (2,656) having the highest median family income of $162,692, while families with no earners (4,322) have the lowest median family income of $48,155, accounting for 9.5% and 15.5% of families, respectively.
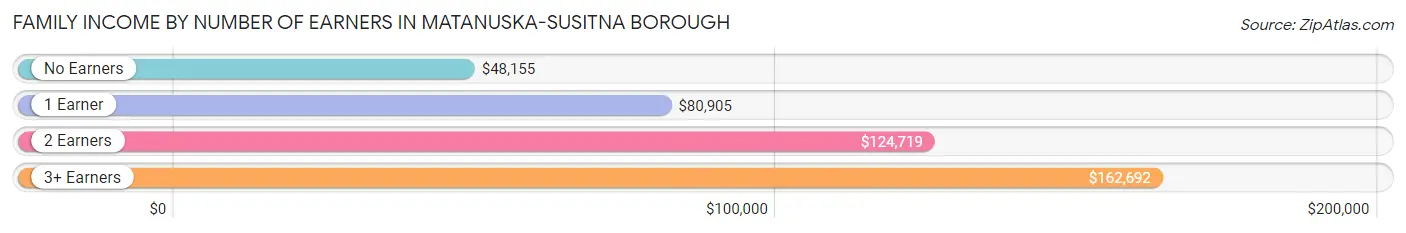
| Number of Earners | # Families | Median Income |
| No Earners | 4,322 (15.5%) | $48,155 |
| 1 Earner | 9,514 (34.2%) | $80,905 |
| 2 Earners | 11,338 (40.7%) | $124,719 |
| 3+ Earners | 2,656 (9.5%) | $162,692 |
| Total | 27,830 (100.0%) | $100,753 |
Household Income in Matanuska-Susitna Borough
Household Income Brackets in Matanuska-Susitna Borough
With 8,054 households falling in the category, the $100,000 to $149,999 income range is the most frequent in Matanuska-Susitna Borough, accounting for 20.5% of all households. In contrast, only 1,139 households (2.9%) fall into the $10,000 to $14,999 income bracket, making it the least populous group.
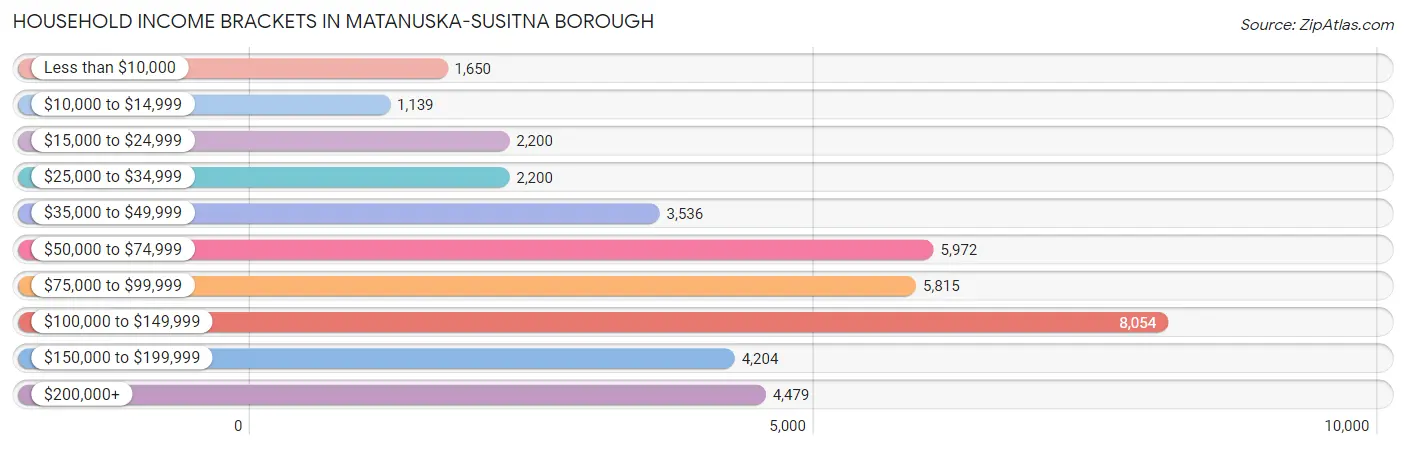
| Income Bracket | # Households | % Households |
| Less than $10,000 | 1,650 | 4.2% |
| $10,000 to $14,999 | 1,139 | 2.9% |
| $15,000 to $24,999 | 2,200 | 5.6% |
| $25,000 to $34,999 | 2,200 | 5.6% |
| $35,000 to $49,999 | 3,536 | 9.0% |
| $50,000 to $74,999 | 5,972 | 15.2% |
| $75,000 to $99,999 | 5,815 | 14.8% |
| $100,000 to $149,999 | 8,054 | 20.5% |
| $150,000 to $199,999 | 4,204 | 10.7% |
| $200,000+ | 4,479 | 11.4% |
Household Income by Householder Age in Matanuska-Susitna Borough
The median household income in Matanuska-Susitna Borough is $86,435, with the highest median household income of $101,316 found in the 45 to 64 years age bracket for the primary householder. A total of 14,922 households (38.0%) fall into this category. Meanwhile, the 15 to 24 years age bracket for the primary householder has the lowest median household income of $54,391, with 1,546 households (3.9%) in this group.
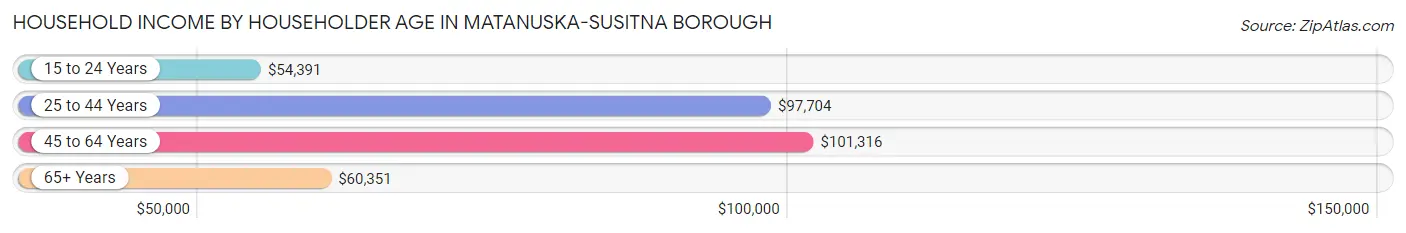
| Income Bracket | # Households | Median Income |
| 15 to 24 Years | 1,546 (3.9%) | $54,391 |
| 25 to 44 Years | 14,252 (36.3%) | $97,704 |
| 45 to 64 Years | 14,922 (38.0%) | $101,316 |
| 65+ Years | 8,570 (21.8%) | $60,351 |
| Total | 39,290 (100.0%) | $86,435 |
Poverty in Matanuska-Susitna Borough
Income Below Poverty by Sex and Age in Matanuska-Susitna Borough
With 9.4% poverty level for males and 11.0% for females among the residents of Matanuska-Susitna Borough, 5 year old males and under 5 year old females are the most vulnerable to poverty, with 154 males (21.8%) and 611 females (18.6%) in their respective age groups living below the poverty level.
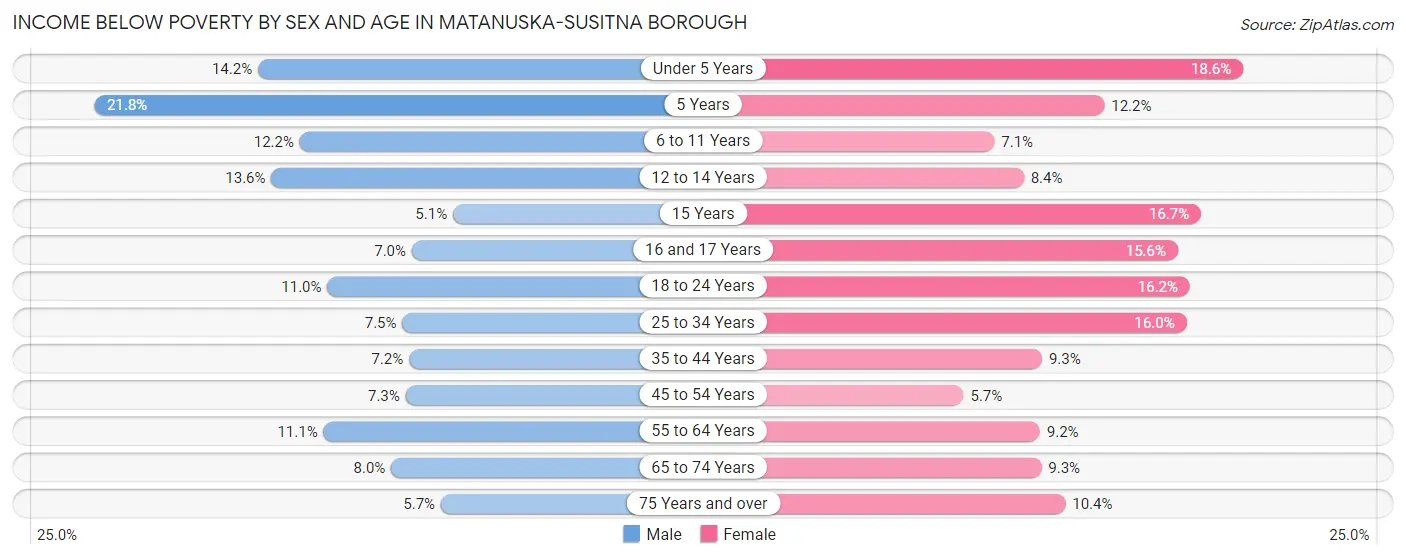
| Age Bracket | Male | Female |
| Under 5 Years | 488 (14.2%) | 611 (18.6%) |
| 5 Years | 154 (21.8%) | 90 (12.2%) |
| 6 to 11 Years | 579 (12.2%) | 332 (7.1%) |
| 12 to 14 Years | 370 (13.6%) | 200 (8.4%) |
| 15 Years | 42 (5.1%) | 142 (16.7%) |
| 16 and 17 Years | 123 (7.0%) | 234 (15.6%) |
| 18 to 24 Years | 505 (11.0%) | 634 (16.2%) |
| 25 to 34 Years | 572 (7.5%) | 1,130 (16.0%) |
| 35 to 44 Years | 545 (7.2%) | 670 (9.3%) |
| 45 to 54 Years | 468 (7.3%) | 345 (5.7%) |
| 55 to 64 Years | 792 (11.1%) | 608 (9.2%) |
| 65 to 74 Years | 385 (8.0%) | 441 (9.3%) |
| 75 Years and over | 115 (5.7%) | 235 (10.4%) |
| Total | 5,138 (9.4%) | 5,672 (11.0%) |
Income Above Poverty by Sex and Age in Matanuska-Susitna Borough
According to the poverty statistics in Matanuska-Susitna Borough, males aged 15 years and females aged 45 to 54 years are the age groups that are most secure financially, with 94.9% of males and 94.4% of females in these age groups living above the poverty line.
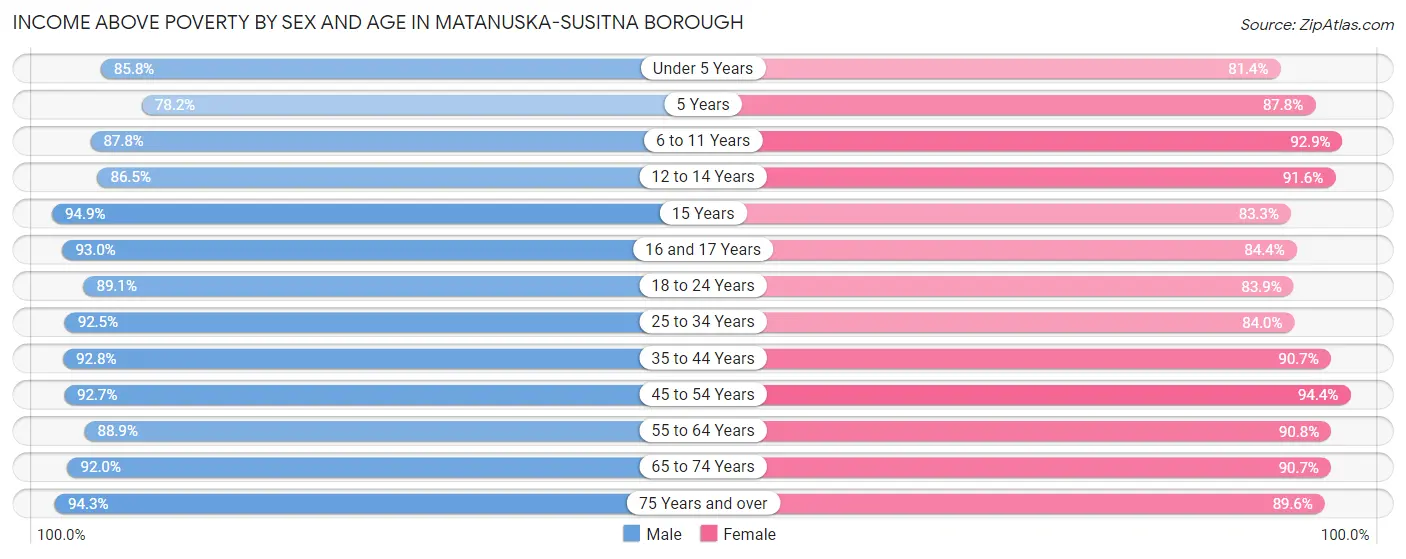
| Age Bracket | Male | Female |
| Under 5 Years | 2,956 (85.8%) | 2,670 (81.4%) |
| 5 Years | 553 (78.2%) | 649 (87.8%) |
| 6 to 11 Years | 4,155 (87.8%) | 4,360 (92.9%) |
| 12 to 14 Years | 2,361 (86.5%) | 2,170 (91.6%) |
| 15 Years | 779 (94.9%) | 710 (83.3%) |
| 16 and 17 Years | 1,626 (93.0%) | 1,267 (84.4%) |
| 18 to 24 Years | 4,107 (89.0%) | 3,291 (83.9%) |
| 25 to 34 Years | 7,083 (92.5%) | 5,934 (84.0%) |
| 35 to 44 Years | 7,069 (92.8%) | 6,542 (90.7%) |
| 45 to 54 Years | 5,922 (92.7%) | 5,757 (94.4%) |
| 55 to 64 Years | 6,322 (88.9%) | 6,005 (90.8%) |
| 65 to 74 Years | 4,435 (92.0%) | 4,321 (90.7%) |
| 75 Years and over | 1,909 (94.3%) | 2,031 (89.6%) |
| Total | 49,277 (90.6%) | 45,707 (89.0%) |
Income Below Poverty Among Married-Couple Families in Matanuska-Susitna Borough
The poverty statistics for married-couple families in Matanuska-Susitna Borough show that 3.9% or 854 of the total 21,752 families live below the poverty line. Families with 5 or more children have the highest poverty rate of 19.9%, comprising of 101 families. On the other hand, families with no children have the lowest poverty rate of 3.2%, which includes 377 families.
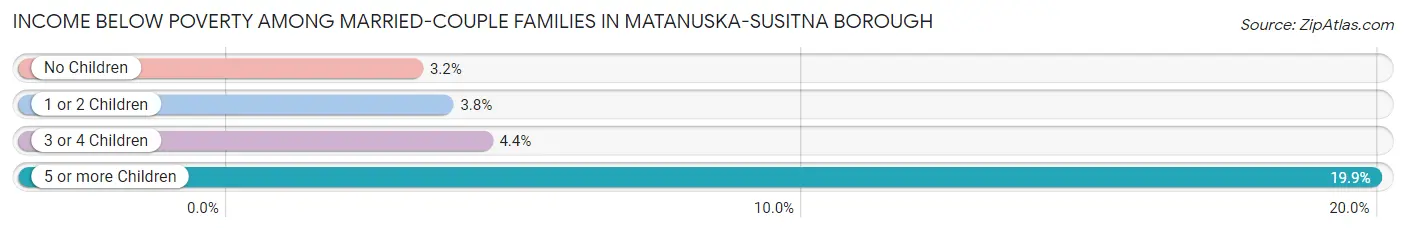
| Children | Above Poverty | Below Poverty |
| No Children | 11,339 (96.8%) | 377 (3.2%) |
| 1 or 2 Children | 6,475 (96.3%) | 252 (3.7%) |
| 3 or 4 Children | 2,678 (95.6%) | 124 (4.4%) |
| 5 or more Children | 406 (80.1%) | 101 (19.9%) |
| Total | 20,898 (96.1%) | 854 (3.9%) |
Income Below Poverty Among Single-Parent Households in Matanuska-Susitna Borough
According to the poverty data in Matanuska-Susitna Borough, 13.9% or 364 single-father households and 24.8% or 858 single-mother households are living below the poverty line. Among single-father households, those with 3 or 4 children have the highest poverty rate, with 72 households (34.6%) experiencing poverty. Likewise, among single-mother households, those with 5 or more children have the highest poverty rate, with 24 households (100.0%) falling below the poverty line.
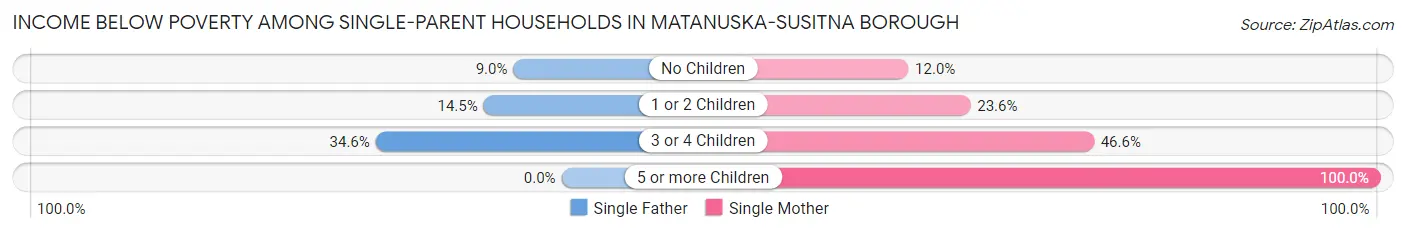
| Children | Single Father | Single Mother |
| No Children | 88 (9.0%) | 126 (12.0%) |
| 1 or 2 Children | 204 (14.5%) | 415 (23.6%) |
| 3 or 4 Children | 72 (34.6%) | 293 (46.6%) |
| 5 or more Children | 0 (0.0%) | 24 (100.0%) |
| Total | 364 (13.9%) | 858 (24.8%) |
Income Below Poverty Among Married-Couple vs Single-Parent Households in Matanuska-Susitna Borough
The poverty data for Matanuska-Susitna Borough shows that 854 of the married-couple family households (3.9%) and 1,222 of the single-parent households (20.1%) are living below the poverty level. Within the married-couple family households, those with 5 or more children have the highest poverty rate, with 101 households (19.9%) falling below the poverty line. Among the single-parent households, those with 5 or more children have the highest poverty rate, with 24 household (51.1%) living below poverty.
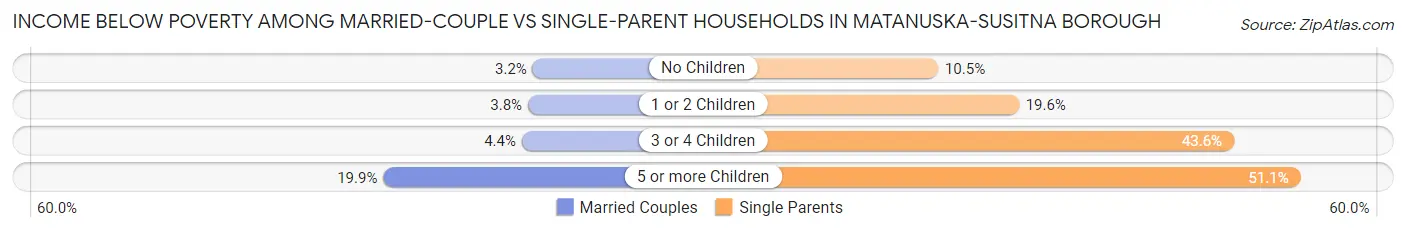
| Children | Married-Couple Families | Single-Parent Households |
| No Children | 377 (3.2%) | 214 (10.5%) |
| 1 or 2 Children | 252 (3.7%) | 619 (19.6%) |
| 3 or 4 Children | 124 (4.4%) | 365 (43.6%) |
| 5 or more Children | 101 (19.9%) | 24 (51.1%) |
| Total | 854 (3.9%) | 1,222 (20.1%) |
Employment Characteristics in Matanuska-Susitna Borough
Employment by Class of Employer in Matanuska-Susitna Borough
Among the 45,940 employed individuals in Matanuska-Susitna Borough, private company employees (27,117 | 59.0%), self-employed (not incorporated) (3,662 | 8.0%), and state government employees (3,360 | 7.3%) make up the most common classes of employment.
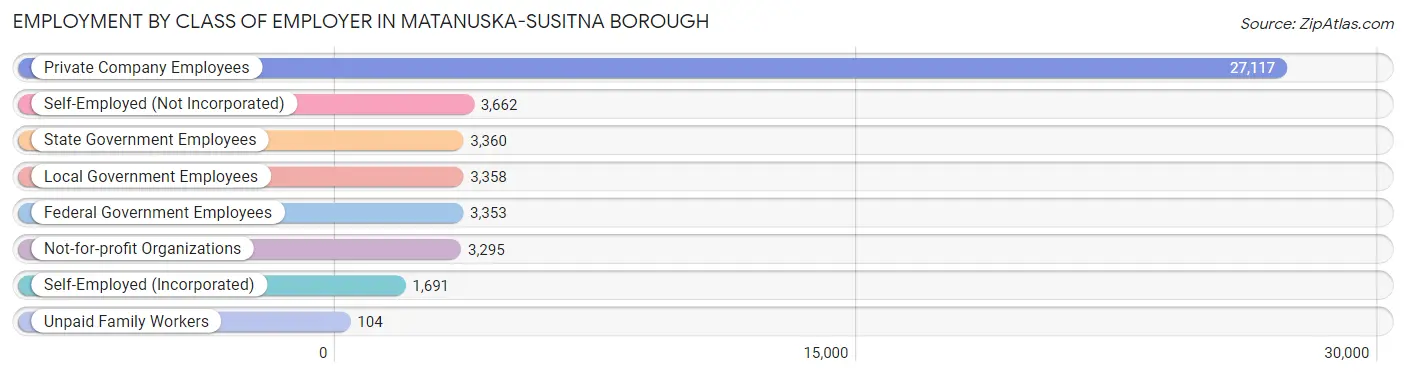
| Employer Class | # Employees | % Employees |
| Private Company Employees | 27,117 | 59.0% |
| Self-Employed (Incorporated) | 1,691 | 3.7% |
| Self-Employed (Not Incorporated) | 3,662 | 8.0% |
| Not-for-profit Organizations | 3,295 | 7.2% |
| Local Government Employees | 3,358 | 7.3% |
| State Government Employees | 3,360 | 7.3% |
| Federal Government Employees | 3,353 | 7.3% |
| Unpaid Family Workers | 104 | 0.2% |
| Total | 45,940 | 100.0% |
Employment Status by Age in Matanuska-Susitna Borough
According to the labor force statistics for Matanuska-Susitna Borough, out of the total population over 16 years of age (83,540), 60.3% or 50,375 individuals are in the labor force, with 7.0% or 3,526 of them unemployed. The age group with the highest labor force participation rate is 35 to 44 years, with 78.5% or 11,900 individuals in the labor force. Within the labor force, the 16 to 19 years age range has the highest percentage of unemployed individuals, with 17.5% or 410 of them being unemployed.
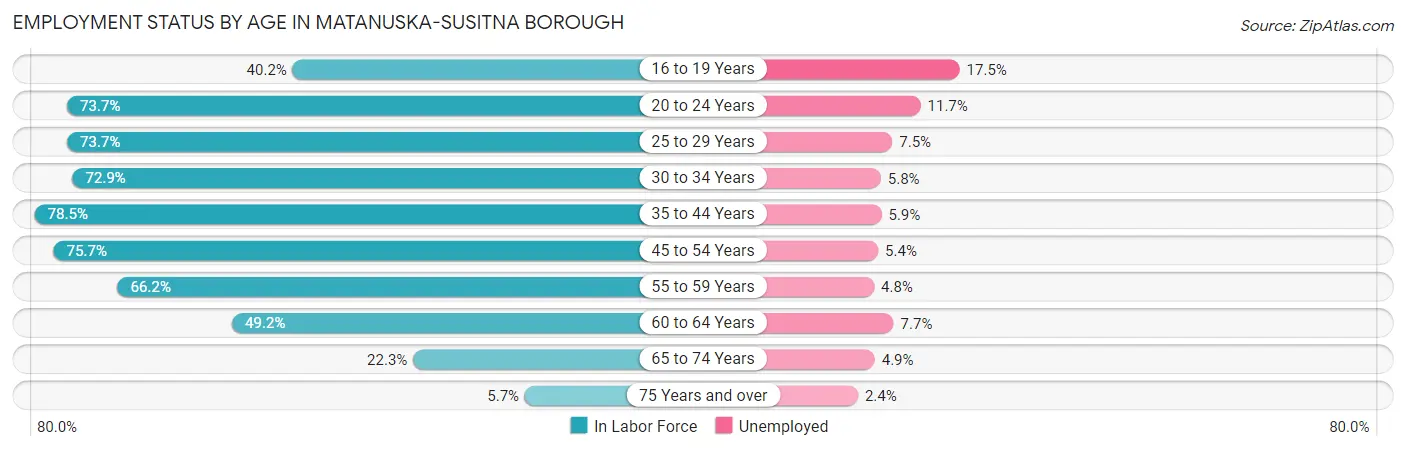
| Age Bracket | In Labor Force | Unemployed |
| 16 to 19 Years | 2,342 (40.2%) | 410 (17.5%) |
| 20 to 24 Years | 4,677 (73.7%) | 547 (11.7%) |
| 25 to 29 Years | 5,357 (73.7%) | 402 (7.5%) |
| 30 to 34 Years | 5,780 (72.9%) | 335 (5.8%) |
| 35 to 44 Years | 11,900 (78.5%) | 702 (5.9%) |
| 45 to 54 Years | 9,878 (75.7%) | 533 (5.4%) |
| 55 to 59 Years | 4,698 (66.2%) | 226 (4.8%) |
| 60 to 64 Years | 3,378 (49.2%) | 260 (7.7%) |
| 65 to 74 Years | 2,152 (22.3%) | 105 (4.9%) |
| 75 Years and over | 248 (5.7%) | 6 (2.4%) |
| Total | 50,375 (60.3%) | 3,526 (7.0%) |
Employment Status by Educational Attainment in Matanuska-Susitna Borough
According to labor force statistics for Matanuska-Susitna Borough, 71.4% of individuals (40,960) out of the total population between 25 and 64 years of age (57,367) are in the labor force, with 6.0% or 2,458 of them being unemployed. The group with the highest labor force participation rate are those with the educational attainment of bachelor's degree or higher, with 81.4% or 10,814 individuals in the labor force. Within the labor force, individuals with less than high school education have the highest percentage of unemployment, with 10.7% or 182 of them being unemployed.
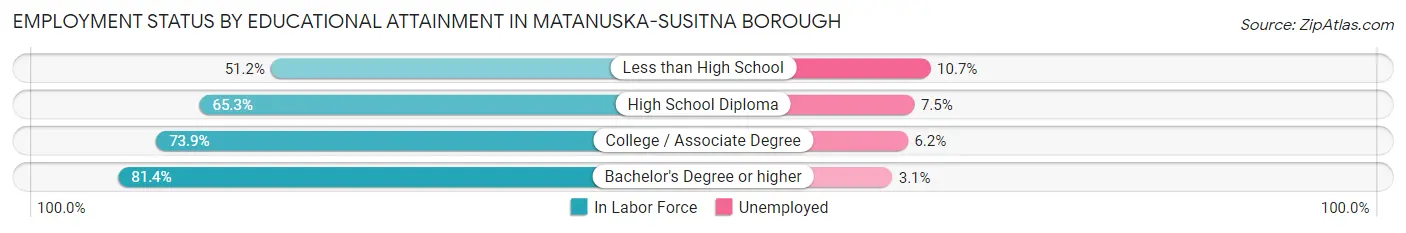
| Educational Attainment | In Labor Force | Unemployed |
| Less than High School | 1,701 (51.2%) | 355 (10.7%) |
| High School Diploma | 12,519 (65.3%) | 1,438 (7.5%) |
| College / Associate Degree | 15,954 (73.9%) | 1,338 (6.2%) |
| Bachelor's Degree or higher | 10,814 (81.4%) | 412 (3.1%) |
| Total | 40,960 (71.4%) | 3,442 (6.0%) |
Employment Occupations by Sex in Matanuska-Susitna Borough
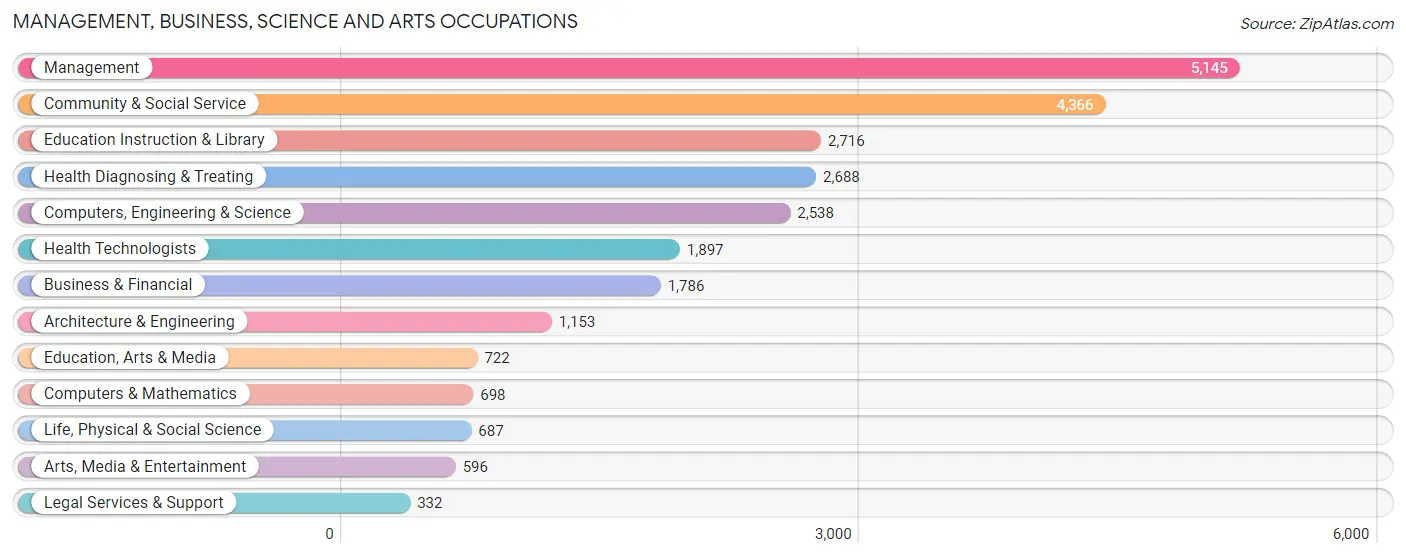
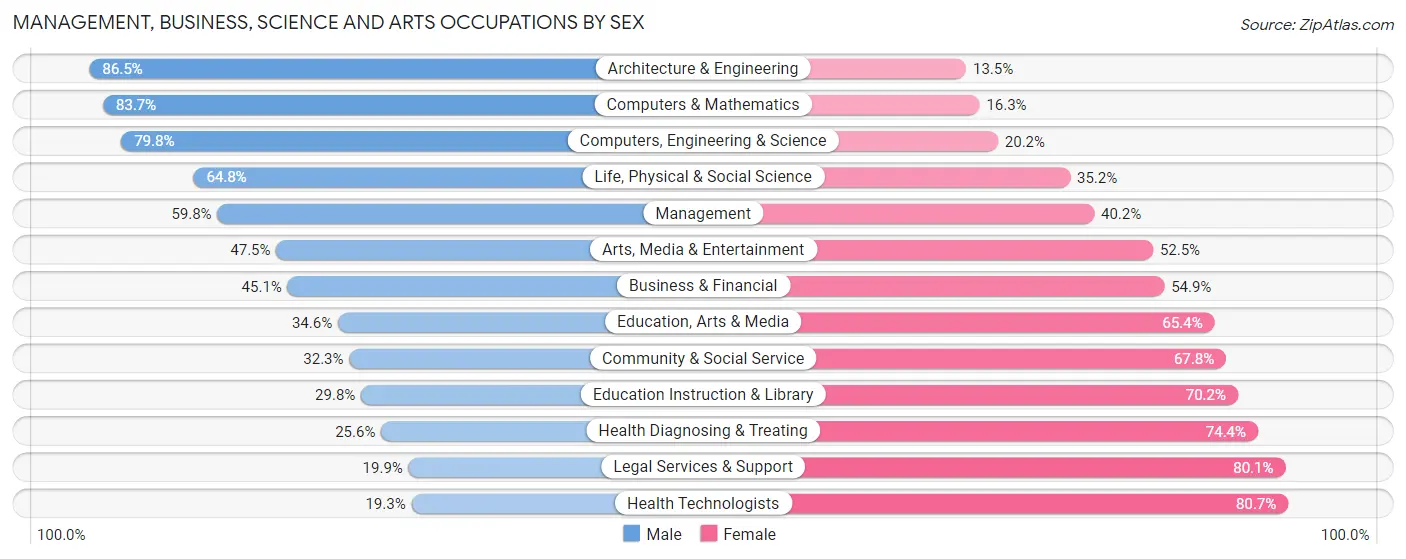
Management, Business, Science and Arts Occupations
The most common Management, Business, Science and Arts occupations in Matanuska-Susitna Borough are Management (5,145 | 11.2%), Community & Social Service (4,366 | 9.5%), Education Instruction & Library (2,716 | 5.9%), Health Diagnosing & Treating (2,688 | 5.9%), and Computers, Engineering & Science (2,538 | 5.5%).
Management, Business, Science and Arts Occupations by Sex
Within the Management, Business, Science and Arts occupations in Matanuska-Susitna Borough, the most male-oriented occupations are Architecture & Engineering (86.5%), Computers & Mathematics (83.7%), and Computers, Engineering & Science (79.8%), while the most female-oriented occupations are Health Technologists (80.7%), Legal Services & Support (80.1%), and Health Diagnosing & Treating (74.4%).
| Occupation | Male | Female |
| Management | 3,075 (59.8%) | 2,070 (40.2%) |
| Business & Financial | 806 (45.1%) | 980 (54.9%) |
| Computers, Engineering & Science | 2,026 (79.8%) | 512 (20.2%) |
| Computers & Mathematics | 584 (83.7%) | 114 (16.3%) |
| Architecture & Engineering | 997 (86.5%) | 156 (13.5%) |
| Life, Physical & Social Science | 445 (64.8%) | 242 (35.2%) |
| Community & Social Service | 1,408 (32.3%) | 2,958 (67.7%) |
| Education, Arts & Media | 250 (34.6%) | 472 (65.4%) |
| Legal Services & Support | 66 (19.9%) | 266 (80.1%) |
| Education Instruction & Library | 809 (29.8%) | 1,907 (70.2%) |
| Arts, Media & Entertainment | 283 (47.5%) | 313 (52.5%) |
| Health Diagnosing & Treating | 688 (25.6%) | 2,000 (74.4%) |
| Health Technologists | 366 (19.3%) | 1,531 (80.7%) |
| Total (Category) | 8,003 (48.4%) | 8,520 (51.6%) |
| Total (Overall) | 25,535 (55.7%) | 20,265 (44.3%) |
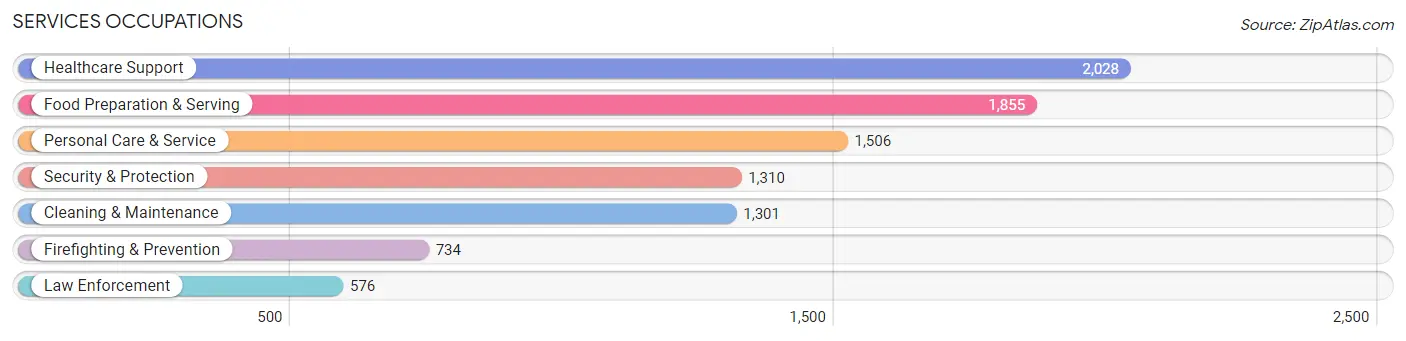
Services Occupations
The most common Services occupations in Matanuska-Susitna Borough are Healthcare Support (2,028 | 4.4%), Food Preparation & Serving (1,855 | 4.1%), Personal Care & Service (1,506 | 3.3%), Security & Protection (1,310 | 2.9%), and Cleaning & Maintenance (1,301 | 2.8%).
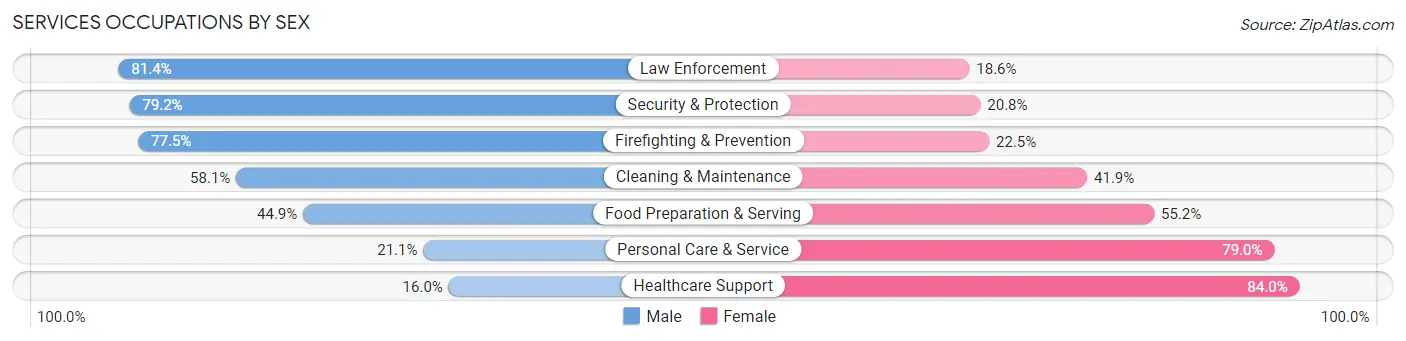
Services Occupations by Sex
Within the Services occupations in Matanuska-Susitna Borough, the most male-oriented occupations are Law Enforcement (81.4%), Security & Protection (79.2%), and Firefighting & Prevention (77.5%), while the most female-oriented occupations are Healthcare Support (84.0%), Personal Care & Service (78.9%), and Food Preparation & Serving (55.1%).
| Occupation | Male | Female |
| Healthcare Support | 325 (16.0%) | 1,703 (84.0%) |
| Security & Protection | 1,038 (79.2%) | 272 (20.8%) |
| Firefighting & Prevention | 569 (77.5%) | 165 (22.5%) |
| Law Enforcement | 469 (81.4%) | 107 (18.6%) |
| Food Preparation & Serving | 832 (44.9%) | 1,023 (55.1%) |
| Cleaning & Maintenance | 756 (58.1%) | 545 (41.9%) |
| Personal Care & Service | 317 (21.0%) | 1,189 (78.9%) |
| Total (Category) | 3,268 (40.8%) | 4,732 (59.2%) |
| Total (Overall) | 25,535 (55.7%) | 20,265 (44.3%) |
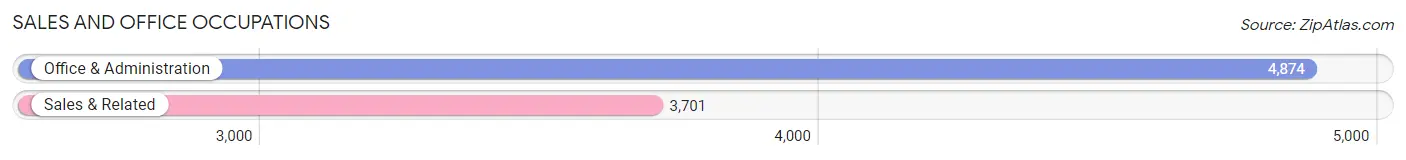
Sales and Office Occupations
The most common Sales and Office occupations in Matanuska-Susitna Borough are Office & Administration (4,874 | 10.6%), and Sales & Related (3,701 | 8.1%).
Sales and Office Occupations by Sex
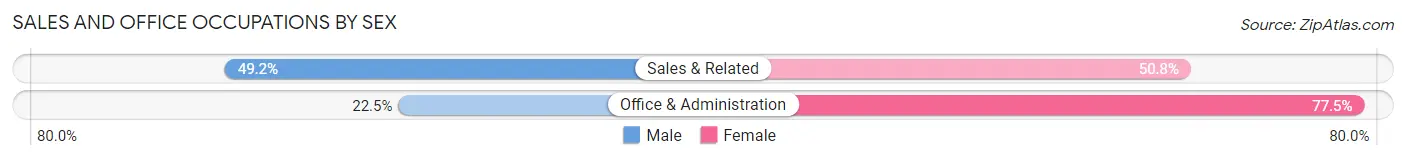
| Occupation | Male | Female |
| Sales & Related | 1,821 (49.2%) | 1,880 (50.8%) |
| Office & Administration | 1,097 (22.5%) | 3,777 (77.5%) |
| Total (Category) | 2,918 (34.0%) | 5,657 (66.0%) |
| Total (Overall) | 25,535 (55.7%) | 20,265 (44.3%) |
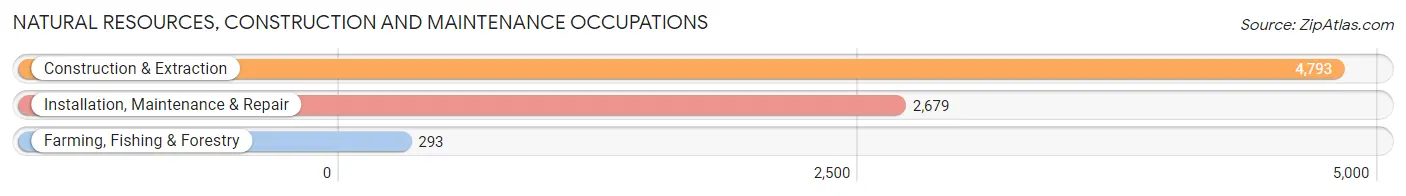
Natural Resources, Construction and Maintenance Occupations
The most common Natural Resources, Construction and Maintenance occupations in Matanuska-Susitna Borough are Construction & Extraction (4,793 | 10.5%), Installation, Maintenance & Repair (2,679 | 5.9%), and Farming, Fishing & Forestry (293 | 0.6%).
Natural Resources, Construction and Maintenance Occupations by Sex
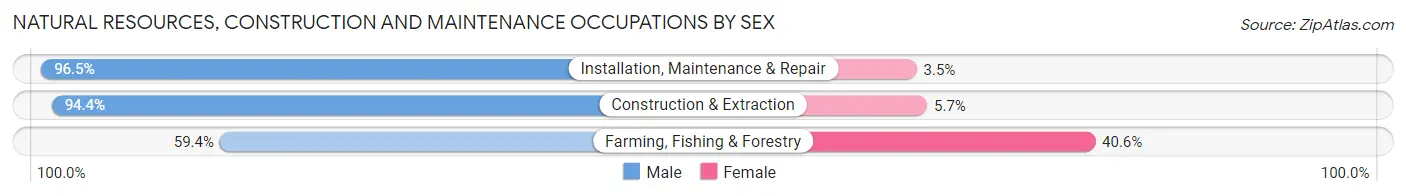
| Occupation | Male | Female |
| Farming, Fishing & Forestry | 174 (59.4%) | 119 (40.6%) |
| Construction & Extraction | 4,522 (94.4%) | 271 (5.7%) |
| Installation, Maintenance & Repair | 2,586 (96.5%) | 93 (3.5%) |
| Total (Category) | 7,282 (93.8%) | 483 (6.2%) |
| Total (Overall) | 25,535 (55.7%) | 20,265 (44.3%) |
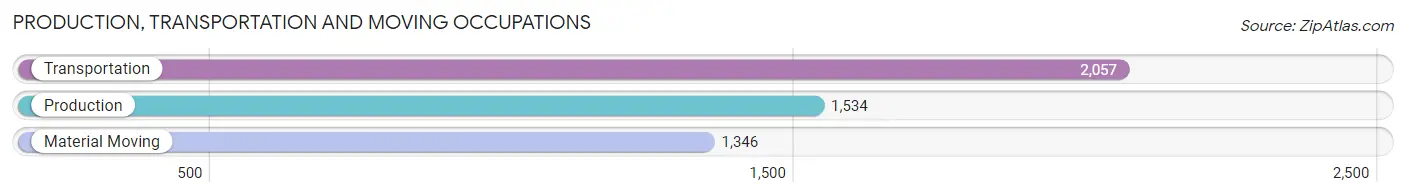
Production, Transportation and Moving Occupations
The most common Production, Transportation and Moving occupations in Matanuska-Susitna Borough are Transportation (2,057 | 4.5%), Production (1,534 | 3.4%), and Material Moving (1,346 | 2.9%).
Production, Transportation and Moving Occupations by Sex
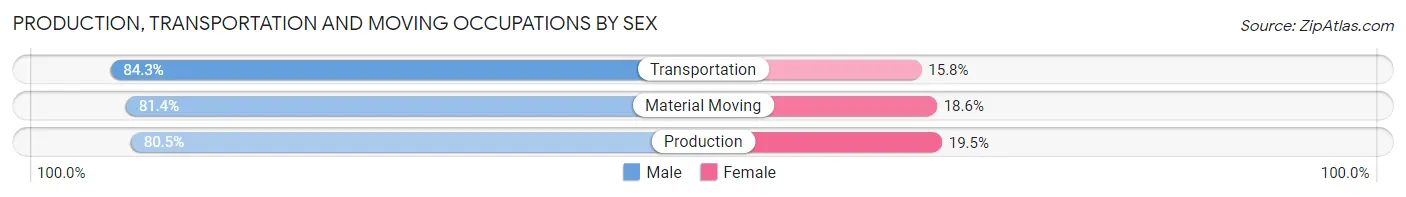
| Occupation | Male | Female |
| Production | 1,235 (80.5%) | 299 (19.5%) |
| Transportation | 1,733 (84.3%) | 324 (15.8%) |
| Material Moving | 1,096 (81.4%) | 250 (18.6%) |
| Total (Category) | 4,064 (82.3%) | 873 (17.7%) |
| Total (Overall) | 25,535 (55.7%) | 20,265 (44.3%) |
Employment Industries by Sex in Matanuska-Susitna Borough
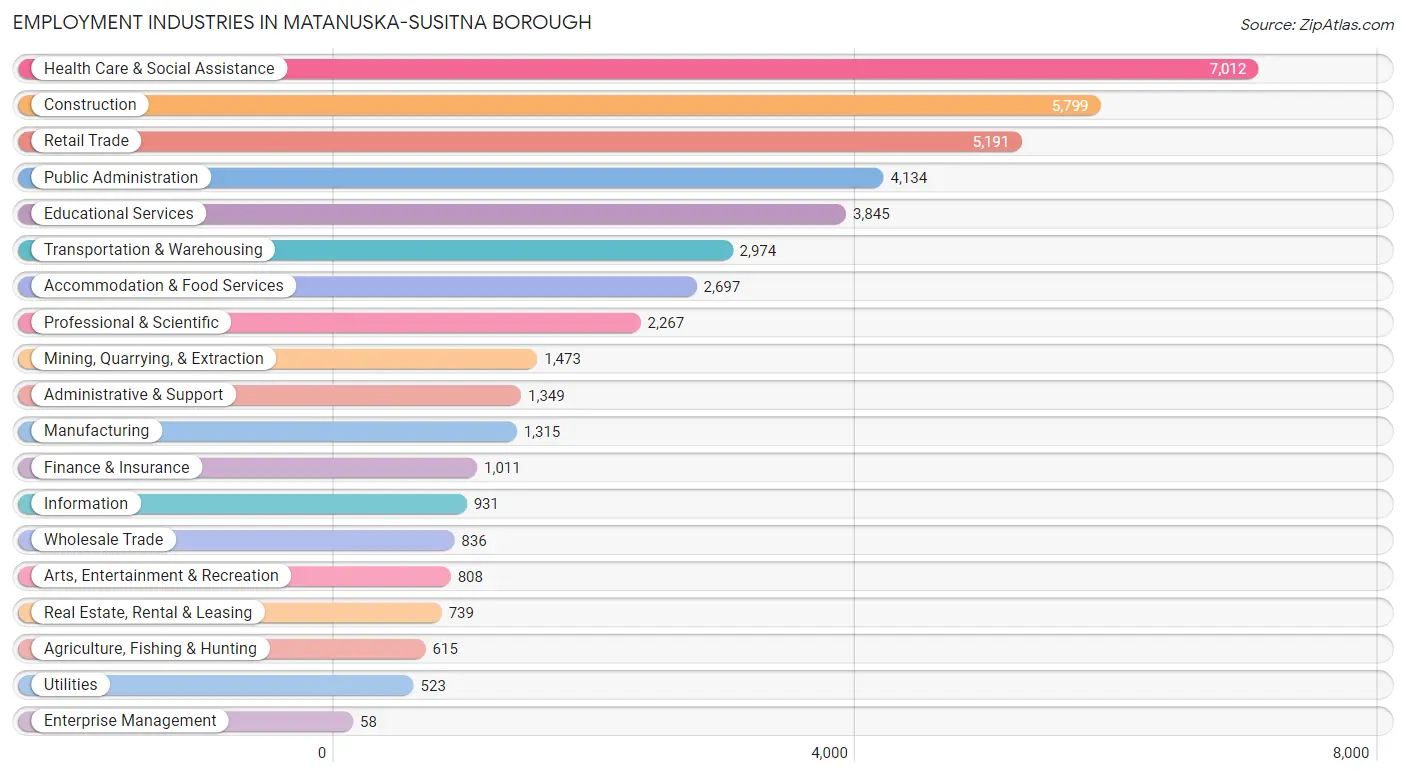
Employment Industries in Matanuska-Susitna Borough
The major employment industries in Matanuska-Susitna Borough include Health Care & Social Assistance (7,012 | 15.3%), Construction (5,799 | 12.7%), Retail Trade (5,191 | 11.3%), Public Administration (4,134 | 9.0%), and Educational Services (3,845 | 8.4%).
Employment Industries by Sex in Matanuska-Susitna Borough
The Matanuska-Susitna Borough industries that see more men than women are Mining, Quarrying, & Extraction (92.2%), Construction (86.8%), and Wholesale Trade (78.3%), whereas the industries that tend to have a higher number of women are Health Care & Social Assistance (76.7%), Finance & Insurance (67.1%), and Educational Services (65.8%).
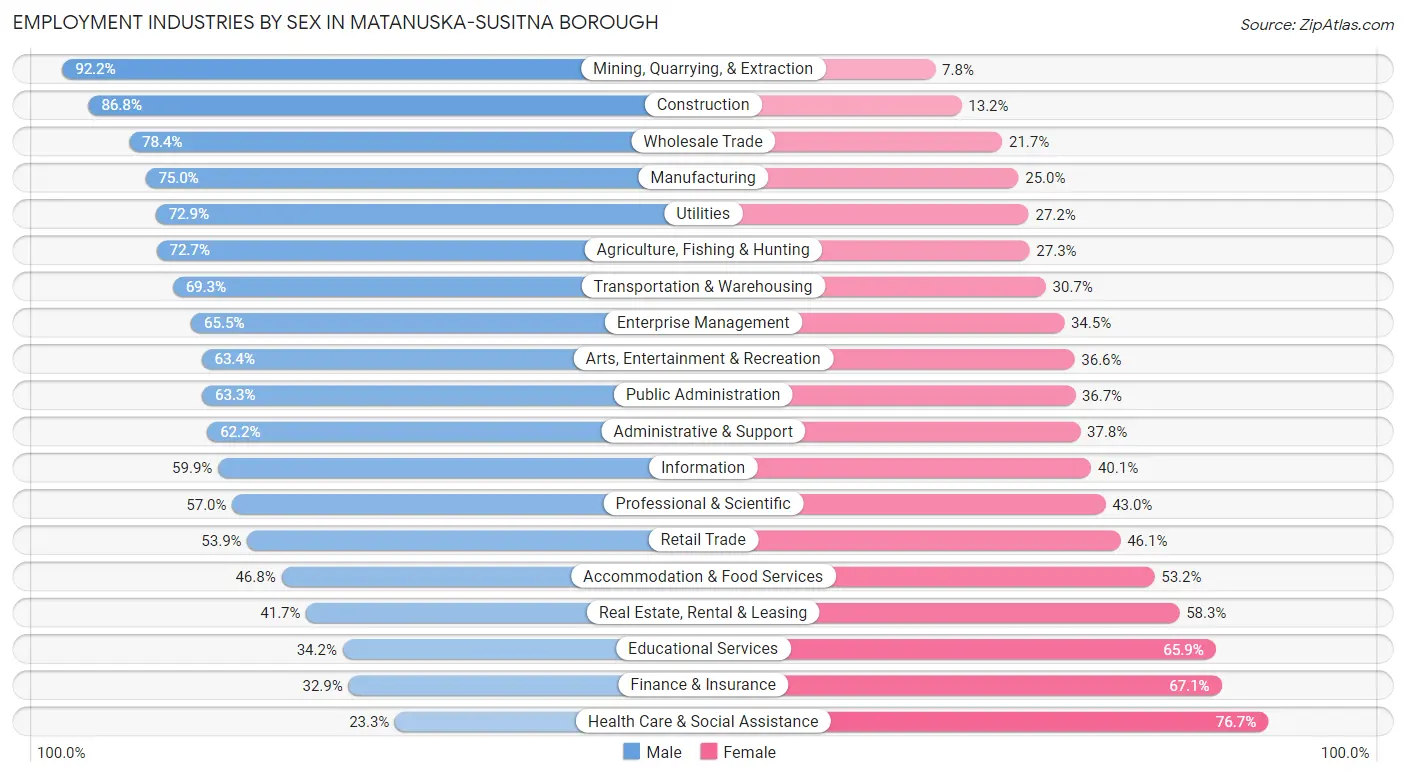
| Industry | Male | Female |
| Agriculture, Fishing & Hunting | 447 (72.7%) | 168 (27.3%) |
| Mining, Quarrying, & Extraction | 1,358 (92.2%) | 115 (7.8%) |
| Construction | 5,032 (86.8%) | 767 (13.2%) |
| Manufacturing | 986 (75.0%) | 329 (25.0%) |
| Wholesale Trade | 655 (78.3%) | 181 (21.6%) |
| Retail Trade | 2,797 (53.9%) | 2,394 (46.1%) |
| Transportation & Warehousing | 2,062 (69.3%) | 912 (30.7%) |
| Utilities | 381 (72.9%) | 142 (27.2%) |
| Information | 558 (59.9%) | 373 (40.1%) |
| Finance & Insurance | 333 (32.9%) | 678 (67.1%) |
| Real Estate, Rental & Leasing | 308 (41.7%) | 431 (58.3%) |
| Professional & Scientific | 1,292 (57.0%) | 975 (43.0%) |
| Enterprise Management | 38 (65.5%) | 20 (34.5%) |
| Administrative & Support | 839 (62.2%) | 510 (37.8%) |
| Educational Services | 1,313 (34.2%) | 2,532 (65.8%) |
| Health Care & Social Assistance | 1,633 (23.3%) | 5,379 (76.7%) |
| Arts, Entertainment & Recreation | 512 (63.4%) | 296 (36.6%) |
| Accommodation & Food Services | 1,263 (46.8%) | 1,434 (53.2%) |
| Public Administration | 2,615 (63.3%) | 1,519 (36.7%) |
| Total | 25,535 (55.7%) | 20,265 (44.3%) |
Education in Matanuska-Susitna Borough
School Enrollment in Matanuska-Susitna Borough
The most common levels of schooling among the 25,993 students in Matanuska-Susitna Borough are high school (6,524 | 25.1%), middle school (6,438 | 24.8%), and elementary school (6,185 | 23.8%).
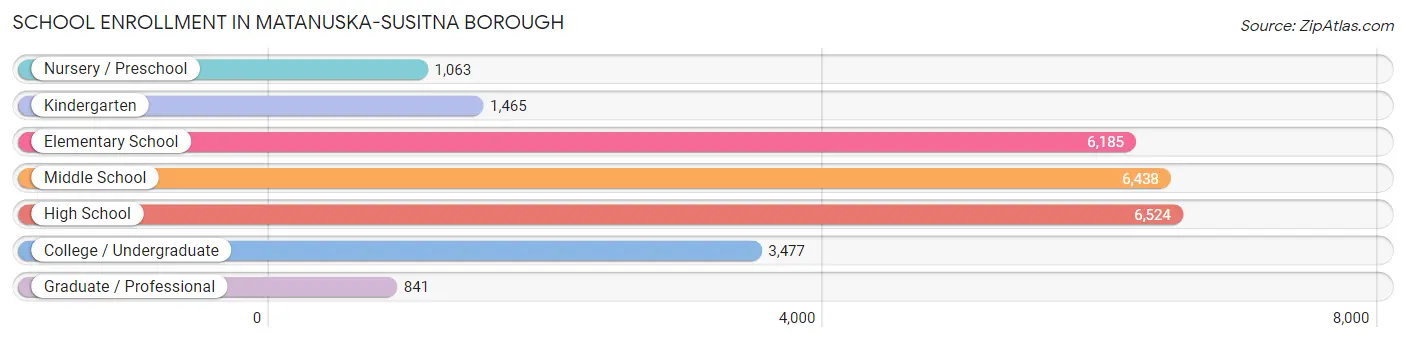
| School Level | # Students | % Students |
| Nursery / Preschool | 1,063 | 4.1% |
| Kindergarten | 1,465 | 5.6% |
| Elementary School | 6,185 | 23.8% |
| Middle School | 6,438 | 24.8% |
| High School | 6,524 | 25.1% |
| College / Undergraduate | 3,477 | 13.4% |
| Graduate / Professional | 841 | 3.2% |
| Total | 25,993 | 100.0% |
School Enrollment by Age by Funding Source in Matanuska-Susitna Borough
Out of a total of 25,993 students who are enrolled in schools in Matanuska-Susitna Borough, 4,575 (17.6%) attend a private institution, while the remaining 21,418 (82.4%) are enrolled in public schools. The age group of 3 to 4 year olds has the highest likelihood of being enrolled in private schools, with 295 (42.3% in the age bracket) enrolled. Conversely, the age group of 18 to 19 year olds has the lowest likelihood of being enrolled in a private school, with 1,214 (88.9% in the age bracket) attending a public institution.
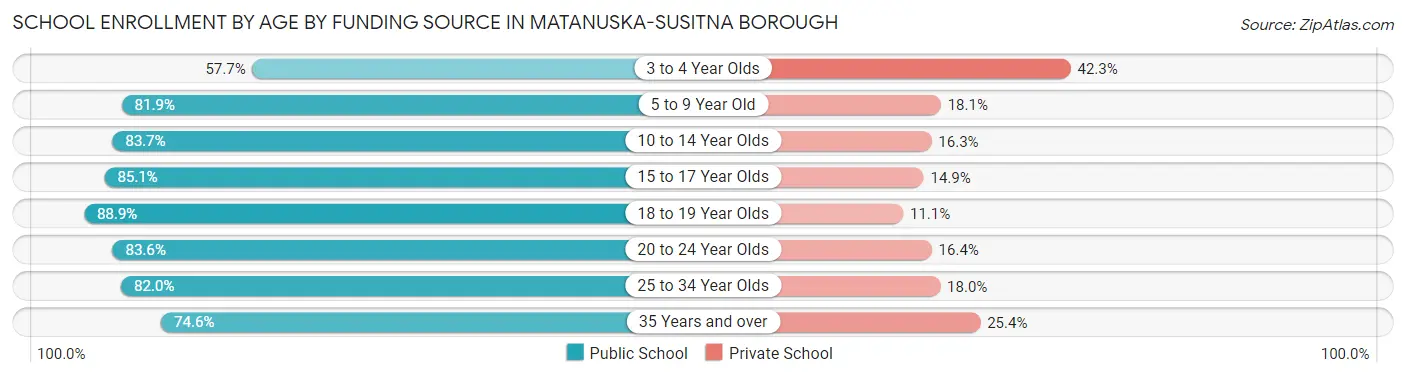
| Age Bracket | Public School | Private School |
| 3 to 4 Year Olds | 403 (57.7%) | 295 (42.3%) |
| 5 to 9 Year Old | 6,026 (81.9%) | 1,330 (18.1%) |
| 10 to 14 Year Olds | 6,703 (83.7%) | 1,309 (16.3%) |
| 15 to 17 Year Olds | 4,010 (85.1%) | 701 (14.9%) |
| 18 to 19 Year Olds | 1,214 (88.9%) | 151 (11.1%) |
| 20 to 24 Year Olds | 1,010 (83.6%) | 198 (16.4%) |
| 25 to 34 Year Olds | 1,004 (82.0%) | 220 (18.0%) |
| 35 Years and over | 1,058 (74.6%) | 361 (25.4%) |
| Total | 21,418 (82.4%) | 4,575 (17.6%) |
Educational Attainment by Field of Study in Matanuska-Susitna Borough
Education (2,993 | 16.7%), business (2,772 | 15.5%), science & technology (2,363 | 13.2%), arts & humanities (1,619 | 9.0%), and bio, nature & agricultural (1,325 | 7.4%) are the most common fields of study among 17,905 individuals in Matanuska-Susitna Borough who have obtained a bachelor's degree or higher.
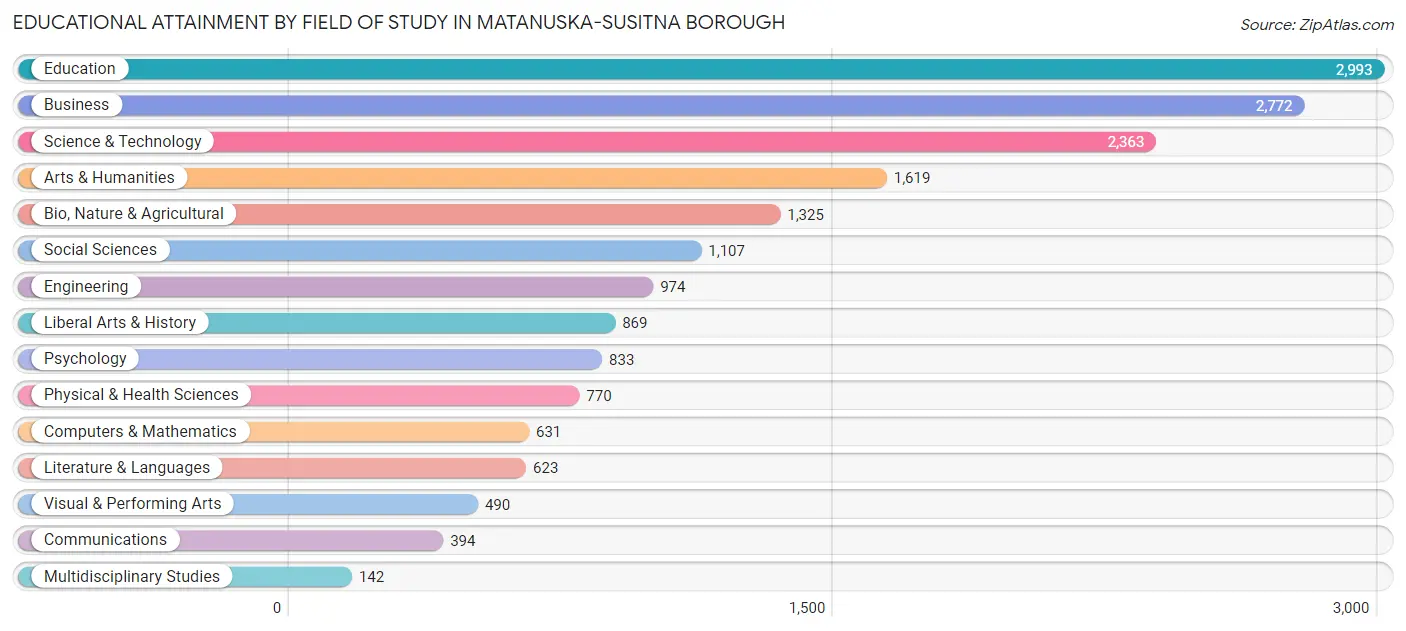
| Field of Study | # Graduates | % Graduates |
| Computers & Mathematics | 631 | 3.5% |
| Bio, Nature & Agricultural | 1,325 | 7.4% |
| Physical & Health Sciences | 770 | 4.3% |
| Psychology | 833 | 4.6% |
| Social Sciences | 1,107 | 6.2% |
| Engineering | 974 | 5.4% |
| Multidisciplinary Studies | 142 | 0.8% |
| Science & Technology | 2,363 | 13.2% |
| Business | 2,772 | 15.5% |
| Education | 2,993 | 16.7% |
| Literature & Languages | 623 | 3.5% |
| Liberal Arts & History | 869 | 4.9% |
| Visual & Performing Arts | 490 | 2.7% |
| Communications | 394 | 2.2% |
| Arts & Humanities | 1,619 | 9.0% |
| Total | 17,905 | 100.0% |
Transportation & Commute in Matanuska-Susitna Borough
Vehicle Availability by Sex in Matanuska-Susitna Borough
The most prevalent vehicle ownership categories in Matanuska-Susitna Borough are males with 2 vehicles (9,763, accounting for 37.7%) and females with 2 vehicles (7,321, making up 49.2%).
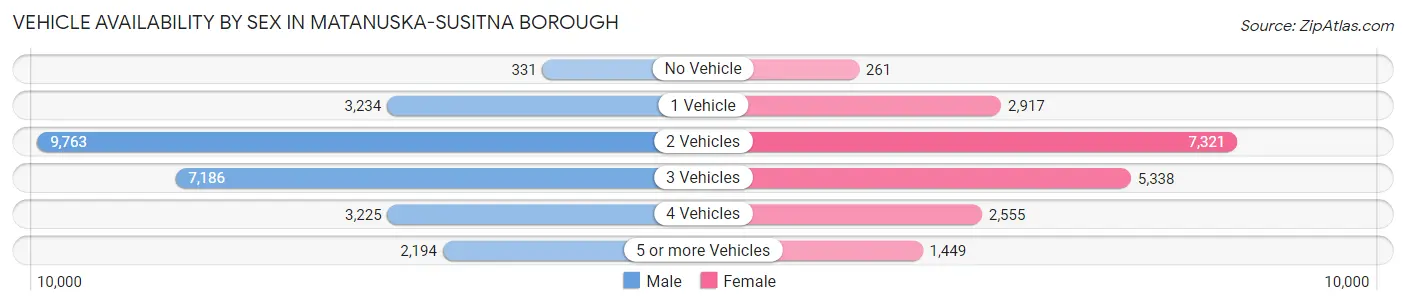
| Vehicles Available | Male | Female |
| No Vehicle | 331 (1.3%) | 261 (1.3%) |
| 1 Vehicle | 3,234 (12.5%) | 2,917 (14.7%) |
| 2 Vehicles | 9,763 (37.7%) | 7,321 (36.9%) |
| 3 Vehicles | 7,186 (27.7%) | 5,338 (26.9%) |
| 4 Vehicles | 3,225 (12.4%) | 2,555 (12.9%) |
| 5 or more Vehicles | 2,194 (8.5%) | 1,449 (7.3%) |
| Total | 25,933 (100.0%) | 19,841 (100.0%) |
Commute Time in Matanuska-Susitna Borough
The most frequently occuring commute durations in Matanuska-Susitna Borough are 15 to 19 minutes (5,792 commuters, 13.9%), 60 to 89 minutes (5,590 commuters, 13.5%), and 45 to 59 minutes (5,545 commuters, 13.3%).
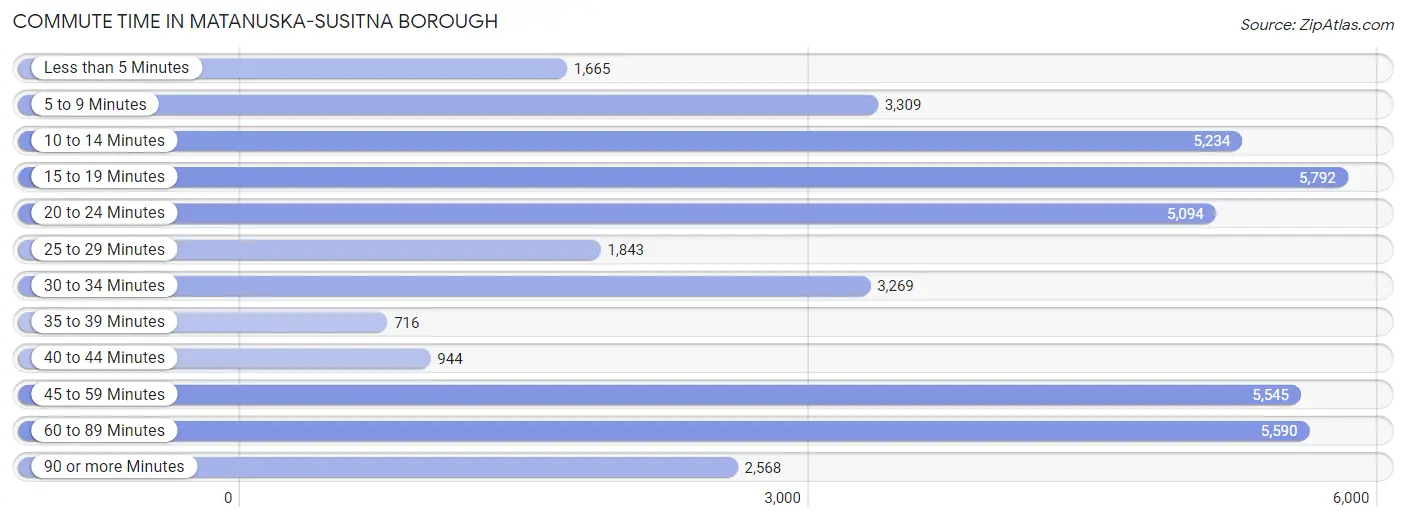
| Commute Time | # Commuters | % Commuters |
| Less than 5 Minutes | 1,665 | 4.0% |
| 5 to 9 Minutes | 3,309 | 8.0% |
| 10 to 14 Minutes | 5,234 | 12.6% |
| 15 to 19 Minutes | 5,792 | 13.9% |
| 20 to 24 Minutes | 5,094 | 12.2% |
| 25 to 29 Minutes | 1,843 | 4.4% |
| 30 to 34 Minutes | 3,269 | 7.9% |
| 35 to 39 Minutes | 716 | 1.7% |
| 40 to 44 Minutes | 944 | 2.3% |
| 45 to 59 Minutes | 5,545 | 13.3% |
| 60 to 89 Minutes | 5,590 | 13.5% |
| 90 or more Minutes | 2,568 | 6.2% |
Commute Time by Sex in Matanuska-Susitna Borough
The most common commute times in Matanuska-Susitna Borough are 60 to 89 minutes (4,045 commuters, 16.9%) for males and 10 to 14 minutes (2,833 commuters, 16.1%) for females.
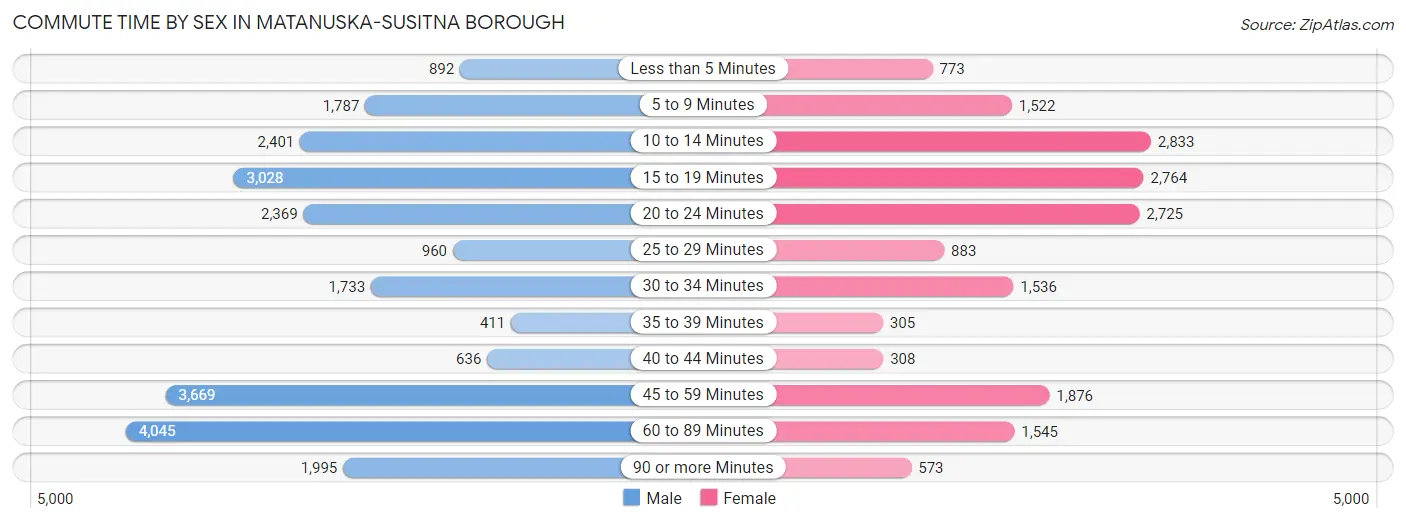
| Commute Time | Male | Female |
| Less than 5 Minutes | 892 (3.7%) | 773 (4.4%) |
| 5 to 9 Minutes | 1,787 (7.5%) | 1,522 (8.6%) |
| 10 to 14 Minutes | 2,401 (10.0%) | 2,833 (16.1%) |
| 15 to 19 Minutes | 3,028 (12.7%) | 2,764 (15.7%) |
| 20 to 24 Minutes | 2,369 (9.9%) | 2,725 (15.4%) |
| 25 to 29 Minutes | 960 (4.0%) | 883 (5.0%) |
| 30 to 34 Minutes | 1,733 (7.2%) | 1,536 (8.7%) |
| 35 to 39 Minutes | 411 (1.7%) | 305 (1.7%) |
| 40 to 44 Minutes | 636 (2.7%) | 308 (1.8%) |
| 45 to 59 Minutes | 3,669 (15.3%) | 1,876 (10.6%) |
| 60 to 89 Minutes | 4,045 (16.9%) | 1,545 (8.8%) |
| 90 or more Minutes | 1,995 (8.3%) | 573 (3.3%) |
Time of Departure to Work by Sex in Matanuska-Susitna Borough
The most frequent times of departure to work in Matanuska-Susitna Borough are 7:00 AM to 7:29 AM (3,313, 13.9%) for males and 7:00 AM to 7:29 AM (2,554, 14.5%) for females.
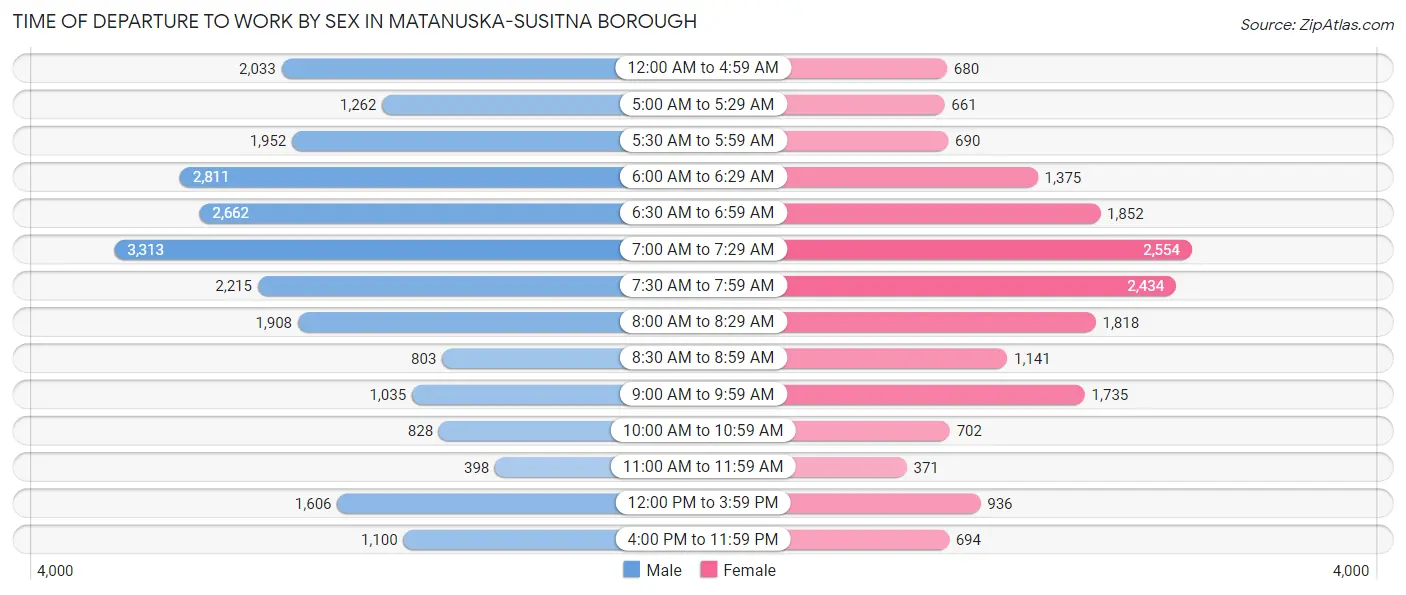
| Time of Departure | Male | Female |
| 12:00 AM to 4:59 AM | 2,033 (8.5%) | 680 (3.8%) |
| 5:00 AM to 5:29 AM | 1,262 (5.3%) | 661 (3.7%) |
| 5:30 AM to 5:59 AM | 1,952 (8.2%) | 690 (3.9%) |
| 6:00 AM to 6:29 AM | 2,811 (11.7%) | 1,375 (7.8%) |
| 6:30 AM to 6:59 AM | 2,662 (11.1%) | 1,852 (10.5%) |
| 7:00 AM to 7:29 AM | 3,313 (13.9%) | 2,554 (14.5%) |
| 7:30 AM to 7:59 AM | 2,215 (9.3%) | 2,434 (13.8%) |
| 8:00 AM to 8:29 AM | 1,908 (8.0%) | 1,818 (10.3%) |
| 8:30 AM to 8:59 AM | 803 (3.4%) | 1,141 (6.5%) |
| 9:00 AM to 9:59 AM | 1,035 (4.3%) | 1,735 (9.8%) |
| 10:00 AM to 10:59 AM | 828 (3.5%) | 702 (4.0%) |
| 11:00 AM to 11:59 AM | 398 (1.7%) | 371 (2.1%) |
| 12:00 PM to 3:59 PM | 1,606 (6.7%) | 936 (5.3%) |
| 4:00 PM to 11:59 PM | 1,100 (4.6%) | 694 (3.9%) |
| Total | 23,926 (100.0%) | 17,643 (100.0%) |
Housing Occupancy in Matanuska-Susitna Borough
Occupancy by Ownership in Matanuska-Susitna Borough
Of the total 39,290 dwellings in Matanuska-Susitna Borough, owner-occupied units account for 30,043 (76.5%), while renter-occupied units make up 9,247 (23.5%).
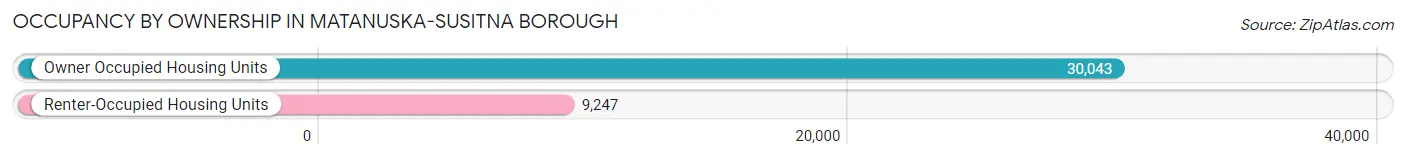
| Occupancy | # Housing Units | % Housing Units |
| Owner Occupied Housing Units | 30,043 | 76.5% |
| Renter-Occupied Housing Units | 9,247 | 23.5% |
| Total Occupied Housing Units | 39,290 | 100.0% |
Occupancy by Household Size in Matanuska-Susitna Borough
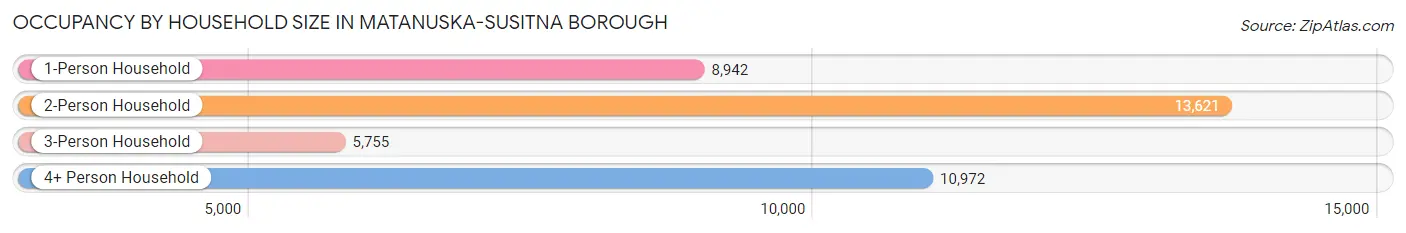
| Household Size | # Housing Units | % Housing Units |
| 1-Person Household | 8,942 | 22.8% |
| 2-Person Household | 13,621 | 34.7% |
| 3-Person Household | 5,755 | 14.6% |
| 4+ Person Household | 10,972 | 27.9% |
| Total Housing Units | 39,290 | 100.0% |
Occupancy by Ownership by Household Size in Matanuska-Susitna Borough
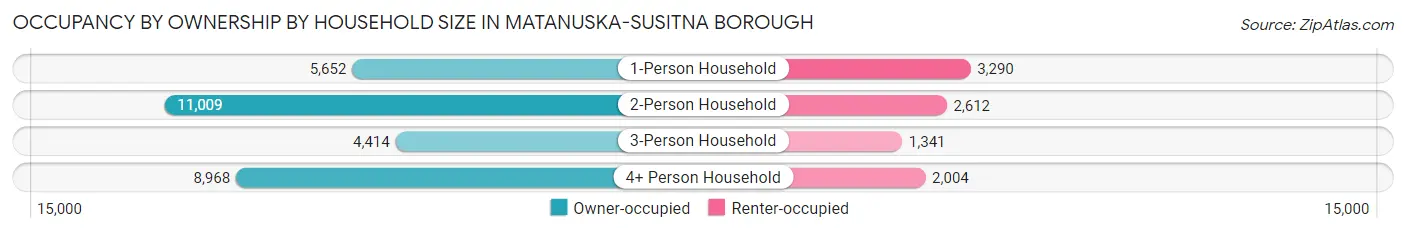
| Household Size | Owner-occupied | Renter-occupied |
| 1-Person Household | 5,652 (63.2%) | 3,290 (36.8%) |
| 2-Person Household | 11,009 (80.8%) | 2,612 (19.2%) |
| 3-Person Household | 4,414 (76.7%) | 1,341 (23.3%) |
| 4+ Person Household | 8,968 (81.7%) | 2,004 (18.3%) |
| Total Housing Units | 30,043 (76.5%) | 9,247 (23.5%) |
Occupancy by Educational Attainment in Matanuska-Susitna Borough
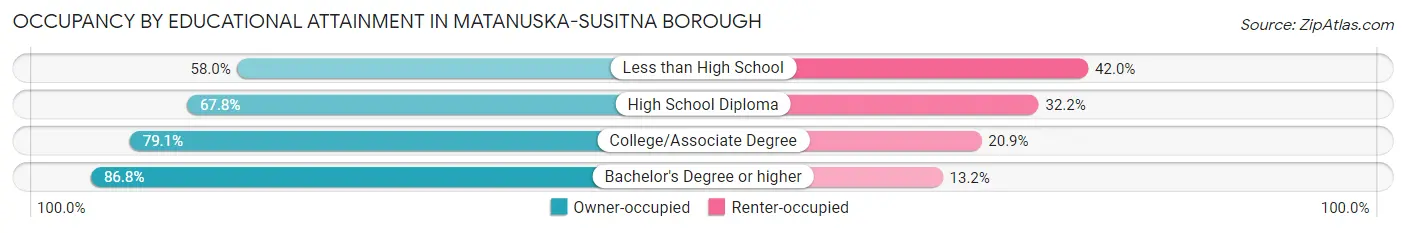
| Household Size | Owner-occupied | Renter-occupied |
| Less than High School | 1,258 (58.0%) | 912 (42.0%) |
| High School Diploma | 8,123 (67.8%) | 3,857 (32.2%) |
| College/Associate Degree | 12,015 (79.1%) | 3,167 (20.9%) |
| Bachelor's Degree or higher | 8,647 (86.8%) | 1,311 (13.2%) |
Occupancy by Age of Householder in Matanuska-Susitna Borough
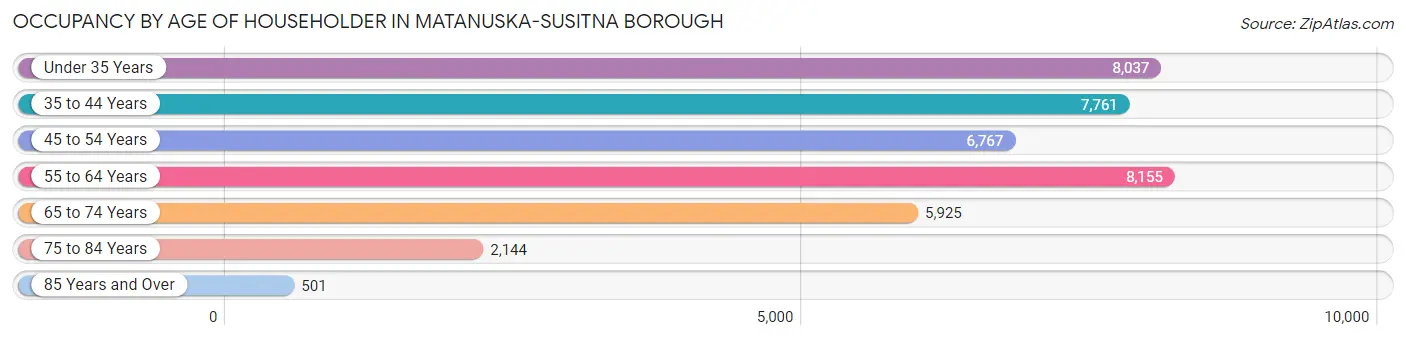
| Age Bracket | # Households | % Households |
| Under 35 Years | 8,037 | 20.5% |
| 35 to 44 Years | 7,761 | 19.8% |
| 45 to 54 Years | 6,767 | 17.2% |
| 55 to 64 Years | 8,155 | 20.8% |
| 65 to 74 Years | 5,925 | 15.1% |
| 75 to 84 Years | 2,144 | 5.5% |
| 85 Years and Over | 501 | 1.3% |
| Total | 39,290 | 100.0% |
Housing Finances in Matanuska-Susitna Borough
Median Income by Occupancy in Matanuska-Susitna Borough
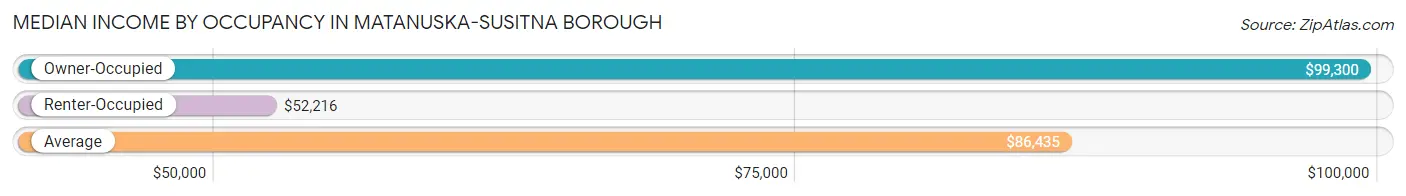
| Occupancy Type | # Households | Median Income |
| Owner-Occupied | 30,043 (76.5%) | $99,300 |
| Renter-Occupied | 9,247 (23.5%) | $52,216 |
| Average | 39,290 (100.0%) | $86,435 |
Occupancy by Householder Income Bracket in Matanuska-Susitna Borough
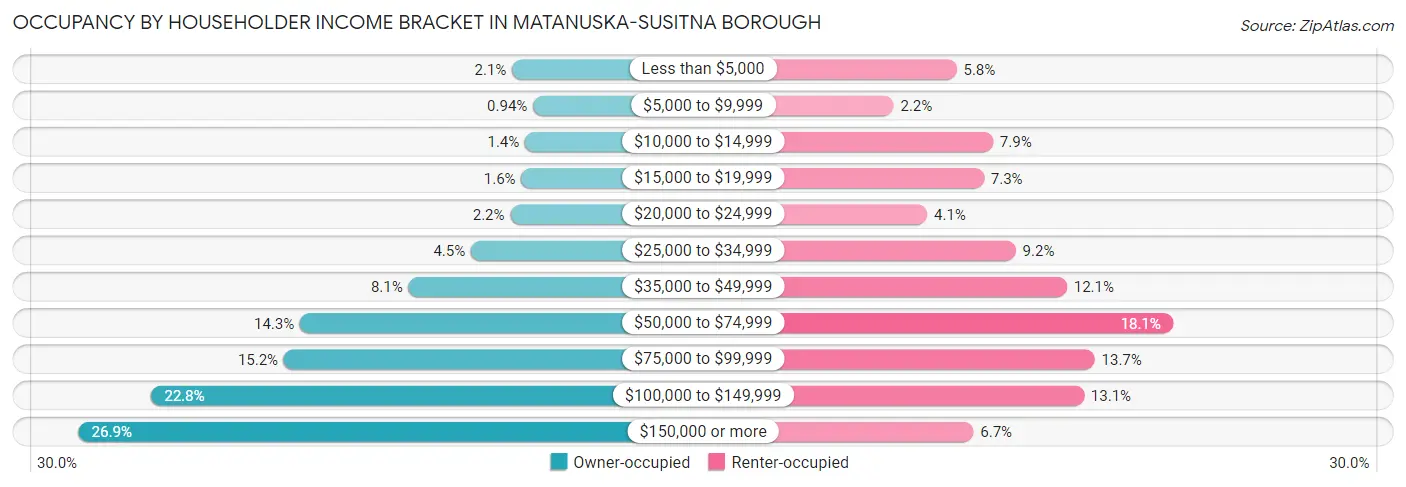
| Income Bracket | Owner-occupied | Renter-occupied |
| Less than $5,000 | 643 (2.1%) | 534 (5.8%) |
| $5,000 to $9,999 | 281 (0.9%) | 201 (2.2%) |
| $10,000 to $14,999 | 422 (1.4%) | 726 (7.9%) |
| $15,000 to $19,999 | 485 (1.6%) | 678 (7.3%) |
| $20,000 to $24,999 | 672 (2.2%) | 378 (4.1%) |
| $25,000 to $34,999 | 1,349 (4.5%) | 846 (9.1%) |
| $35,000 to $49,999 | 2,420 (8.1%) | 1,116 (12.1%) |
| $50,000 to $74,999 | 4,285 (14.3%) | 1,676 (18.1%) |
| $75,000 to $99,999 | 4,562 (15.2%) | 1,263 (13.7%) |
| $100,000 to $149,999 | 6,838 (22.8%) | 1,207 (13.1%) |
| $150,000 or more | 8,086 (26.9%) | 622 (6.7%) |
| Total | 30,043 (100.0%) | 9,247 (100.0%) |
Monthly Housing Cost Tiers in Matanuska-Susitna Borough
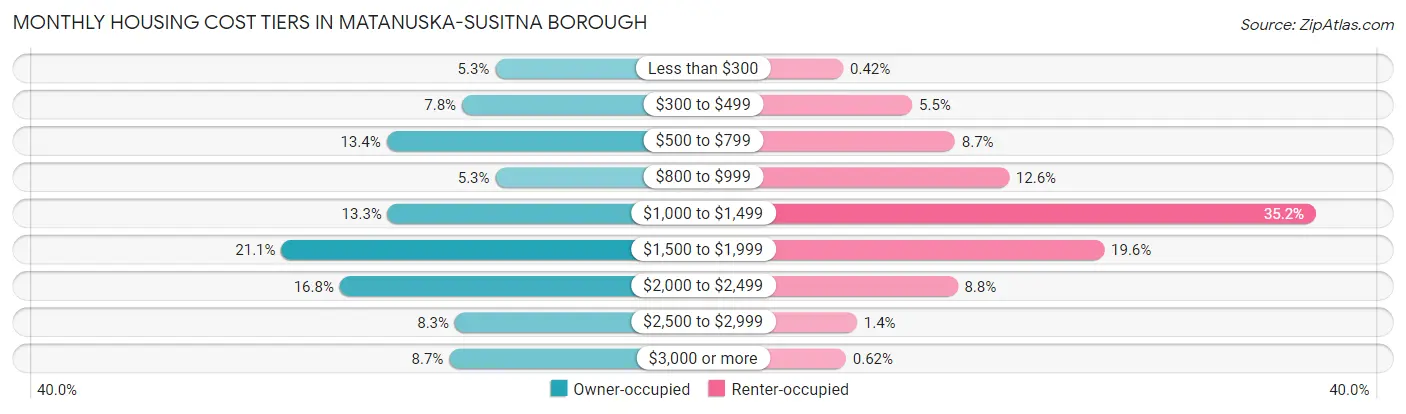
| Monthly Cost | Owner-occupied | Renter-occupied |
| Less than $300 | 1,604 (5.3%) | 39 (0.4%) |
| $300 to $499 | 2,341 (7.8%) | 509 (5.5%) |
| $500 to $799 | 4,012 (13.4%) | 800 (8.6%) |
| $800 to $999 | 1,601 (5.3%) | 1,168 (12.6%) |
| $1,000 to $1,499 | 3,983 (13.3%) | 3,259 (35.2%) |
| $1,500 to $1,999 | 6,336 (21.1%) | 1,816 (19.6%) |
| $2,000 to $2,499 | 5,044 (16.8%) | 817 (8.8%) |
| $2,500 to $2,999 | 2,498 (8.3%) | 132 (1.4%) |
| $3,000 or more | 2,624 (8.7%) | 57 (0.6%) |
| Total | 30,043 (100.0%) | 9,247 (100.0%) |
Physical Housing Characteristics in Matanuska-Susitna Borough
Housing Structures in Matanuska-Susitna Borough
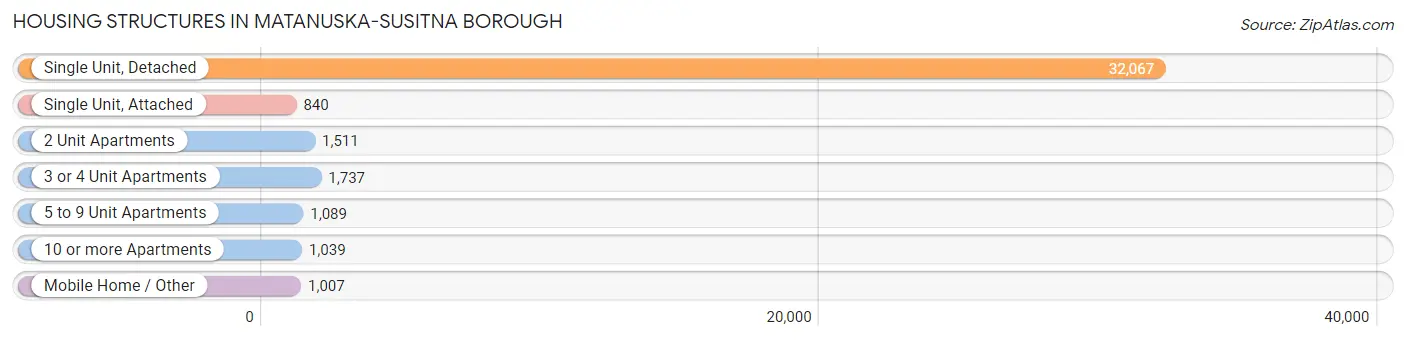
| Structure Type | # Housing Units | % Housing Units |
| Single Unit, Detached | 32,067 | 81.6% |
| Single Unit, Attached | 840 | 2.1% |
| 2 Unit Apartments | 1,511 | 3.8% |
| 3 or 4 Unit Apartments | 1,737 | 4.4% |
| 5 to 9 Unit Apartments | 1,089 | 2.8% |
| 10 or more Apartments | 1,039 | 2.6% |
| Mobile Home / Other | 1,007 | 2.6% |
| Total | 39,290 | 100.0% |
Housing Structures by Occupancy in Matanuska-Susitna Borough
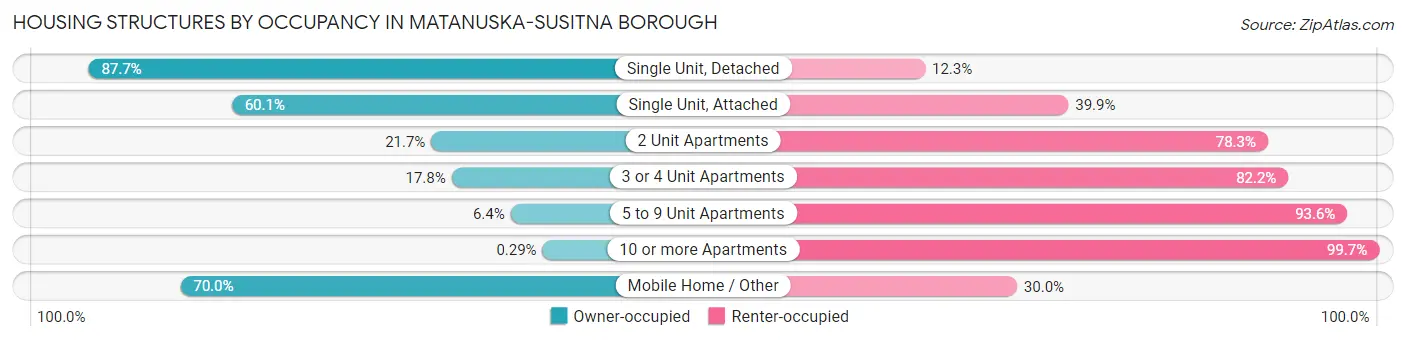
| Structure Type | Owner-occupied | Renter-occupied |
| Single Unit, Detached | 28,123 (87.7%) | 3,944 (12.3%) |
| Single Unit, Attached | 505 (60.1%) | 335 (39.9%) |
| 2 Unit Apartments | 328 (21.7%) | 1,183 (78.3%) |
| 3 or 4 Unit Apartments | 309 (17.8%) | 1,428 (82.2%) |
| 5 to 9 Unit Apartments | 70 (6.4%) | 1,019 (93.6%) |
| 10 or more Apartments | 3 (0.3%) | 1,036 (99.7%) |
| Mobile Home / Other | 705 (70.0%) | 302 (30.0%) |
| Total | 30,043 (76.5%) | 9,247 (23.5%) |
Housing Structures by Number of Rooms in Matanuska-Susitna Borough
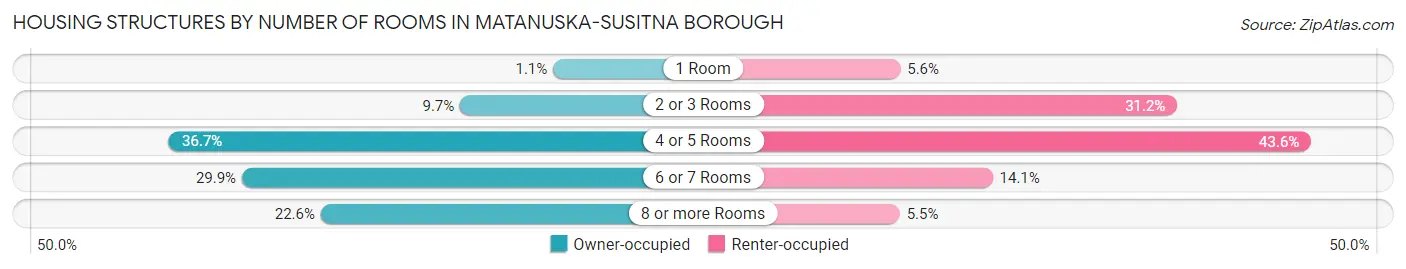
| Number of Rooms | Owner-occupied | Renter-occupied |
| 1 Room | 336 (1.1%) | 516 (5.6%) |
| 2 or 3 Rooms | 2,920 (9.7%) | 2,884 (31.2%) |
| 4 or 5 Rooms | 11,010 (36.6%) | 4,030 (43.6%) |
| 6 or 7 Rooms | 8,983 (29.9%) | 1,306 (14.1%) |
| 8 or more Rooms | 6,794 (22.6%) | 511 (5.5%) |
| Total | 30,043 (100.0%) | 9,247 (100.0%) |
Housing Structure by Heating Type in Matanuska-Susitna Borough
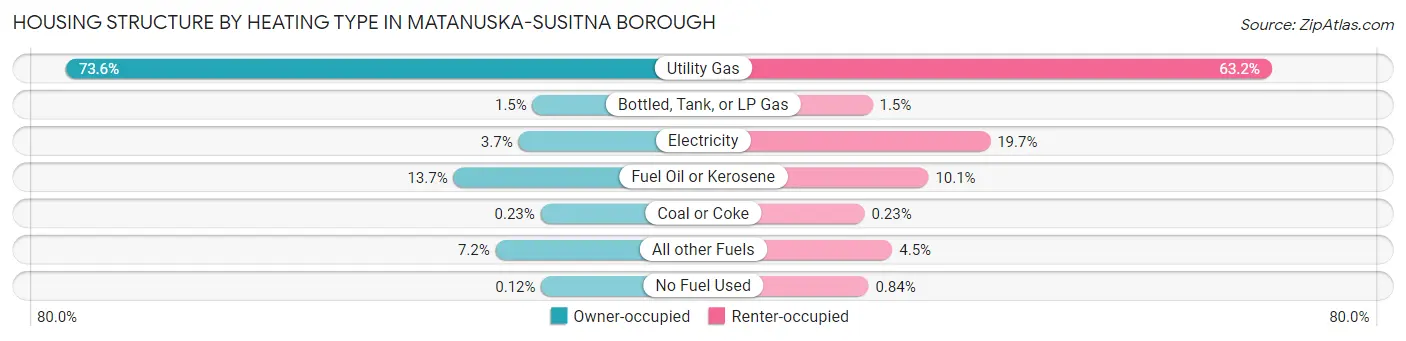
| Heating Type | Owner-occupied | Renter-occupied |
| Utility Gas | 22,122 (73.6%) | 5,840 (63.2%) |
| Bottled, Tank, or LP Gas | 442 (1.5%) | 136 (1.5%) |
| Electricity | 1,098 (3.6%) | 1,818 (19.7%) |
| Fuel Oil or Kerosene | 4,116 (13.7%) | 935 (10.1%) |
| Coal or Coke | 69 (0.2%) | 21 (0.2%) |
| All other Fuels | 2,159 (7.2%) | 419 (4.5%) |
| No Fuel Used | 37 (0.1%) | 78 (0.8%) |
| Total | 30,043 (100.0%) | 9,247 (100.0%) |
Household Vehicle Usage in Matanuska-Susitna Borough
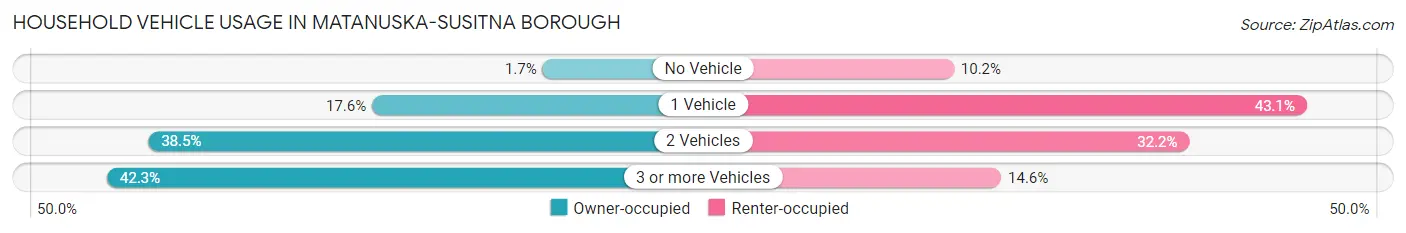
| Vehicles per Household | Owner-occupied | Renter-occupied |
| No Vehicle | 495 (1.7%) | 940 (10.2%) |
| 1 Vehicle | 5,280 (17.6%) | 3,986 (43.1%) |
| 2 Vehicles | 11,554 (38.5%) | 2,973 (32.2%) |
| 3 or more Vehicles | 12,714 (42.3%) | 1,348 (14.6%) |
| Total | 30,043 (100.0%) | 9,247 (100.0%) |
Real Estate & Mortgages in Matanuska-Susitna Borough
Real Estate and Mortgage Overview in Matanuska-Susitna Borough
| Characteristic | Without Mortgage | With Mortgage |
| Housing Units | 9,849 | 20,194 |
| Median Property Value | $254,000 | $317,200 |
| Median Household Income | $72,874 | $6,358 |
| Monthly Housing Costs | $572 | $2,624 |
| Real Estate Taxes | $2,611 | $1,630 |
Property Value by Mortgage Status in Matanuska-Susitna Borough
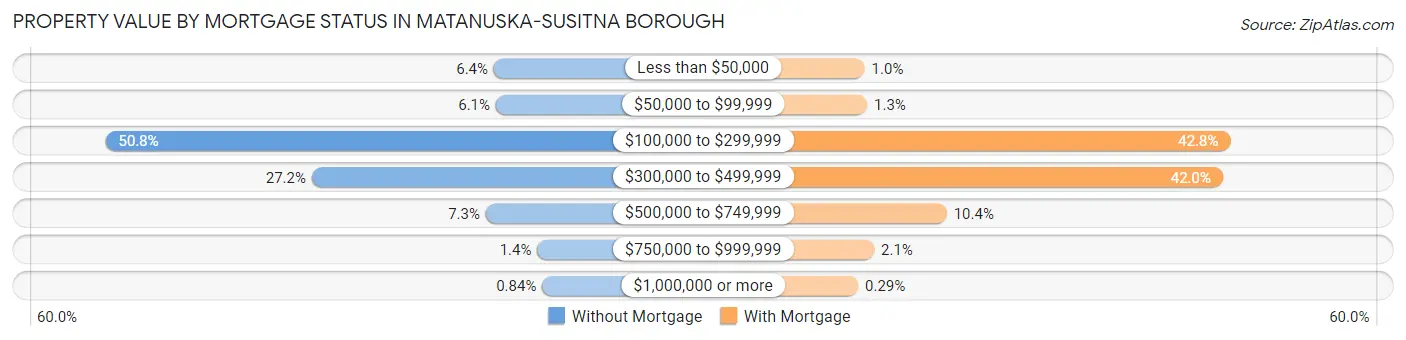
| Property Value | Without Mortgage | With Mortgage |
| Less than $50,000 | 627 (6.4%) | 211 (1.0%) |
| $50,000 to $99,999 | 605 (6.1%) | 267 (1.3%) |
| $100,000 to $299,999 | 5,000 (50.8%) | 8,650 (42.8%) |
| $300,000 to $499,999 | 2,677 (27.2%) | 8,475 (42.0%) |
| $500,000 to $749,999 | 718 (7.3%) | 2,104 (10.4%) |
| $750,000 to $999,999 | 139 (1.4%) | 429 (2.1%) |
| $1,000,000 or more | 83 (0.8%) | 58 (0.3%) |
| Total | 9,849 (100.0%) | 20,194 (100.0%) |
Household Income by Mortgage Status in Matanuska-Susitna Borough
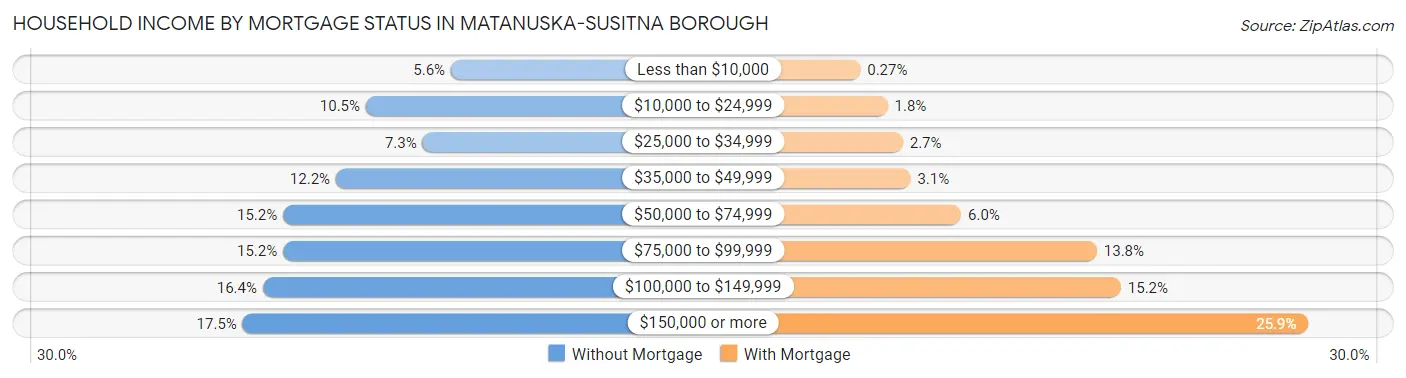
| Household Income | Without Mortgage | With Mortgage |
| Less than $10,000 | 555 (5.6%) | 54 (0.3%) |
| $10,000 to $24,999 | 1,034 (10.5%) | 369 (1.8%) |
| $25,000 to $34,999 | 715 (7.3%) | 545 (2.7%) |
| $35,000 to $49,999 | 1,203 (12.2%) | 634 (3.1%) |
| $50,000 to $74,999 | 1,500 (15.2%) | 1,217 (6.0%) |
| $75,000 to $99,999 | 1,500 (15.2%) | 2,785 (13.8%) |
| $100,000 to $149,999 | 1,614 (16.4%) | 3,062 (15.2%) |
| $150,000 or more | 1,728 (17.5%) | 5,224 (25.9%) |
| Total | 9,849 (100.0%) | 20,194 (100.0%) |
Property Value to Household Income Ratio in Matanuska-Susitna Borough
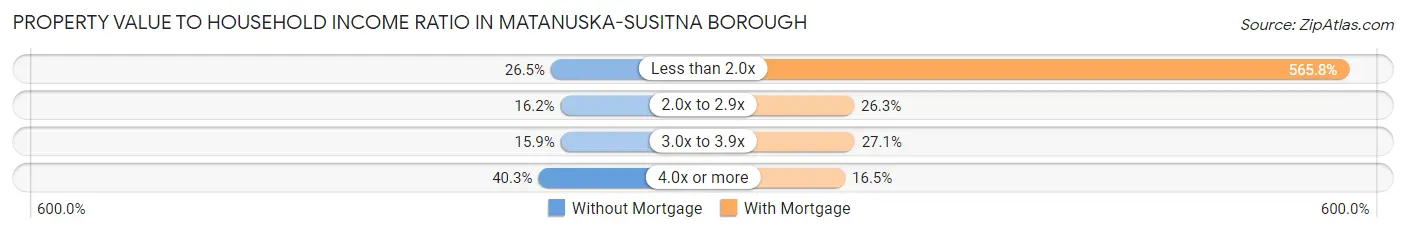
| Value-to-Income Ratio | Without Mortgage | With Mortgage |
| Less than 2.0x | 2,613 (26.5%) | 114,261 (565.8%) |
| 2.0x to 2.9x | 1,592 (16.2%) | 5,314 (26.3%) |
| 3.0x to 3.9x | 1,568 (15.9%) | 5,467 (27.1%) |
| 4.0x or more | 3,972 (40.3%) | 3,341 (16.5%) |
| Total | 9,849 (100.0%) | 20,194 (100.0%) |
Real Estate Taxes by Mortgage Status in Matanuska-Susitna Borough
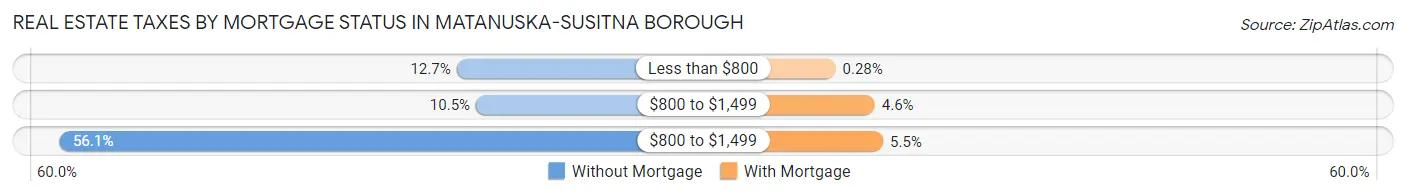
| Property Taxes | Without Mortgage | With Mortgage |
| Less than $800 | 1,248 (12.7%) | 57 (0.3%) |
| $800 to $1,499 | 1,038 (10.5%) | 924 (4.6%) |
| $800 to $1,499 | 5,527 (56.1%) | 1,108 (5.5%) |
| Total | 9,849 (100.0%) | 20,194 (100.0%) |
Health & Disability in Matanuska-Susitna Borough
Health Insurance Coverage by Age in Matanuska-Susitna Borough
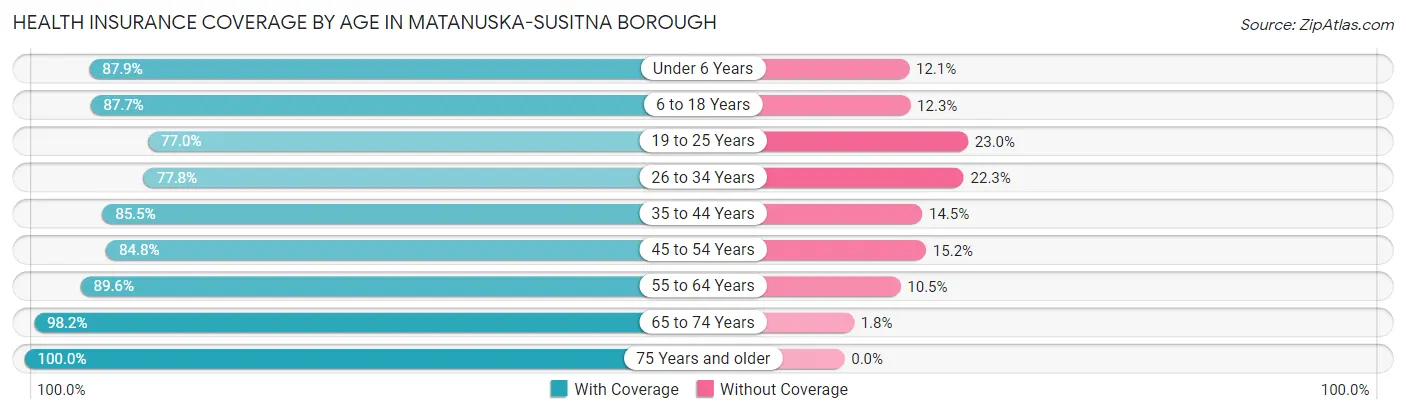
| Age Bracket | With Coverage | Without Coverage |
| Under 6 Years | 7,473 (87.9%) | 1,027 (12.1%) |
| 6 to 18 Years | 18,538 (87.7%) | 2,596 (12.3%) |
| 19 to 25 Years | 6,496 (77.0%) | 1,945 (23.0%) |
| 26 to 34 Years | 10,163 (77.7%) | 2,909 (22.3%) |
| 35 to 44 Years | 12,299 (85.5%) | 2,085 (14.5%) |
| 45 to 54 Years | 10,524 (84.8%) | 1,889 (15.2%) |
| 55 to 64 Years | 12,278 (89.5%) | 1,433 (10.4%) |
| 65 to 74 Years | 9,413 (98.2%) | 169 (1.8%) |
| 75 Years and older | 4,290 (100.0%) | 0 (0.0%) |
| Total | 91,474 (86.7%) | 14,053 (13.3%) |
Health Insurance Coverage by Citizenship Status in Matanuska-Susitna Borough
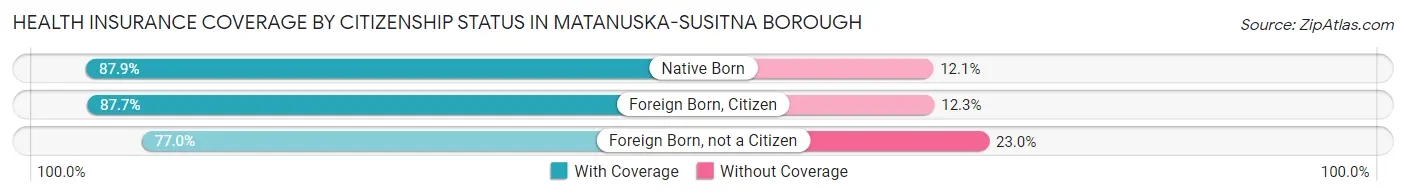
| Citizenship Status | With Coverage | Without Coverage |
| Native Born | 7,473 (87.9%) | 1,027 (12.1%) |
| Foreign Born, Citizen | 18,538 (87.7%) | 2,596 (12.3%) |
| Foreign Born, not a Citizen | 6,496 (77.0%) | 1,945 (23.0%) |
Health Insurance Coverage by Household Income in Matanuska-Susitna Borough
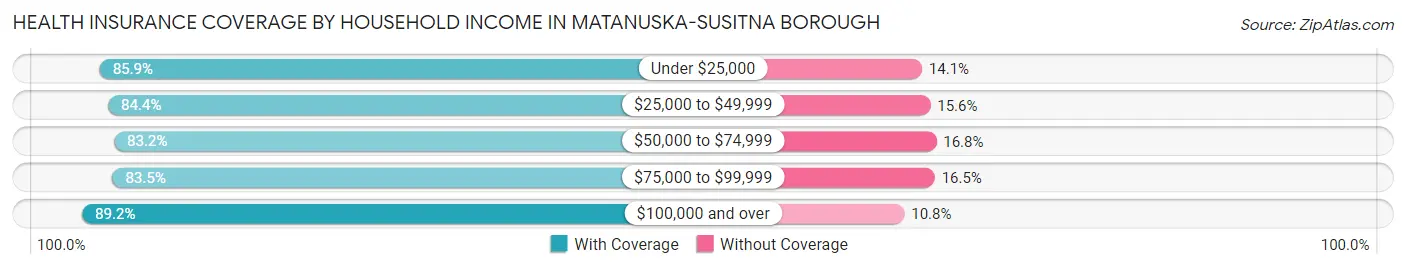
| Household Income | With Coverage | Without Coverage |
| Under $25,000 | 7,440 (85.9%) | 1,219 (14.1%) |
| $25,000 to $49,999 | 10,012 (84.4%) | 1,856 (15.6%) |
| $50,000 to $74,999 | 11,914 (83.2%) | 2,399 (16.8%) |
| $75,000 to $99,999 | 13,707 (83.5%) | 2,702 (16.5%) |
| $100,000 and over | 48,021 (89.2%) | 5,805 (10.8%) |
Public vs Private Health Insurance Coverage by Age in Matanuska-Susitna Borough
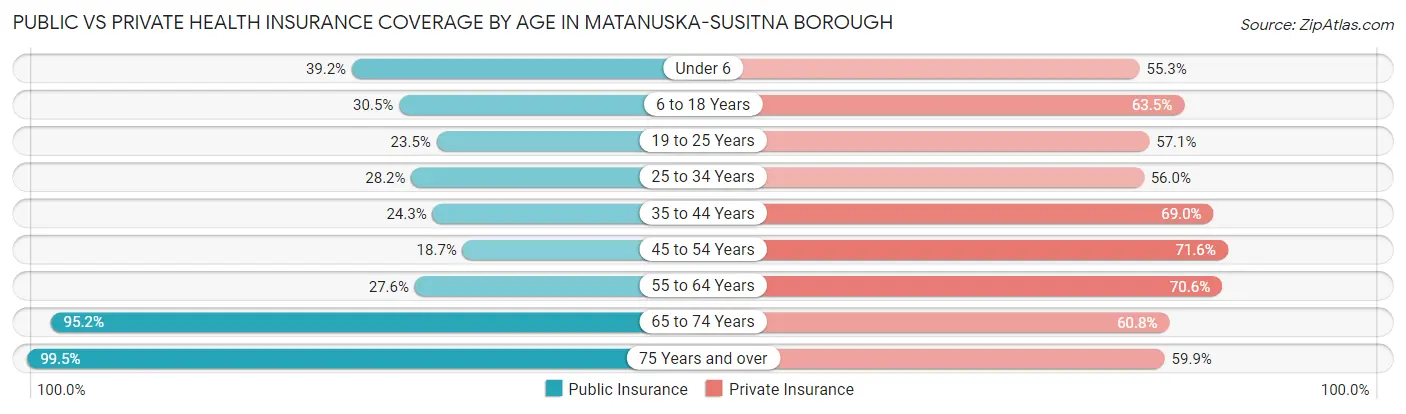
| Age Bracket | Public Insurance | Private Insurance |
| Under 6 | 3,335 (39.2%) | 4,698 (55.3%) |
| 6 to 18 Years | 6,441 (30.5%) | 13,422 (63.5%) |
| 19 to 25 Years | 1,985 (23.5%) | 4,818 (57.1%) |
| 25 to 34 Years | 3,687 (28.2%) | 7,325 (56.0%) |
| 35 to 44 Years | 3,494 (24.3%) | 9,921 (69.0%) |
| 45 to 54 Years | 2,320 (18.7%) | 8,889 (71.6%) |
| 55 to 64 Years | 3,782 (27.6%) | 9,675 (70.6%) |
| 65 to 74 Years | 9,119 (95.2%) | 5,823 (60.8%) |
| 75 Years and over | 4,269 (99.5%) | 2,571 (59.9%) |
| Total | 38,432 (36.4%) | 67,142 (63.6%) |
Disability Status by Sex by Age in Matanuska-Susitna Borough
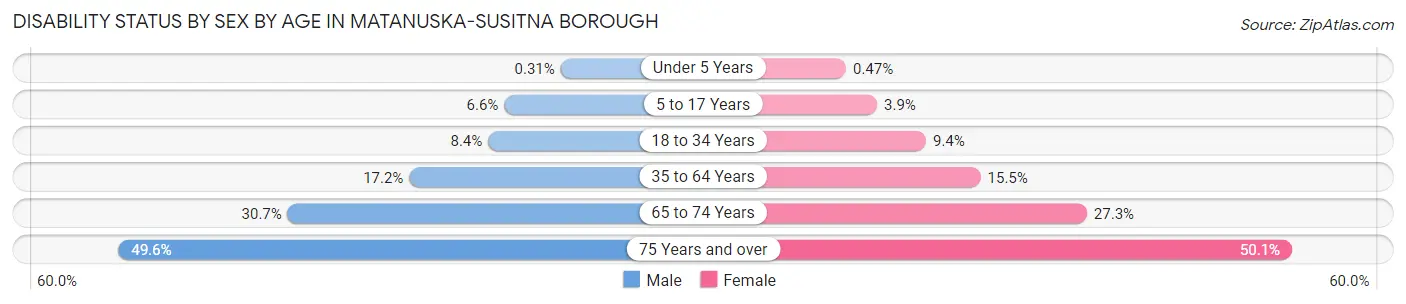
| Age Bracket | Male | Female |
| Under 5 Years | 11 (0.3%) | 16 (0.5%) |
| 5 to 17 Years | 728 (6.6%) | 405 (3.9%) |
| 18 to 34 Years | 993 (8.4%) | 1,026 (9.4%) |
| 35 to 64 Years | 3,543 (17.2%) | 3,072 (15.5%) |
| 65 to 74 Years | 1,480 (30.7%) | 1,300 (27.3%) |
| 75 Years and over | 1,003 (49.6%) | 1,136 (50.1%) |
Disability Class by Sex by Age in Matanuska-Susitna Borough
Disability Class: Hearing Difficulty
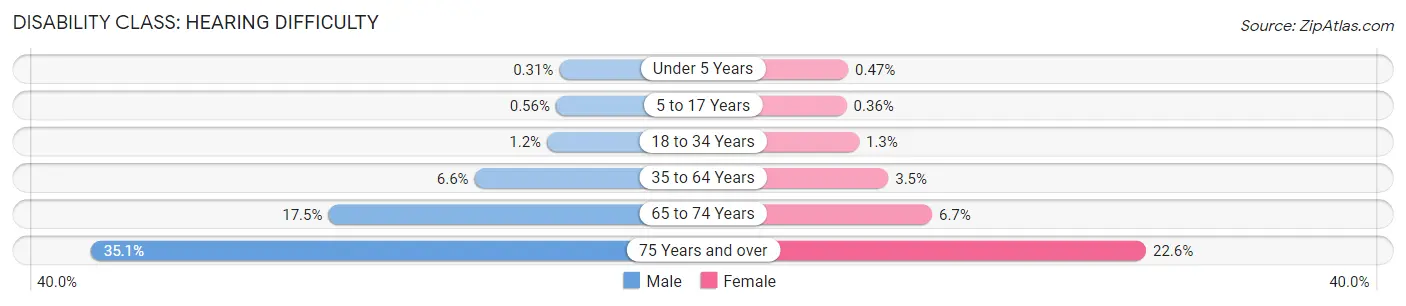
| Age Bracket | Male | Female |
| Under 5 Years | 11 (0.3%) | 16 (0.5%) |
| 5 to 17 Years | 62 (0.6%) | 37 (0.4%) |
| 18 to 34 Years | 144 (1.2%) | 140 (1.3%) |
| 35 to 64 Years | 1,362 (6.6%) | 686 (3.5%) |
| 65 to 74 Years | 841 (17.4%) | 319 (6.7%) |
| 75 Years and over | 710 (35.1%) | 512 (22.6%) |
Disability Class: Vision Difficulty
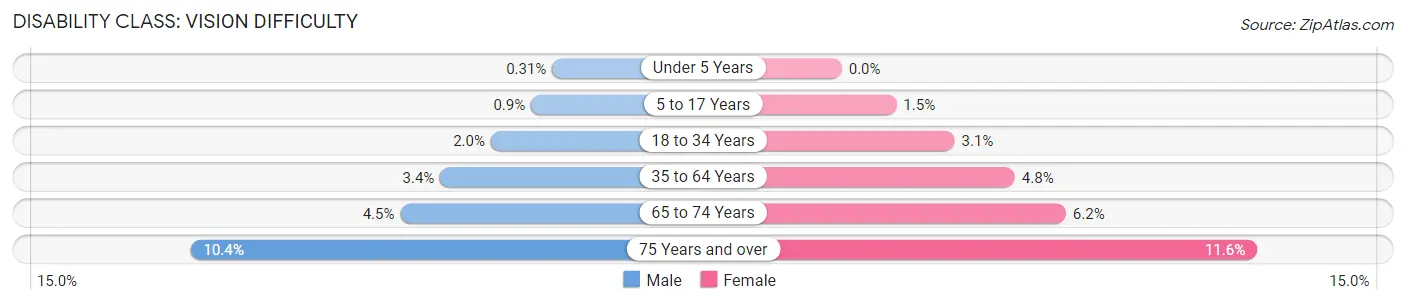
| Age Bracket | Male | Female |
| Under 5 Years | 11 (0.3%) | 0 (0.0%) |
| 5 to 17 Years | 99 (0.9%) | 156 (1.5%) |
| 18 to 34 Years | 239 (2.0%) | 343 (3.1%) |
| 35 to 64 Years | 707 (3.4%) | 957 (4.8%) |
| 65 to 74 Years | 219 (4.5%) | 297 (6.2%) |
| 75 Years and over | 210 (10.4%) | 262 (11.6%) |
Disability Class: Cognitive Difficulty
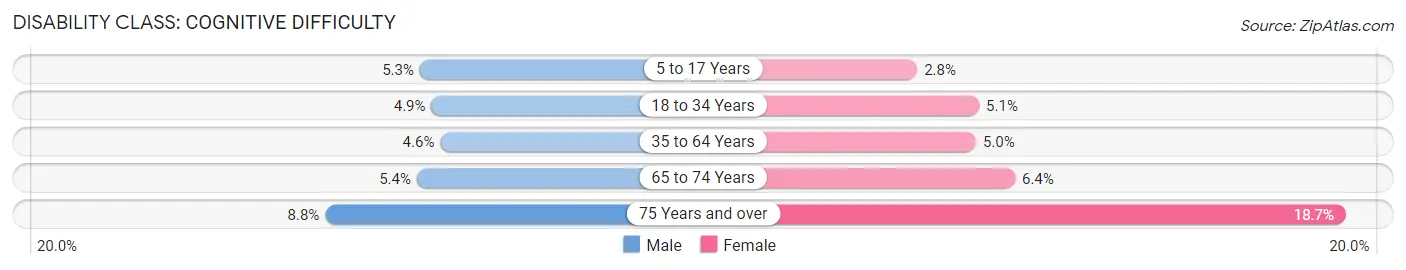
| Age Bracket | Male | Female |
| 5 to 17 Years | 589 (5.3%) | 288 (2.8%) |
| 18 to 34 Years | 580 (4.9%) | 558 (5.1%) |
| 35 to 64 Years | 944 (4.6%) | 989 (5.0%) |
| 65 to 74 Years | 262 (5.4%) | 306 (6.4%) |
| 75 Years and over | 179 (8.8%) | 424 (18.7%) |
Disability Class: Ambulatory Difficulty
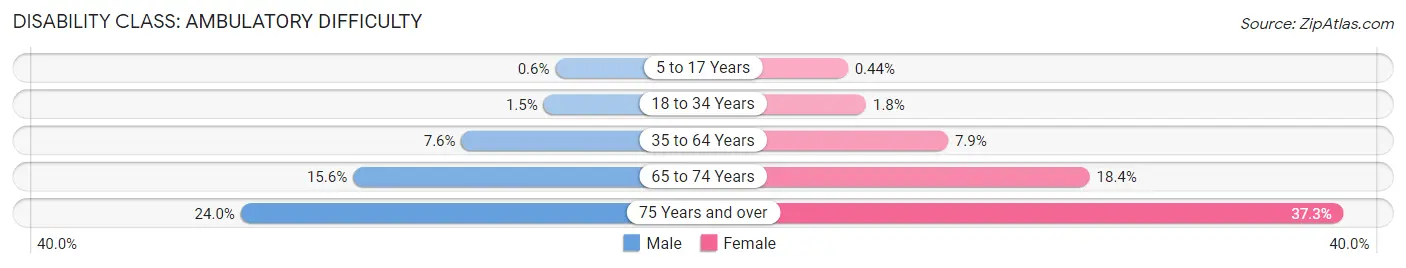
| Age Bracket | Male | Female |
| 5 to 17 Years | 66 (0.6%) | 45 (0.4%) |
| 18 to 34 Years | 174 (1.5%) | 197 (1.8%) |
| 35 to 64 Years | 1,562 (7.6%) | 1,566 (7.9%) |
| 65 to 74 Years | 753 (15.6%) | 876 (18.4%) |
| 75 Years and over | 485 (24.0%) | 844 (37.2%) |
Disability Class: Self-Care Difficulty
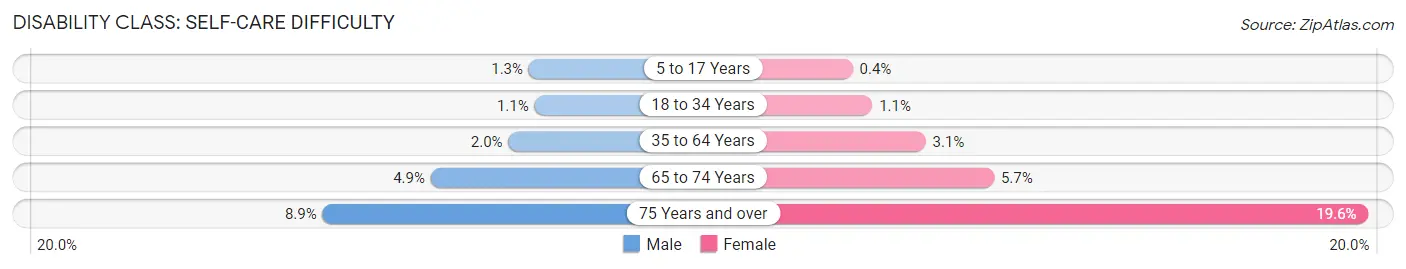
| Age Bracket | Male | Female |
| 5 to 17 Years | 141 (1.3%) | 41 (0.4%) |
| 18 to 34 Years | 127 (1.1%) | 124 (1.1%) |
| 35 to 64 Years | 421 (2.0%) | 619 (3.1%) |
| 65 to 74 Years | 237 (4.9%) | 269 (5.7%) |
| 75 Years and over | 181 (8.9%) | 443 (19.6%) |
Technology Access in Matanuska-Susitna Borough
Computing Device Access in Matanuska-Susitna Borough
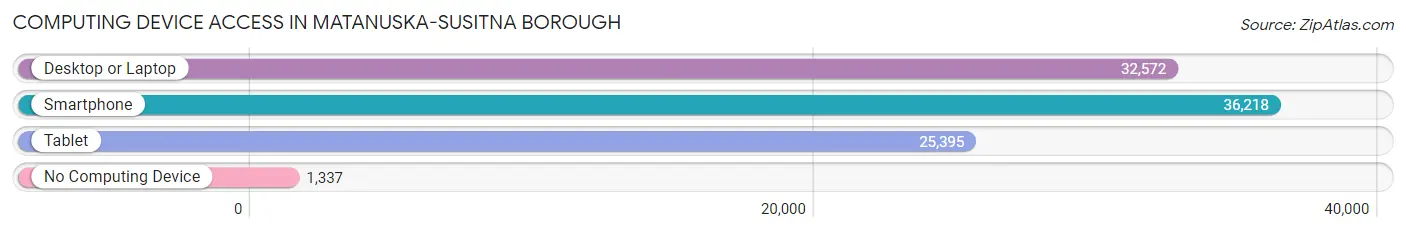
| Device Type | # Households | % Households |
| Desktop or Laptop | 32,572 | 82.9% |
| Smartphone | 36,218 | 92.2% |
| Tablet | 25,395 | 64.6% |
| No Computing Device | 1,337 | 3.4% |
| Total | 39,290 | 100.0% |
Internet Access in Matanuska-Susitna Borough
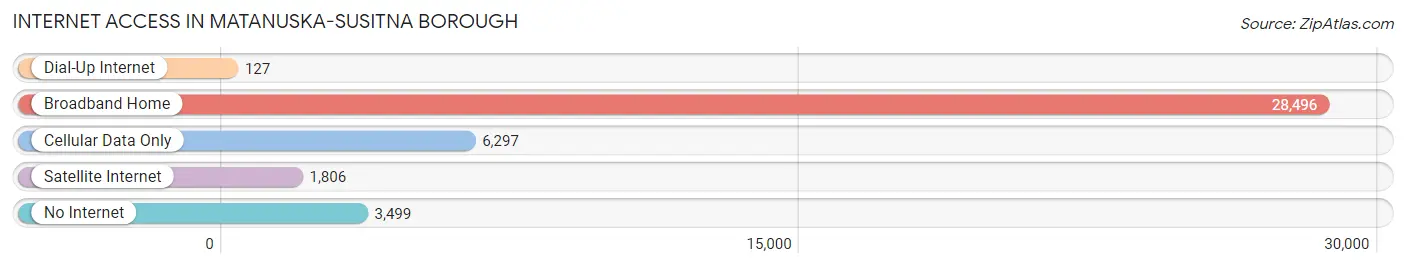
| Internet Type | # Households | % Households |
| Dial-Up Internet | 127 | 0.3% |
| Broadband Home | 28,496 | 72.5% |
| Cellular Data Only | 6,297 | 16.0% |
| Satellite Internet | 1,806 | 4.6% |
| No Internet | 3,499 | 8.9% |
| Total | 39,290 | 100.0% |
Matanuska-Susitna Borough Summary
Matanuska-Susitna Borough, AK is a borough located in the south-central region of Alaska. It is the largest borough in the state, covering an area of 25,258 square miles. The borough is home to over 100,000 people, making it the second most populous borough in Alaska. The borough is bordered by the Chugach National Forest to the east, the Talkeetna Mountains to the south, and the Alaska Range to the west.
History
The Matanuska-Susitna Borough was established in 1964, when the Alaska Legislature passed the Matanuska-Susitna Borough Act. The act created the borough from the Matanuska and Susitna Valleys, which had previously been part of the Anchorage Borough. The Matanuska-Susitna Borough was the first borough in Alaska to be created by the state legislature.
The Matanuska-Susitna Valley has a long history of human habitation. The area was first inhabited by the Dena’ina Athabascan people, who lived in the area for thousands of years. In the early 1900s, the area was settled by homesteaders from the Lower 48 states, who were part of the Matanuska Colony. The colony was established by the federal government in 1935, as part of the New Deal. The colonists were given free land and supplies, and were encouraged to develop the area.
Geography
The Matanuska-Susitna Borough is located in south-central Alaska, and covers an area of 25,258 square miles. The borough is bordered by the Chugach National Forest to the east, the Talkeetna Mountains to the south, and the Alaska Range to the west. The borough is home to numerous rivers, lakes, and glaciers, including the Matanuska River, the Susitna River, and the Knik Glacier.
The borough is divided into two distinct regions: the Matanuska Valley and the Susitna Valley. The Matanuska Valley is located in the northern part of the borough, and is home to the cities of Palmer and Wasilla. The Susitna Valley is located in the southern part of the borough, and is home to the cities of Talkeetna and Willow.
Economy
The economy of the Matanuska-Susitna Borough is largely based on natural resources. The borough is home to numerous oil and gas fields, as well as gold, silver, and copper mines. The borough is also home to numerous timber and fishing industries.
The borough is also home to numerous agricultural operations, including dairy farms, vegetable farms, and berry farms. The borough is also home to numerous tourist attractions, including Denali National Park and the Alaska Wildlife Conservation Center.
Demographics
As of the 2010 census, the population of the Matanuska-Susitna Borough was 100,715. The population is largely white (83.3%), with smaller percentages of Native American (7.2%), Asian (3.2%), and African American (1.2%) residents. The median household income in the borough is $68,845, and the median home value is $219,400. The unemployment rate in the borough is 6.2%.
Common Questions
What is the Total Population of Matanuska-Susitna Borough?
Total Population of Matanuska-Susitna Borough is 108,661.
What is the Total Male Population of Matanuska-Susitna Borough?
Total Male Population of Matanuska-Susitna Borough is 56,811.
What is the Total Female Population of Matanuska-Susitna Borough?
Total Female Population of Matanuska-Susitna Borough is 51,850.
What is the Ratio of Males per 100 Females in Matanuska-Susitna Borough?
There are 109.57 Males per 100 Females in Matanuska-Susitna Borough.
What is the Ratio of Females per 100 Males in Matanuska-Susitna Borough?
There are 91.27 Females per 100 Males in Matanuska-Susitna Borough.
What is the Median Population Age in Matanuska-Susitna Borough?
Median Population Age in Matanuska-Susitna Borough is 36.3 Years.
What is the Average Family Size in Matanuska-Susitna Borough
Average Family Size in Matanuska-Susitna Borough is 3.2 People.
What is the Average Household Size in Matanuska-Susitna Borough
Average Household Size in Matanuska-Susitna Borough is 2.7 People.
What is Per Capita Income in Matanuska-Susitna Borough?
Per Capita income in Matanuska-Susitna Borough is $39,201.
What is the Median Family Income in Matanuska-Susitna Borough?
Median Family Income in Matanuska-Susitna Borough is $100,753.
What is the Median Household income in Matanuska-Susitna Borough?
Median Household Income in Matanuska-Susitna Borough is $86,435.
What is Income or Wage Gap in Matanuska-Susitna Borough?
Income or Wage Gap in Matanuska-Susitna Borough is 32.8%.
Women in Matanuska-Susitna Borough earn 67.2 cents for every dollar earned by a man.
What is Family Income Deficit in Matanuska-Susitna Borough?
Family Income Deficit in Matanuska-Susitna Borough is $11,572.
Families that are below poverty line in Matanuska-Susitna Borough earn $11,572 less on average than the poverty threshold level.
What is Inequality or Gini Index in Matanuska-Susitna Borough?
Inequality or Gini Index in Matanuska-Susitna Borough is 0.42.
How Large is the Labor Force in Matanuska-Susitna Borough?
There are 50,375 People in the Labor Forcein in Matanuska-Susitna Borough.
What is the Percentage of People in the Labor Force in Matanuska-Susitna Borough?
60.3% of People are in the Labor Force in Matanuska-Susitna Borough.
What is the Unemployment Rate in Matanuska-Susitna Borough?
Unemployment Rate in Matanuska-Susitna Borough is 7.0%.