Lake and Peninsula Borough, AK
Lake and Peninsula Borough Map
Lake and Peninsula Borough Overview
999
TOTAL POPULATION
508
MALE POPULATION
491
FEMALE POPULATION
103.46
MALES / 100 FEMALES
96.65
FEMALES / 100 MALES
33.6
MEDIAN AGE
3.0
AVG FAMILY SIZE
2.6
AVG HOUSEHOLD SIZE
$39,409
PER CAPITA INCOME
$64,875
AVG FAMILY INCOME
$61,607
AVG HOUSEHOLD INCOME
56.4%
WAGE / INCOME GAP [ % ]
43.6¢/ $1
WAGE / INCOME GAP [ $ ]
0.39
INEQUALITY / GINI INDEX
567
LABOR FORCE [ PEOPLE ]
74.3%
PERCENT IN LABOR FORCE
14.0%
UNEMPLOYMENT RATE
Lake and Peninsula Borough Area Codes
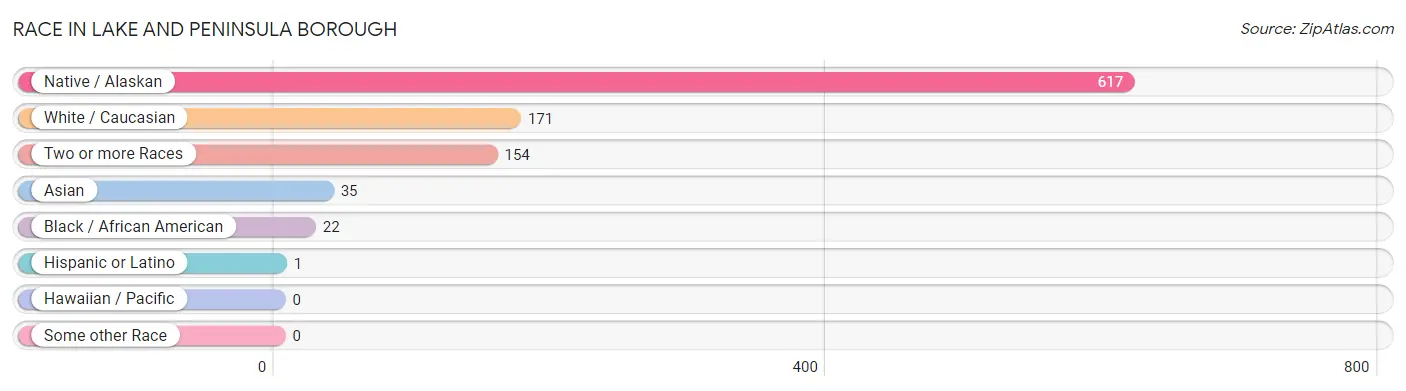
Race in Lake and Peninsula Borough
The most populous races in Lake and Peninsula Borough are Native / Alaskan (617 | 61.8%), White / Caucasian (171 | 17.1%), and Two or more Races (154 | 15.4%).
| Race | # Population | % Population |
| Asian | 35 | 3.5% |
| Black / African American | 22 | 2.2% |
| Hawaiian / Pacific | 0 | 0.0% |
| Hispanic or Latino | 1 | 0.1% |
| Native / Alaskan | 617 | 61.8% |
| White / Caucasian | 171 | 17.1% |
| Two or more Races | 154 | 15.4% |
| Some other Race | 0 | 0.0% |
| Total | 999 | 100.0% |
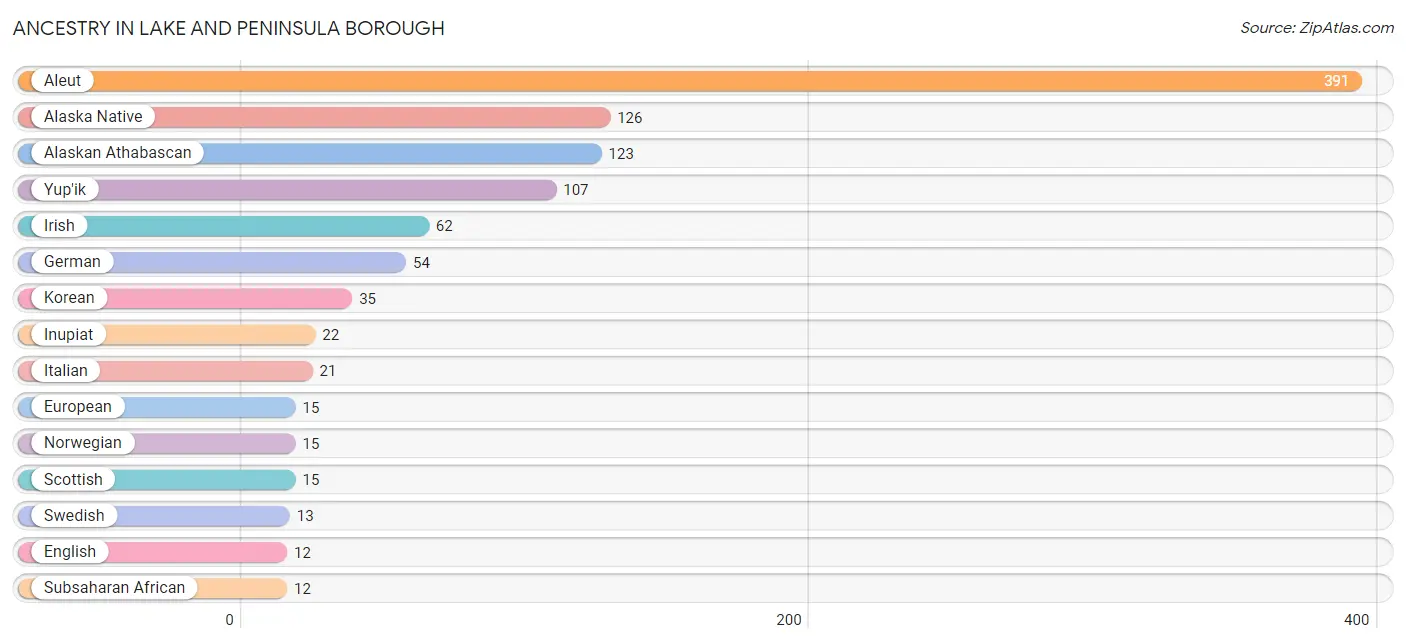
Ancestry in Lake and Peninsula Borough
The most populous ancestries reported in Lake and Peninsula Borough are Aleut (391 | 39.1%), Alaska Native (126 | 12.6%), Alaskan Athabascan (123 | 12.3%), Yup'ik (107 | 10.7%), and Irish (62 | 6.2%), together accounting for 81.0% of all Lake and Peninsula Borough residents.
| Ancestry | # Population | % Population |
| Alaska Native | 126 | 12.6% |
| Alaskan Athabascan | 123 | 12.3% |
| Aleut | 391 | 39.1% |
| American | 9 | 0.9% |
| Australian | 10 | 1.0% |
| Dutch | 1 | 0.1% |
| English | 12 | 1.2% |
| European | 15 | 1.5% |
| Finnish | 2 | 0.2% |
| French | 2 | 0.2% |
| German | 54 | 5.4% |
| Indian (Asian) | 7 | 0.7% |
| Inupiat | 22 | 2.2% |
| Irish | 62 | 6.2% |
| Italian | 21 | 2.1% |
| Kiowa | 2 | 0.2% |
| Korean | 35 | 3.5% |
| Norwegian | 15 | 1.5% |
| Polish | 10 | 1.0% |
| Pueblo | 3 | 0.3% |
| Puerto Rican | 1 | 0.1% |
| Russian | 10 | 1.0% |
| Scandinavian | 3 | 0.3% |
| Scotch-Irish | 4 | 0.4% |
| Scottish | 15 | 1.5% |
| Subsaharan African | 12 | 1.2% |
| Swedish | 13 | 1.3% |
| Tlingit-Haida | 3 | 0.3% |
| Ugandan | 12 | 1.2% |
| Ukrainian | 8 | 0.8% |
| Yup'ik | 107 | 10.7% | View All 31 Rows |
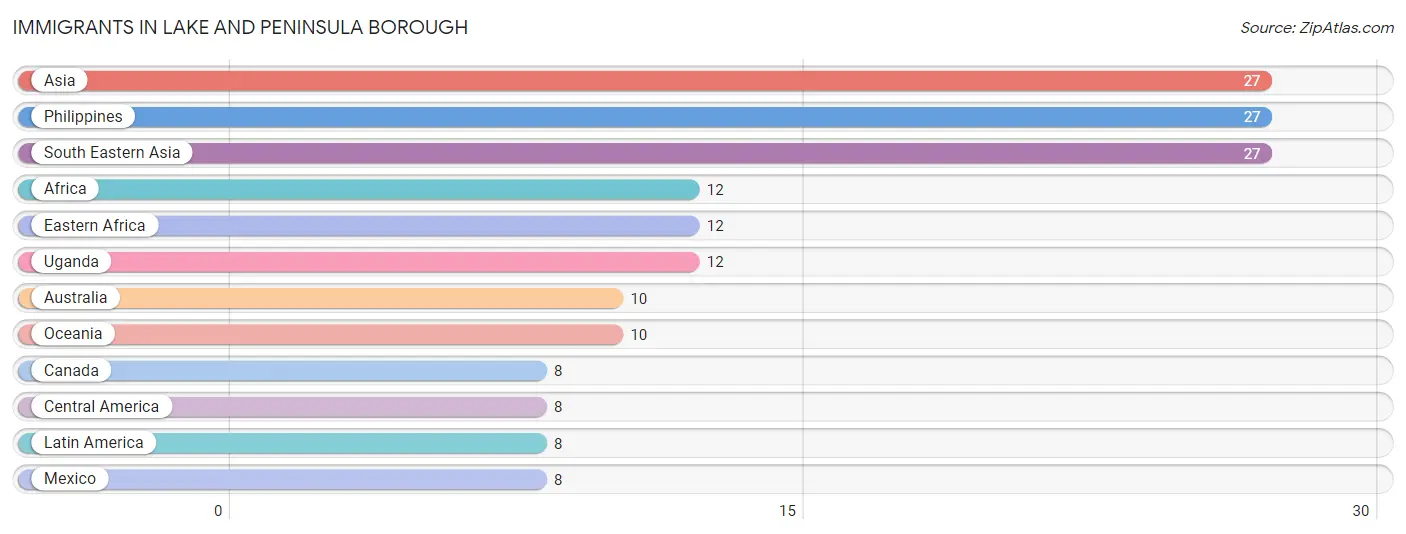
Immigrants in Lake and Peninsula Borough
The most numerous immigrant groups reported in Lake and Peninsula Borough came from Asia (27 | 2.7%), Philippines (27 | 2.7%), South Eastern Asia (27 | 2.7%), Africa (12 | 1.2%), and Eastern Africa (12 | 1.2%), together accounting for 10.5% of all Lake and Peninsula Borough residents.
| Immigration Origin | # Population | % Population |
| Africa | 12 | 1.2% |
| Asia | 27 | 2.7% |
| Australia | 10 | 1.0% |
| Canada | 8 | 0.8% |
| Central America | 8 | 0.8% |
| Eastern Africa | 12 | 1.2% |
| Latin America | 8 | 0.8% |
| Mexico | 8 | 0.8% |
| Oceania | 10 | 1.0% |
| Philippines | 27 | 2.7% |
| South Eastern Asia | 27 | 2.7% |
| Uganda | 12 | 1.2% | View All 12 Rows |
Sex and Age in Lake and Peninsula Borough
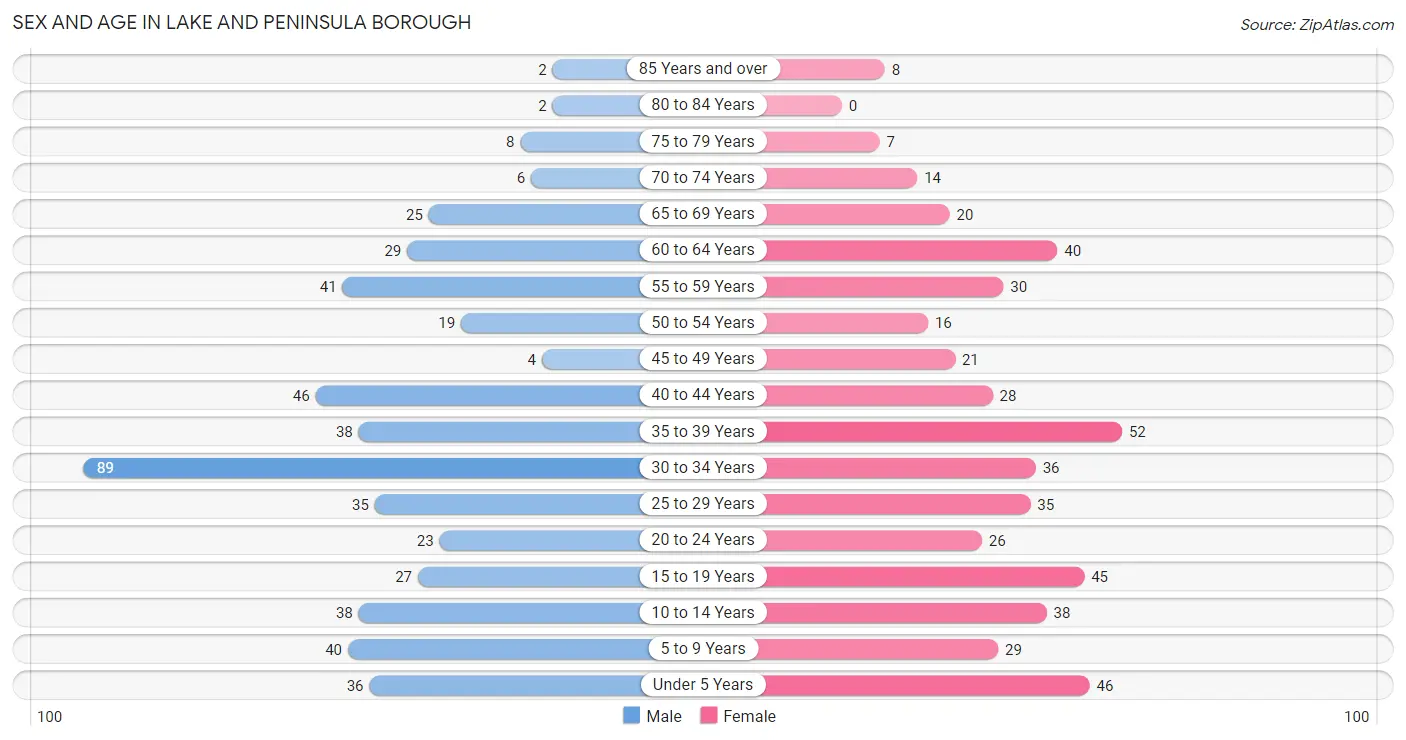
Sex and Age in Lake and Peninsula Borough
The most populous age groups in Lake and Peninsula Borough are 30 to 34 Years (89 | 17.5%) for men and 35 to 39 Years (52 | 10.6%) for women.
| Age Bracket | Male | Female |
| Under 5 Years | 36 (7.1%) | 46 (9.4%) |
| 5 to 9 Years | 40 (7.9%) | 29 (5.9%) |
| 10 to 14 Years | 38 (7.5%) | 38 (7.7%) |
| 15 to 19 Years | 27 (5.3%) | 45 (9.2%) |
| 20 to 24 Years | 23 (4.5%) | 26 (5.3%) |
| 25 to 29 Years | 35 (6.9%) | 35 (7.1%) |
| 30 to 34 Years | 89 (17.5%) | 36 (7.3%) |
| 35 to 39 Years | 38 (7.5%) | 52 (10.6%) |
| 40 to 44 Years | 46 (9.1%) | 28 (5.7%) |
| 45 to 49 Years | 4 (0.8%) | 21 (4.3%) |
| 50 to 54 Years | 19 (3.7%) | 16 (3.3%) |
| 55 to 59 Years | 41 (8.1%) | 30 (6.1%) |
| 60 to 64 Years | 29 (5.7%) | 40 (8.2%) |
| 65 to 69 Years | 25 (4.9%) | 20 (4.1%) |
| 70 to 74 Years | 6 (1.2%) | 14 (2.9%) |
| 75 to 79 Years | 8 (1.6%) | 7 (1.4%) |
| 80 to 84 Years | 2 (0.4%) | 0 (0.0%) |
| 85 Years and over | 2 (0.4%) | 8 (1.6%) |
| Total | 508 (100.0%) | 491 (100.0%) |
Families and Households in Lake and Peninsula Borough
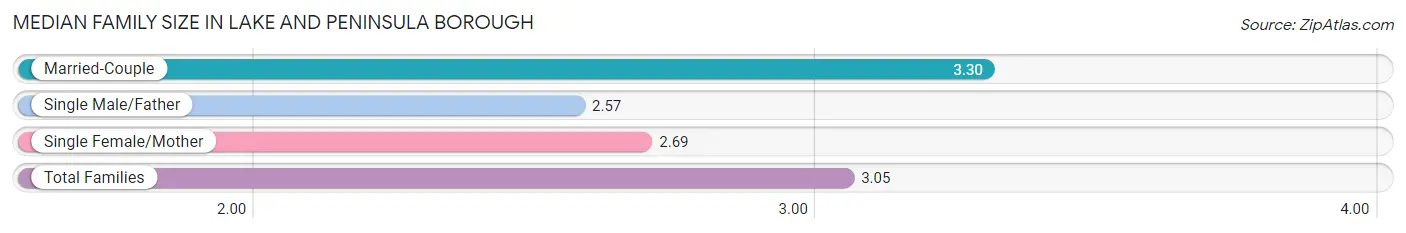
Median Family Size in Lake and Peninsula Borough
The median family size in Lake and Peninsula Borough is 3.05 persons per family, with married-couple families (145 | 59.7%) accounting for the largest median family size of 3.3 persons per family. On the other hand, single male/father families (21 | 8.6%) represent the smallest median family size with 2.57 persons per family.
| Family Type | # Families | Family Size |
| Married-Couple | 145 (59.7%) | 3.30 |
| Single Male/Father | 21 (8.6%) | 2.57 |
| Single Female/Mother | 77 (31.7%) | 2.69 |
| Total Families | 243 (100.0%) | 3.05 |
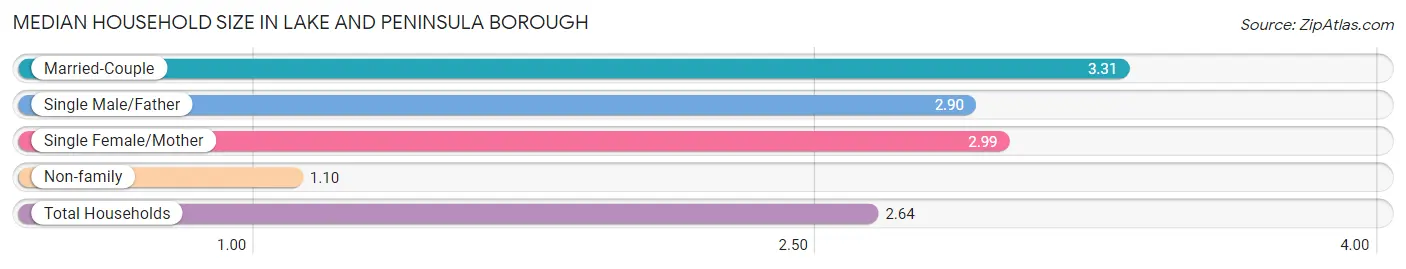
Median Household Size in Lake and Peninsula Borough
The median household size in Lake and Peninsula Borough is 2.64 persons per household, with married-couple households (145 | 44.5%) accounting for the largest median household size of 3.31 persons per household. non-family households (83 | 25.5%) represent the smallest median household size with 1.10 persons per household.
| Household Type | # Households | Household Size |
| Married-Couple | 145 (44.5%) | 3.31 |
| Single Male/Father | 21 (6.4%) | 2.90 |
| Single Female/Mother | 77 (23.6%) | 2.99 |
| Non-family | 83 (25.5%) | 1.10 |
| Total Households | 326 (100.0%) | 2.64 |
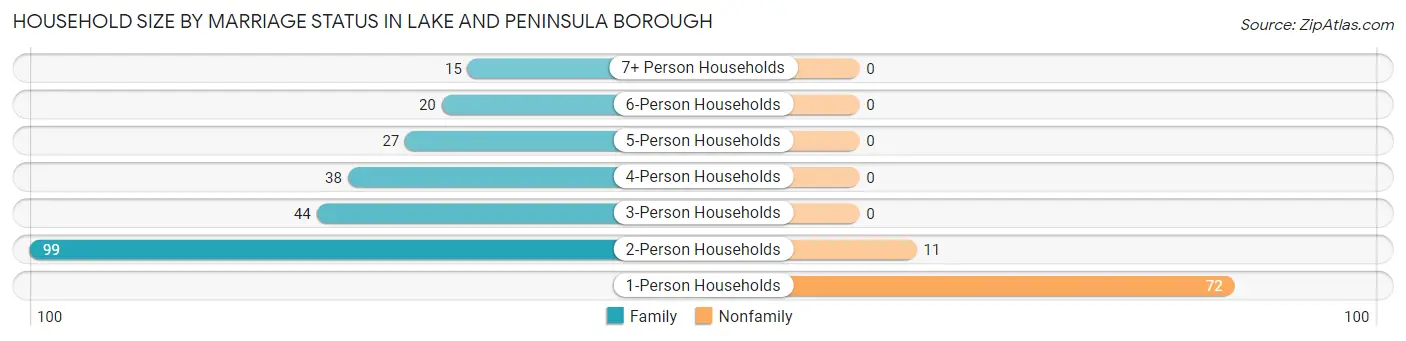
Household Size by Marriage Status in Lake and Peninsula Borough
Out of a total of 326 households in Lake and Peninsula Borough, 243 (74.5%) are family households, while 83 (25.5%) are nonfamily households. The most numerous type of family households are 2-person households, comprising 99, and the most common type of nonfamily households are 1-person households, comprising 72.
| Household Size | Family Households | Nonfamily Households |
| 1-Person Households | - | 72 (22.1%) |
| 2-Person Households | 99 (30.4%) | 11 (3.4%) |
| 3-Person Households | 44 (13.5%) | 0 (0.0%) |
| 4-Person Households | 38 (11.7%) | 0 (0.0%) |
| 5-Person Households | 27 (8.3%) | 0 (0.0%) |
| 6-Person Households | 20 (6.1%) | 0 (0.0%) |
| 7+ Person Households | 15 (4.6%) | 0 (0.0%) |
| Total | 243 (74.5%) | 83 (25.5%) |
Female Fertility in Lake and Peninsula Borough
Fertility by Age in Lake and Peninsula Borough
Average fertility rate in Lake and Peninsula Borough is 36.0 births per 1,000 women. Women in the age bracket of 20 to 34 years have the highest fertility rate with 72.0 births per 1,000 women. Women in the age bracket of 20 to 34 years acount for 77.8% of all women with births.
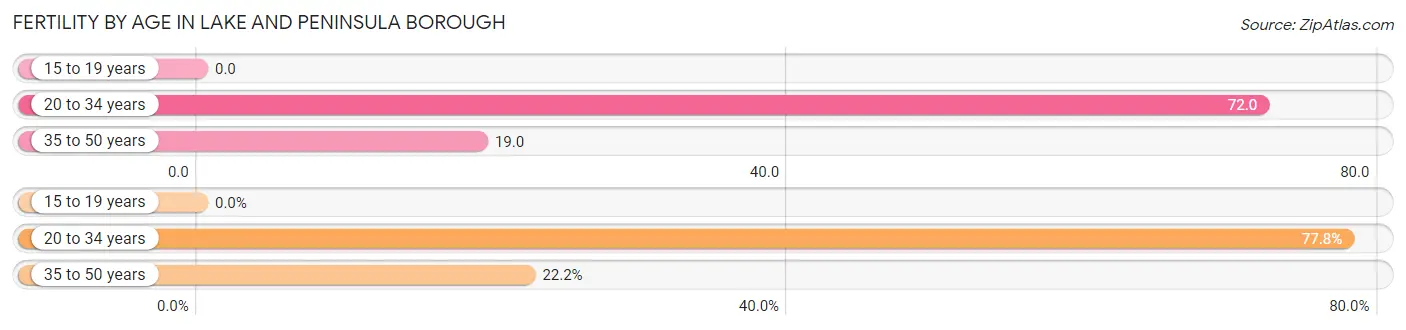
| Age Bracket | Women with Births | Births / 1,000 Women |
| 15 to 19 years | 0 (0.0%) | 0.0 |
| 20 to 34 years | 7 (77.8%) | 72.0 |
| 35 to 50 years | 2 (22.2%) | 19.0 |
| Total | 9 (100.0%) | 36.0 |
Fertility by Age by Marriage Status in Lake and Peninsula Borough
66.7% of women with births (9) in Lake and Peninsula Borough are married. The highest percentage of unmarried women with births falls into 20 to 34 years age bracket with 42.9% of them unmarried at the time of birth, while the lowest percentage of unmarried women with births belong to 35 to 50 years age bracket with 0.0% of them unmarried.
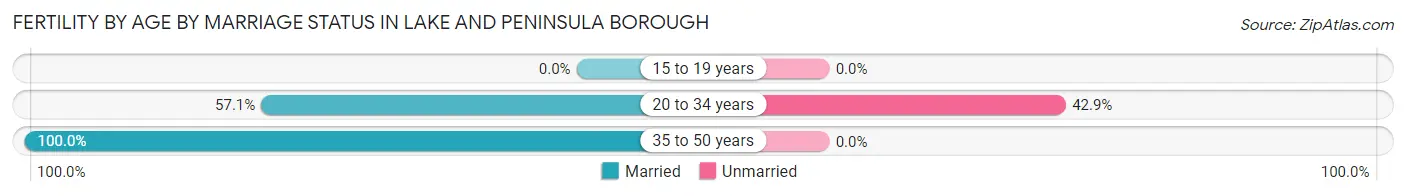
| Age Bracket | Married | Unmarried |
| 15 to 19 years | 0 (0.0%) | 0 (0.0%) |
| 20 to 34 years | 4 (57.1%) | 3 (42.9%) |
| 35 to 50 years | 2 (100.0%) | 0 (0.0%) |
| Total | 6 (66.7%) | 3 (33.3%) |
Fertility by Education in Lake and Peninsula Borough
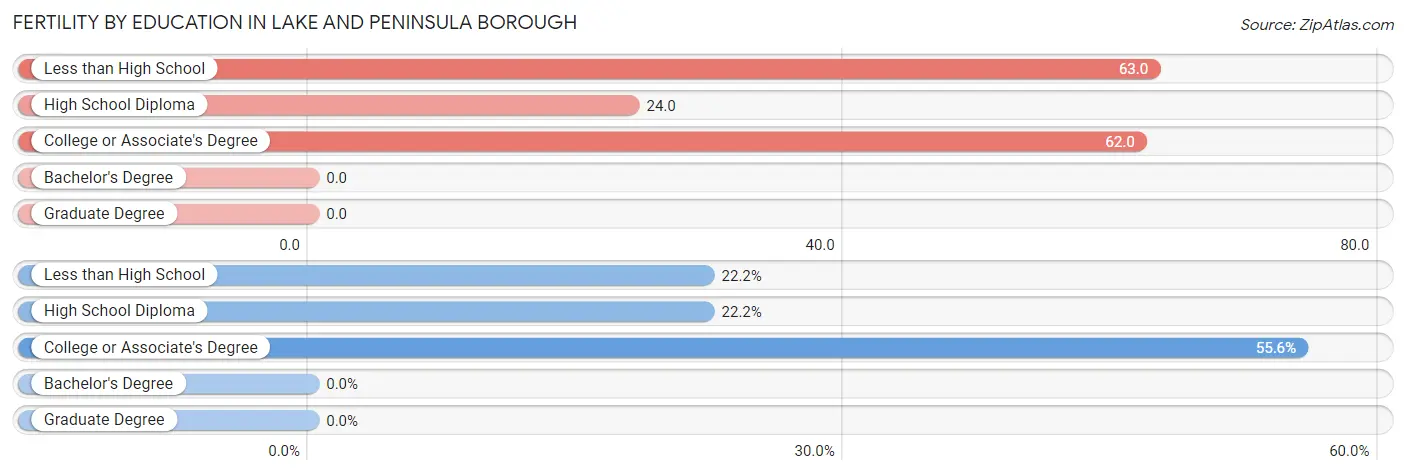
| Educational Attainment | Women with Births | Births / 1,000 Women |
| Less than High School | 2 (22.2%) | 63.0 |
| High School Diploma | 2 (22.2%) | 24.0 |
| College or Associate's Degree | 5 (55.6%) | 62.0 |
| Bachelor's Degree | 0 (0.0%) | 0.0 |
| Graduate Degree | 0 (0.0%) | 0.0 |
| Total | 9 (100.0%) | 36.0 |
Fertility by Education by Marriage Status in Lake and Peninsula Borough
33.3% of women with births in Lake and Peninsula Borough are unmarried. Women with the educational attainment of less than high school are most likely to be married with 100.0% of them married at childbirth, while women with the educational attainment of high school diploma are least likely to be married with 100.0% of them unmarried at childbirth.
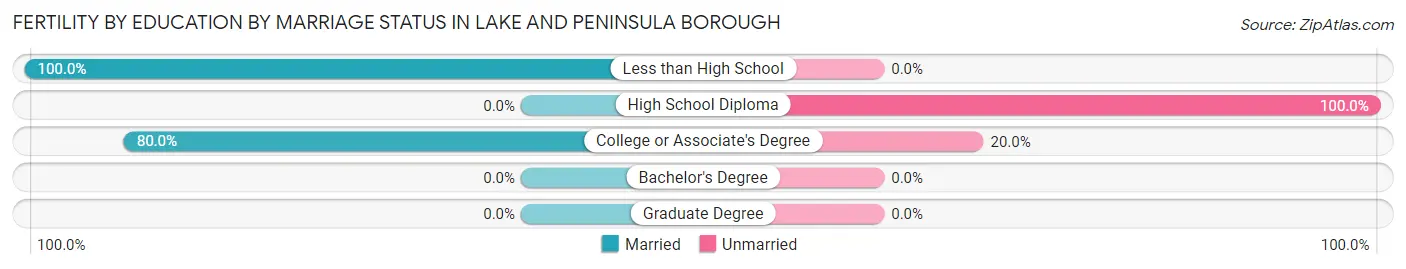
| Educational Attainment | Married | Unmarried |
| Less than High School | 2 (100.0%) | 0 (0.0%) |
| High School Diploma | 0 (0.0%) | 2 (100.0%) |
| College or Associate's Degree | 4 (80.0%) | 1 (20.0%) |
| Bachelor's Degree | 0 (0.0%) | 0 (0.0%) |
| Graduate Degree | 0 (0.0%) | 0 (0.0%) |
| Total | 6 (66.7%) | 3 (33.3%) |
Income in Lake and Peninsula Borough
Income Overview in Lake and Peninsula Borough
Per Capita Income in Lake and Peninsula Borough is $39,409, while median incomes of families and households are $64,875 and $61,607 respectively.
| Characteristic | Number | Measure |
| Per Capita Income | 999 | $39,409 |
| Median Family Income | 243 | $64,875 |
| Mean Family Income | 243 | $76,035 |
| Median Household Income | 326 | $61,607 |
| Mean Household Income | 326 | $72,594 |
| Income Deficit | 243 | $0 |
| Wage / Income Gap (%) | 999 | 56.39% |
| Wage / Income Gap ($) | 999 | 43.61¢ per $1 |
| Gini / Inequality Index | 999 | 0.39 |
Earnings by Sex in Lake and Peninsula Borough
Average Earnings in Lake and Peninsula Borough are $31,500, $47,500 for men and $20,714 for women, a difference of 56.4%.
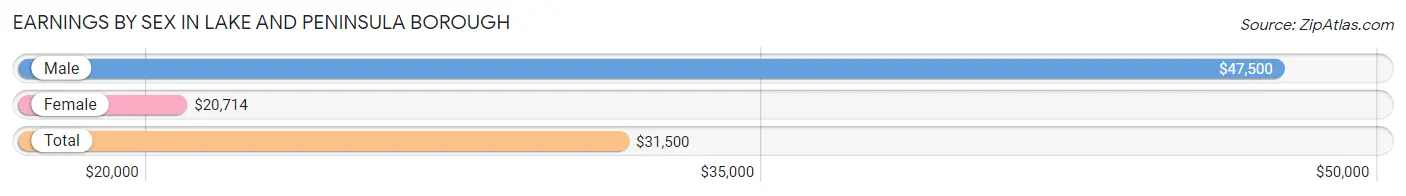
| Sex | Number | Average Earnings |
| Male | 338 (54.0%) | $47,500 |
| Female | 288 (46.0%) | $20,714 |
| Total | 626 (100.0%) | $31,500 |
Earnings by Sex by Income Bracket in Lake and Peninsula Borough
The most common earnings brackets in Lake and Peninsula Borough are $100,000+ for men (96 | 28.4%) and $5,000 to $7,499 for women (39 | 13.5%).
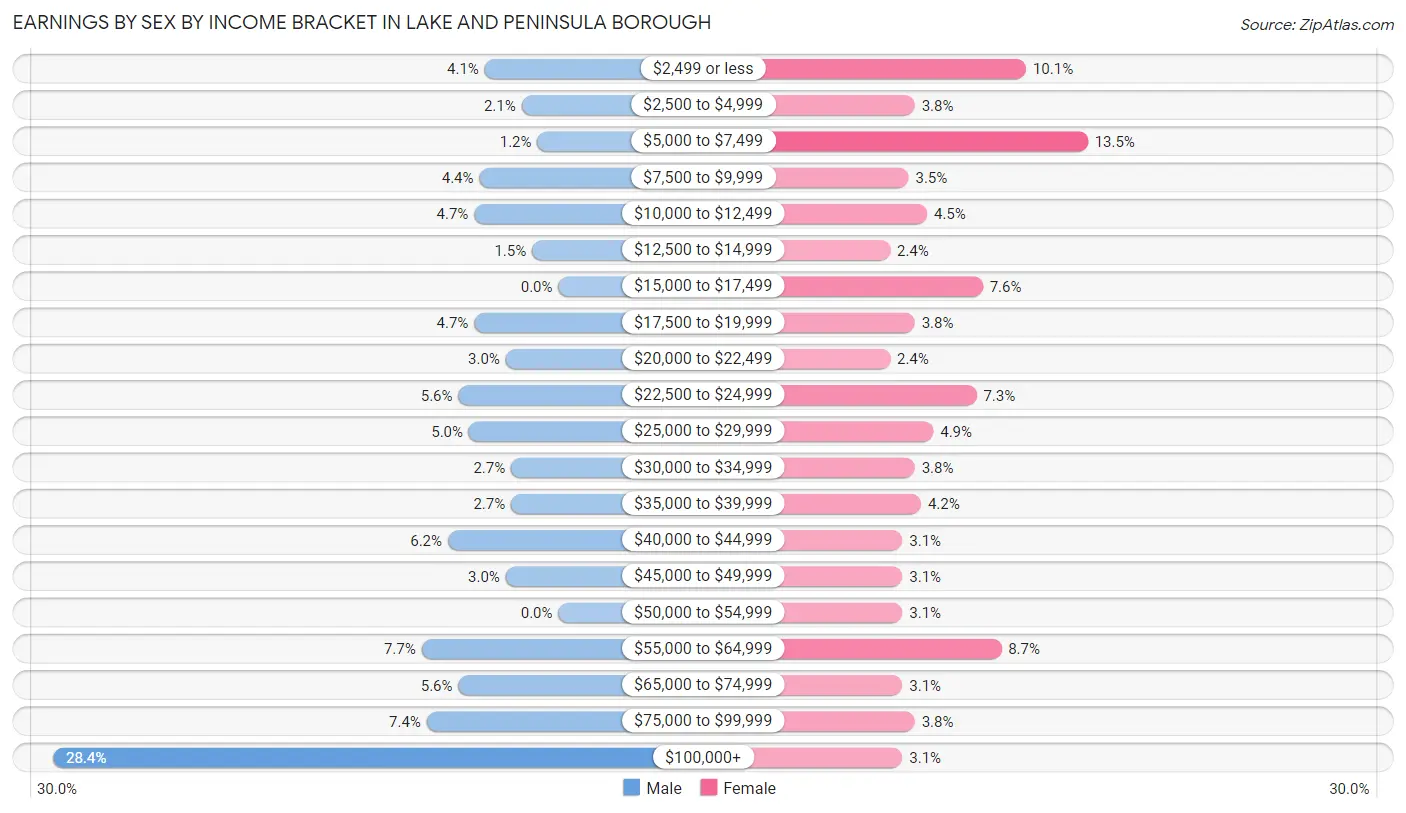
| Income | Male | Female |
| $2,499 or less | 14 (4.1%) | 29 (10.1%) |
| $2,500 to $4,999 | 7 (2.1%) | 11 (3.8%) |
| $5,000 to $7,499 | 4 (1.2%) | 39 (13.5%) |
| $7,500 to $9,999 | 15 (4.4%) | 10 (3.5%) |
| $10,000 to $12,499 | 16 (4.7%) | 13 (4.5%) |
| $12,500 to $14,999 | 5 (1.5%) | 7 (2.4%) |
| $15,000 to $17,499 | 0 (0.0%) | 22 (7.6%) |
| $17,500 to $19,999 | 16 (4.7%) | 11 (3.8%) |
| $20,000 to $22,499 | 10 (3.0%) | 7 (2.4%) |
| $22,500 to $24,999 | 19 (5.6%) | 21 (7.3%) |
| $25,000 to $29,999 | 17 (5.0%) | 14 (4.9%) |
| $30,000 to $34,999 | 9 (2.7%) | 11 (3.8%) |
| $35,000 to $39,999 | 9 (2.7%) | 12 (4.2%) |
| $40,000 to $44,999 | 21 (6.2%) | 9 (3.1%) |
| $45,000 to $49,999 | 10 (3.0%) | 9 (3.1%) |
| $50,000 to $54,999 | 0 (0.0%) | 9 (3.1%) |
| $55,000 to $64,999 | 26 (7.7%) | 25 (8.7%) |
| $65,000 to $74,999 | 19 (5.6%) | 9 (3.1%) |
| $75,000 to $99,999 | 25 (7.4%) | 11 (3.8%) |
| $100,000+ | 96 (28.4%) | 9 (3.1%) |
| Total | 338 (100.0%) | 288 (100.0%) |
Earnings by Sex by Educational Attainment in Lake and Peninsula Borough
Average earnings in Lake and Peninsula Borough are $61,875 for men and $24,063 for women, a difference of 61.1%. Men with an educational attainment of graduate degree enjoy the highest average annual earnings of $98,438, while those with less than high school education earn the least with $17,917. Women with an educational attainment of graduate degree earn the most with the average annual earnings of $73,125, while those with high school diploma education have the smallest earnings of $17,875.
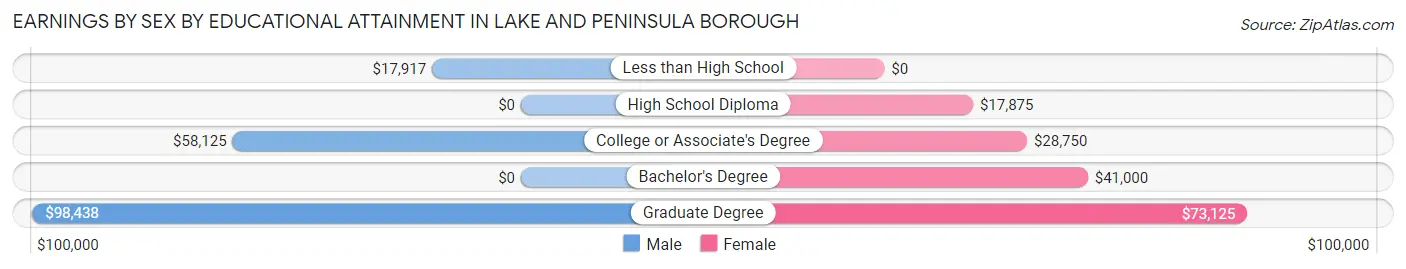
| Educational Attainment | Male Income | Female Income |
| Less than High School | $17,917 | $0 |
| High School Diploma | - | - |
| College or Associate's Degree | $58,125 | $28,750 |
| Bachelor's Degree | - | - |
| Graduate Degree | $98,438 | $73,125 |
| Total | $61,875 | $24,063 |
Family Income in Lake and Peninsula Borough
Family Income Brackets in Lake and Peninsula Borough
According to the Lake and Peninsula Borough family income data, there are 42 families falling into the $75,000 to $99,999 income range, which is the most common income bracket and makes up 17.3% of all families. Conversely, the $200,000+ income bracket is the least frequent group with only 3 families (1.2%) belonging to this category.
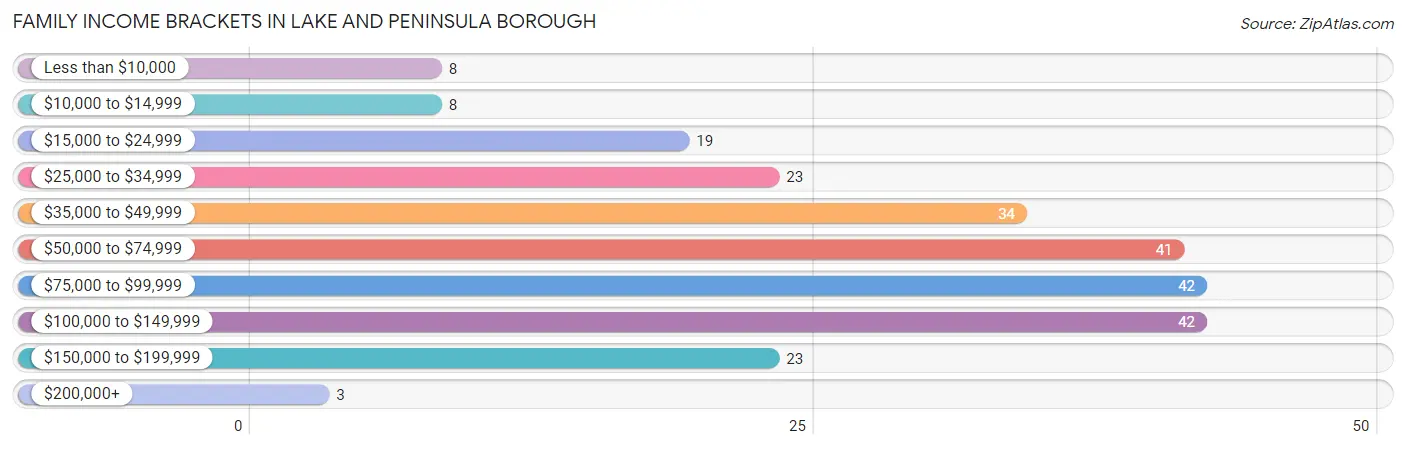
| Income Bracket | # Families | % Families |
| Less than $10,000 | 8 | 3.3% |
| $10,000 to $14,999 | 8 | 3.3% |
| $15,000 to $24,999 | 19 | 7.8% |
| $25,000 to $34,999 | 23 | 9.5% |
| $35,000 to $49,999 | 34 | 14.0% |
| $50,000 to $74,999 | 41 | 16.9% |
| $75,000 to $99,999 | 42 | 17.3% |
| $100,000 to $149,999 | 42 | 17.3% |
| $150,000 to $199,999 | 23 | 9.5% |
| $200,000+ | 3 | 1.2% |
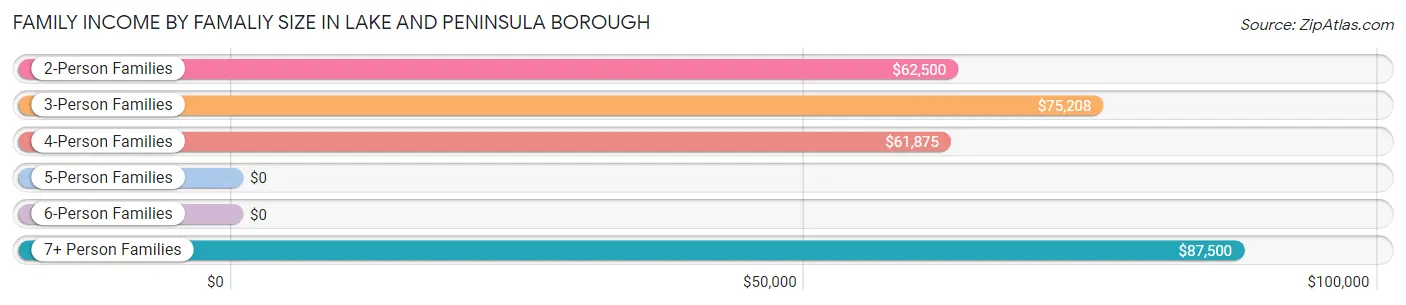
Family Income by Famaliy Size in Lake and Peninsula Borough
7+ person families (14 | 5.8%) account for the highest median family income in Lake and Peninsula Borough with $87,500 per family, while 2-person families (104 | 42.8%) have the highest median income of $31,250 per family member.
| Income Bracket | # Families | Median Income |
| 2-Person Families | 104 (42.8%) | $62,500 |
| 3-Person Families | 47 (19.3%) | $75,208 |
| 4-Person Families | 51 (21.0%) | $61,875 |
| 5-Person Families | 7 (2.9%) | $0 |
| 6-Person Families | 20 (8.2%) | $0 |
| 7+ Person Families | 14 (5.8%) | $87,500 |
| Total | 243 (100.0%) | $64,875 |
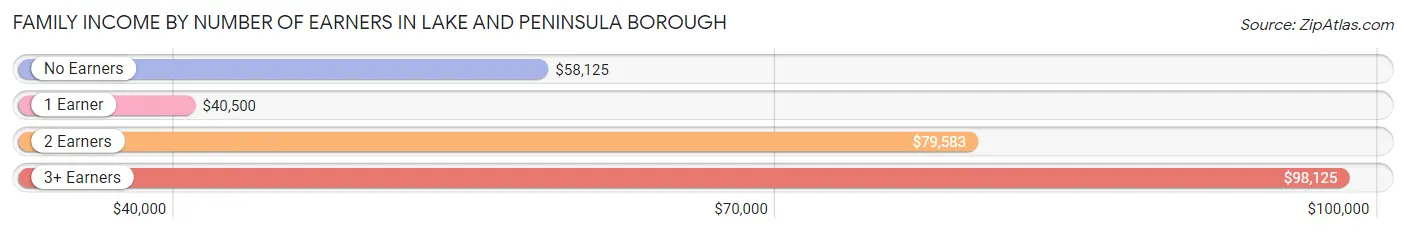
Family Income by Number of Earners in Lake and Peninsula Borough
The median family income in Lake and Peninsula Borough is $64,875, with families comprising 3+ earners (37) having the highest median family income of $98,125, while families with 1 earner (88) have the lowest median family income of $40,500, accounting for 15.2% and 36.2% of families, respectively.
| Number of Earners | # Families | Median Income |
| No Earners | 15 (6.2%) | $58,125 |
| 1 Earner | 88 (36.2%) | $40,500 |
| 2 Earners | 103 (42.4%) | $79,583 |
| 3+ Earners | 37 (15.2%) | $98,125 |
| Total | 243 (100.0%) | $64,875 |
Household Income in Lake and Peninsula Borough
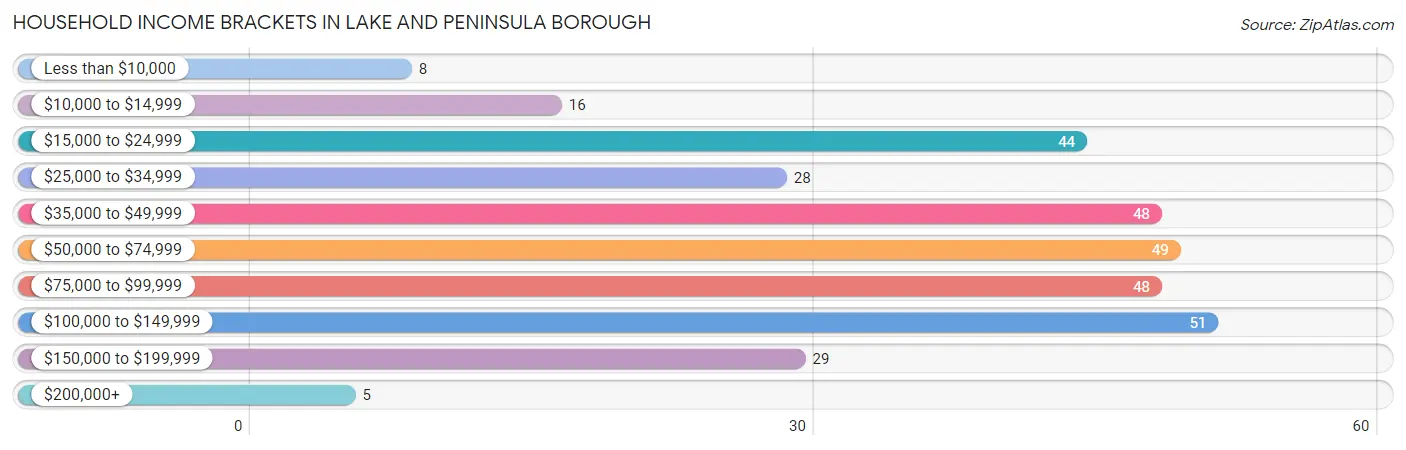
Household Income Brackets in Lake and Peninsula Borough
With 51 households falling in the category, the $100,000 to $149,999 income range is the most frequent in Lake and Peninsula Borough, accounting for 15.6% of all households. In contrast, only 5 households (1.5%) fall into the $200,000+ income bracket, making it the least populous group.
| Income Bracket | # Households | % Households |
| Less than $10,000 | 8 | 2.5% |
| $10,000 to $14,999 | 16 | 4.9% |
| $15,000 to $24,999 | 44 | 13.5% |
| $25,000 to $34,999 | 28 | 8.6% |
| $35,000 to $49,999 | 48 | 14.7% |
| $50,000 to $74,999 | 49 | 15.0% |
| $75,000 to $99,999 | 48 | 14.7% |
| $100,000 to $149,999 | 51 | 15.6% |
| $150,000 to $199,999 | 29 | 8.9% |
| $200,000+ | 5 | 1.5% |
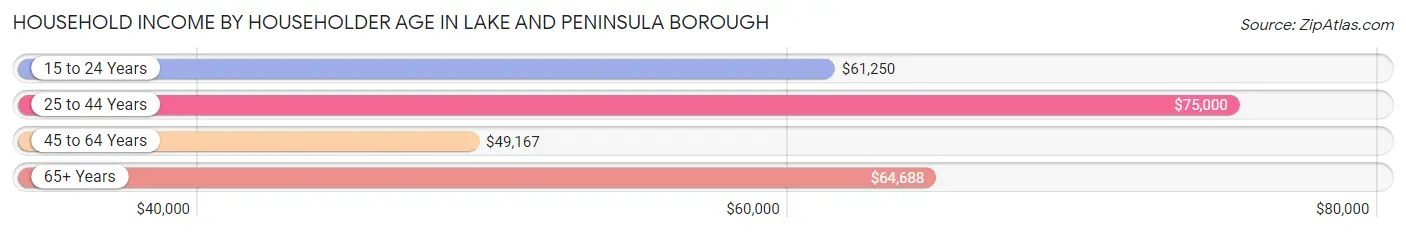
Household Income by Householder Age in Lake and Peninsula Borough
The median household income in Lake and Peninsula Borough is $61,607, with the highest median household income of $75,000 found in the 25 to 44 years age bracket for the primary householder. A total of 136 households (41.7%) fall into this category. Meanwhile, the 45 to 64 years age bracket for the primary householder has the lowest median household income of $49,167, with 118 households (36.2%) in this group.
| Income Bracket | # Households | Median Income |
| 15 to 24 Years | 15 (4.6%) | $61,250 |
| 25 to 44 Years | 136 (41.7%) | $75,000 |
| 45 to 64 Years | 118 (36.2%) | $49,167 |
| 65+ Years | 57 (17.5%) | $64,688 |
| Total | 326 (100.0%) | $61,607 |
Poverty in Lake and Peninsula Borough
Income Below Poverty by Sex and Age in Lake and Peninsula Borough
With 13.2% poverty level for males and 17.2% for females among the residents of Lake and Peninsula Borough, 16 and 17 year old males and 5 year old females are the most vulnerable to poverty, with 2 males (33.3%) and 2 females (66.7%) in their respective age groups living below the poverty level.
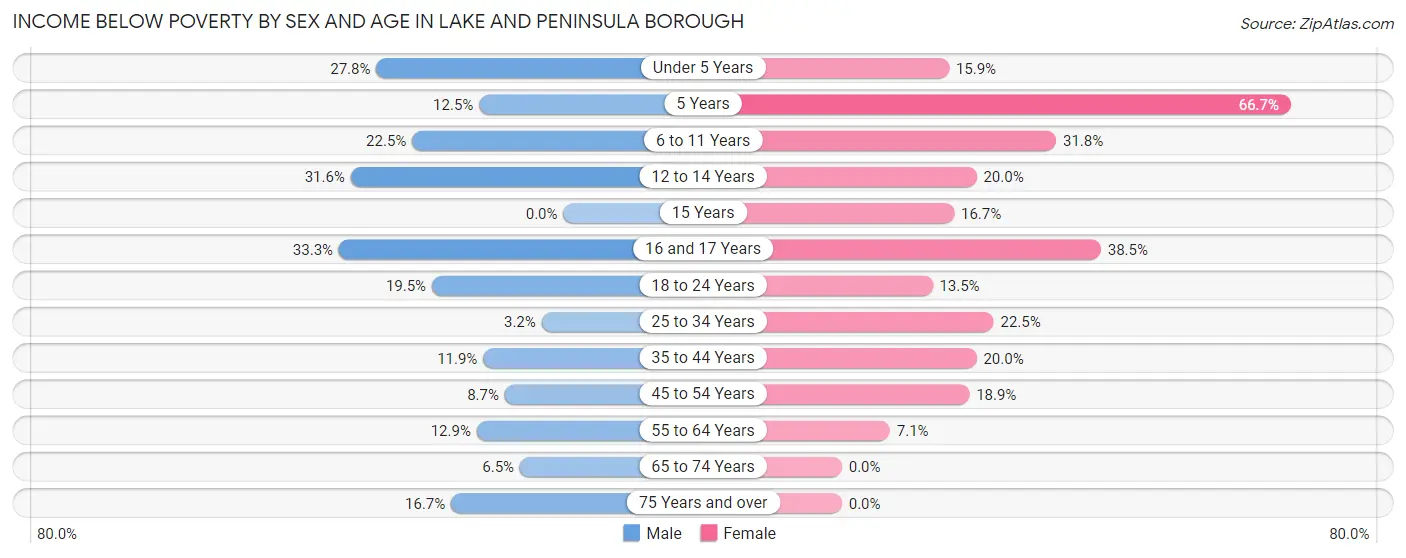
| Age Bracket | Male | Female |
| Under 5 Years | 10 (27.8%) | 7 (15.9%) |
| 5 Years | 1 (12.5%) | 2 (66.7%) |
| 6 to 11 Years | 11 (22.5%) | 14 (31.8%) |
| 12 to 14 Years | 6 (31.6%) | 4 (20.0%) |
| 15 Years | 0 (0.0%) | 1 (16.7%) |
| 16 and 17 Years | 2 (33.3%) | 5 (38.5%) |
| 18 to 24 Years | 8 (19.5%) | 7 (13.5%) |
| 25 to 34 Years | 4 (3.2%) | 16 (22.5%) |
| 35 to 44 Years | 10 (11.9%) | 16 (20.0%) |
| 45 to 54 Years | 2 (8.7%) | 7 (18.9%) |
| 55 to 64 Years | 9 (12.9%) | 5 (7.1%) |
| 65 to 74 Years | 2 (6.5%) | 0 (0.0%) |
| 75 Years and over | 2 (16.7%) | 0 (0.0%) |
| Total | 67 (13.2%) | 84 (17.2%) |
Income Above Poverty by Sex and Age in Lake and Peninsula Borough
According to the poverty statistics in Lake and Peninsula Borough, males aged 15 years and females aged 65 to 74 years are the age groups that are most secure financially, with 100.0% of males and 100.0% of females in these age groups living above the poverty line.
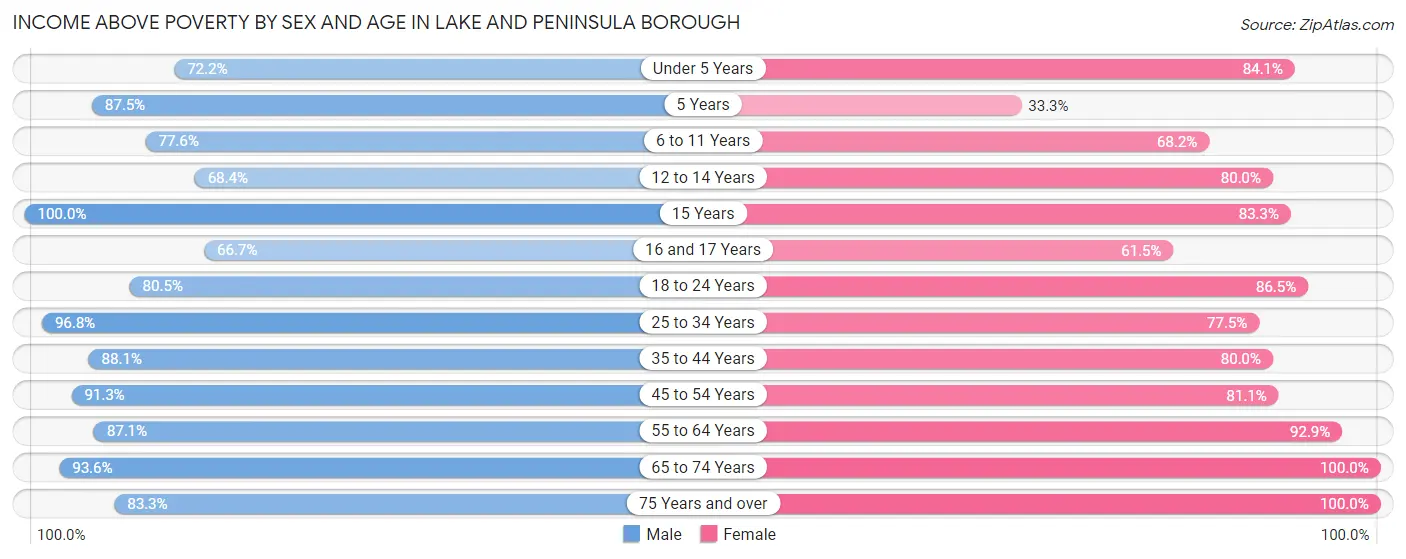
| Age Bracket | Male | Female |
| Under 5 Years | 26 (72.2%) | 37 (84.1%) |
| 5 Years | 7 (87.5%) | 1 (33.3%) |
| 6 to 11 Years | 38 (77.5%) | 30 (68.2%) |
| 12 to 14 Years | 13 (68.4%) | 16 (80.0%) |
| 15 Years | 3 (100.0%) | 5 (83.3%) |
| 16 and 17 Years | 4 (66.7%) | 8 (61.5%) |
| 18 to 24 Years | 33 (80.5%) | 45 (86.5%) |
| 25 to 34 Years | 120 (96.8%) | 55 (77.5%) |
| 35 to 44 Years | 74 (88.1%) | 64 (80.0%) |
| 45 to 54 Years | 21 (91.3%) | 30 (81.1%) |
| 55 to 64 Years | 61 (87.1%) | 65 (92.9%) |
| 65 to 74 Years | 29 (93.5%) | 34 (100.0%) |
| 75 Years and over | 10 (83.3%) | 15 (100.0%) |
| Total | 439 (86.8%) | 405 (82.8%) |
Income Below Poverty Among Married-Couple Families in Lake and Peninsula Borough
The poverty statistics for married-couple families in Lake and Peninsula Borough show that 6.2% or 9 of the total 145 families live below the poverty line. Families with 3 or 4 children have the highest poverty rate of 18.2%, comprising of 4 families. On the other hand, families with 5 or more children have the lowest poverty rate of 0.0%, which includes 0 families.
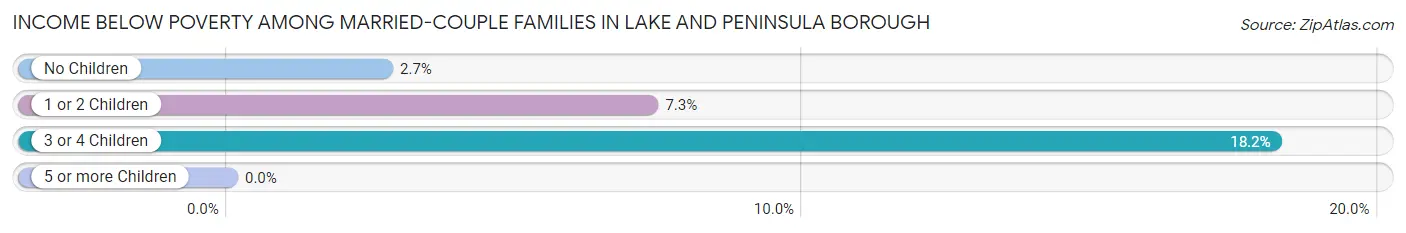
| Children | Above Poverty | Below Poverty |
| No Children | 72 (97.3%) | 2 (2.7%) |
| 1 or 2 Children | 38 (92.7%) | 3 (7.3%) |
| 3 or 4 Children | 18 (81.8%) | 4 (18.2%) |
| 5 or more Children | 8 (100.0%) | 0 (0.0%) |
| Total | 136 (93.8%) | 9 (6.2%) |
Income Below Poverty Among Single-Parent Households in Lake and Peninsula Borough
According to the poverty data in Lake and Peninsula Borough, 19.1% or 4 single-father households and 28.6% or 22 single-mother households are living below the poverty line. Among single-father households, those with 3 or 4 children have the highest poverty rate, with 4 households (44.4%) experiencing poverty. Likewise, among single-mother households, those with 5 or more children have the highest poverty rate, with 4 households (100.0%) falling below the poverty line.
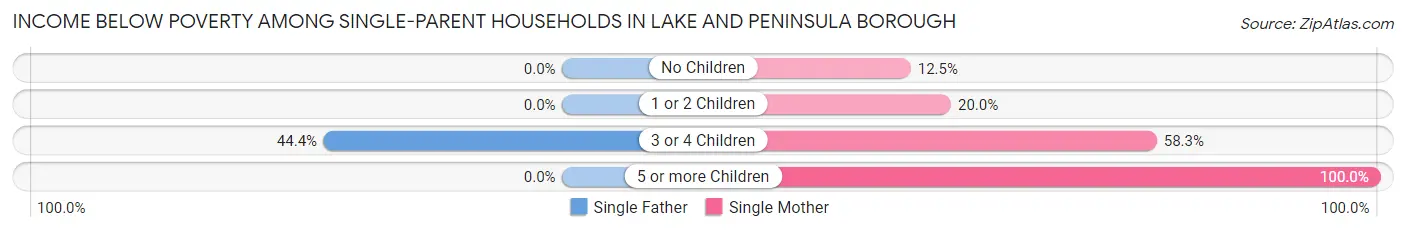
| Children | Single Father | Single Mother |
| No Children | 0 (0.0%) | 2 (12.5%) |
| 1 or 2 Children | 0 (0.0%) | 9 (20.0%) |
| 3 or 4 Children | 4 (44.4%) | 7 (58.3%) |
| 5 or more Children | 0 (0.0%) | 4 (100.0%) |
| Total | 4 (19.1%) | 22 (28.6%) |
Income Below Poverty Among Married-Couple vs Single-Parent Households in Lake and Peninsula Borough
The poverty data for Lake and Peninsula Borough shows that 9 of the married-couple family households (6.2%) and 26 of the single-parent households (26.5%) are living below the poverty level. Within the married-couple family households, those with 3 or 4 children have the highest poverty rate, with 4 households (18.2%) falling below the poverty line. Among the single-parent households, those with 5 or more children have the highest poverty rate, with 4 household (100.0%) living below poverty.
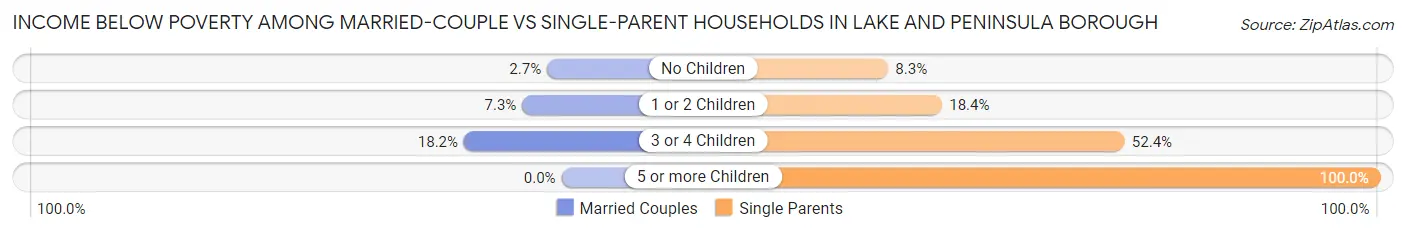
| Children | Married-Couple Families | Single-Parent Households |
| No Children | 2 (2.7%) | 2 (8.3%) |
| 1 or 2 Children | 3 (7.3%) | 9 (18.4%) |
| 3 or 4 Children | 4 (18.2%) | 11 (52.4%) |
| 5 or more Children | 0 (0.0%) | 4 (100.0%) |
| Total | 9 (6.2%) | 26 (26.5%) |
Employment Characteristics in Lake and Peninsula Borough
Employment by Class of Employer in Lake and Peninsula Borough
Among the 483 employed individuals in Lake and Peninsula Borough, private company employees (160 | 33.1%), local government employees (137 | 28.4%), and state government employees (83 | 17.2%) make up the most common classes of employment.
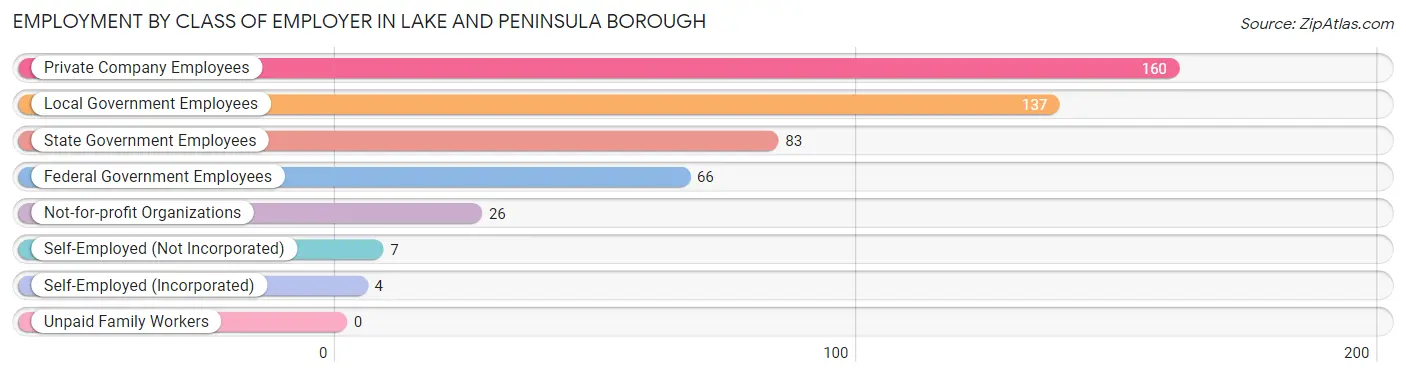
| Employer Class | # Employees | % Employees |
| Private Company Employees | 160 | 33.1% |
| Self-Employed (Incorporated) | 4 | 0.8% |
| Self-Employed (Not Incorporated) | 7 | 1.5% |
| Not-for-profit Organizations | 26 | 5.4% |
| Local Government Employees | 137 | 28.4% |
| State Government Employees | 83 | 17.2% |
| Federal Government Employees | 66 | 13.7% |
| Unpaid Family Workers | 0 | 0.0% |
| Total | 483 | 100.0% |
Employment Status by Age in Lake and Peninsula Borough
According to the labor force statistics for Lake and Peninsula Borough, out of the total population over 16 years of age (763), 74.3% or 567 individuals are in the labor force, with 14.0% or 79 of them unemployed. The age group with the highest labor force participation rate is 30 to 34 years, with 92.8% or 116 individuals in the labor force. Within the labor force, the 20 to 24 years age range has the highest percentage of unemployed individuals, with 55.6% or 25 of them being unemployed.
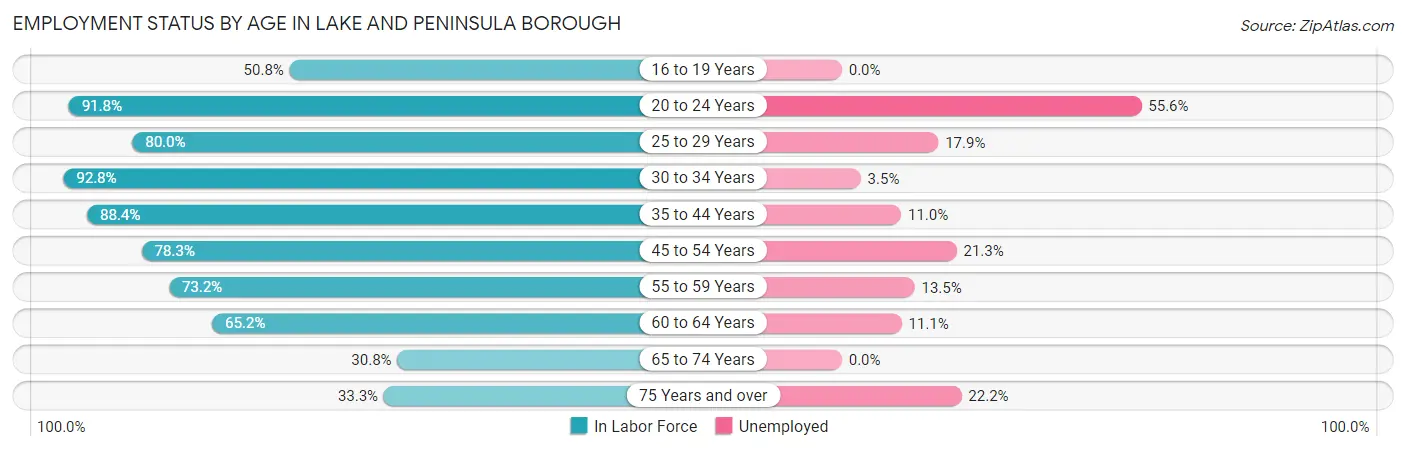
| Age Bracket | In Labor Force | Unemployed |
| 16 to 19 Years | 32 (50.8%) | 0 (0.0%) |
| 20 to 24 Years | 45 (91.8%) | 25 (55.6%) |
| 25 to 29 Years | 56 (80.0%) | 10 (17.9%) |
| 30 to 34 Years | 116 (92.8%) | 4 (3.5%) |
| 35 to 44 Years | 145 (88.4%) | 16 (11.0%) |
| 45 to 54 Years | 47 (78.3%) | 10 (21.3%) |
| 55 to 59 Years | 52 (73.2%) | 7 (13.5%) |
| 60 to 64 Years | 45 (65.2%) | 5 (11.1%) |
| 65 to 74 Years | 20 (30.8%) | 0 (0.0%) |
| 75 Years and over | 9 (33.3%) | 2 (22.2%) |
| Total | 567 (74.3%) | 79 (14.0%) |
Employment Status by Educational Attainment in Lake and Peninsula Borough
According to labor force statistics for Lake and Peninsula Borough, 82.5% of individuals (461) out of the total population between 25 and 64 years of age (559) are in the labor force, with 11.3% or 52 of them being unemployed. The group with the highest labor force participation rate are those with the educational attainment of college / associate degree, with 93.6% or 162 individuals in the labor force. Within the labor force, individuals with less than high school education have the highest percentage of unemployment, with 34.8% or 8 of them being unemployed.
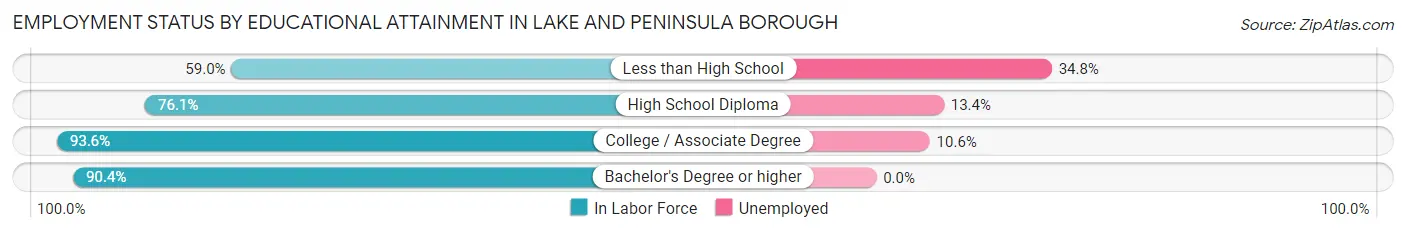
| Educational Attainment | In Labor Force | Unemployed |
| Less than High School | 23 (59.0%) | 14 (34.8%) |
| High School Diploma | 201 (76.1%) | 35 (13.4%) |
| College / Associate Degree | 162 (93.6%) | 18 (10.6%) |
| Bachelor's Degree or higher | 75 (90.4%) | 0 (0.0%) |
| Total | 461 (82.5%) | 63 (11.3%) |
Employment Occupations by Sex in Lake and Peninsula Borough
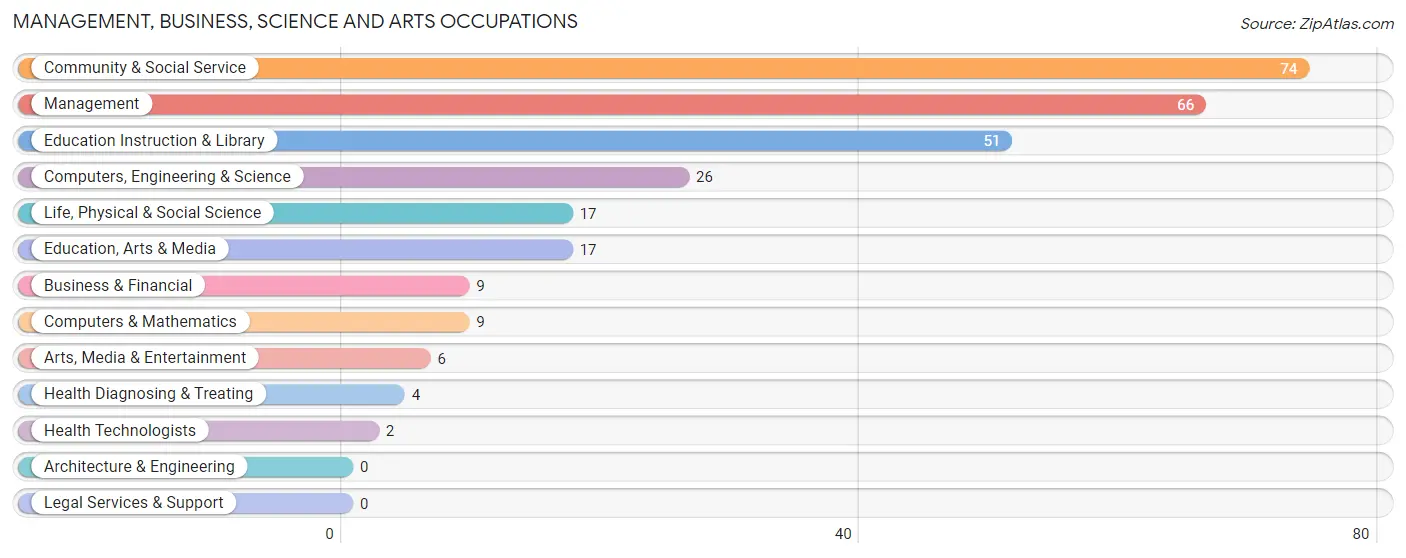
Management, Business, Science and Arts Occupations
The most common Management, Business, Science and Arts occupations in Lake and Peninsula Borough are Community & Social Service (74 | 15.2%), Management (66 | 13.6%), Education Instruction & Library (51 | 10.5%), Computers, Engineering & Science (26 | 5.3%), and Life, Physical & Social Science (17 | 3.5%).
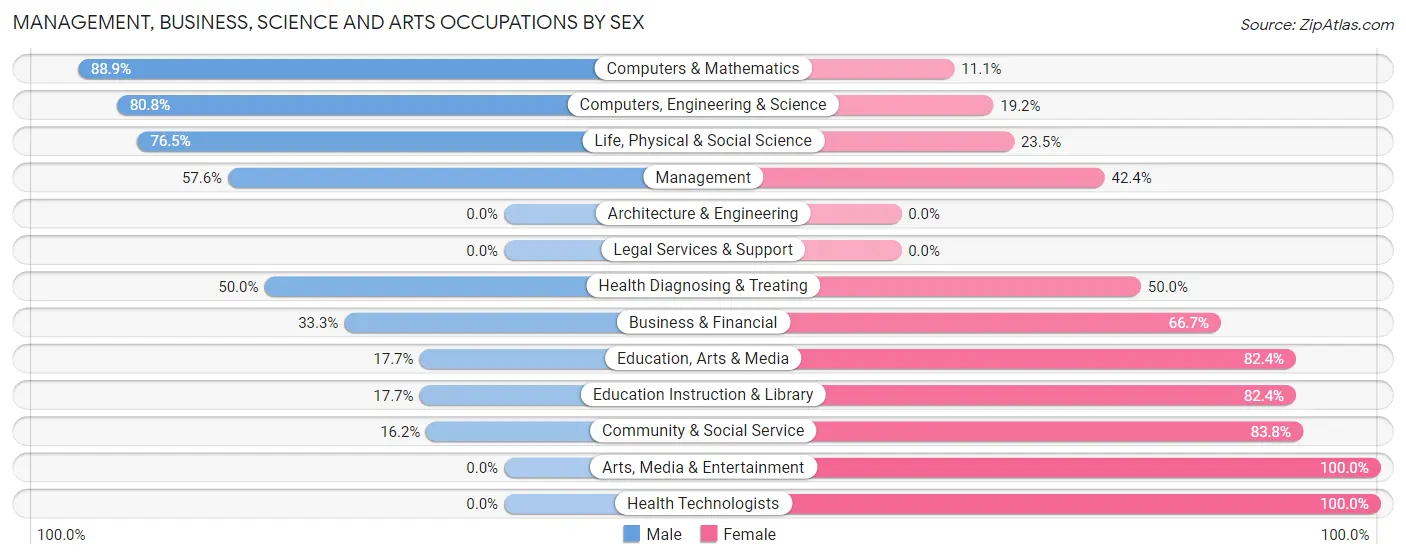
Management, Business, Science and Arts Occupations by Sex
Within the Management, Business, Science and Arts occupations in Lake and Peninsula Borough, the most male-oriented occupations are Computers & Mathematics (88.9%), Computers, Engineering & Science (80.8%), and Life, Physical & Social Science (76.5%), while the most female-oriented occupations are Arts, Media & Entertainment (100.0%), Health Technologists (100.0%), and Community & Social Service (83.8%).
| Occupation | Male | Female |
| Management | 38 (57.6%) | 28 (42.4%) |
| Business & Financial | 3 (33.3%) | 6 (66.7%) |
| Computers, Engineering & Science | 21 (80.8%) | 5 (19.2%) |
| Computers & Mathematics | 8 (88.9%) | 1 (11.1%) |
| Architecture & Engineering | 0 (0.0%) | 0 (0.0%) |
| Life, Physical & Social Science | 13 (76.5%) | 4 (23.5%) |
| Community & Social Service | 12 (16.2%) | 62 (83.8%) |
| Education, Arts & Media | 3 (17.6%) | 14 (82.4%) |
| Legal Services & Support | 0 (0.0%) | 0 (0.0%) |
| Education Instruction & Library | 9 (17.6%) | 42 (82.4%) |
| Arts, Media & Entertainment | 0 (0.0%) | 6 (100.0%) |
| Health Diagnosing & Treating | 2 (50.0%) | 2 (50.0%) |
| Health Technologists | 0 (0.0%) | 2 (100.0%) |
| Total (Category) | 76 (42.5%) | 103 (57.5%) |
| Total (Overall) | 287 (58.9%) | 200 (41.1%) |
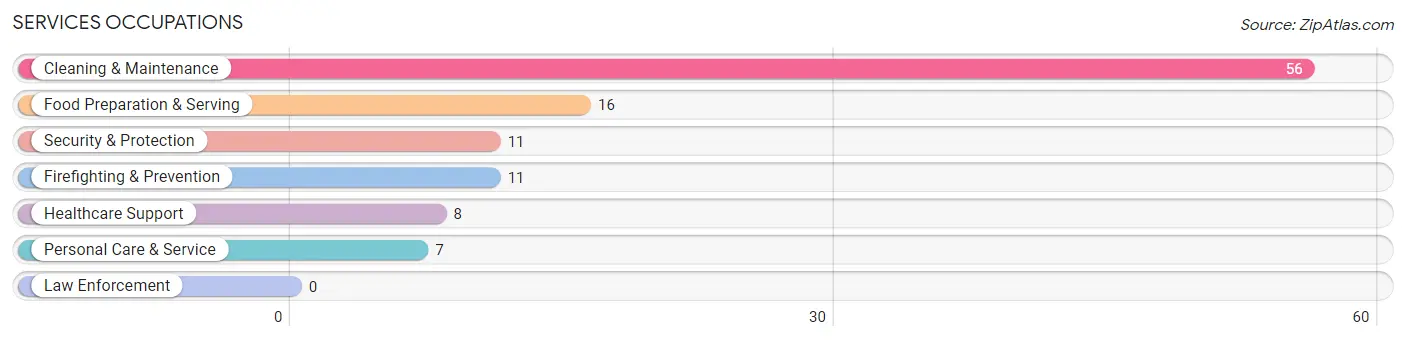
Services Occupations
The most common Services occupations in Lake and Peninsula Borough are Cleaning & Maintenance (56 | 11.5%), Food Preparation & Serving (16 | 3.3%), Security & Protection (11 | 2.3%), Firefighting & Prevention (11 | 2.3%), and Healthcare Support (8 | 1.6%).
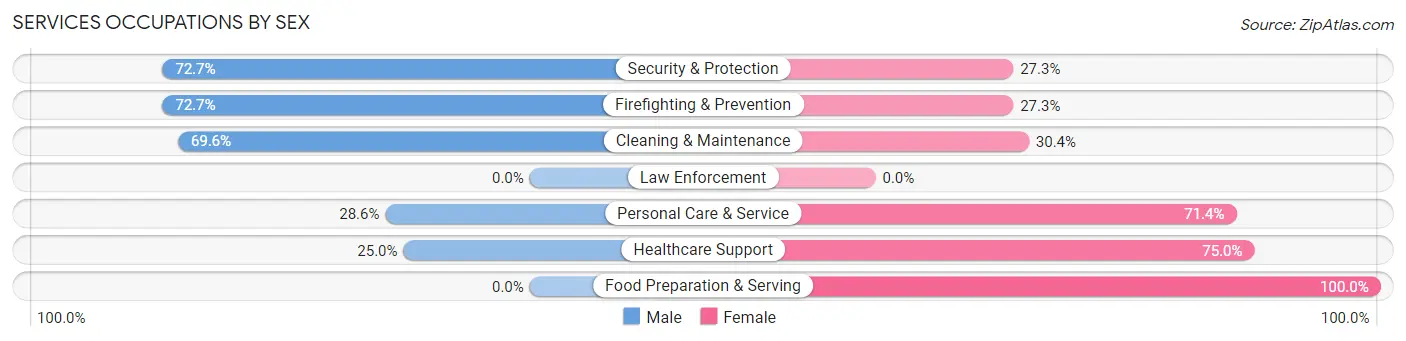
Services Occupations by Sex
Within the Services occupations in Lake and Peninsula Borough, the most male-oriented occupations are Security & Protection (72.7%), Firefighting & Prevention (72.7%), and Cleaning & Maintenance (69.6%), while the most female-oriented occupations are Food Preparation & Serving (100.0%), Healthcare Support (75.0%), and Personal Care & Service (71.4%).
| Occupation | Male | Female |
| Healthcare Support | 2 (25.0%) | 6 (75.0%) |
| Security & Protection | 8 (72.7%) | 3 (27.3%) |
| Firefighting & Prevention | 8 (72.7%) | 3 (27.3%) |
| Law Enforcement | 0 (0.0%) | 0 (0.0%) |
| Food Preparation & Serving | 0 (0.0%) | 16 (100.0%) |
| Cleaning & Maintenance | 39 (69.6%) | 17 (30.4%) |
| Personal Care & Service | 2 (28.6%) | 5 (71.4%) |
| Total (Category) | 51 (52.0%) | 47 (48.0%) |
| Total (Overall) | 287 (58.9%) | 200 (41.1%) |
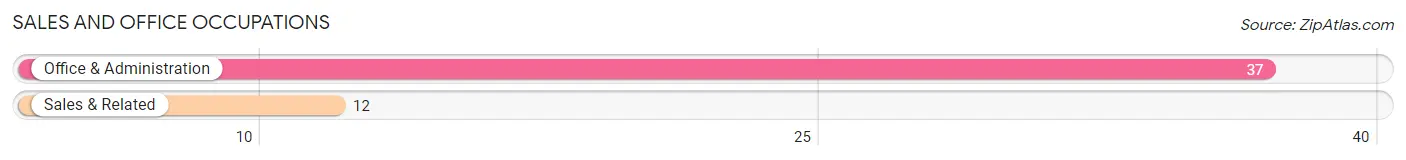
Sales and Office Occupations
The most common Sales and Office occupations in Lake and Peninsula Borough are Office & Administration (37 | 7.6%), and Sales & Related (12 | 2.5%).
Sales and Office Occupations by Sex
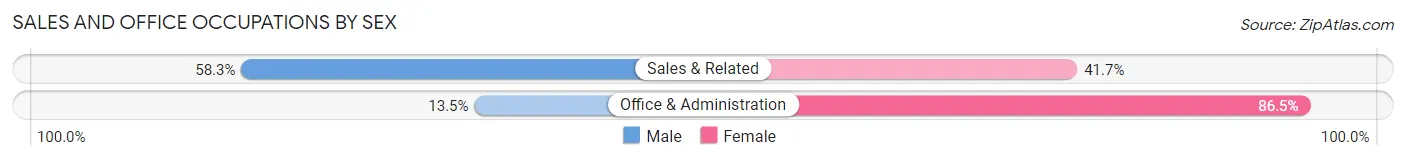
| Occupation | Male | Female |
| Sales & Related | 7 (58.3%) | 5 (41.7%) |
| Office & Administration | 5 (13.5%) | 32 (86.5%) |
| Total (Category) | 12 (24.5%) | 37 (75.5%) |
| Total (Overall) | 287 (58.9%) | 200 (41.1%) |
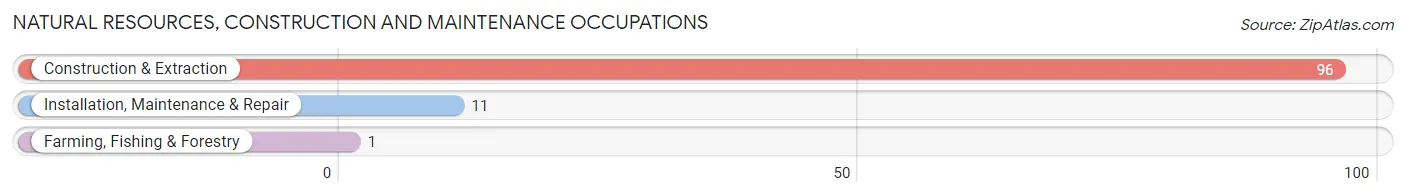
Natural Resources, Construction and Maintenance Occupations
The most common Natural Resources, Construction and Maintenance occupations in Lake and Peninsula Borough are Construction & Extraction (96 | 19.7%), Installation, Maintenance & Repair (11 | 2.3%), and Farming, Fishing & Forestry (1 | 0.2%).
Natural Resources, Construction and Maintenance Occupations by Sex
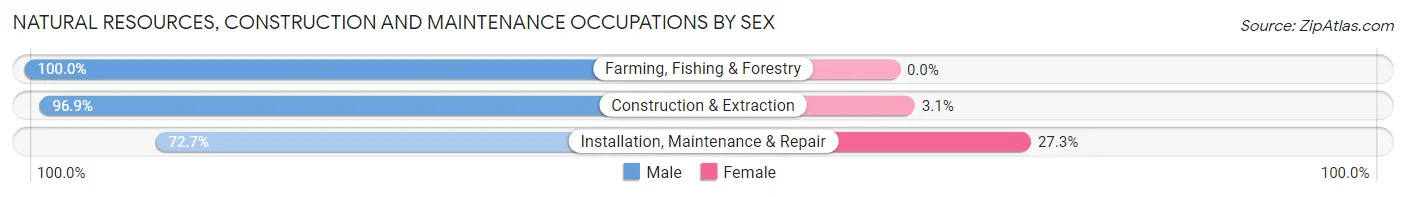
| Occupation | Male | Female |
| Farming, Fishing & Forestry | 1 (100.0%) | 0 (0.0%) |
| Construction & Extraction | 93 (96.9%) | 3 (3.1%) |
| Installation, Maintenance & Repair | 8 (72.7%) | 3 (27.3%) |
| Total (Category) | 102 (94.4%) | 6 (5.6%) |
| Total (Overall) | 287 (58.9%) | 200 (41.1%) |
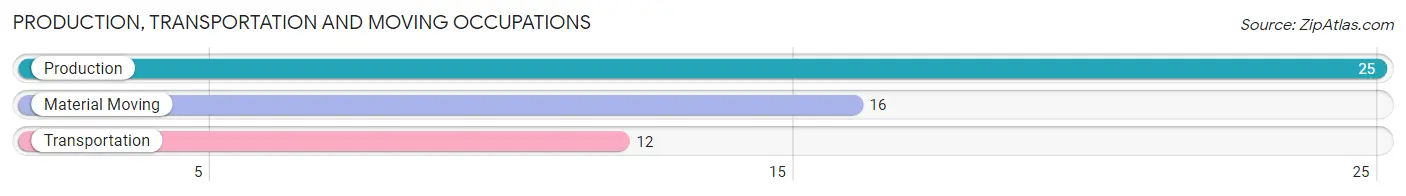
Production, Transportation and Moving Occupations
The most common Production, Transportation and Moving occupations in Lake and Peninsula Borough are Production (25 | 5.1%), Material Moving (16 | 3.3%), and Transportation (12 | 2.5%).
Production, Transportation and Moving Occupations by Sex
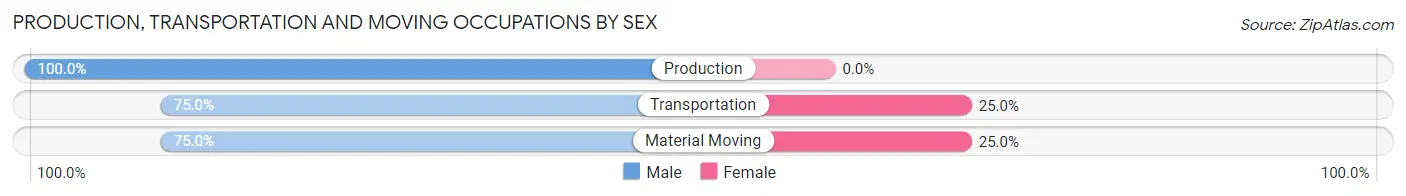
| Occupation | Male | Female |
| Production | 25 (100.0%) | 0 (0.0%) |
| Transportation | 9 (75.0%) | 3 (25.0%) |
| Material Moving | 12 (75.0%) | 4 (25.0%) |
| Total (Category) | 46 (86.8%) | 7 (13.2%) |
| Total (Overall) | 287 (58.9%) | 200 (41.1%) |
Employment Industries by Sex in Lake and Peninsula Borough
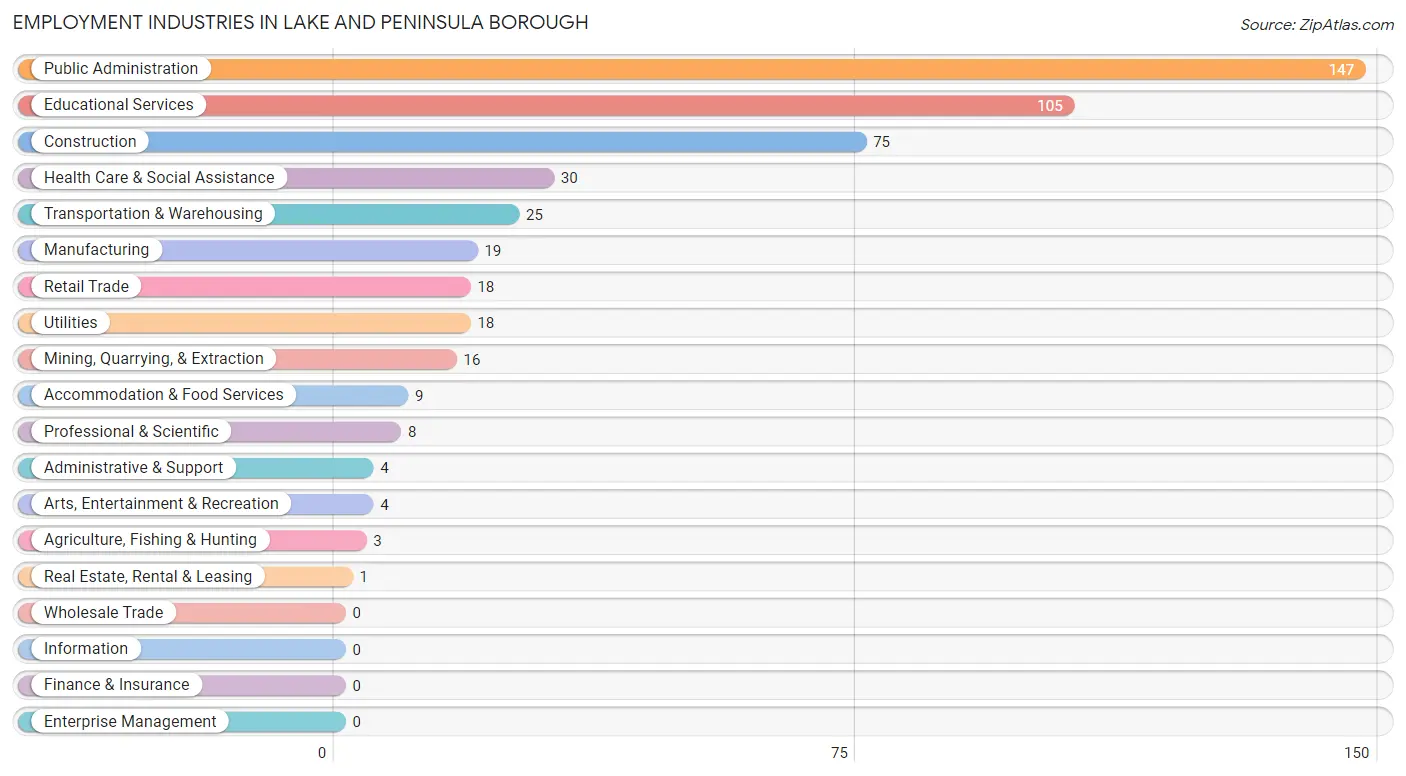
Employment Industries in Lake and Peninsula Borough
The major employment industries in Lake and Peninsula Borough include Public Administration (147 | 30.2%), Educational Services (105 | 21.6%), Construction (75 | 15.4%), Health Care & Social Assistance (30 | 6.2%), and Transportation & Warehousing (25 | 5.1%).
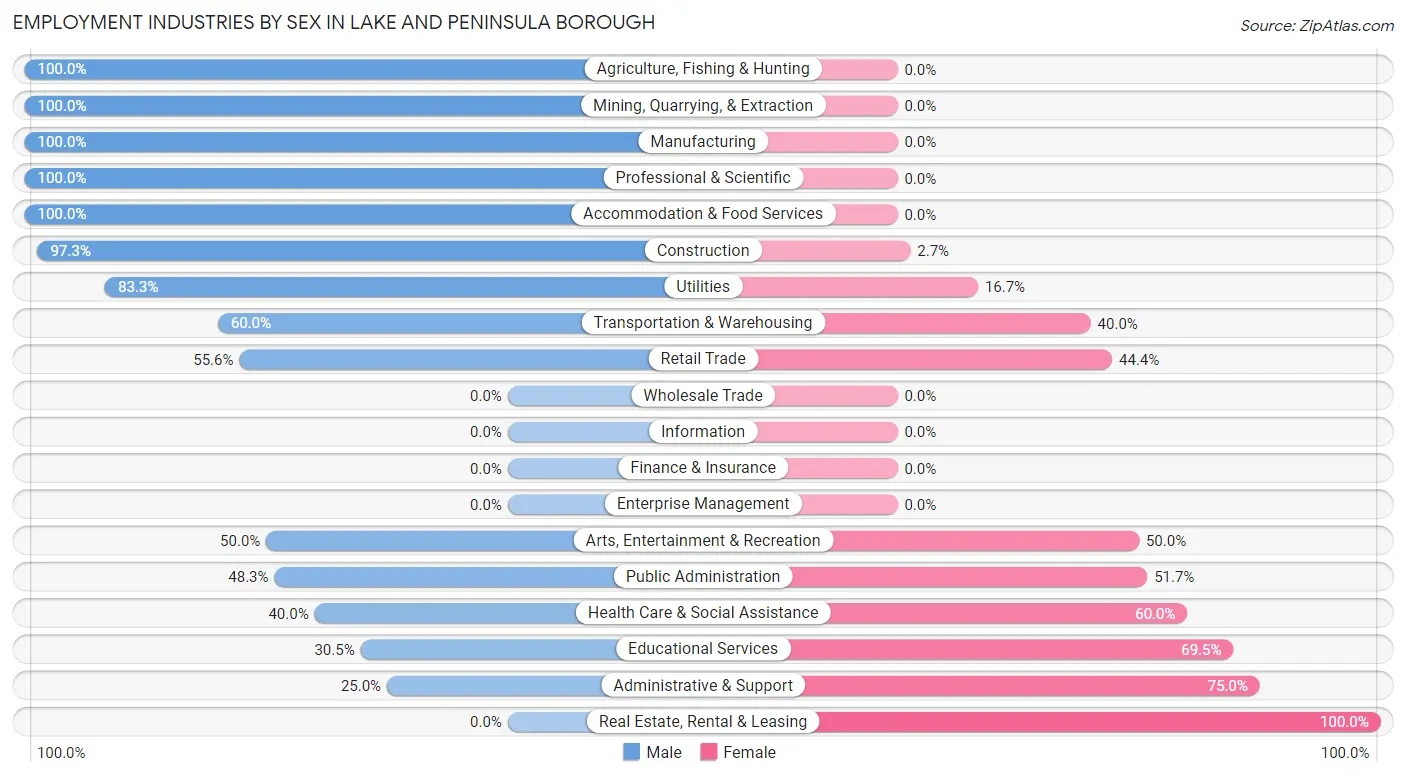
Employment Industries by Sex in Lake and Peninsula Borough
The Lake and Peninsula Borough industries that see more men than women are Agriculture, Fishing & Hunting (100.0%), Mining, Quarrying, & Extraction (100.0%), and Manufacturing (100.0%), whereas the industries that tend to have a higher number of women are Real Estate, Rental & Leasing (100.0%), Administrative & Support (75.0%), and Educational Services (69.5%).
| Industry | Male | Female |
| Agriculture, Fishing & Hunting | 3 (100.0%) | 0 (0.0%) |
| Mining, Quarrying, & Extraction | 16 (100.0%) | 0 (0.0%) |
| Construction | 73 (97.3%) | 2 (2.7%) |
| Manufacturing | 19 (100.0%) | 0 (0.0%) |
| Wholesale Trade | 0 (0.0%) | 0 (0.0%) |
| Retail Trade | 10 (55.6%) | 8 (44.4%) |
| Transportation & Warehousing | 15 (60.0%) | 10 (40.0%) |
| Utilities | 15 (83.3%) | 3 (16.7%) |
| Information | 0 (0.0%) | 0 (0.0%) |
| Finance & Insurance | 0 (0.0%) | 0 (0.0%) |
| Real Estate, Rental & Leasing | 0 (0.0%) | 1 (100.0%) |
| Professional & Scientific | 8 (100.0%) | 0 (0.0%) |
| Enterprise Management | 0 (0.0%) | 0 (0.0%) |
| Administrative & Support | 1 (25.0%) | 3 (75.0%) |
| Educational Services | 32 (30.5%) | 73 (69.5%) |
| Health Care & Social Assistance | 12 (40.0%) | 18 (60.0%) |
| Arts, Entertainment & Recreation | 2 (50.0%) | 2 (50.0%) |
| Accommodation & Food Services | 9 (100.0%) | 0 (0.0%) |
| Public Administration | 71 (48.3%) | 76 (51.7%) |
| Total | 287 (58.9%) | 200 (41.1%) |
Education in Lake and Peninsula Borough
School Enrollment in Lake and Peninsula Borough
The most common levels of schooling among the 237 students in Lake and Peninsula Borough are high school (59 | 24.9%), elementary school (57 | 24.0%), and middle school (57 | 24.0%).
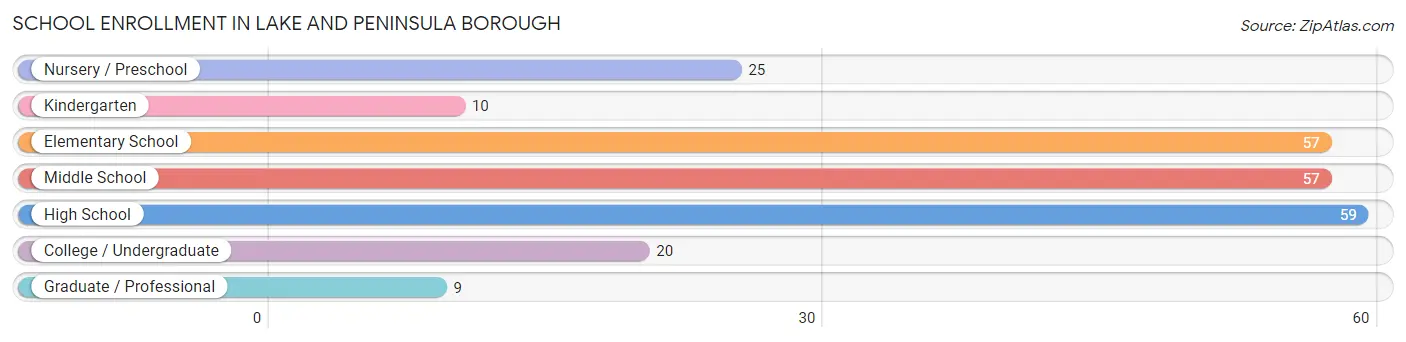
| School Level | # Students | % Students |
| Nursery / Preschool | 25 | 10.5% |
| Kindergarten | 10 | 4.2% |
| Elementary School | 57 | 24.0% |
| Middle School | 57 | 24.0% |
| High School | 59 | 24.9% |
| College / Undergraduate | 20 | 8.4% |
| Graduate / Professional | 9 | 3.8% |
| Total | 237 | 100.0% |
School Enrollment by Age by Funding Source in Lake and Peninsula Borough
Out of a total of 237 students who are enrolled in schools in Lake and Peninsula Borough, 15 (6.3%) attend a private institution, while the remaining 222 (93.7%) are enrolled in public schools. The age group of 3 to 4 year olds has the highest likelihood of being enrolled in private schools, with 11 (44.0% in the age bracket) enrolled. Conversely, the age group of 5 to 9 year old has the lowest likelihood of being enrolled in a private school, with 66 (100.0% in the age bracket) attending a public institution.
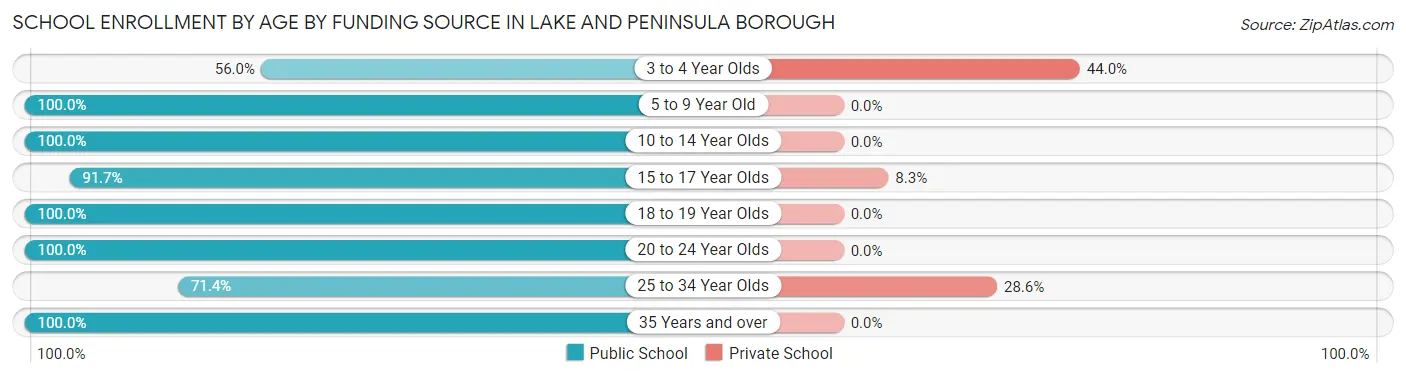
| Age Bracket | Public School | Private School |
| 3 to 4 Year Olds | 14 (56.0%) | 11 (44.0%) |
| 5 to 9 Year Old | 66 (100.0%) | 0 (0.0%) |
| 10 to 14 Year Olds | 76 (100.0%) | 0 (0.0%) |
| 15 to 17 Year Olds | 22 (91.7%) | 2 (8.3%) |
| 18 to 19 Year Olds | 22 (100.0%) | 0 (0.0%) |
| 20 to 24 Year Olds | 12 (100.0%) | 0 (0.0%) |
| 25 to 34 Year Olds | 5 (71.4%) | 2 (28.6%) |
| 35 Years and over | 5 (100.0%) | 0 (0.0%) |
| Total | 222 (93.7%) | 15 (6.3%) |
Educational Attainment by Field of Study in Lake and Peninsula Borough
Education (40 | 38.8%), bio, nature & agricultural (18 | 17.5%), liberal arts & history (13 | 12.6%), arts & humanities (12 | 11.7%), and social sciences (5 | 4.9%) are the most common fields of study among 103 individuals in Lake and Peninsula Borough who have obtained a bachelor's degree or higher.
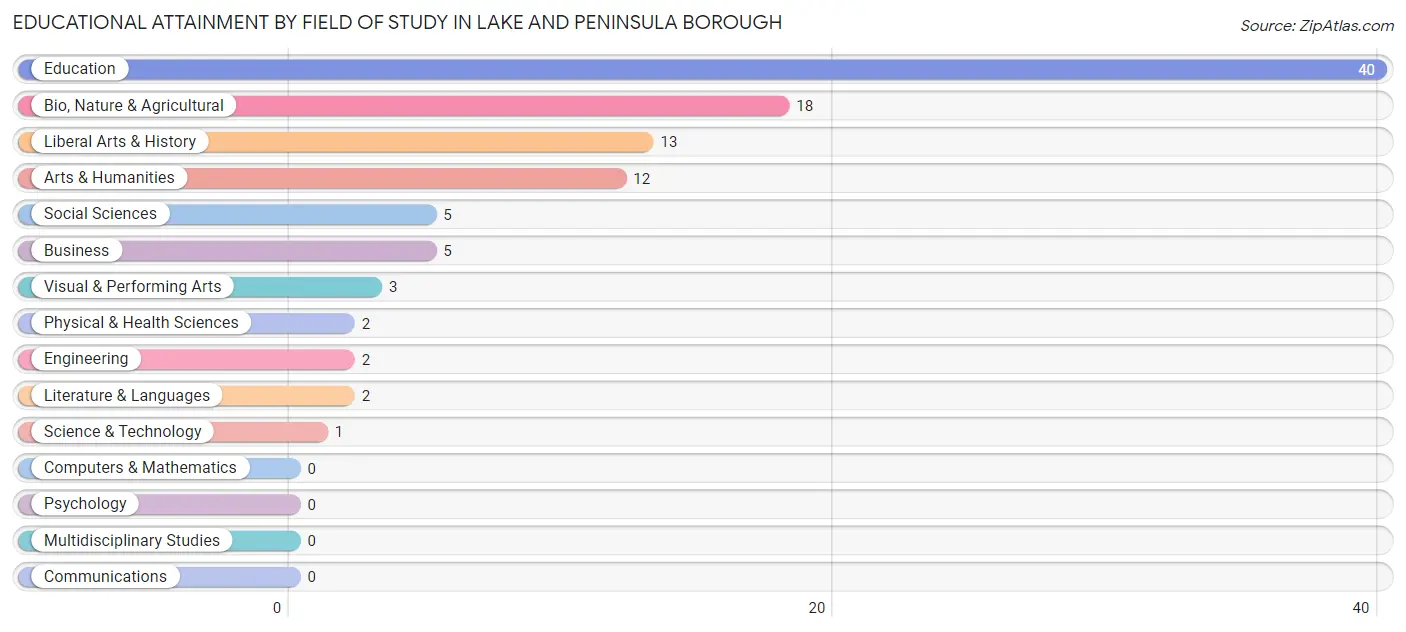
| Field of Study | # Graduates | % Graduates |
| Computers & Mathematics | 0 | 0.0% |
| Bio, Nature & Agricultural | 18 | 17.5% |
| Physical & Health Sciences | 2 | 1.9% |
| Psychology | 0 | 0.0% |
| Social Sciences | 5 | 4.9% |
| Engineering | 2 | 1.9% |
| Multidisciplinary Studies | 0 | 0.0% |
| Science & Technology | 1 | 1.0% |
| Business | 5 | 4.9% |
| Education | 40 | 38.8% |
| Literature & Languages | 2 | 1.9% |
| Liberal Arts & History | 13 | 12.6% |
| Visual & Performing Arts | 3 | 2.9% |
| Communications | 0 | 0.0% |
| Arts & Humanities | 12 | 11.7% |
| Total | 103 | 100.0% |
Transportation & Commute in Lake and Peninsula Borough
Vehicle Availability by Sex in Lake and Peninsula Borough
The most prevalent vehicle ownership categories in Lake and Peninsula Borough are males with no vehicle (47, accounting for 31.5%) and females with no vehicle (74, making up 23.9%).
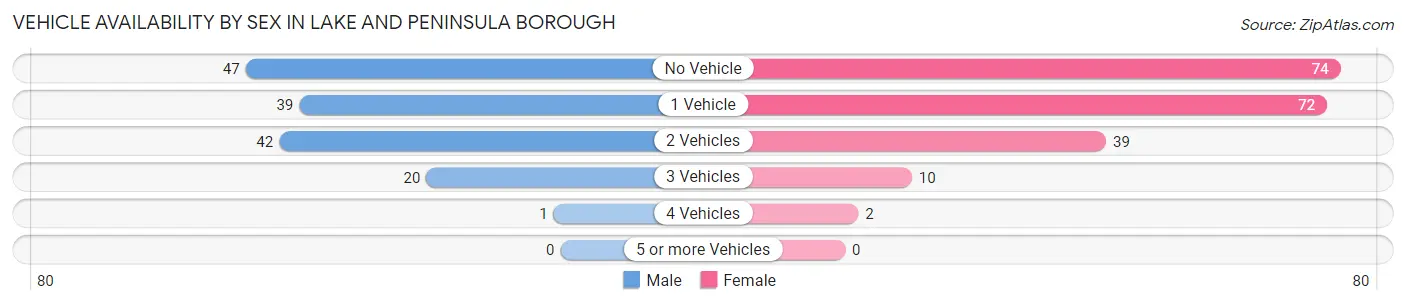
| Vehicles Available | Male | Female |
| No Vehicle | 47 (31.5%) | 74 (37.6%) |
| 1 Vehicle | 39 (26.2%) | 72 (36.5%) |
| 2 Vehicles | 42 (28.2%) | 39 (19.8%) |
| 3 Vehicles | 20 (13.4%) | 10 (5.1%) |
| 4 Vehicles | 1 (0.7%) | 2 (1.0%) |
| 5 or more Vehicles | 0 (0.0%) | 0 (0.0%) |
| Total | 149 (100.0%) | 197 (100.0%) |
Commute Time in Lake and Peninsula Borough
The most frequently occuring commute durations in Lake and Peninsula Borough are less than 5 minutes (182 commuters, 39.7%), 5 to 9 minutes (141 commuters, 30.8%), and 15 to 19 minutes (80 commuters, 17.5%).
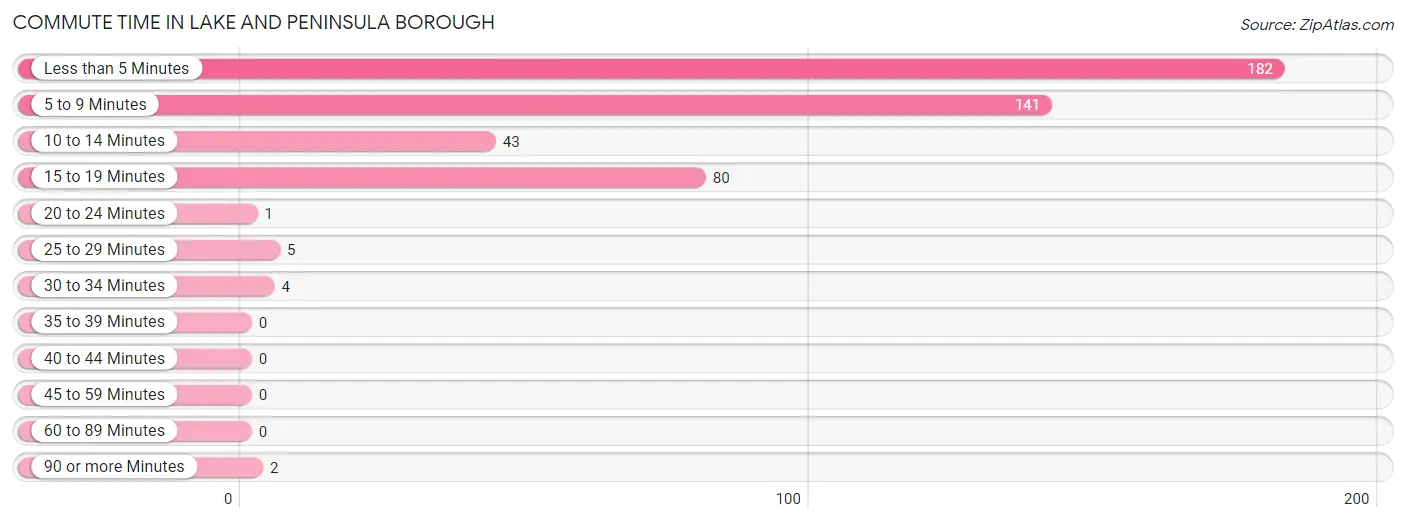
| Commute Time | # Commuters | % Commuters |
| Less than 5 Minutes | 182 | 39.7% |
| 5 to 9 Minutes | 141 | 30.8% |
| 10 to 14 Minutes | 43 | 9.4% |
| 15 to 19 Minutes | 80 | 17.5% |
| 20 to 24 Minutes | 1 | 0.2% |
| 25 to 29 Minutes | 5 | 1.1% |
| 30 to 34 Minutes | 4 | 0.9% |
| 35 to 39 Minutes | 0 | 0.0% |
| 40 to 44 Minutes | 0 | 0.0% |
| 45 to 59 Minutes | 0 | 0.0% |
| 60 to 89 Minutes | 0 | 0.0% |
| 90 or more Minutes | 2 | 0.4% |
Commute Time by Sex in Lake and Peninsula Borough
The most common commute times in Lake and Peninsula Borough are less than 5 minutes (89 commuters, 32.7%) for males and less than 5 minutes (93 commuters, 50.0%) for females.
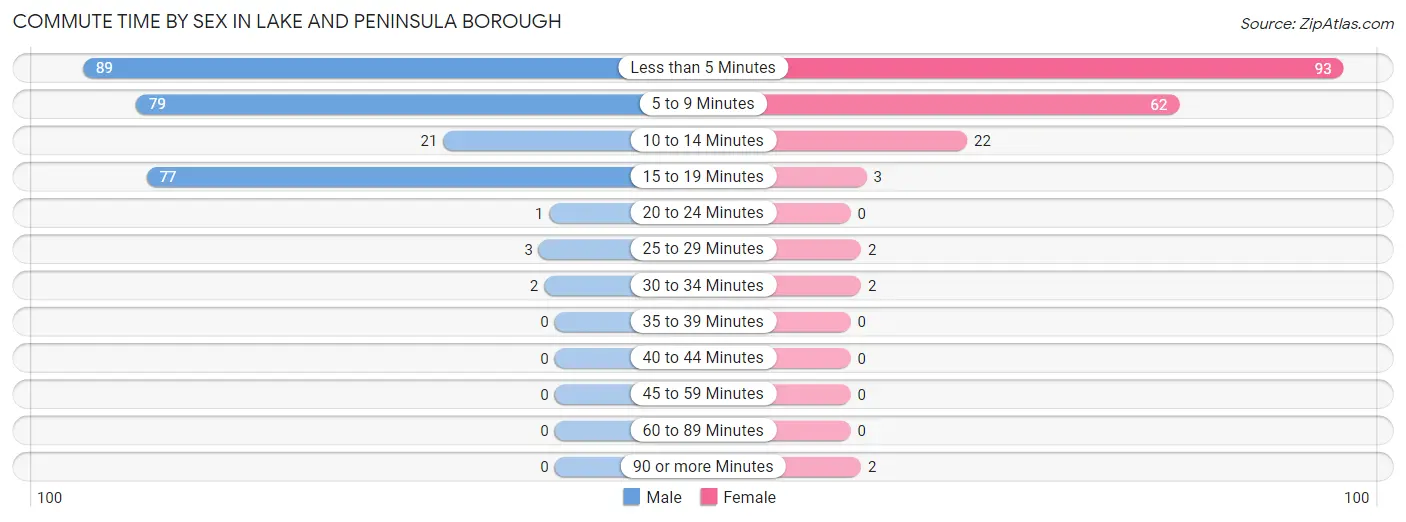
| Commute Time | Male | Female |
| Less than 5 Minutes | 89 (32.7%) | 93 (50.0%) |
| 5 to 9 Minutes | 79 (29.0%) | 62 (33.3%) |
| 10 to 14 Minutes | 21 (7.7%) | 22 (11.8%) |
| 15 to 19 Minutes | 77 (28.3%) | 3 (1.6%) |
| 20 to 24 Minutes | 1 (0.4%) | 0 (0.0%) |
| 25 to 29 Minutes | 3 (1.1%) | 2 (1.1%) |
| 30 to 34 Minutes | 2 (0.7%) | 2 (1.1%) |
| 35 to 39 Minutes | 0 (0.0%) | 0 (0.0%) |
| 40 to 44 Minutes | 0 (0.0%) | 0 (0.0%) |
| 45 to 59 Minutes | 0 (0.0%) | 0 (0.0%) |
| 60 to 89 Minutes | 0 (0.0%) | 0 (0.0%) |
| 90 or more Minutes | 0 (0.0%) | 2 (1.1%) |
Time of Departure to Work by Sex in Lake and Peninsula Borough
The most frequent times of departure to work in Lake and Peninsula Borough are 8:00 AM to 8:29 AM (97, 35.7%) for males and 9:00 AM to 9:59 AM (46, 24.7%) for females.
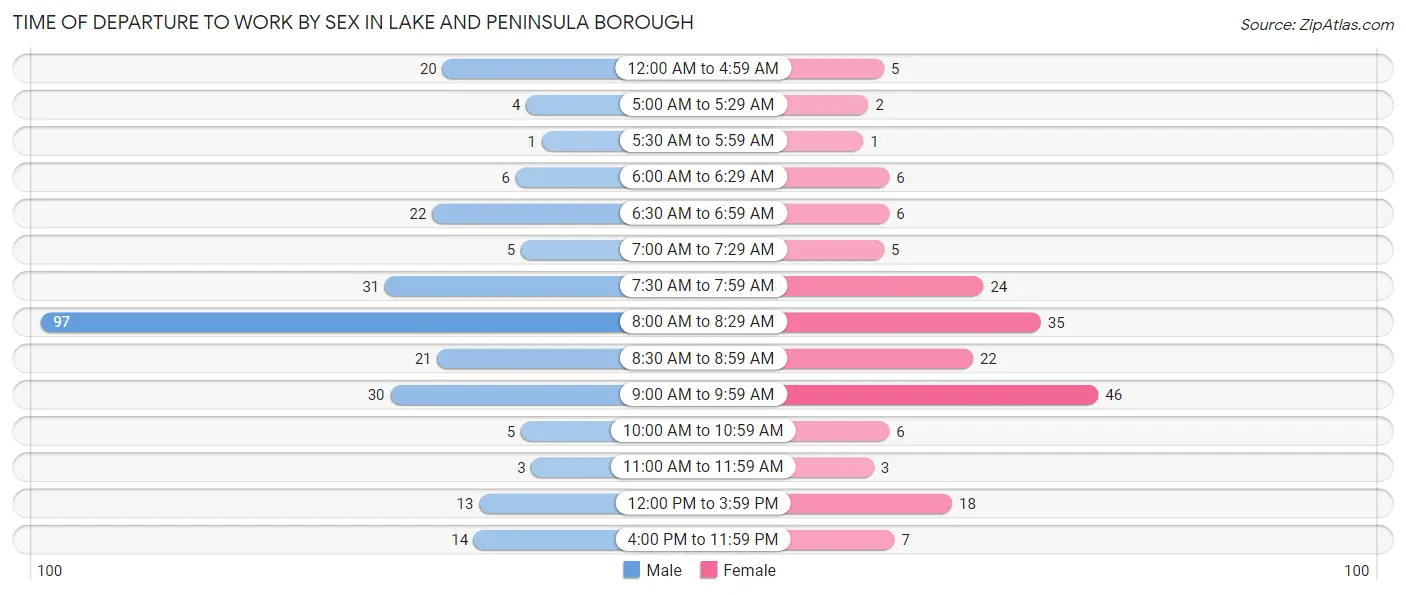
| Time of Departure | Male | Female |
| 12:00 AM to 4:59 AM | 20 (7.3%) | 5 (2.7%) |
| 5:00 AM to 5:29 AM | 4 (1.5%) | 2 (1.1%) |
| 5:30 AM to 5:59 AM | 1 (0.4%) | 1 (0.5%) |
| 6:00 AM to 6:29 AM | 6 (2.2%) | 6 (3.2%) |
| 6:30 AM to 6:59 AM | 22 (8.1%) | 6 (3.2%) |
| 7:00 AM to 7:29 AM | 5 (1.8%) | 5 (2.7%) |
| 7:30 AM to 7:59 AM | 31 (11.4%) | 24 (12.9%) |
| 8:00 AM to 8:29 AM | 97 (35.7%) | 35 (18.8%) |
| 8:30 AM to 8:59 AM | 21 (7.7%) | 22 (11.8%) |
| 9:00 AM to 9:59 AM | 30 (11.0%) | 46 (24.7%) |
| 10:00 AM to 10:59 AM | 5 (1.8%) | 6 (3.2%) |
| 11:00 AM to 11:59 AM | 3 (1.1%) | 3 (1.6%) |
| 12:00 PM to 3:59 PM | 13 (4.8%) | 18 (9.7%) |
| 4:00 PM to 11:59 PM | 14 (5.1%) | 7 (3.8%) |
| Total | 272 (100.0%) | 186 (100.0%) |
Housing Occupancy in Lake and Peninsula Borough
Occupancy by Ownership in Lake and Peninsula Borough
Of the total 326 dwellings in Lake and Peninsula Borough, owner-occupied units account for 219 (67.2%), while renter-occupied units make up 107 (32.8%).
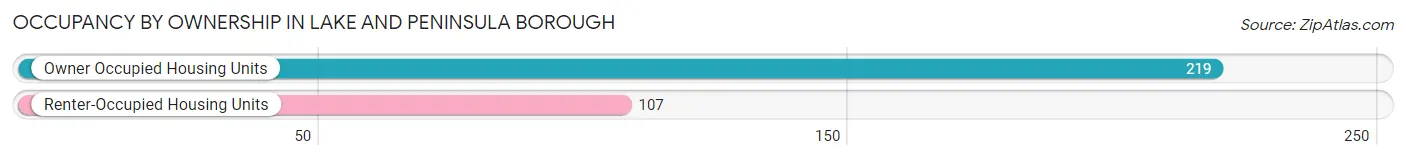
| Occupancy | # Housing Units | % Housing Units |
| Owner Occupied Housing Units | 219 | 67.2% |
| Renter-Occupied Housing Units | 107 | 32.8% |
| Total Occupied Housing Units | 326 | 100.0% |
Occupancy by Household Size in Lake and Peninsula Borough
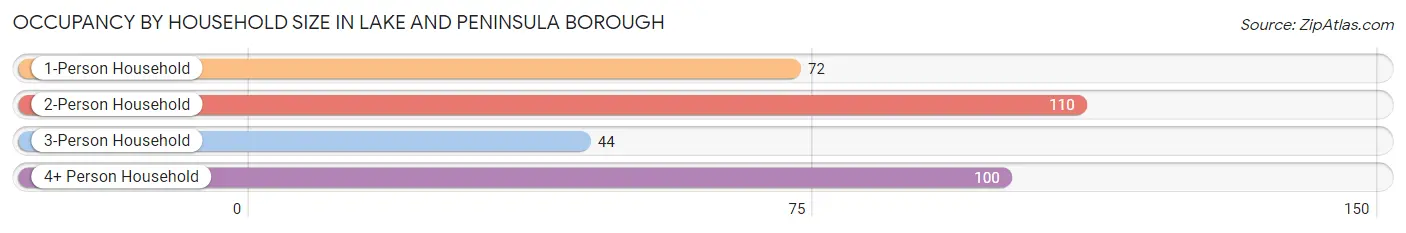
| Household Size | # Housing Units | % Housing Units |
| 1-Person Household | 72 | 22.1% |
| 2-Person Household | 110 | 33.7% |
| 3-Person Household | 44 | 13.5% |
| 4+ Person Household | 100 | 30.7% |
| Total Housing Units | 326 | 100.0% |
Occupancy by Ownership by Household Size in Lake and Peninsula Borough
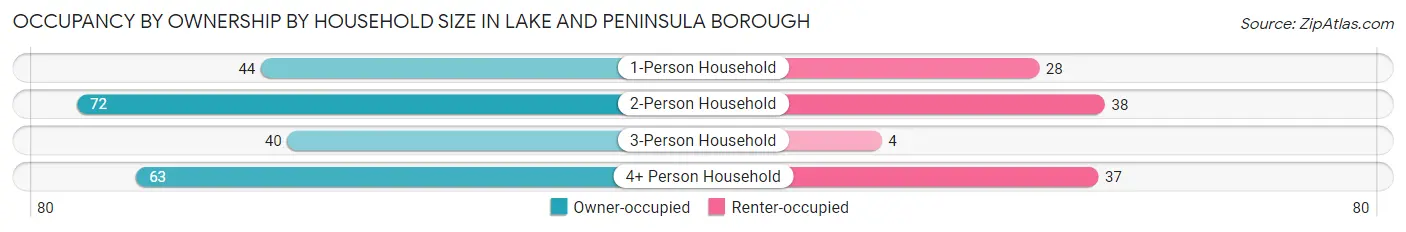
| Household Size | Owner-occupied | Renter-occupied |
| 1-Person Household | 44 (61.1%) | 28 (38.9%) |
| 2-Person Household | 72 (65.4%) | 38 (34.5%) |
| 3-Person Household | 40 (90.9%) | 4 (9.1%) |
| 4+ Person Household | 63 (63.0%) | 37 (37.0%) |
| Total Housing Units | 219 (67.2%) | 107 (32.8%) |
Occupancy by Educational Attainment in Lake and Peninsula Borough
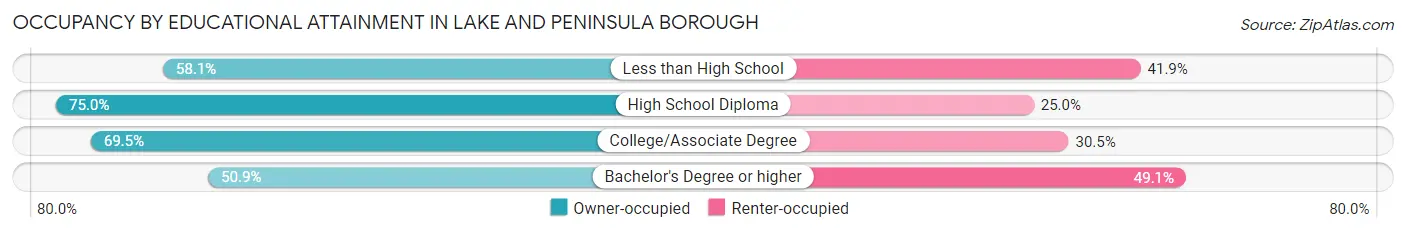
| Household Size | Owner-occupied | Renter-occupied |
| Less than High School | 18 (58.1%) | 13 (41.9%) |
| High School Diploma | 90 (75.0%) | 30 (25.0%) |
| College/Associate Degree | 82 (69.5%) | 36 (30.5%) |
| Bachelor's Degree or higher | 29 (50.9%) | 28 (49.1%) |
Occupancy by Age of Householder in Lake and Peninsula Borough
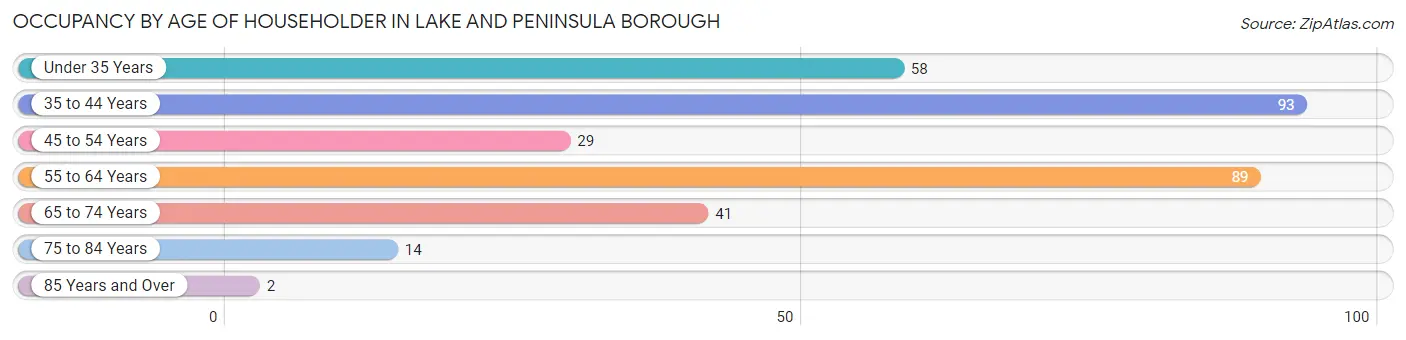
| Age Bracket | # Households | % Households |
| Under 35 Years | 58 | 17.8% |
| 35 to 44 Years | 93 | 28.5% |
| 45 to 54 Years | 29 | 8.9% |
| 55 to 64 Years | 89 | 27.3% |
| 65 to 74 Years | 41 | 12.6% |
| 75 to 84 Years | 14 | 4.3% |
| 85 Years and Over | 2 | 0.6% |
| Total | 326 | 100.0% |
Housing Finances in Lake and Peninsula Borough
Median Income by Occupancy in Lake and Peninsula Borough
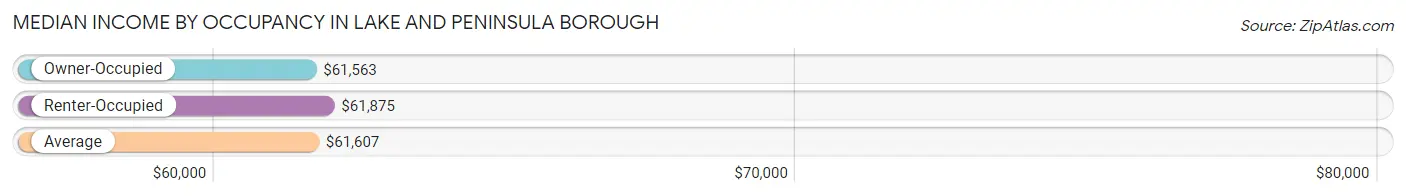
| Occupancy Type | # Households | Median Income |
| Owner-Occupied | 219 (67.2%) | $61,563 |
| Renter-Occupied | 107 (32.8%) | $61,875 |
| Average | 326 (100.0%) | $61,607 |
Occupancy by Householder Income Bracket in Lake and Peninsula Borough
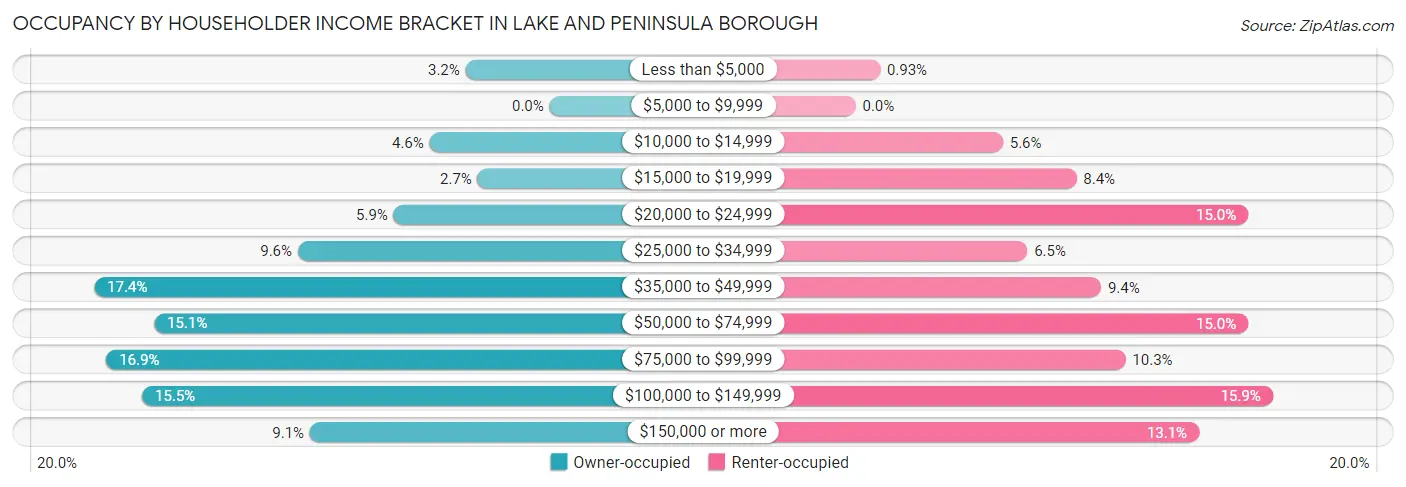
| Income Bracket | Owner-occupied | Renter-occupied |
| Less than $5,000 | 7 (3.2%) | 1 (0.9%) |
| $5,000 to $9,999 | 0 (0.0%) | 0 (0.0%) |
| $10,000 to $14,999 | 10 (4.6%) | 6 (5.6%) |
| $15,000 to $19,999 | 6 (2.7%) | 9 (8.4%) |
| $20,000 to $24,999 | 13 (5.9%) | 16 (14.9%) |
| $25,000 to $34,999 | 21 (9.6%) | 7 (6.5%) |
| $35,000 to $49,999 | 38 (17.3%) | 10 (9.3%) |
| $50,000 to $74,999 | 33 (15.1%) | 16 (14.9%) |
| $75,000 to $99,999 | 37 (16.9%) | 11 (10.3%) |
| $100,000 to $149,999 | 34 (15.5%) | 17 (15.9%) |
| $150,000 or more | 20 (9.1%) | 14 (13.1%) |
| Total | 219 (100.0%) | 107 (100.0%) |
Monthly Housing Cost Tiers in Lake and Peninsula Borough
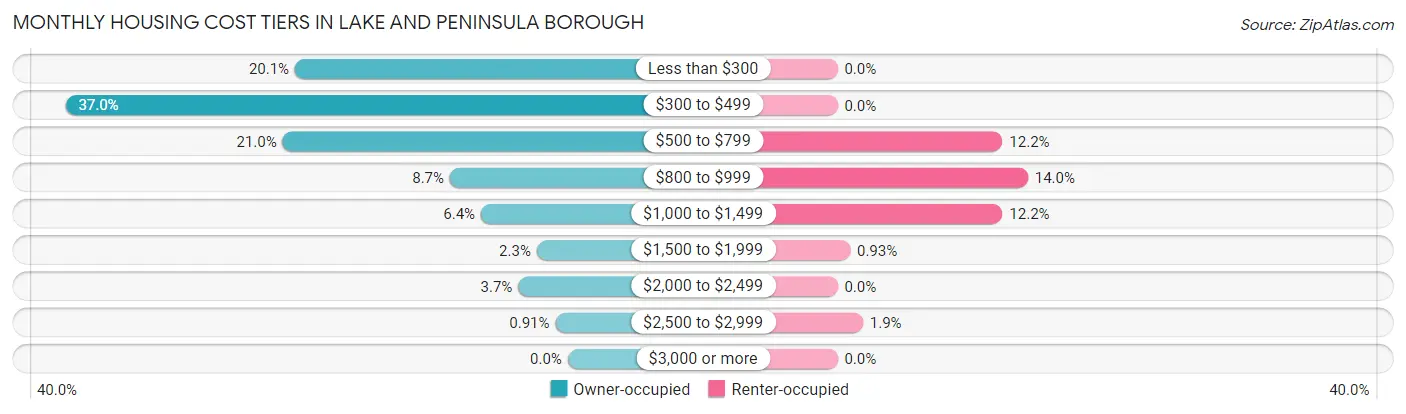
| Monthly Cost | Owner-occupied | Renter-occupied |
| Less than $300 | 44 (20.1%) | 0 (0.0%) |
| $300 to $499 | 81 (37.0%) | 0 (0.0%) |
| $500 to $799 | 46 (21.0%) | 13 (12.1%) |
| $800 to $999 | 19 (8.7%) | 15 (14.0%) |
| $1,000 to $1,499 | 14 (6.4%) | 13 (12.1%) |
| $1,500 to $1,999 | 5 (2.3%) | 1 (0.9%) |
| $2,000 to $2,499 | 8 (3.6%) | 0 (0.0%) |
| $2,500 to $2,999 | 2 (0.9%) | 2 (1.9%) |
| $3,000 or more | 0 (0.0%) | 0 (0.0%) |
| Total | 219 (100.0%) | 107 (100.0%) |
Physical Housing Characteristics in Lake and Peninsula Borough
Housing Structures in Lake and Peninsula Borough
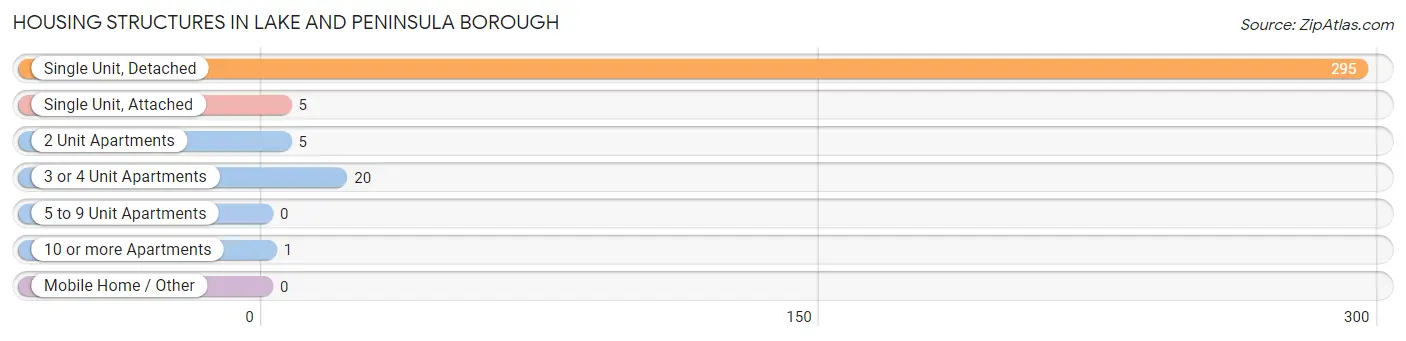
| Structure Type | # Housing Units | % Housing Units |
| Single Unit, Detached | 295 | 90.5% |
| Single Unit, Attached | 5 | 1.5% |
| 2 Unit Apartments | 5 | 1.5% |
| 3 or 4 Unit Apartments | 20 | 6.1% |
| 5 to 9 Unit Apartments | 0 | 0.0% |
| 10 or more Apartments | 1 | 0.3% |
| Mobile Home / Other | 0 | 0.0% |
| Total | 326 | 100.0% |
Housing Structures by Occupancy in Lake and Peninsula Borough
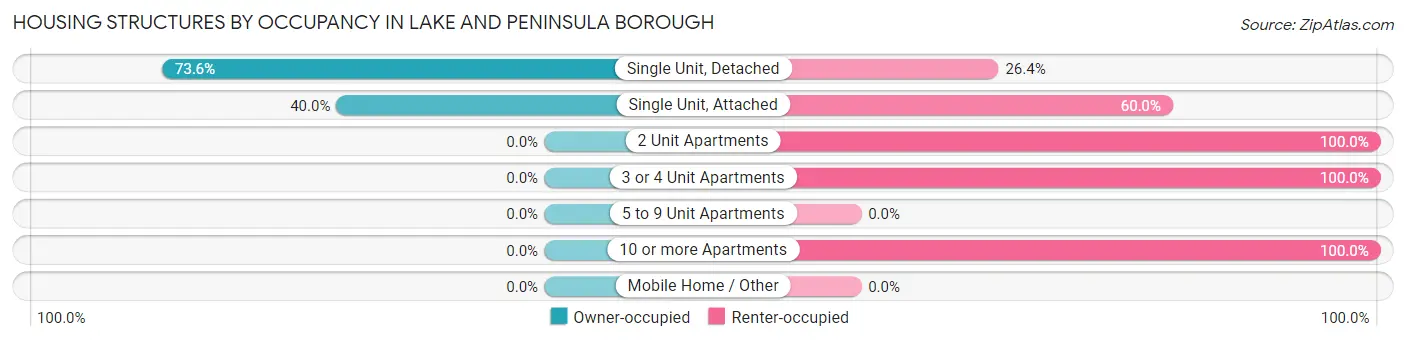
| Structure Type | Owner-occupied | Renter-occupied |
| Single Unit, Detached | 217 (73.6%) | 78 (26.4%) |
| Single Unit, Attached | 2 (40.0%) | 3 (60.0%) |
| 2 Unit Apartments | 0 (0.0%) | 5 (100.0%) |
| 3 or 4 Unit Apartments | 0 (0.0%) | 20 (100.0%) |
| 5 to 9 Unit Apartments | 0 (0.0%) | 0 (0.0%) |
| 10 or more Apartments | 0 (0.0%) | 1 (100.0%) |
| Mobile Home / Other | 0 (0.0%) | 0 (0.0%) |
| Total | 219 (67.2%) | 107 (32.8%) |
Housing Structures by Number of Rooms in Lake and Peninsula Borough
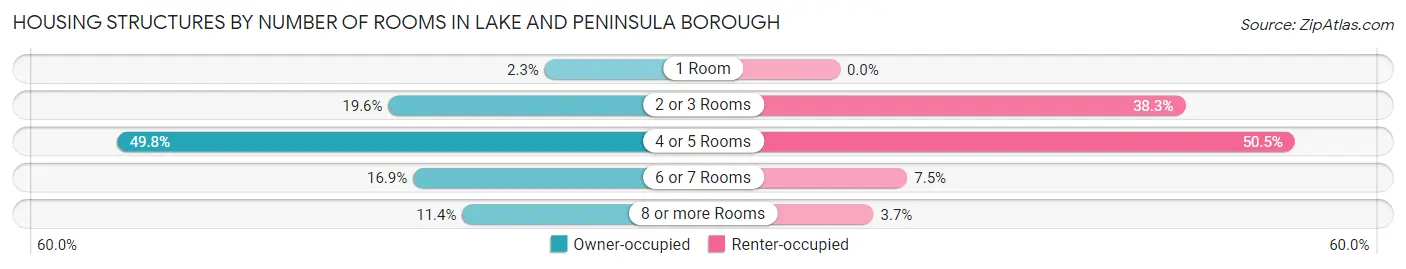
| Number of Rooms | Owner-occupied | Renter-occupied |
| 1 Room | 5 (2.3%) | 0 (0.0%) |
| 2 or 3 Rooms | 43 (19.6%) | 41 (38.3%) |
| 4 or 5 Rooms | 109 (49.8%) | 54 (50.5%) |
| 6 or 7 Rooms | 37 (16.9%) | 8 (7.5%) |
| 8 or more Rooms | 25 (11.4%) | 4 (3.7%) |
| Total | 219 (100.0%) | 107 (100.0%) |
Housing Structure by Heating Type in Lake and Peninsula Borough
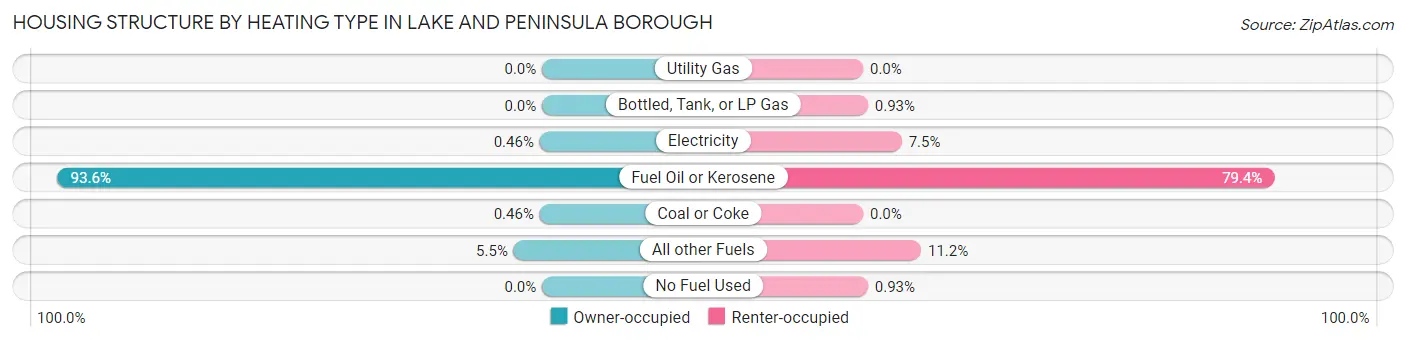
| Heating Type | Owner-occupied | Renter-occupied |
| Utility Gas | 0 (0.0%) | 0 (0.0%) |
| Bottled, Tank, or LP Gas | 0 (0.0%) | 1 (0.9%) |
| Electricity | 1 (0.5%) | 8 (7.5%) |
| Fuel Oil or Kerosene | 205 (93.6%) | 85 (79.4%) |
| Coal or Coke | 1 (0.5%) | 0 (0.0%) |
| All other Fuels | 12 (5.5%) | 12 (11.2%) |
| No Fuel Used | 0 (0.0%) | 1 (0.9%) |
| Total | 219 (100.0%) | 107 (100.0%) |
Household Vehicle Usage in Lake and Peninsula Borough
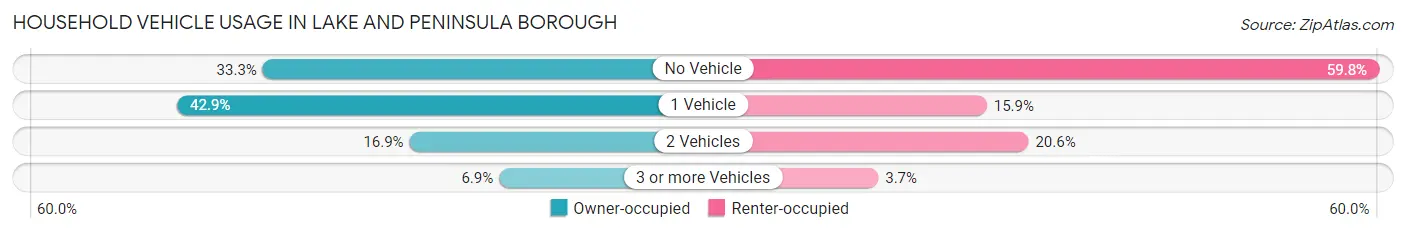
| Vehicles per Household | Owner-occupied | Renter-occupied |
| No Vehicle | 73 (33.3%) | 64 (59.8%) |
| 1 Vehicle | 94 (42.9%) | 17 (15.9%) |
| 2 Vehicles | 37 (16.9%) | 22 (20.6%) |
| 3 or more Vehicles | 15 (6.9%) | 4 (3.7%) |
| Total | 219 (100.0%) | 107 (100.0%) |
Real Estate & Mortgages in Lake and Peninsula Borough
Real Estate and Mortgage Overview in Lake and Peninsula Borough
| Characteristic | Without Mortgage | With Mortgage |
| Housing Units | 165 | 54 |
| Median Property Value | $145,200 | $331,300 |
| Median Household Income | $59,375 | $3 |
| Monthly Housing Costs | $395 | $0 |
| Real Estate Taxes | - | - |
Property Value by Mortgage Status in Lake and Peninsula Borough
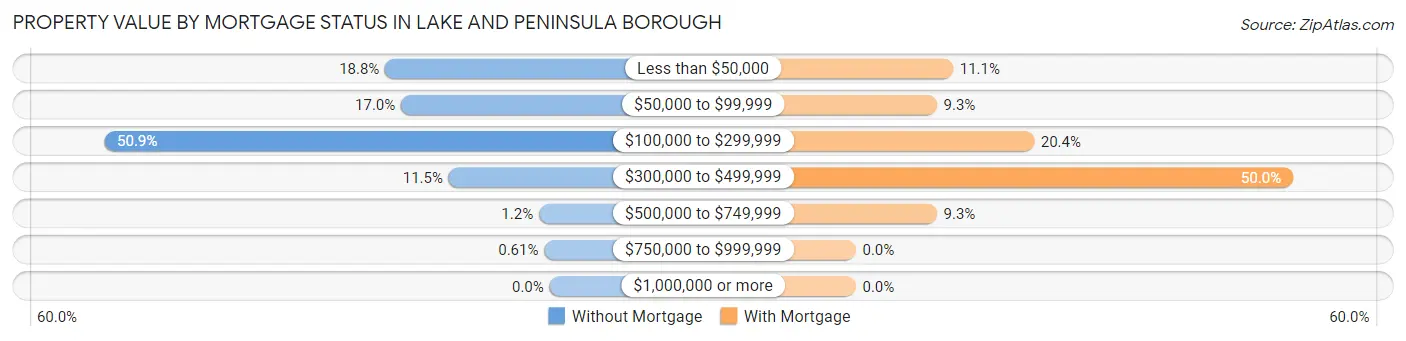
| Property Value | Without Mortgage | With Mortgage |
| Less than $50,000 | 31 (18.8%) | 6 (11.1%) |
| $50,000 to $99,999 | 28 (17.0%) | 5 (9.3%) |
| $100,000 to $299,999 | 84 (50.9%) | 11 (20.4%) |
| $300,000 to $499,999 | 19 (11.5%) | 27 (50.0%) |
| $500,000 to $749,999 | 2 (1.2%) | 5 (9.3%) |
| $750,000 to $999,999 | 1 (0.6%) | 0 (0.0%) |
| $1,000,000 or more | 0 (0.0%) | 0 (0.0%) |
| Total | 165 (100.0%) | 54 (100.0%) |
Household Income by Mortgage Status in Lake and Peninsula Borough
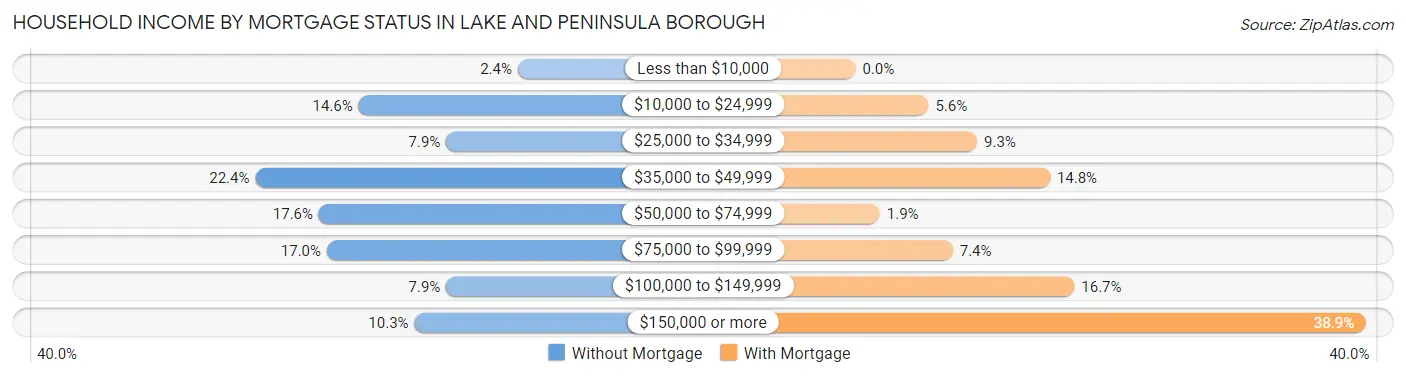
| Household Income | Without Mortgage | With Mortgage |
| Less than $10,000 | 4 (2.4%) | 0 (0.0%) |
| $10,000 to $24,999 | 24 (14.5%) | 3 (5.6%) |
| $25,000 to $34,999 | 13 (7.9%) | 5 (9.3%) |
| $35,000 to $49,999 | 37 (22.4%) | 8 (14.8%) |
| $50,000 to $74,999 | 29 (17.6%) | 1 (1.8%) |
| $75,000 to $99,999 | 28 (17.0%) | 4 (7.4%) |
| $100,000 to $149,999 | 13 (7.9%) | 9 (16.7%) |
| $150,000 or more | 17 (10.3%) | 21 (38.9%) |
| Total | 165 (100.0%) | 54 (100.0%) |
Property Value to Household Income Ratio in Lake and Peninsula Borough
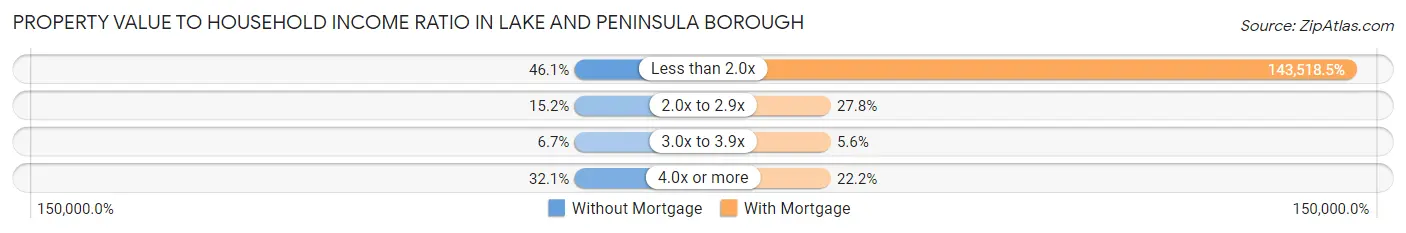
| Value-to-Income Ratio | Without Mortgage | With Mortgage |
| Less than 2.0x | 76 (46.1%) | 77,500 (143,518.5%) |
| 2.0x to 2.9x | 25 (15.1%) | 15 (27.8%) |
| 3.0x to 3.9x | 11 (6.7%) | 3 (5.6%) |
| 4.0x or more | 53 (32.1%) | 12 (22.2%) |
| Total | 165 (100.0%) | 54 (100.0%) |
Real Estate Taxes by Mortgage Status in Lake and Peninsula Borough
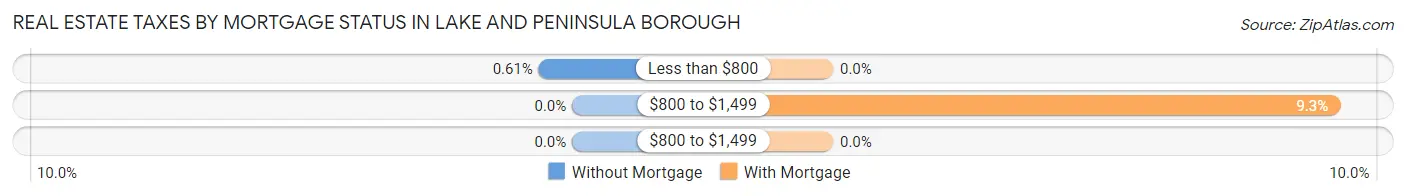
| Property Taxes | Without Mortgage | With Mortgage |
| Less than $800 | 1 (0.6%) | 0 (0.0%) |
| $800 to $1,499 | 0 (0.0%) | 5 (9.3%) |
| $800 to $1,499 | 0 (0.0%) | 0 (0.0%) |
| Total | 165 (100.0%) | 54 (100.0%) |
Health & Disability in Lake and Peninsula Borough
Health Insurance Coverage by Age in Lake and Peninsula Borough
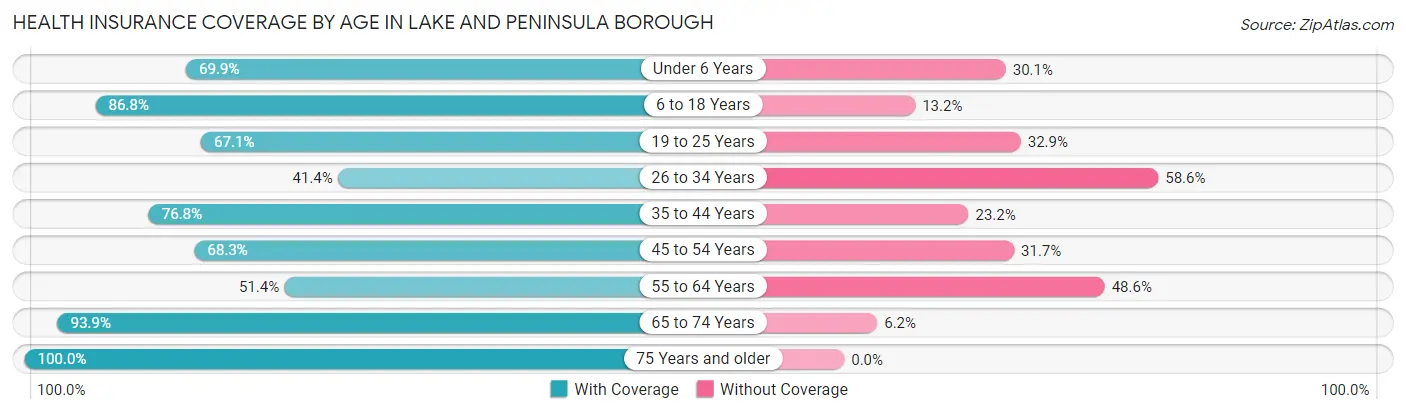
| Age Bracket | With Coverage | Without Coverage |
| Under 6 Years | 65 (69.9%) | 28 (30.1%) |
| 6 to 18 Years | 164 (86.8%) | 25 (13.2%) |
| 19 to 25 Years | 53 (67.1%) | 26 (32.9%) |
| 26 to 34 Years | 75 (41.4%) | 106 (58.6%) |
| 35 to 44 Years | 126 (76.8%) | 38 (23.2%) |
| 45 to 54 Years | 41 (68.3%) | 19 (31.7%) |
| 55 to 64 Years | 72 (51.4%) | 68 (48.6%) |
| 65 to 74 Years | 61 (93.9%) | 4 (6.1%) |
| 75 Years and older | 27 (100.0%) | 0 (0.0%) |
| Total | 684 (68.5%) | 314 (31.5%) |
Health Insurance Coverage by Citizenship Status in Lake and Peninsula Borough
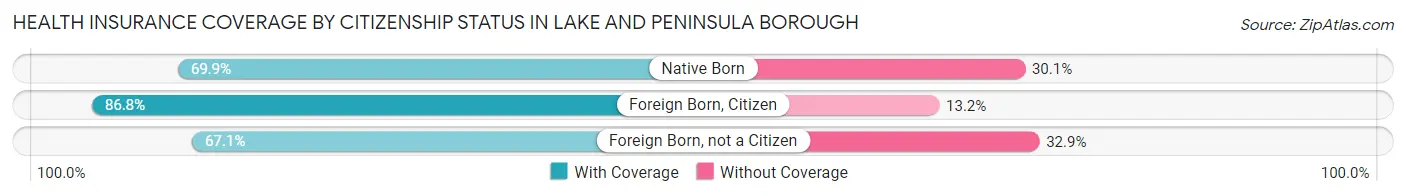
| Citizenship Status | With Coverage | Without Coverage |
| Native Born | 65 (69.9%) | 28 (30.1%) |
| Foreign Born, Citizen | 164 (86.8%) | 25 (13.2%) |
| Foreign Born, not a Citizen | 53 (67.1%) | 26 (32.9%) |
Health Insurance Coverage by Household Income in Lake and Peninsula Borough
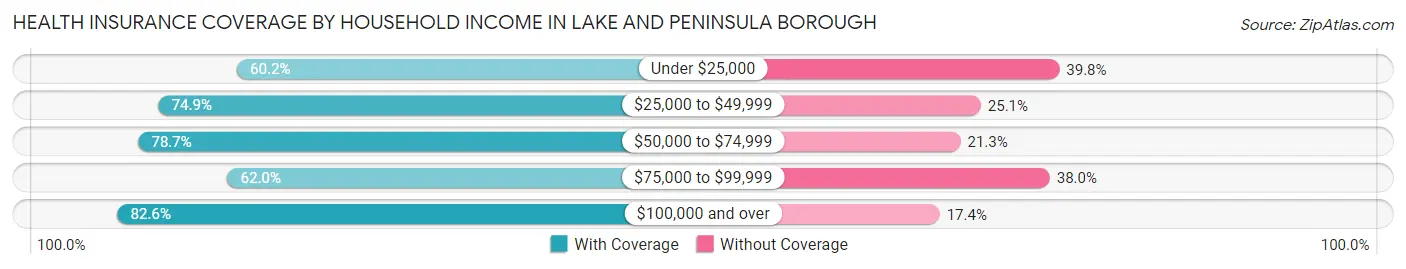
| Household Income | With Coverage | Without Coverage |
| Under $25,000 | 71 (60.2%) | 47 (39.8%) |
| $25,000 to $49,999 | 158 (74.9%) | 53 (25.1%) |
| $50,000 to $74,999 | 96 (78.7%) | 26 (21.3%) |
| $75,000 to $99,999 | 101 (62.0%) | 62 (38.0%) |
| $100,000 and over | 204 (82.6%) | 43 (17.4%) |
Public vs Private Health Insurance Coverage by Age in Lake and Peninsula Borough
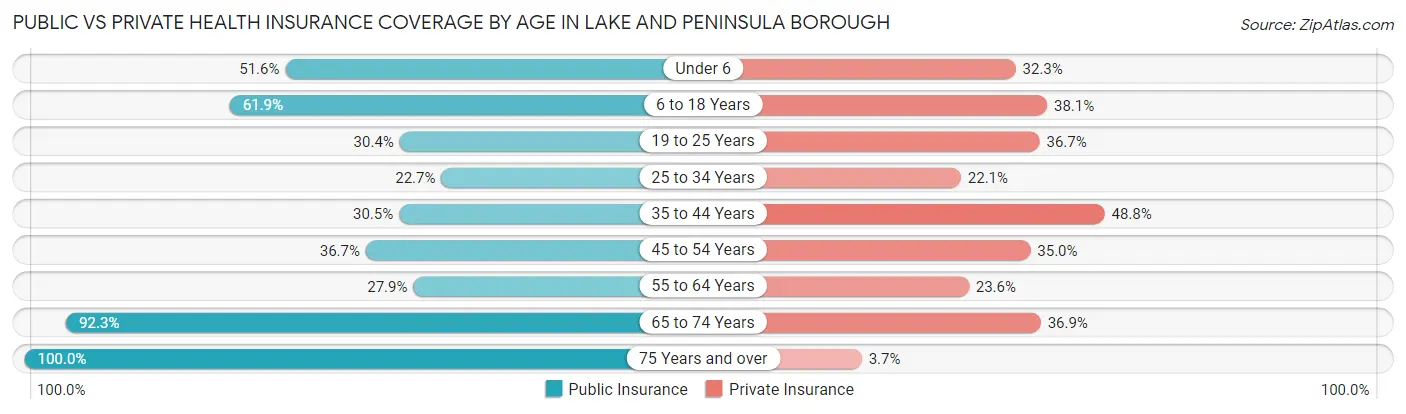
| Age Bracket | Public Insurance | Private Insurance |
| Under 6 | 48 (51.6%) | 30 (32.3%) |
| 6 to 18 Years | 117 (61.9%) | 72 (38.1%) |
| 19 to 25 Years | 24 (30.4%) | 29 (36.7%) |
| 25 to 34 Years | 41 (22.7%) | 40 (22.1%) |
| 35 to 44 Years | 50 (30.5%) | 80 (48.8%) |
| 45 to 54 Years | 22 (36.7%) | 21 (35.0%) |
| 55 to 64 Years | 39 (27.9%) | 33 (23.6%) |
| 65 to 74 Years | 60 (92.3%) | 24 (36.9%) |
| 75 Years and over | 27 (100.0%) | 1 (3.7%) |
| Total | 428 (42.9%) | 330 (33.1%) |
Disability Status by Sex by Age in Lake and Peninsula Borough
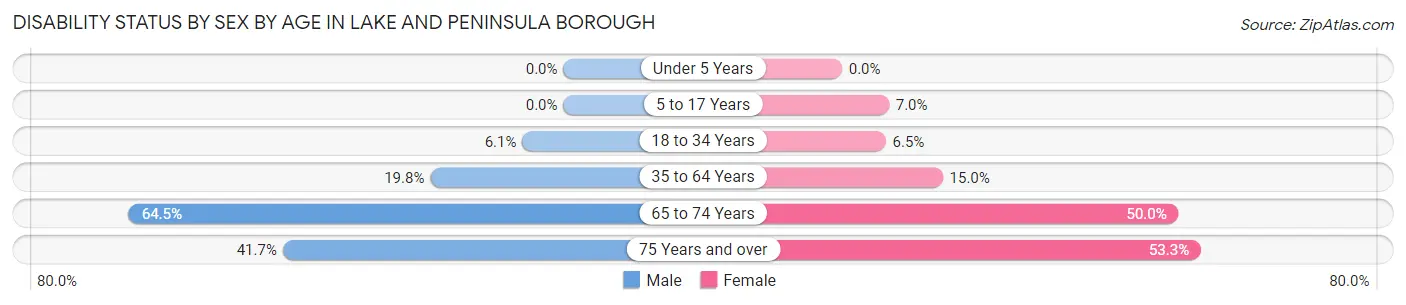
| Age Bracket | Male | Female |
| Under 5 Years | 0 (0.0%) | 0 (0.0%) |
| 5 to 17 Years | 0 (0.0%) | 6 (7.0%) |
| 18 to 34 Years | 10 (6.1%) | 8 (6.5%) |
| 35 to 64 Years | 35 (19.8%) | 28 (15.0%) |
| 65 to 74 Years | 20 (64.5%) | 17 (50.0%) |
| 75 Years and over | 5 (41.7%) | 8 (53.3%) |
Disability Class by Sex by Age in Lake and Peninsula Borough
Disability Class: Hearing Difficulty
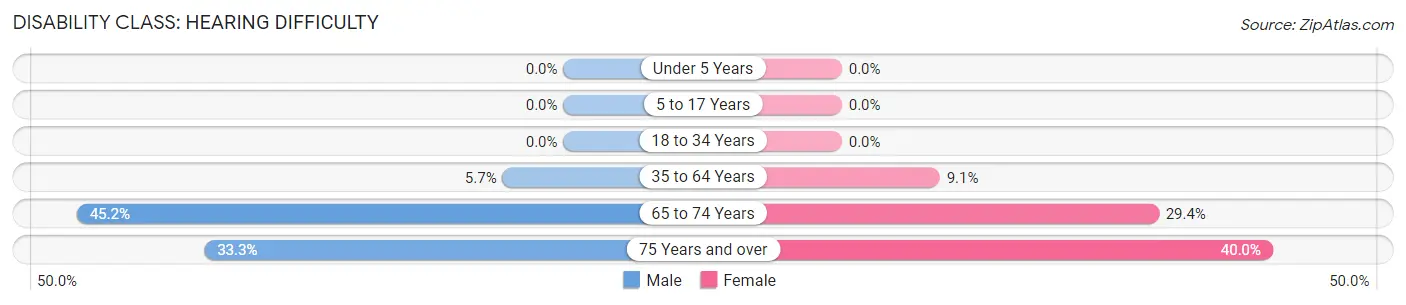
| Age Bracket | Male | Female |
| Under 5 Years | 0 (0.0%) | 0 (0.0%) |
| 5 to 17 Years | 0 (0.0%) | 0 (0.0%) |
| 18 to 34 Years | 0 (0.0%) | 0 (0.0%) |
| 35 to 64 Years | 10 (5.7%) | 17 (9.1%) |
| 65 to 74 Years | 14 (45.2%) | 10 (29.4%) |
| 75 Years and over | 4 (33.3%) | 6 (40.0%) |
Disability Class: Vision Difficulty
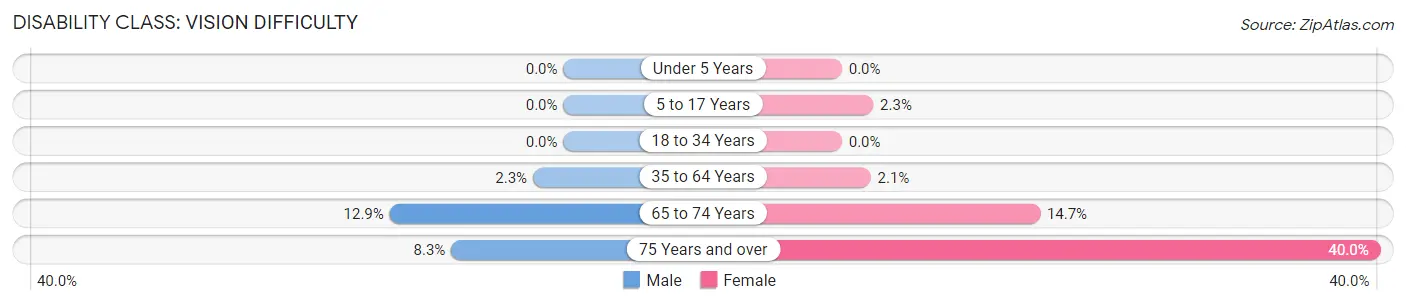
| Age Bracket | Male | Female |
| Under 5 Years | 0 (0.0%) | 0 (0.0%) |
| 5 to 17 Years | 0 (0.0%) | 2 (2.3%) |
| 18 to 34 Years | 0 (0.0%) | 0 (0.0%) |
| 35 to 64 Years | 4 (2.3%) | 4 (2.1%) |
| 65 to 74 Years | 4 (12.9%) | 5 (14.7%) |
| 75 Years and over | 1 (8.3%) | 6 (40.0%) |
Disability Class: Cognitive Difficulty
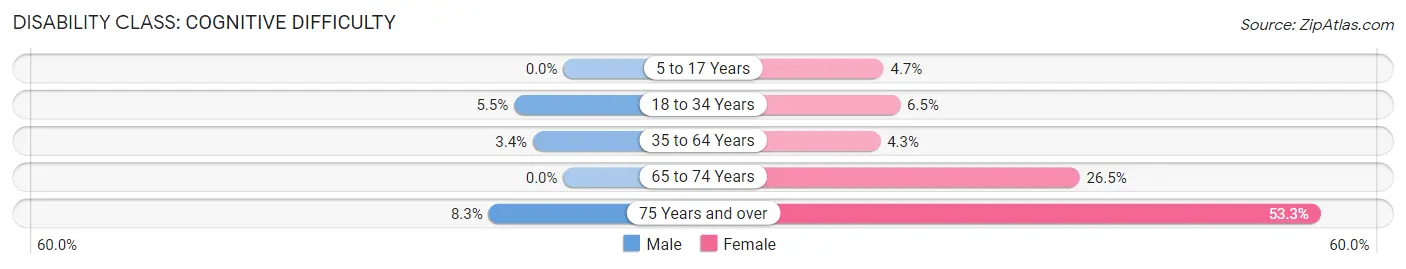
| Age Bracket | Male | Female |
| 5 to 17 Years | 0 (0.0%) | 4 (4.6%) |
| 18 to 34 Years | 9 (5.5%) | 8 (6.5%) |
| 35 to 64 Years | 6 (3.4%) | 8 (4.3%) |
| 65 to 74 Years | 0 (0.0%) | 9 (26.5%) |
| 75 Years and over | 1 (8.3%) | 8 (53.3%) |
Disability Class: Ambulatory Difficulty
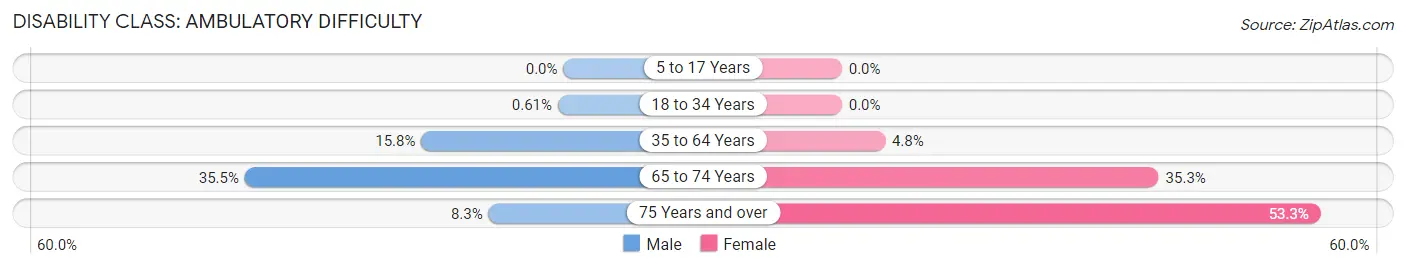
| Age Bracket | Male | Female |
| 5 to 17 Years | 0 (0.0%) | 0 (0.0%) |
| 18 to 34 Years | 1 (0.6%) | 0 (0.0%) |
| 35 to 64 Years | 28 (15.8%) | 9 (4.8%) |
| 65 to 74 Years | 11 (35.5%) | 12 (35.3%) |
| 75 Years and over | 1 (8.3%) | 8 (53.3%) |
Disability Class: Self-Care Difficulty
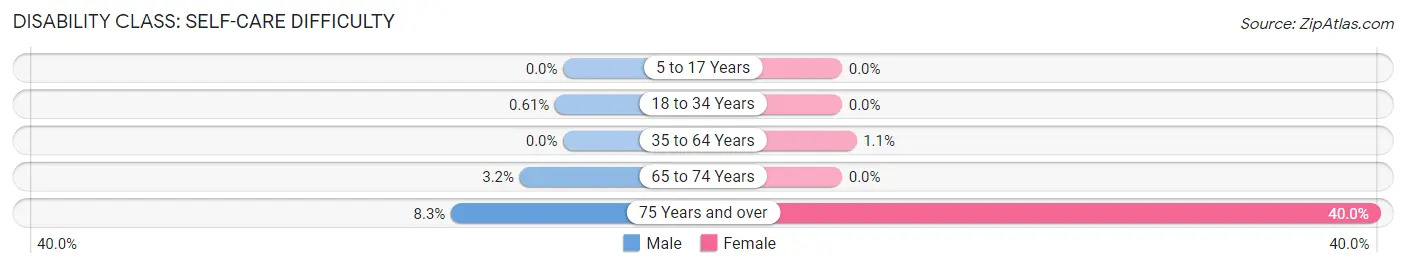
| Age Bracket | Male | Female |
| 5 to 17 Years | 0 (0.0%) | 0 (0.0%) |
| 18 to 34 Years | 1 (0.6%) | 0 (0.0%) |
| 35 to 64 Years | 0 (0.0%) | 2 (1.1%) |
| 65 to 74 Years | 1 (3.2%) | 0 (0.0%) |
| 75 Years and over | 1 (8.3%) | 6 (40.0%) |
Technology Access in Lake and Peninsula Borough
Computing Device Access in Lake and Peninsula Borough
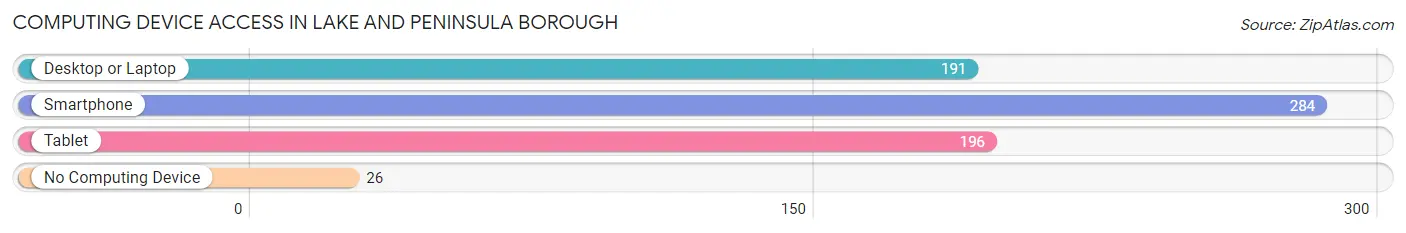
| Device Type | # Households | % Households |
| Desktop or Laptop | 191 | 58.6% |
| Smartphone | 284 | 87.1% |
| Tablet | 196 | 60.1% |
| No Computing Device | 26 | 8.0% |
| Total | 326 | 100.0% |
Internet Access in Lake and Peninsula Borough
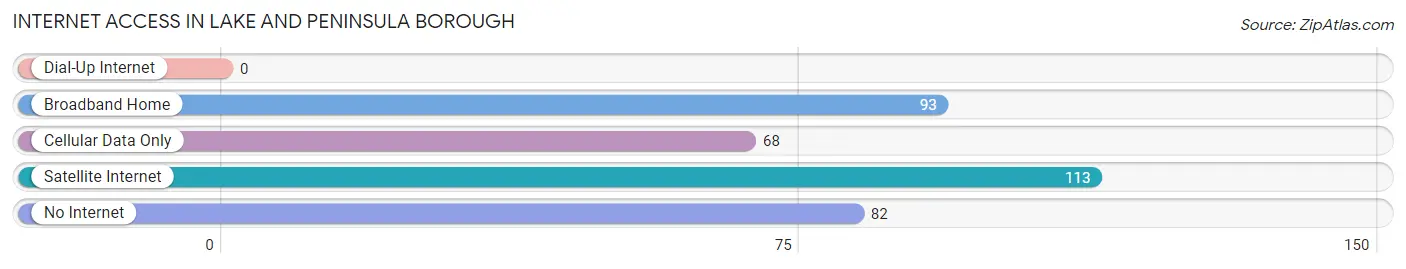
| Internet Type | # Households | % Households |
| Dial-Up Internet | 0 | 0.0% |
| Broadband Home | 93 | 28.5% |
| Cellular Data Only | 68 | 20.9% |
| Satellite Internet | 113 | 34.7% |
| No Internet | 82 | 25.2% |
| Total | 326 | 100.0% |
Lake and Peninsula Borough Summary
Lake and Peninsula Borough is a borough located in the state of Alaska. It is the second largest borough in the state, covering an area of over 20,000 square miles. The borough is located in the southwestern part of the state, and is bordered by the Gulf of Alaska to the south, the Bering Sea to the west, and the Alaska Peninsula to the east. The borough is home to a variety of wildlife, including brown bears, moose, caribou, and bald eagles.
History
The Lake and Peninsula Borough was established in 1988, when the Alaska Legislature passed the Alaska Borough Act. The act allowed for the formation of boroughs in the state, and the Lake and Peninsula Borough was one of the first to be formed. The borough was formed from the former Lake and Peninsula County, which had been established in 1975.
The area that is now the Lake and Peninsula Borough has a long history of human habitation. The area was first inhabited by the Yup'ik people, who have lived in the area for thousands of years. The Yup'ik people were semi-nomadic, and relied on fishing and hunting for their subsistence.
The area was first explored by Europeans in the late 1700s, when Russian explorers arrived in the area. The Russians established trading posts in the area, and the fur trade became an important part of the local economy. The area was later explored by American explorers, and in 1867, the United States purchased Alaska from Russia.
The area was largely undeveloped until the 1950s, when the construction of the Alaska Highway and the Trans-Alaska Pipeline brought an influx of people and development to the area. The borough was officially established in 1988, and has since become an important part of the state's economy.
Geography
The Lake and Peninsula Borough is located in the southwestern part of the state of Alaska. It is bordered by the Gulf of Alaska to the south, the Bering Sea to the west, and the Alaska Peninsula to the east. The borough covers an area of over 20,000 square miles, making it the second largest borough in the state.
The borough is largely mountainous, with the Alaska Range running through the center of the borough. The highest point in the borough is Mount Iliamna, which stands at 10,016 feet. The borough is also home to numerous rivers and lakes, including Lake Clark, Lake Iliamna, and the Kvichak River.
The climate of the borough is generally cold and wet, with temperatures ranging from -20°F in the winter to 70°F in the summer. The area receives an average of over 50 inches of precipitation per year, making it one of the wettest areas in the state.
Economy
The economy of the Lake and Peninsula Borough is largely based on natural resources. Fishing and hunting are important industries in the area, and the borough is home to a variety of wildlife, including brown bears, moose, caribou, and bald eagles.
The borough is also home to several oil and gas fields, and the Trans-Alaska Pipeline runs through the area. Tourism is also an important part of the local economy, and the borough is home to several national parks and monuments, including Katmai National Park and Preserve and Aniakchak National Monument and Preserve.
Demographics
As of the 2010 census, the population of the Lake and Peninsula Borough was 6,976. The population is largely Native American, with the majority of the population being of Yup'ik descent. The borough also has a small population of non-Native Americans, including Europeans and Asians.
The median household income in the borough is $50,000, and the median home value is $150,000. The unemployment rate in the borough is 8.2%, which is slightly higher than the national average. The poverty rate in the borough is also higher than the national average, at 17.3%.
Common Questions
What is the Total Population of Lake and Peninsula Borough?
Total Population of Lake and Peninsula Borough is 999.
What is the Total Male Population of Lake and Peninsula Borough?
Total Male Population of Lake and Peninsula Borough is 508.
What is the Total Female Population of Lake and Peninsula Borough?
Total Female Population of Lake and Peninsula Borough is 491.
What is the Ratio of Males per 100 Females in Lake and Peninsula Borough?
There are 103.46 Males per 100 Females in Lake and Peninsula Borough.
What is the Ratio of Females per 100 Males in Lake and Peninsula Borough?
There are 96.65 Females per 100 Males in Lake and Peninsula Borough.
What is the Median Population Age in Lake and Peninsula Borough?
Median Population Age in Lake and Peninsula Borough is 33.6 Years.
What is the Average Family Size in Lake and Peninsula Borough
Average Family Size in Lake and Peninsula Borough is 3.0 People.
What is the Average Household Size in Lake and Peninsula Borough
Average Household Size in Lake and Peninsula Borough is 2.6 People.
What is Per Capita Income in Lake and Peninsula Borough?
Per Capita income in Lake and Peninsula Borough is $39,409.
What is the Median Family Income in Lake and Peninsula Borough?
Median Family Income in Lake and Peninsula Borough is $64,875.
What is the Median Household income in Lake and Peninsula Borough?
Median Household Income in Lake and Peninsula Borough is $61,607.
What is Income or Wage Gap in Lake and Peninsula Borough?
Income or Wage Gap in Lake and Peninsula Borough is 56.4%.
Women in Lake and Peninsula Borough earn 43.6 cents for every dollar earned by a man.
What is Inequality or Gini Index in Lake and Peninsula Borough?
Inequality or Gini Index in Lake and Peninsula Borough is 0.39.
How Large is the Labor Force in Lake and Peninsula Borough?
There are 567 People in the Labor Forcein in Lake and Peninsula Borough.
What is the Percentage of People in the Labor Force in Lake and Peninsula Borough?
74.3% of People are in the Labor Force in Lake and Peninsula Borough.
What is the Unemployment Rate in Lake and Peninsula Borough?
Unemployment Rate in Lake and Peninsula Borough is 14.0%.