Kusilvak Census Area, AK
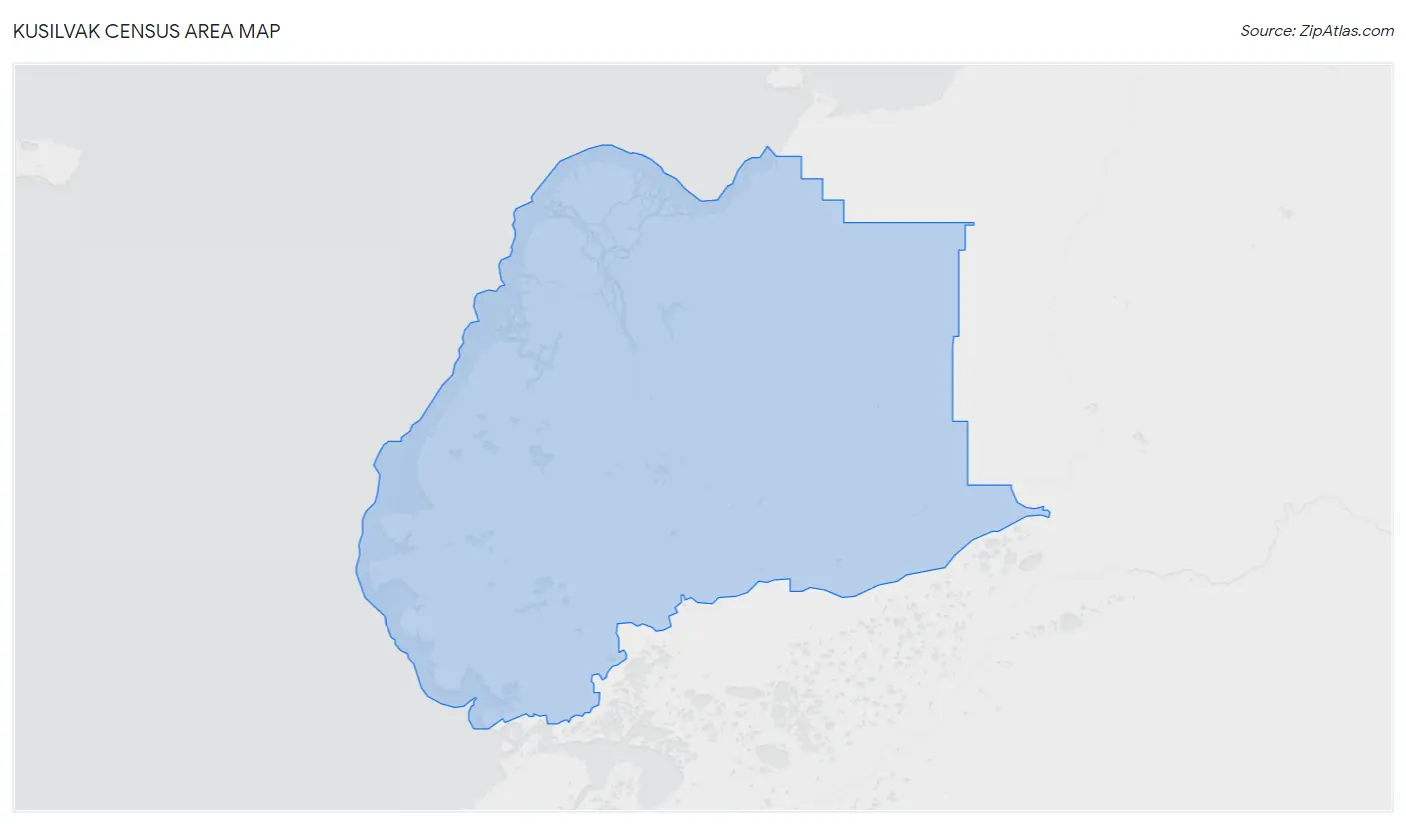
Kusilvak Census Area Map
Kusilvak Census Area Overview
8,372
TOTAL POPULATION
4,576
MALE POPULATION
3,796
FEMALE POPULATION
120.55
MALES / 100 FEMALES
82.95
FEMALES / 100 MALES
23.7
MEDIAN AGE
4.6
AVG FAMILY SIZE
4.3
AVG HOUSEHOLD SIZE
$17,166
PER CAPITA INCOME
$43,882
AVG FAMILY INCOME
$42,663
AVG HOUSEHOLD INCOME
7.3%
WAGE / INCOME GAP [ % ]
92.7¢/ $1
WAGE / INCOME GAP [ $ ]
$14,029
FAMILY INCOME DEFICIT
0.45
INEQUALITY / GINI INDEX
3,112
LABOR FORCE [ PEOPLE ]
59.8%
PERCENT IN LABOR FORCE
20.9%
UNEMPLOYMENT RATE
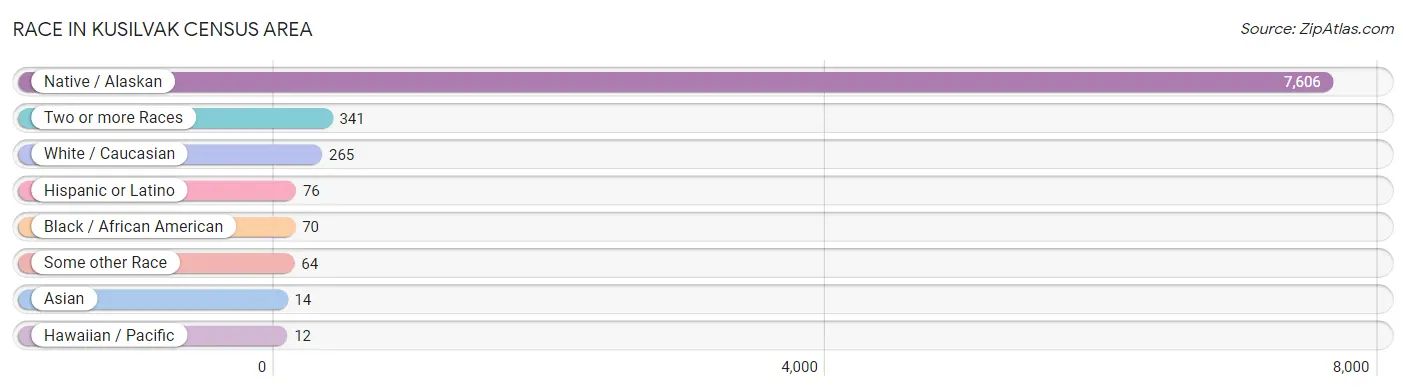
Race in Kusilvak Census Area
The most populous races in Kusilvak Census Area are Native / Alaskan (7,606 | 90.8%), Two or more Races (341 | 4.1%), and White / Caucasian (265 | 3.2%).
| Race | # Population | % Population |
| Asian | 14 | 0.2% |
| Black / African American | 70 | 0.8% |
| Hawaiian / Pacific | 12 | 0.1% |
| Hispanic or Latino | 76 | 0.9% |
| Native / Alaskan | 7,606 | 90.8% |
| White / Caucasian | 265 | 3.2% |
| Two or more Races | 341 | 4.1% |
| Some other Race | 64 | 0.8% |
| Total | 8,372 | 100.0% |
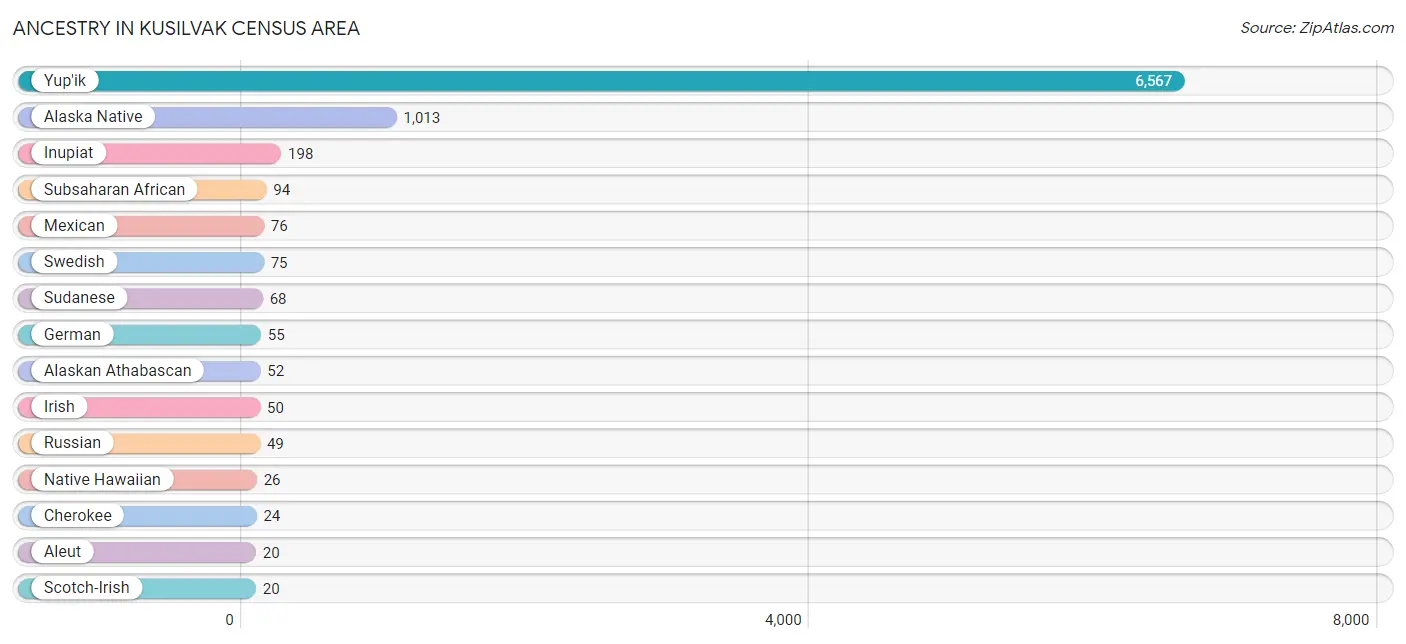
Ancestry in Kusilvak Census Area
The most populous ancestries reported in Kusilvak Census Area are Yup'ik (6,567 | 78.4%), Alaska Native (1,013 | 12.1%), Inupiat (198 | 2.4%), Subsaharan African (94 | 1.1%), and Mexican (76 | 0.9%), together accounting for 94.9% of all Kusilvak Census Area residents.
| Ancestry | # Population | % Population |
| African | 12 | 0.1% |
| Alaska Native | 1,013 | 12.1% |
| Alaskan Athabascan | 52 | 0.6% |
| Aleut | 20 | 0.2% |
| American | 3 | 0.0% |
| Blackfeet | 18 | 0.2% |
| British | 3 | 0.0% |
| Cherokee | 24 | 0.3% |
| Creek | 19 | 0.2% |
| Dutch | 12 | 0.1% |
| English | 6 | 0.1% |
| European | 3 | 0.0% |
| Fijian | 2 | 0.0% |
| German | 55 | 0.7% |
| Inupiat | 198 | 2.4% |
| Irish | 50 | 0.6% |
| Italian | 15 | 0.2% |
| Korean | 18 | 0.2% |
| Lithuanian | 2 | 0.0% |
| Mexican | 76 | 0.9% |
| Native Hawaiian | 26 | 0.3% |
| Navajo | 4 | 0.1% |
| Nigerian | 3 | 0.0% |
| Norwegian | 2 | 0.0% |
| Russian | 49 | 0.6% |
| Samoan | 5 | 0.1% |
| Scotch-Irish | 20 | 0.2% |
| Subsaharan African | 94 | 1.1% |
| Sudanese | 68 | 0.8% |
| Swedish | 75 | 0.9% |
| Yup'ik | 6,567 | 78.4% | View All 31 Rows |
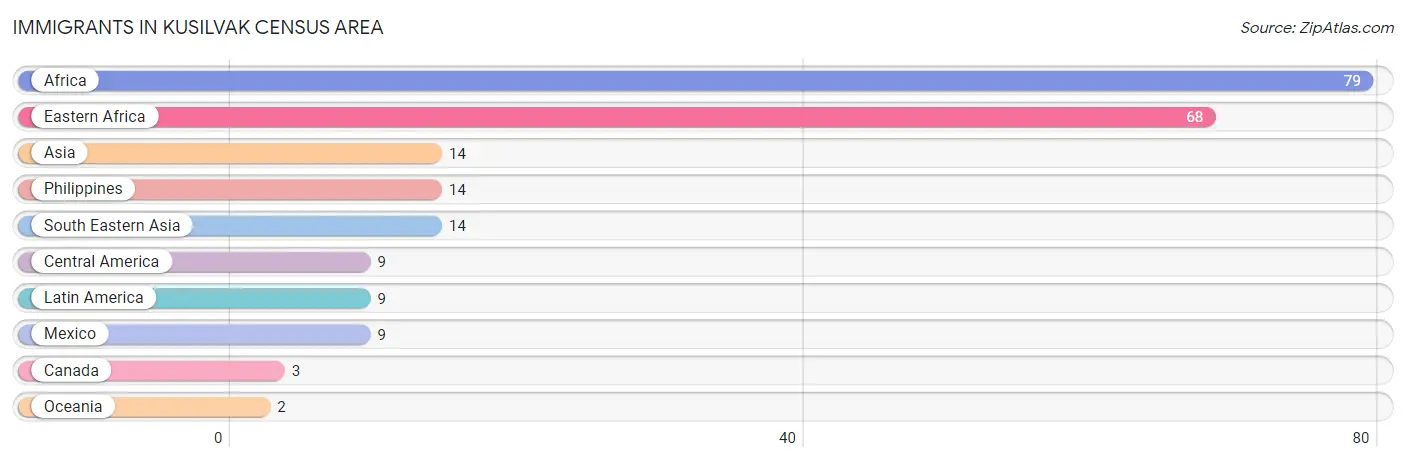
Immigrants in Kusilvak Census Area
The most numerous immigrant groups reported in Kusilvak Census Area came from Africa (79 | 0.9%), Eastern Africa (68 | 0.8%), Asia (14 | 0.2%), Philippines (14 | 0.2%), and South Eastern Asia (14 | 0.2%), together accounting for 2.3% of all Kusilvak Census Area residents.
| Immigration Origin | # Population | % Population |
| Africa | 79 | 0.9% |
| Asia | 14 | 0.2% |
| Canada | 3 | 0.0% |
| Central America | 9 | 0.1% |
| Eastern Africa | 68 | 0.8% |
| Latin America | 9 | 0.1% |
| Mexico | 9 | 0.1% |
| Oceania | 2 | 0.0% |
| Philippines | 14 | 0.2% |
| South Eastern Asia | 14 | 0.2% | View All 10 Rows |
Sex and Age in Kusilvak Census Area
Sex and Age in Kusilvak Census Area
The most populous age groups in Kusilvak Census Area are Under 5 Years (576 | 12.6%) for men and Under 5 Years (510 | 13.4%) for women.
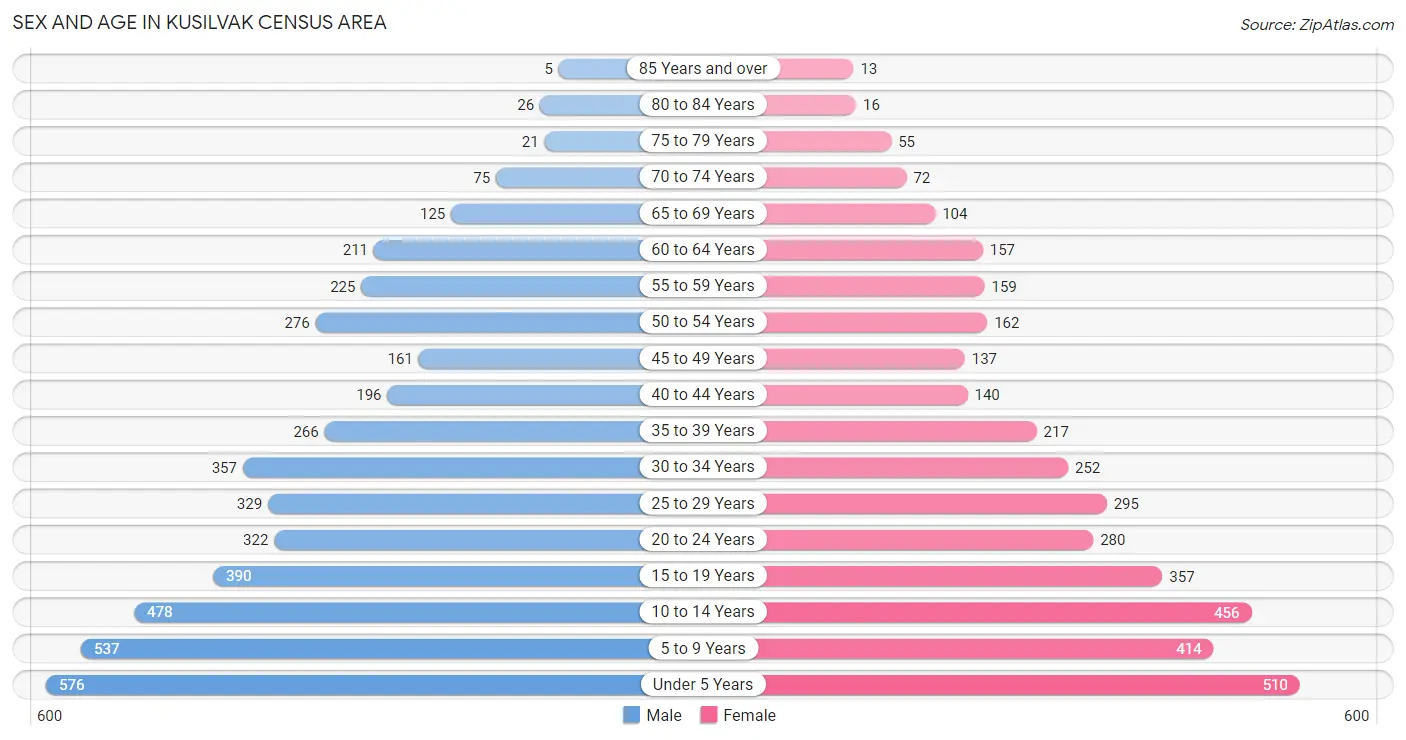
| Age Bracket | Male | Female |
| Under 5 Years | 576 (12.6%) | 510 (13.4%) |
| 5 to 9 Years | 537 (11.7%) | 414 (10.9%) |
| 10 to 14 Years | 478 (10.4%) | 456 (12.0%) |
| 15 to 19 Years | 390 (8.5%) | 357 (9.4%) |
| 20 to 24 Years | 322 (7.0%) | 280 (7.4%) |
| 25 to 29 Years | 329 (7.2%) | 295 (7.8%) |
| 30 to 34 Years | 357 (7.8%) | 252 (6.6%) |
| 35 to 39 Years | 266 (5.8%) | 217 (5.7%) |
| 40 to 44 Years | 196 (4.3%) | 140 (3.7%) |
| 45 to 49 Years | 161 (3.5%) | 137 (3.6%) |
| 50 to 54 Years | 276 (6.0%) | 162 (4.3%) |
| 55 to 59 Years | 225 (4.9%) | 159 (4.2%) |
| 60 to 64 Years | 211 (4.6%) | 157 (4.1%) |
| 65 to 69 Years | 125 (2.7%) | 104 (2.7%) |
| 70 to 74 Years | 75 (1.6%) | 72 (1.9%) |
| 75 to 79 Years | 21 (0.5%) | 55 (1.5%) |
| 80 to 84 Years | 26 (0.6%) | 16 (0.4%) |
| 85 Years and over | 5 (0.1%) | 13 (0.3%) |
| Total | 4,576 (100.0%) | 3,796 (100.0%) |
Families and Households in Kusilvak Census Area
Median Family Size in Kusilvak Census Area
The median family size in Kusilvak Census Area is 4.60 persons per family, with married-couple families (723 | 46.5%) accounting for the largest median family size of 5.65 persons per family. On the other hand, single male/father families (317 | 20.4%) represent the smallest median family size with 3.29 persons per family.
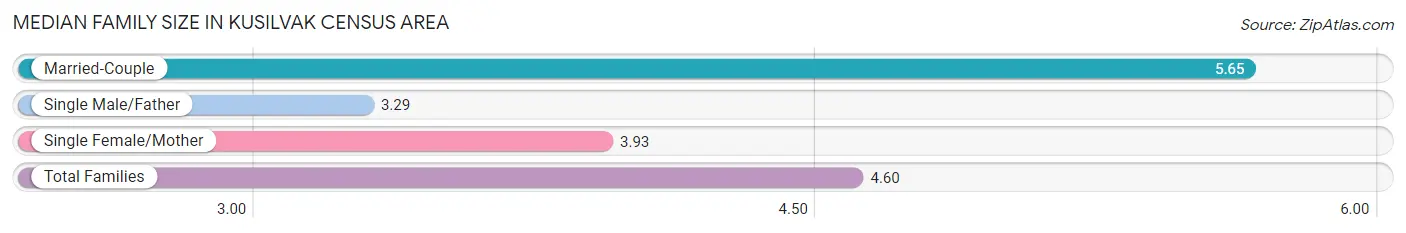
| Family Type | # Families | Family Size |
| Married-Couple | 723 (46.5%) | 5.65 |
| Single Male/Father | 317 (20.4%) | 3.29 |
| Single Female/Mother | 514 (33.1%) | 3.93 |
| Total Families | 1,554 (100.0%) | 4.60 |
Median Household Size in Kusilvak Census Area
The median household size in Kusilvak Census Area is 4.31 persons per household, with married-couple households (723 | 38.8%) accounting for the largest median household size of 5.78 persons per household. non-family households (310 | 16.6%) represent the smallest median household size with 1.34 persons per household.
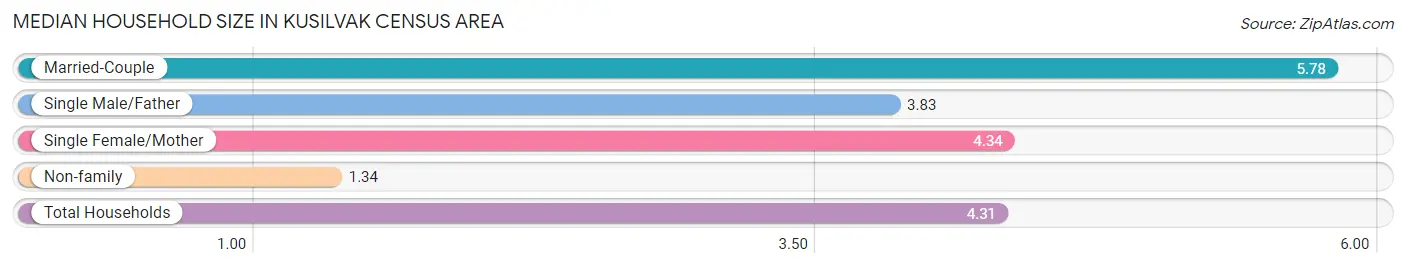
| Household Type | # Households | Household Size |
| Married-Couple | 723 (38.8%) | 5.78 |
| Single Male/Father | 317 (17.0%) | 3.83 |
| Single Female/Mother | 514 (27.6%) | 4.34 |
| Non-family | 310 (16.6%) | 1.34 |
| Total Households | 1,864 (100.0%) | 4.31 |
Household Size by Marriage Status in Kusilvak Census Area
Out of a total of 1,864 households in Kusilvak Census Area, 1,554 (83.4%) are family households, while 310 (16.6%) are nonfamily households. The most numerous type of family households are 3-person households, comprising 341, and the most common type of nonfamily households are 1-person households, comprising 226.
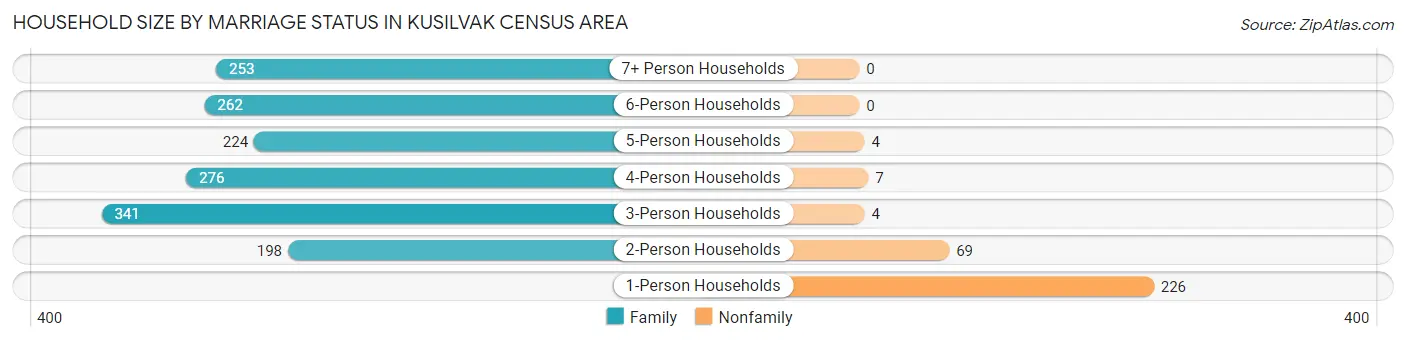
| Household Size | Family Households | Nonfamily Households |
| 1-Person Households | - | 226 (12.1%) |
| 2-Person Households | 198 (10.6%) | 69 (3.7%) |
| 3-Person Households | 341 (18.3%) | 4 (0.2%) |
| 4-Person Households | 276 (14.8%) | 7 (0.4%) |
| 5-Person Households | 224 (12.0%) | 4 (0.2%) |
| 6-Person Households | 262 (14.1%) | 0 (0.0%) |
| 7+ Person Households | 253 (13.6%) | 0 (0.0%) |
| Total | 1,554 (83.4%) | 310 (16.6%) |
Female Fertility in Kusilvak Census Area
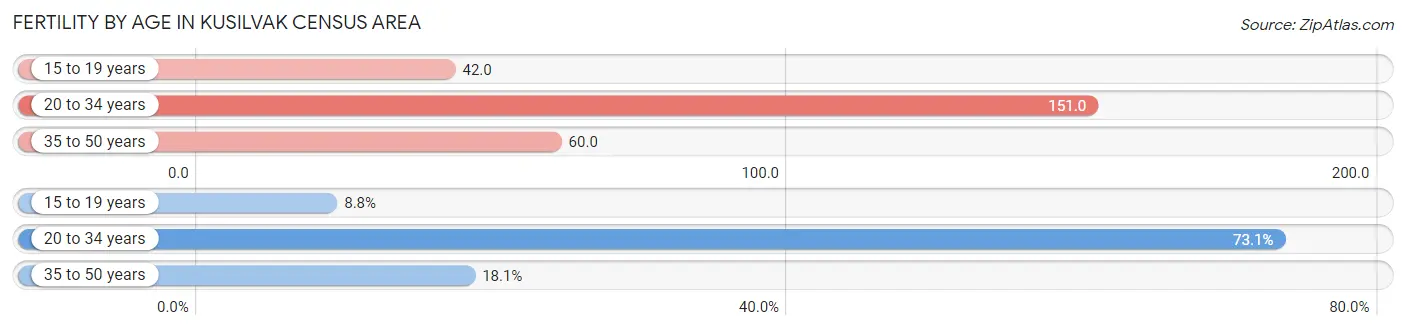
Fertility by Age in Kusilvak Census Area
Average fertility rate in Kusilvak Census Area is 101.0 births per 1,000 women. Women in the age bracket of 20 to 34 years have the highest fertility rate with 151.0 births per 1,000 women. Women in the age bracket of 20 to 34 years acount for 73.1% of all women with births.
| Age Bracket | Women with Births | Births / 1,000 Women |
| 15 to 19 years | 15 (8.8%) | 42.0 |
| 20 to 34 years | 125 (73.1%) | 151.0 |
| 35 to 50 years | 31 (18.1%) | 60.0 |
| Total | 171 (100.0%) | 101.0 |
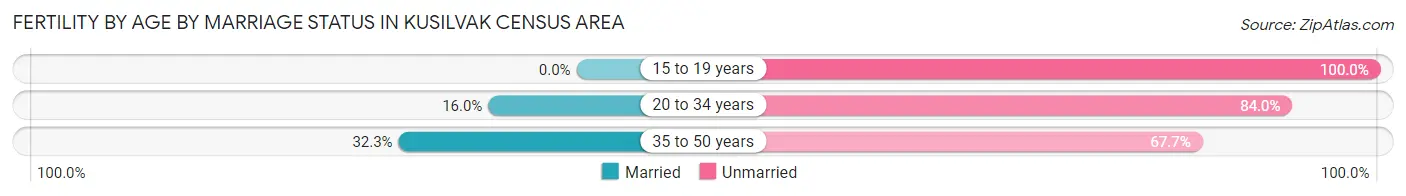
Fertility by Age by Marriage Status in Kusilvak Census Area
17.5% of women with births (171) in Kusilvak Census Area are married. The highest percentage of unmarried women with births falls into 15 to 19 years age bracket with 100.0% of them unmarried at the time of birth, while the lowest percentage of unmarried women with births belong to 35 to 50 years age bracket with 67.7% of them unmarried.
| Age Bracket | Married | Unmarried |
| 15 to 19 years | 0 (0.0%) | 15 (100.0%) |
| 20 to 34 years | 20 (16.0%) | 105 (84.0%) |
| 35 to 50 years | 10 (32.3%) | 21 (67.7%) |
| Total | 30 (17.5%) | 141 (82.5%) |
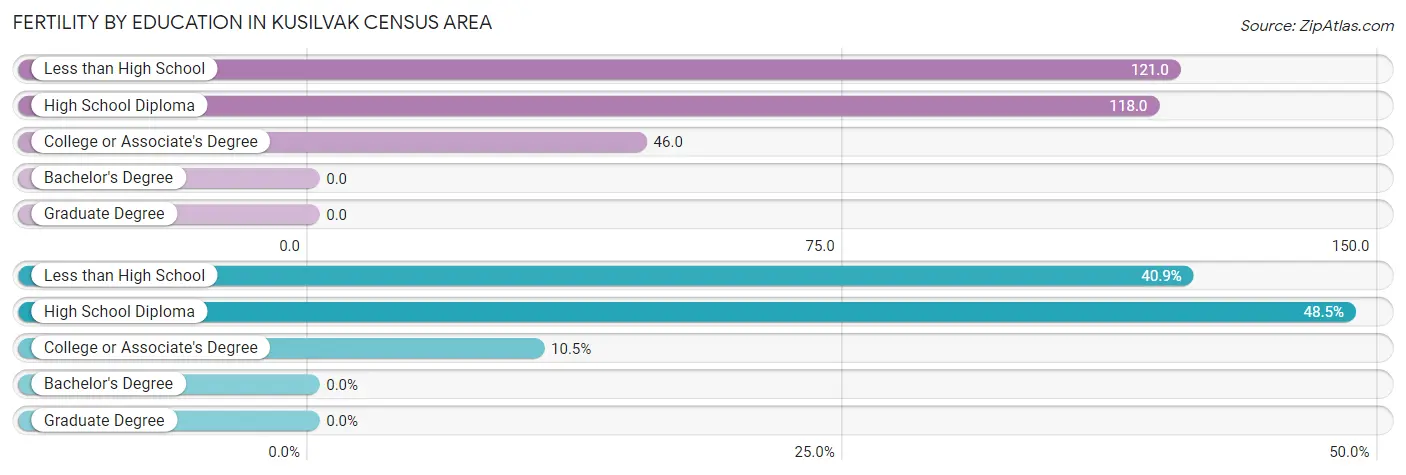
Fertility by Education in Kusilvak Census Area
| Educational Attainment | Women with Births | Births / 1,000 Women |
| Less than High School | 70 (40.9%) | 121.0 |
| High School Diploma | 83 (48.5%) | 118.0 |
| College or Associate's Degree | 18 (10.5%) | 46.0 |
| Bachelor's Degree | 0 (0.0%) | 0.0 |
| Graduate Degree | 0 (0.0%) | 0.0 |
| Total | 171 (100.0%) | 101.0 |
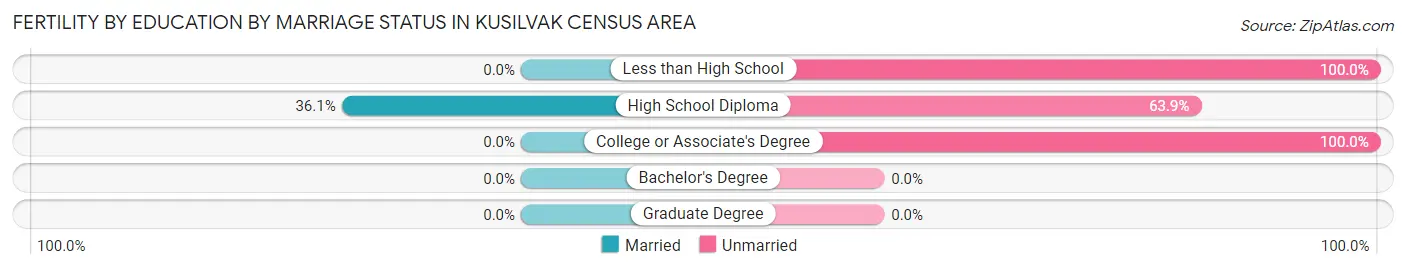
Fertility by Education by Marriage Status in Kusilvak Census Area
82.5% of women with births in Kusilvak Census Area are unmarried. Women with the educational attainment of high school diploma are most likely to be married with 36.1% of them married at childbirth, while women with the educational attainment of less than high school are least likely to be married with 100.0% of them unmarried at childbirth.
| Educational Attainment | Married | Unmarried |
| Less than High School | 0 (0.0%) | 70 (100.0%) |
| High School Diploma | 30 (36.1%) | 53 (63.9%) |
| College or Associate's Degree | 0 (0.0%) | 18 (100.0%) |
| Bachelor's Degree | 0 (0.0%) | 0 (0.0%) |
| Graduate Degree | 0 (0.0%) | 0 (0.0%) |
| Total | 30 (17.5%) | 141 (82.5%) |
Income in Kusilvak Census Area
Income Overview in Kusilvak Census Area
Per Capita Income in Kusilvak Census Area is $17,166, while median incomes of families and households are $43,882 and $42,663 respectively.
| Characteristic | Number | Measure |
| Per Capita Income | 8,372 | $17,166 |
| Median Family Income | 1,554 | $43,882 |
| Mean Family Income | 1,554 | $56,725 |
| Median Household Income | 1,864 | $42,663 |
| Mean Household Income | 1,864 | $57,035 |
| Income Deficit | 1,554 | $14,029 |
| Wage / Income Gap (%) | 8,372 | 7.28% |
| Wage / Income Gap ($) | 8,372 | 92.72¢ per $1 |
| Gini / Inequality Index | 8,372 | 0.45 |
Earnings by Sex in Kusilvak Census Area
Average Earnings in Kusilvak Census Area are $24,291, $23,660 for men and $25,517 for women, a difference of 7.3%.
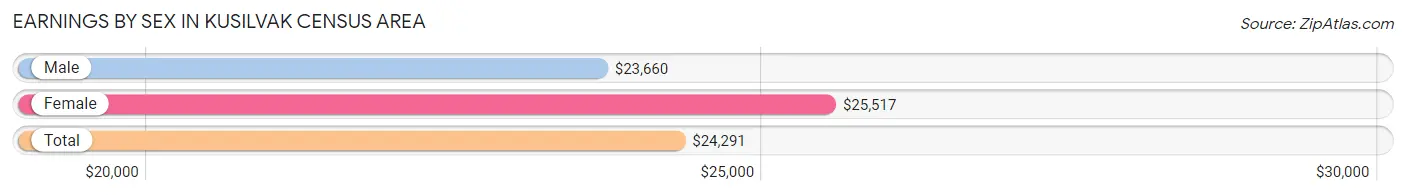
| Sex | Number | Average Earnings |
| Male | 1,918 (58.0%) | $23,660 |
| Female | 1,392 (42.0%) | $25,517 |
| Total | 3,310 (100.0%) | $24,291 |
Earnings by Sex by Income Bracket in Kusilvak Census Area
The most common earnings brackets in Kusilvak Census Area are $2,499 or less for men (226 | 11.8%) and $2,499 or less for women (172 | 12.4%).
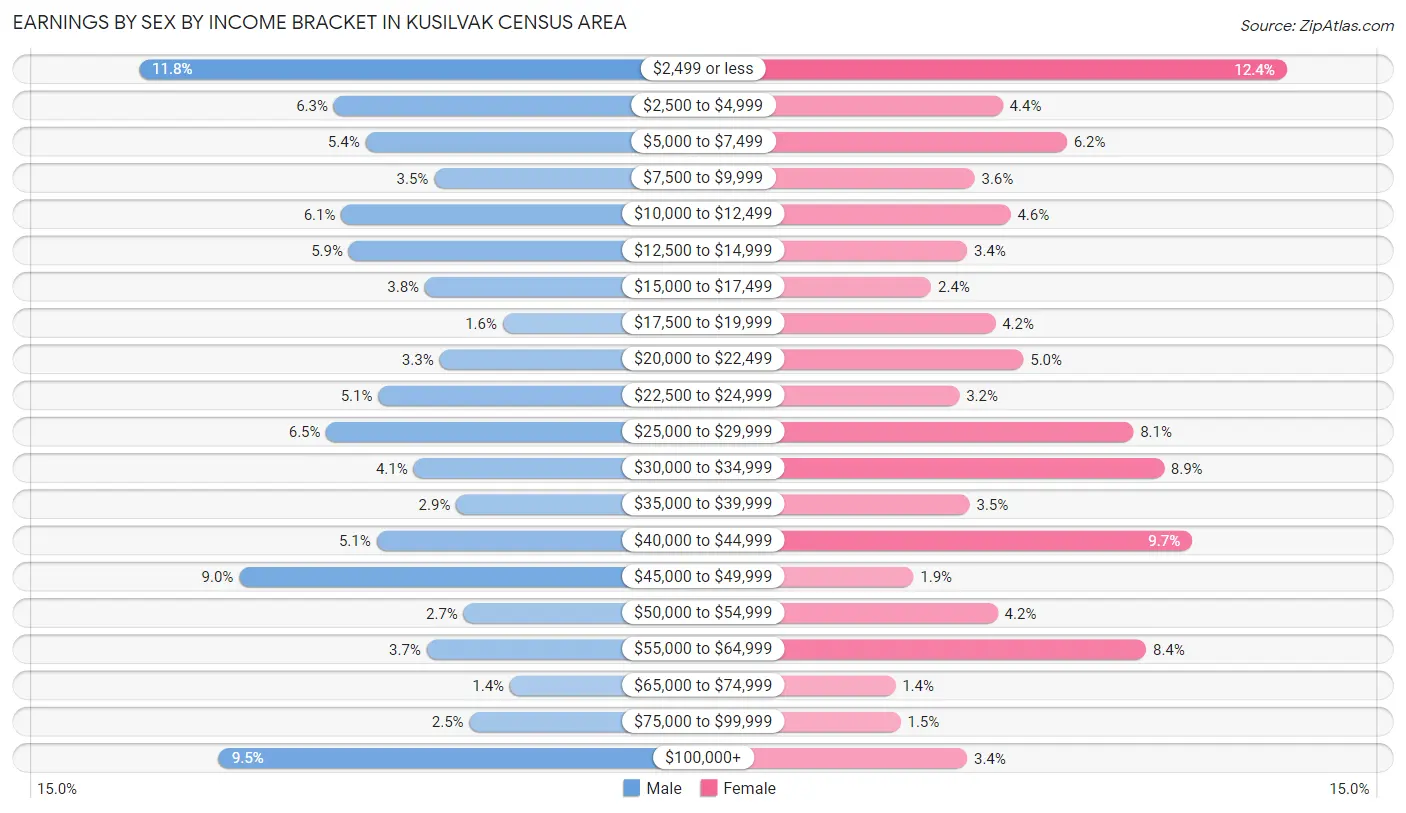
| Income | Male | Female |
| $2,499 or less | 226 (11.8%) | 172 (12.4%) |
| $2,500 to $4,999 | 121 (6.3%) | 61 (4.4%) |
| $5,000 to $7,499 | 104 (5.4%) | 86 (6.2%) |
| $7,500 to $9,999 | 67 (3.5%) | 50 (3.6%) |
| $10,000 to $12,499 | 117 (6.1%) | 64 (4.6%) |
| $12,500 to $14,999 | 113 (5.9%) | 47 (3.4%) |
| $15,000 to $17,499 | 72 (3.7%) | 33 (2.4%) |
| $17,500 to $19,999 | 30 (1.6%) | 58 (4.2%) |
| $20,000 to $22,499 | 64 (3.3%) | 69 (5.0%) |
| $22,500 to $24,999 | 97 (5.1%) | 44 (3.2%) |
| $25,000 to $29,999 | 125 (6.5%) | 112 (8.1%) |
| $30,000 to $34,999 | 78 (4.1%) | 124 (8.9%) |
| $35,000 to $39,999 | 55 (2.9%) | 48 (3.5%) |
| $40,000 to $44,999 | 98 (5.1%) | 135 (9.7%) |
| $45,000 to $49,999 | 172 (9.0%) | 26 (1.9%) |
| $50,000 to $54,999 | 51 (2.7%) | 59 (4.2%) |
| $55,000 to $64,999 | 71 (3.7%) | 117 (8.4%) |
| $65,000 to $74,999 | 26 (1.4%) | 19 (1.4%) |
| $75,000 to $99,999 | 48 (2.5%) | 21 (1.5%) |
| $100,000+ | 183 (9.5%) | 47 (3.4%) |
| Total | 1,918 (100.0%) | 1,392 (100.0%) |
Earnings by Sex by Educational Attainment in Kusilvak Census Area
Average earnings in Kusilvak Census Area are $26,713 for men and $30,456 for women, a difference of 12.3%. Men with an educational attainment of bachelor's degree enjoy the highest average annual earnings of $46,305, while those with less than high school education earn the least with $19,167. Women with an educational attainment of bachelor's degree earn the most with the average annual earnings of $40,313, while those with less than high school education have the smallest earnings of $13,214.
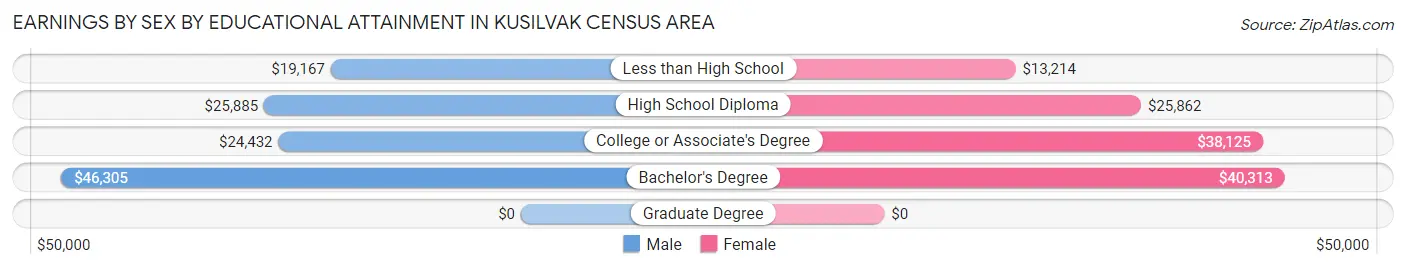
| Educational Attainment | Male Income | Female Income |
| Less than High School | $19,167 | $13,214 |
| High School Diploma | $25,885 | $25,862 |
| College or Associate's Degree | $24,432 | $38,125 |
| Bachelor's Degree | $46,305 | $40,313 |
| Graduate Degree | - | - |
| Total | $26,713 | $30,456 |
Family Income in Kusilvak Census Area
Family Income Brackets in Kusilvak Census Area
According to the Kusilvak Census Area family income data, there are 339 families falling into the $50,000 to $74,999 income range, which is the most common income bracket and makes up 21.8% of all families. Conversely, the $200,000+ income bracket is the least frequent group with only 34 families (2.2%) belonging to this category.
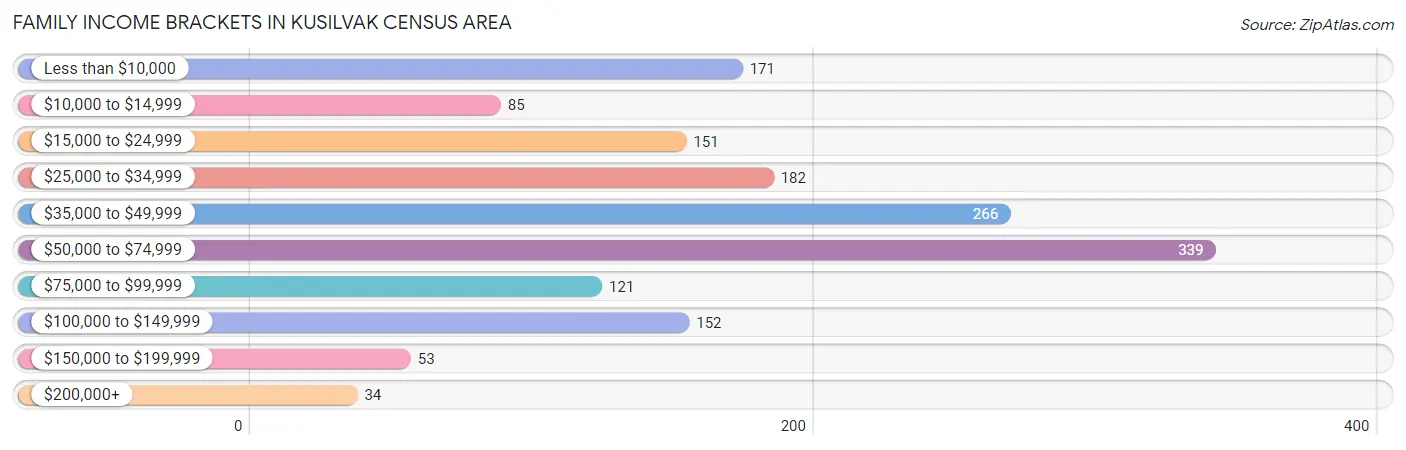
| Income Bracket | # Families | % Families |
| Less than $10,000 | 171 | 11.0% |
| $10,000 to $14,999 | 85 | 5.5% |
| $15,000 to $24,999 | 151 | 9.7% |
| $25,000 to $34,999 | 182 | 11.7% |
| $35,000 to $49,999 | 266 | 17.1% |
| $50,000 to $74,999 | 339 | 21.8% |
| $75,000 to $99,999 | 121 | 7.8% |
| $100,000 to $149,999 | 152 | 9.8% |
| $150,000 to $199,999 | 53 | 3.4% |
| $200,000+ | 34 | 2.2% |
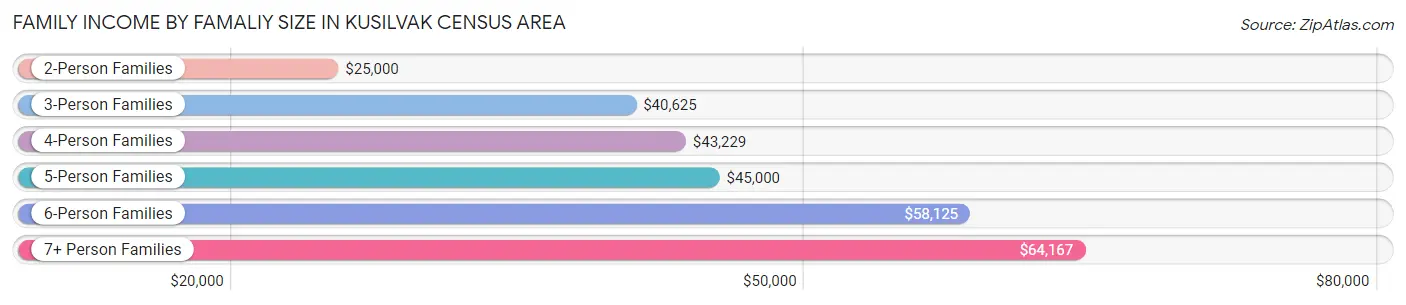
Family Income by Famaliy Size in Kusilvak Census Area
7+ person families (206 | 13.3%) account for the highest median family income in Kusilvak Census Area with $64,167 per family, while 3-person families (347 | 22.3%) have the highest median income of $13,542 per family member.
| Income Bracket | # Families | Median Income |
| 2-Person Families | 258 (16.6%) | $25,000 |
| 3-Person Families | 347 (22.3%) | $40,625 |
| 4-Person Families | 319 (20.5%) | $43,229 |
| 5-Person Families | 228 (14.7%) | $45,000 |
| 6-Person Families | 196 (12.6%) | $58,125 |
| 7+ Person Families | 206 (13.3%) | $64,167 |
| Total | 1,554 (100.0%) | $43,882 |
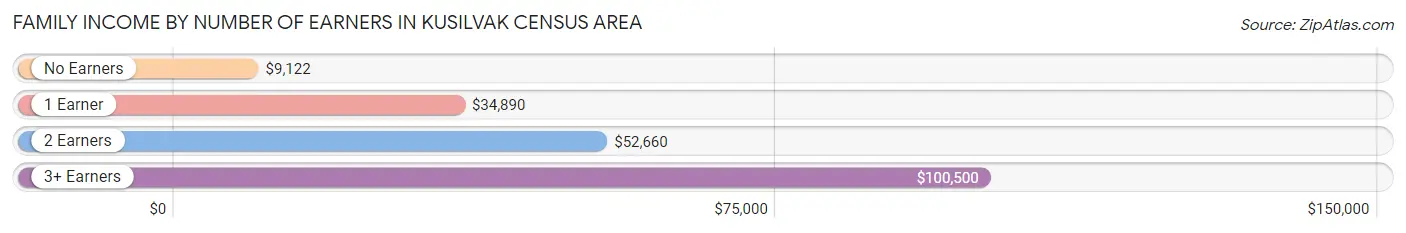
Family Income by Number of Earners in Kusilvak Census Area
The median family income in Kusilvak Census Area is $43,882, with families comprising 3+ earners (260) having the highest median family income of $100,500, while families with no earners (210) have the lowest median family income of $9,122, accounting for 16.7% and 13.5% of families, respectively.
| Number of Earners | # Families | Median Income |
| No Earners | 210 (13.5%) | $9,122 |
| 1 Earner | 599 (38.6%) | $34,890 |
| 2 Earners | 485 (31.2%) | $52,660 |
| 3+ Earners | 260 (16.7%) | $100,500 |
| Total | 1,554 (100.0%) | $43,882 |
Household Income in Kusilvak Census Area
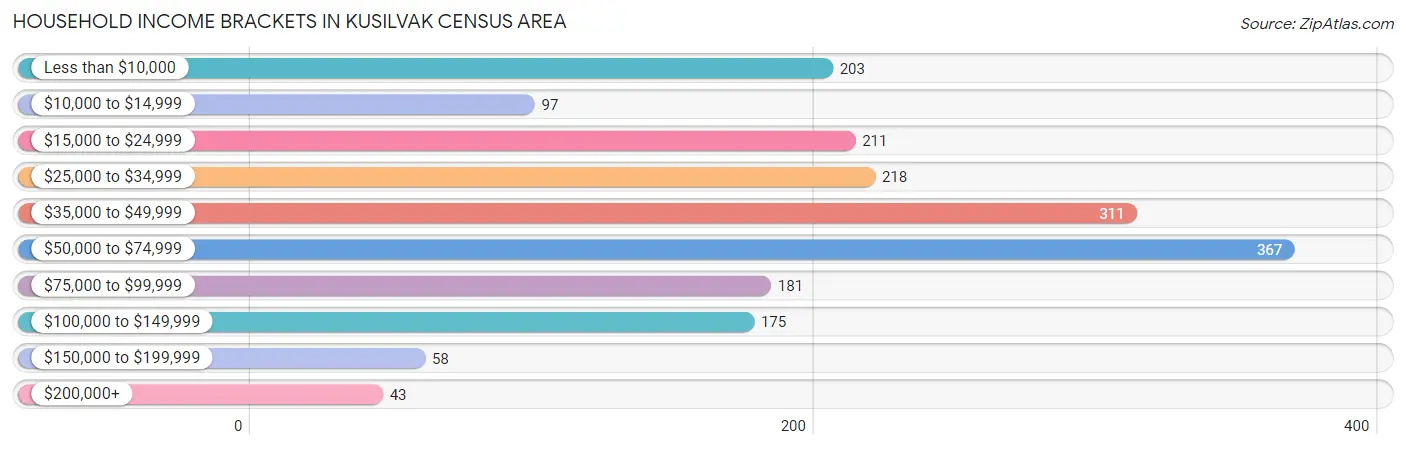
Household Income Brackets in Kusilvak Census Area
With 367 households falling in the category, the $50,000 to $74,999 income range is the most frequent in Kusilvak Census Area, accounting for 19.7% of all households. In contrast, only 43 households (2.3%) fall into the $200,000+ income bracket, making it the least populous group.
| Income Bracket | # Households | % Households |
| Less than $10,000 | 203 | 10.9% |
| $10,000 to $14,999 | 97 | 5.2% |
| $15,000 to $24,999 | 211 | 11.3% |
| $25,000 to $34,999 | 218 | 11.7% |
| $35,000 to $49,999 | 311 | 16.7% |
| $50,000 to $74,999 | 367 | 19.7% |
| $75,000 to $99,999 | 181 | 9.7% |
| $100,000 to $149,999 | 175 | 9.4% |
| $150,000 to $199,999 | 58 | 3.1% |
| $200,000+ | 43 | 2.3% |
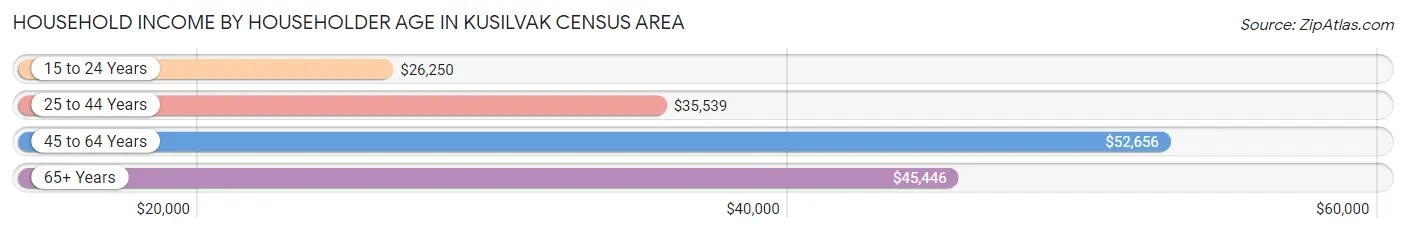
Household Income by Householder Age in Kusilvak Census Area
The median household income in Kusilvak Census Area is $42,663, with the highest median household income of $52,656 found in the 45 to 64 years age bracket for the primary householder. A total of 767 households (41.1%) fall into this category. Meanwhile, the 15 to 24 years age bracket for the primary householder has the lowest median household income of $26,250, with 44 households (2.4%) in this group.
| Income Bracket | # Households | Median Income |
| 15 to 24 Years | 44 (2.4%) | $26,250 |
| 25 to 44 Years | 668 (35.8%) | $35,539 |
| 45 to 64 Years | 767 (41.1%) | $52,656 |
| 65+ Years | 385 (20.6%) | $45,446 |
| Total | 1,864 (100.0%) | $42,663 |
Poverty in Kusilvak Census Area
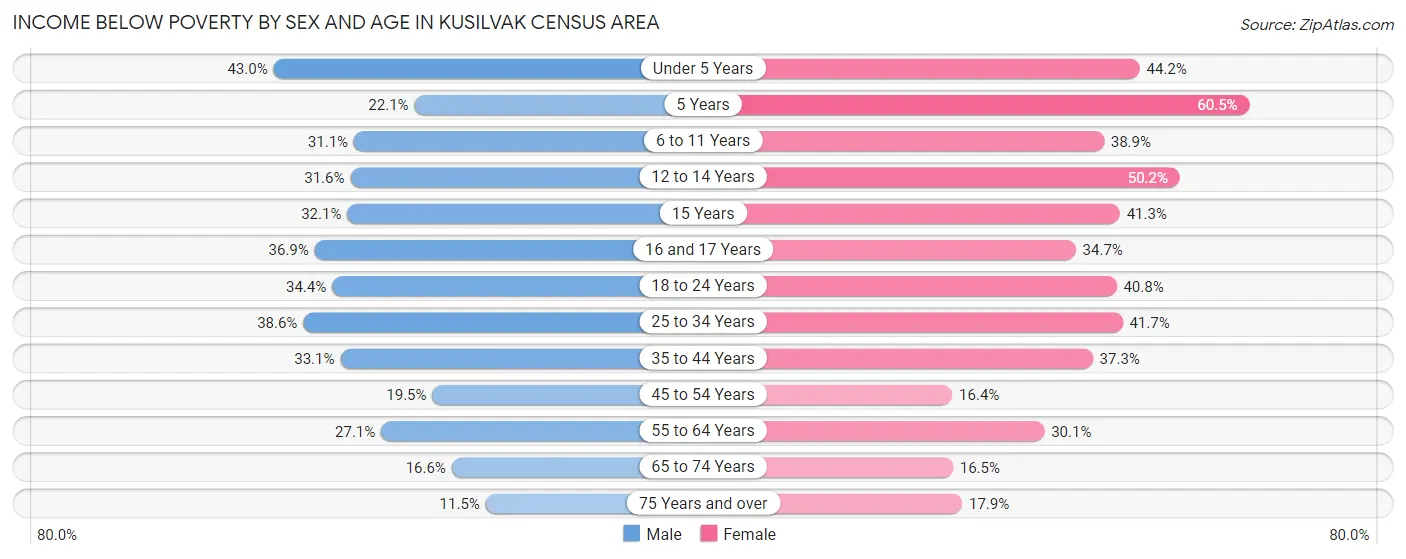
Income Below Poverty by Sex and Age in Kusilvak Census Area
With 31.9% poverty level for males and 37.1% for females among the residents of Kusilvak Census Area, under 5 year old males and 5 year old females are the most vulnerable to poverty, with 241 males (43.0%) and 46 females (60.5%) in their respective age groups living below the poverty level.
| Age Bracket | Male | Female |
| Under 5 Years | 241 (43.0%) | 222 (44.2%) |
| 5 Years | 23 (22.1%) | 46 (60.5%) |
| 6 to 11 Years | 167 (31.1%) | 198 (38.9%) |
| 12 to 14 Years | 106 (31.6%) | 133 (50.2%) |
| 15 Years | 43 (32.1%) | 26 (41.3%) |
| 16 and 17 Years | 41 (36.9%) | 58 (34.7%) |
| 18 to 24 Years | 157 (34.4%) | 166 (40.8%) |
| 25 to 34 Years | 265 (38.6%) | 228 (41.7%) |
| 35 to 44 Years | 153 (33.1%) | 133 (37.2%) |
| 45 to 54 Years | 85 (19.5%) | 49 (16.4%) |
| 55 to 64 Years | 118 (27.1%) | 95 (30.1%) |
| 65 to 74 Years | 33 (16.6%) | 29 (16.5%) |
| 75 Years and over | 6 (11.5%) | 15 (17.9%) |
| Total | 1,438 (31.9%) | 1,398 (37.1%) |
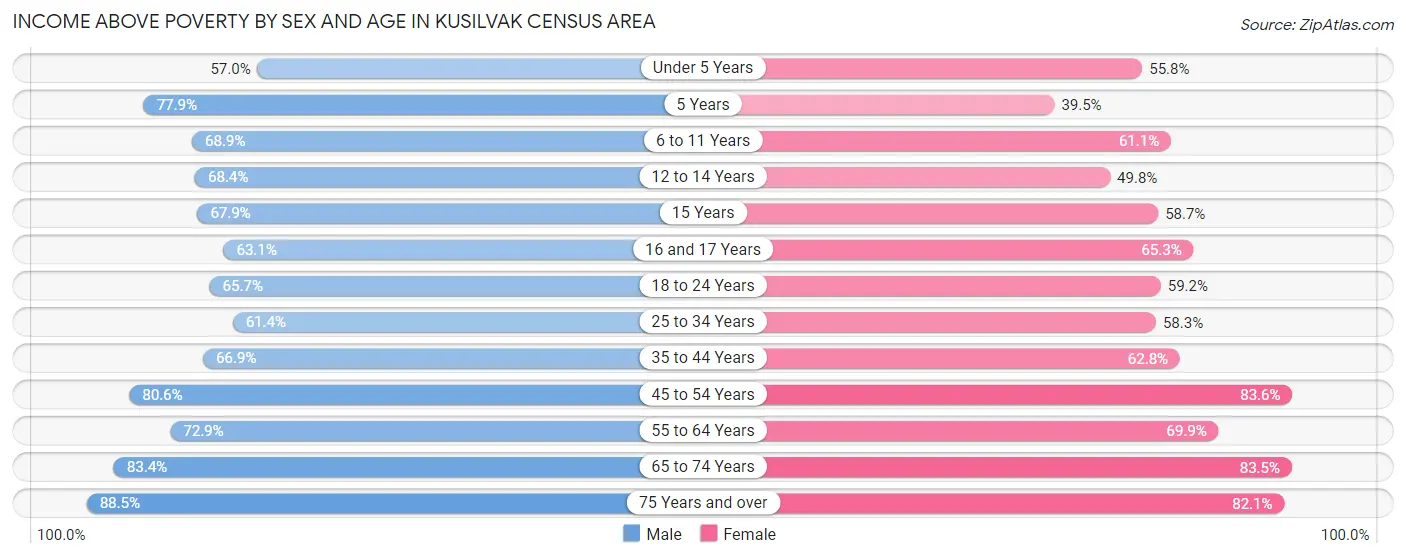
Income Above Poverty by Sex and Age in Kusilvak Census Area
According to the poverty statistics in Kusilvak Census Area, males aged 75 years and over and females aged 45 to 54 years are the age groups that are most secure financially, with 88.5% of males and 83.6% of females in these age groups living above the poverty line.
| Age Bracket | Male | Female |
| Under 5 Years | 319 (57.0%) | 280 (55.8%) |
| 5 Years | 81 (77.9%) | 30 (39.5%) |
| 6 to 11 Years | 370 (68.9%) | 311 (61.1%) |
| 12 to 14 Years | 229 (68.4%) | 132 (49.8%) |
| 15 Years | 91 (67.9%) | 37 (58.7%) |
| 16 and 17 Years | 70 (63.1%) | 109 (65.3%) |
| 18 to 24 Years | 300 (65.6%) | 241 (59.2%) |
| 25 to 34 Years | 421 (61.4%) | 319 (58.3%) |
| 35 to 44 Years | 309 (66.9%) | 224 (62.7%) |
| 45 to 54 Years | 352 (80.5%) | 250 (83.6%) |
| 55 to 64 Years | 318 (72.9%) | 221 (69.9%) |
| 65 to 74 Years | 166 (83.4%) | 147 (83.5%) |
| 75 Years and over | 46 (88.5%) | 69 (82.1%) |
| Total | 3,072 (68.1%) | 2,370 (62.9%) |
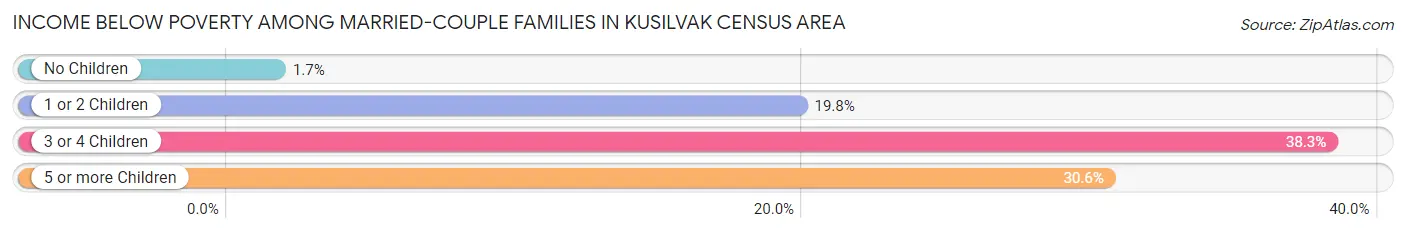
Income Below Poverty Among Married-Couple Families in Kusilvak Census Area
The poverty statistics for married-couple families in Kusilvak Census Area show that 22.7% or 164 of the total 723 families live below the poverty line. Families with 3 or 4 children have the highest poverty rate of 38.3%, comprising of 72 families. On the other hand, families with no children have the lowest poverty rate of 1.7%, which includes 2 families.
| Children | Above Poverty | Below Poverty |
| No Children | 118 (98.3%) | 2 (1.7%) |
| 1 or 2 Children | 275 (80.2%) | 68 (19.8%) |
| 3 or 4 Children | 116 (61.7%) | 72 (38.3%) |
| 5 or more Children | 50 (69.4%) | 22 (30.6%) |
| Total | 559 (77.3%) | 164 (22.7%) |
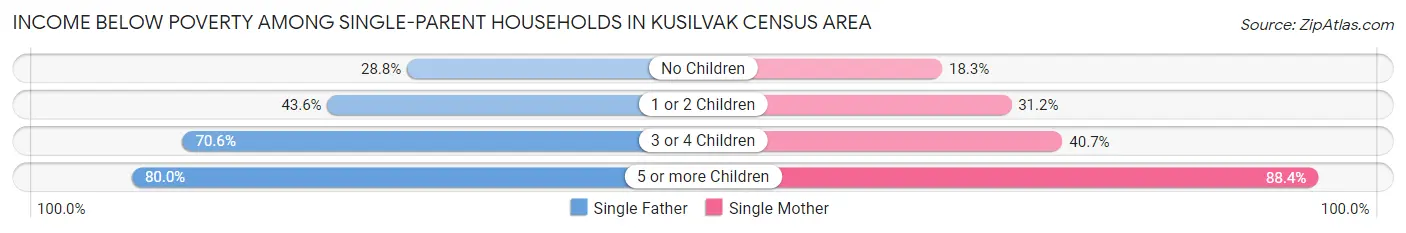
Income Below Poverty Among Single-Parent Households in Kusilvak Census Area
According to the poverty data in Kusilvak Census Area, 48.3% or 153 single-father households and 36.0% or 185 single-mother households are living below the poverty line. Among single-father households, those with 5 or more children have the highest poverty rate, with 16 households (80.0%) experiencing poverty. Likewise, among single-mother households, those with 5 or more children have the highest poverty rate, with 38 households (88.4%) falling below the poverty line.
| Children | Single Father | Single Mother |
| No Children | 21 (28.8%) | 11 (18.3%) |
| 1 or 2 Children | 68 (43.6%) | 103 (31.2%) |
| 3 or 4 Children | 48 (70.6%) | 33 (40.7%) |
| 5 or more Children | 16 (80.0%) | 38 (88.4%) |
| Total | 153 (48.3%) | 185 (36.0%) |
Income Below Poverty Among Married-Couple vs Single-Parent Households in Kusilvak Census Area
The poverty data for Kusilvak Census Area shows that 164 of the married-couple family households (22.7%) and 338 of the single-parent households (40.7%) are living below the poverty level. Within the married-couple family households, those with 3 or 4 children have the highest poverty rate, with 72 households (38.3%) falling below the poverty line. Among the single-parent households, those with 5 or more children have the highest poverty rate, with 54 household (85.7%) living below poverty.
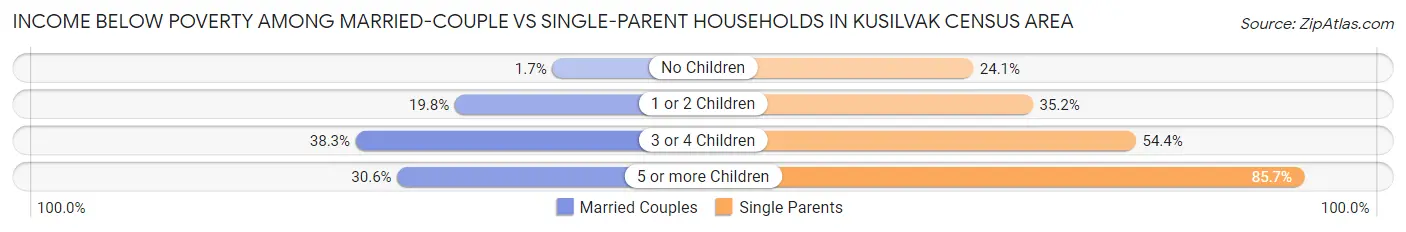
| Children | Married-Couple Families | Single-Parent Households |
| No Children | 2 (1.7%) | 32 (24.1%) |
| 1 or 2 Children | 68 (19.8%) | 171 (35.2%) |
| 3 or 4 Children | 72 (38.3%) | 81 (54.4%) |
| 5 or more Children | 22 (30.6%) | 54 (85.7%) |
| Total | 164 (22.7%) | 338 (40.7%) |
Employment Characteristics in Kusilvak Census Area
Employment by Class of Employer in Kusilvak Census Area
Among the 2,398 employed individuals in Kusilvak Census Area, private company employees (841 | 35.1%), local government employees (790 | 32.9%), and not-for-profit organizations (294 | 12.3%) make up the most common classes of employment.
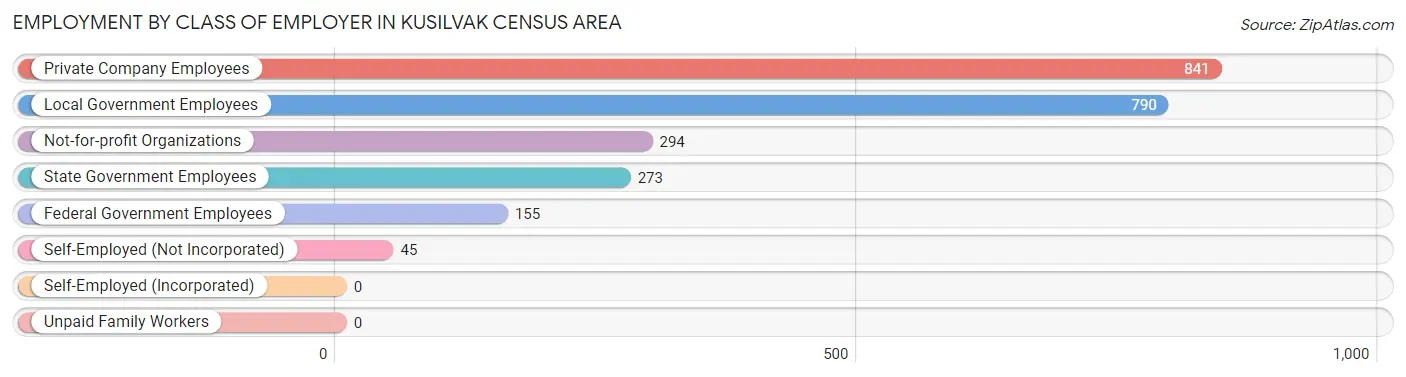
| Employer Class | # Employees | % Employees |
| Private Company Employees | 841 | 35.1% |
| Self-Employed (Incorporated) | 0 | 0.0% |
| Self-Employed (Not Incorporated) | 45 | 1.9% |
| Not-for-profit Organizations | 294 | 12.3% |
| Local Government Employees | 790 | 32.9% |
| State Government Employees | 273 | 11.4% |
| Federal Government Employees | 155 | 6.5% |
| Unpaid Family Workers | 0 | 0.0% |
| Total | 2,398 | 100.0% |
Employment Status by Age in Kusilvak Census Area
According to the labor force statistics for Kusilvak Census Area, out of the total population over 16 years of age (5,204), 59.8% or 3,112 individuals are in the labor force, with 20.9% or 650 of them unemployed. The age group with the highest labor force participation rate is 45 to 54 years, with 74.9% or 551 individuals in the labor force. Within the labor force, the 16 to 19 years age range has the highest percentage of unemployed individuals, with 46.1% or 71 of them being unemployed.
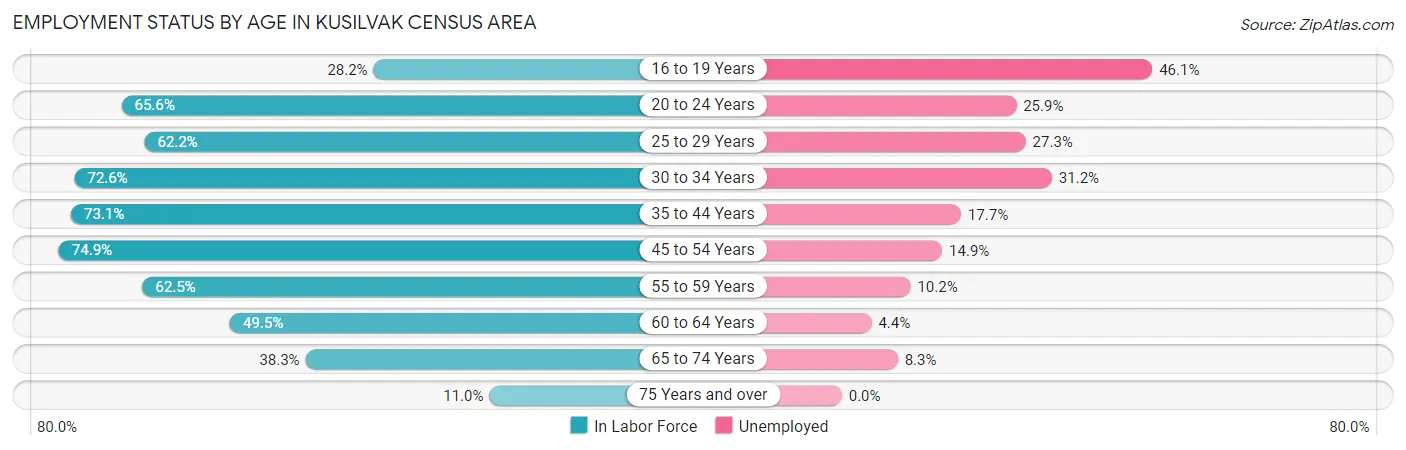
| Age Bracket | In Labor Force | Unemployed |
| 16 to 19 Years | 155 (28.2%) | 71 (46.1%) |
| 20 to 24 Years | 395 (65.6%) | 102 (25.9%) |
| 25 to 29 Years | 388 (62.2%) | 106 (27.3%) |
| 30 to 34 Years | 442 (72.6%) | 138 (31.2%) |
| 35 to 44 Years | 599 (73.1%) | 106 (17.7%) |
| 45 to 54 Years | 551 (74.9%) | 82 (14.9%) |
| 55 to 59 Years | 240 (62.5%) | 24 (10.2%) |
| 60 to 64 Years | 182 (49.5%) | 8 (4.4%) |
| 65 to 74 Years | 144 (38.3%) | 12 (8.3%) |
| 75 Years and over | 15 (11.0%) | 0 (0.0%) |
| Total | 3,112 (59.8%) | 650 (20.9%) |
Employment Status by Educational Attainment in Kusilvak Census Area
According to labor force statistics for Kusilvak Census Area, 67.9% of individuals (2,404) out of the total population between 25 and 64 years of age (3,540) are in the labor force, with 19.4% or 466 of them being unemployed. The group with the highest labor force participation rate are those with the educational attainment of bachelor's degree or higher, with 93.8% or 165 individuals in the labor force. Within the labor force, individuals with less than high school education have the highest percentage of unemployment, with 39.8% or 89 of them being unemployed.
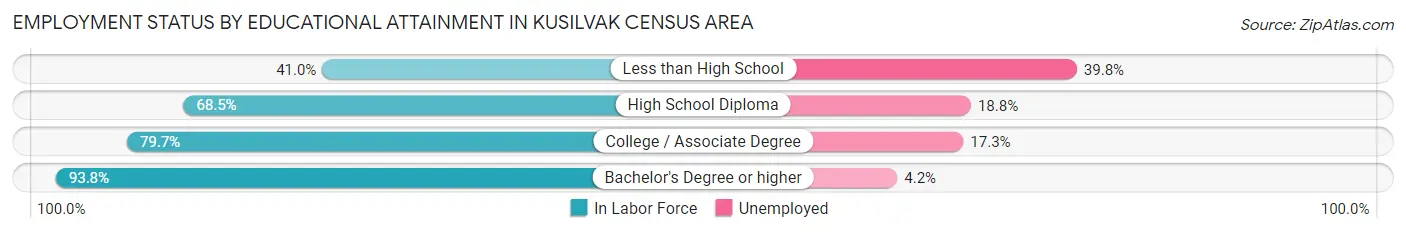
| Educational Attainment | In Labor Force | Unemployed |
| Less than High School | 223 (41.0%) | 217 (39.8%) |
| High School Diploma | 1,430 (68.5%) | 392 (18.8%) |
| College / Associate Degree | 584 (79.7%) | 127 (17.3%) |
| Bachelor's Degree or higher | 165 (93.8%) | 7 (4.2%) |
| Total | 2,404 (67.9%) | 687 (19.4%) |
Employment Occupations by Sex in Kusilvak Census Area
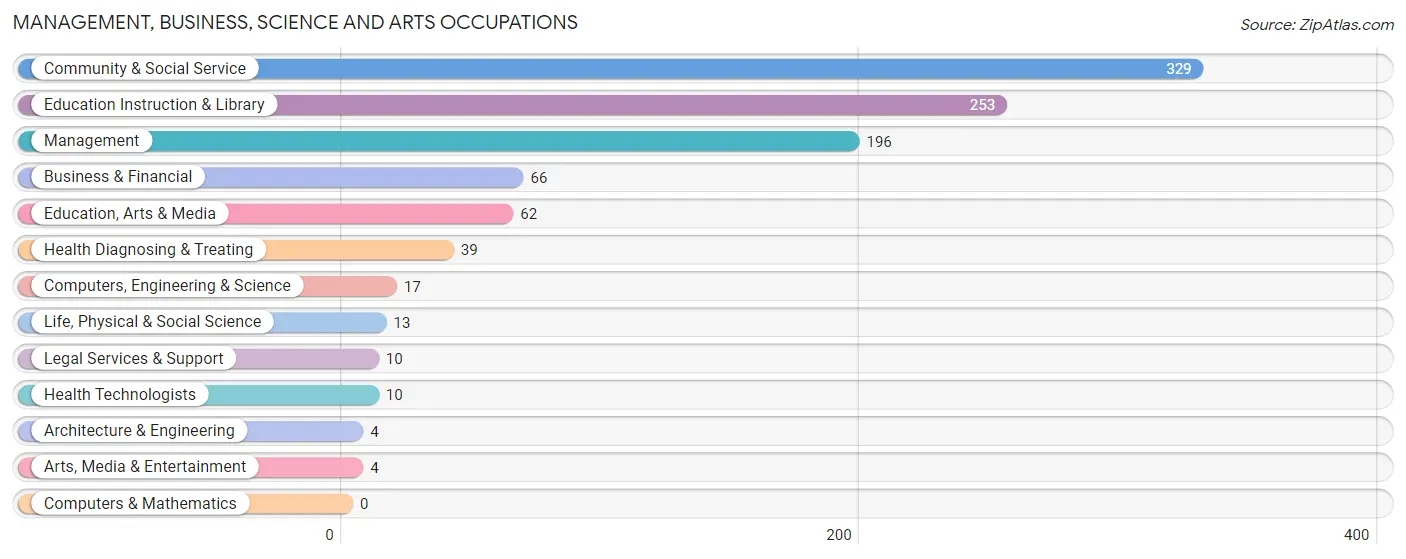
Management, Business, Science and Arts Occupations
The most common Management, Business, Science and Arts occupations in Kusilvak Census Area are Community & Social Service (329 | 13.4%), Education Instruction & Library (253 | 10.3%), Management (196 | 8.0%), Business & Financial (66 | 2.7%), and Education, Arts & Media (62 | 2.5%).
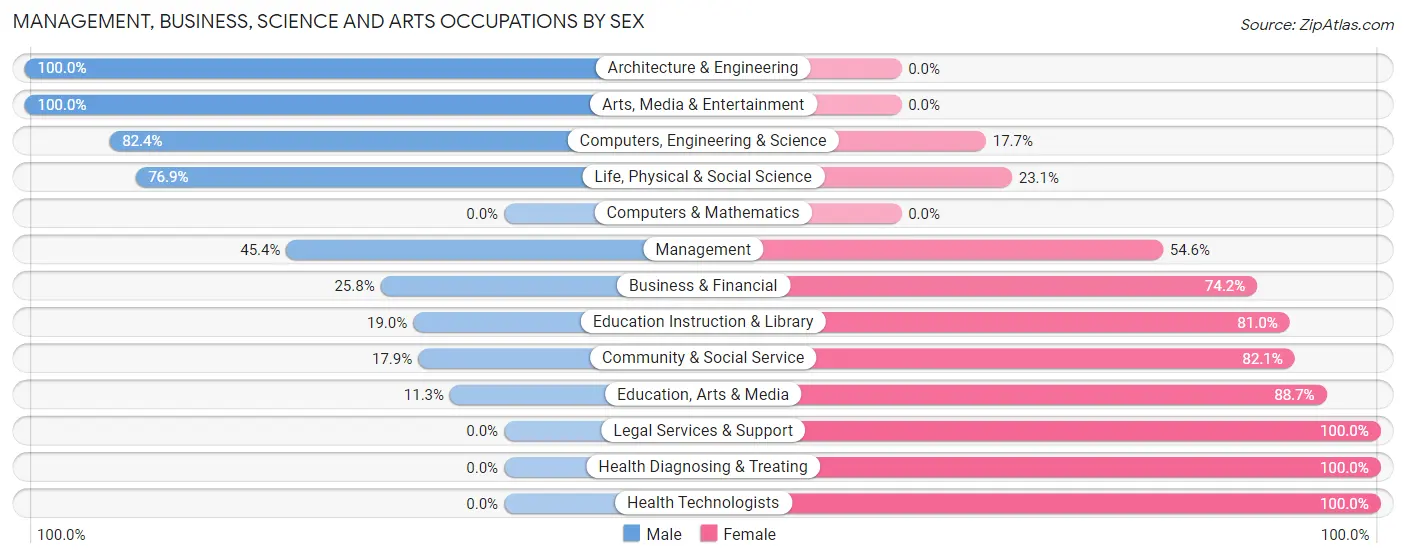
Management, Business, Science and Arts Occupations by Sex
Within the Management, Business, Science and Arts occupations in Kusilvak Census Area, the most male-oriented occupations are Architecture & Engineering (100.0%), Arts, Media & Entertainment (100.0%), and Computers, Engineering & Science (82.4%), while the most female-oriented occupations are Legal Services & Support (100.0%), Health Diagnosing & Treating (100.0%), and Health Technologists (100.0%).
| Occupation | Male | Female |
| Management | 89 (45.4%) | 107 (54.6%) |
| Business & Financial | 17 (25.8%) | 49 (74.2%) |
| Computers, Engineering & Science | 14 (82.4%) | 3 (17.6%) |
| Computers & Mathematics | 0 (0.0%) | 0 (0.0%) |
| Architecture & Engineering | 4 (100.0%) | 0 (0.0%) |
| Life, Physical & Social Science | 10 (76.9%) | 3 (23.1%) |
| Community & Social Service | 59 (17.9%) | 270 (82.1%) |
| Education, Arts & Media | 7 (11.3%) | 55 (88.7%) |
| Legal Services & Support | 0 (0.0%) | 10 (100.0%) |
| Education Instruction & Library | 48 (19.0%) | 205 (81.0%) |
| Arts, Media & Entertainment | 4 (100.0%) | 0 (0.0%) |
| Health Diagnosing & Treating | 0 (0.0%) | 39 (100.0%) |
| Health Technologists | 0 (0.0%) | 10 (100.0%) |
| Total (Category) | 179 (27.7%) | 468 (72.3%) |
| Total (Overall) | 1,315 (53.7%) | 1,133 (46.3%) |
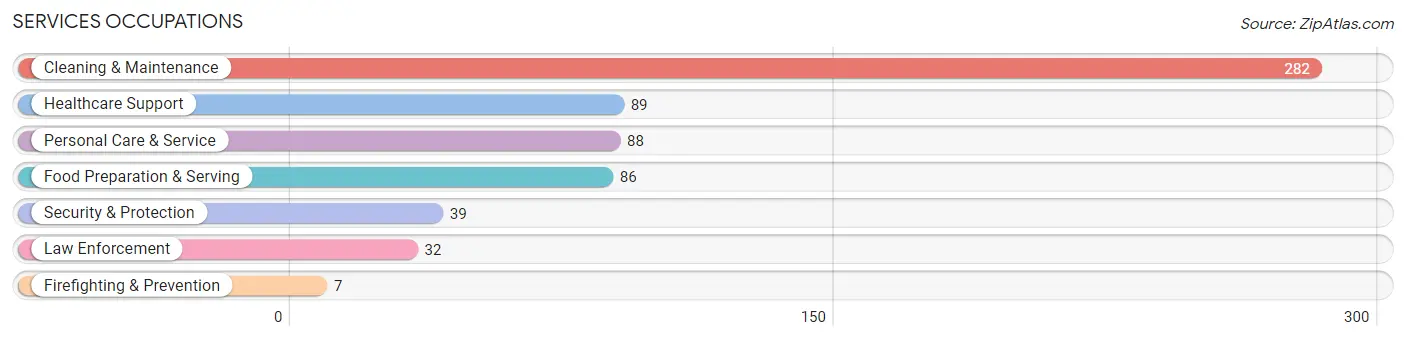
Services Occupations
The most common Services occupations in Kusilvak Census Area are Cleaning & Maintenance (282 | 11.5%), Healthcare Support (89 | 3.6%), Personal Care & Service (88 | 3.6%), Food Preparation & Serving (86 | 3.5%), and Security & Protection (39 | 1.6%).
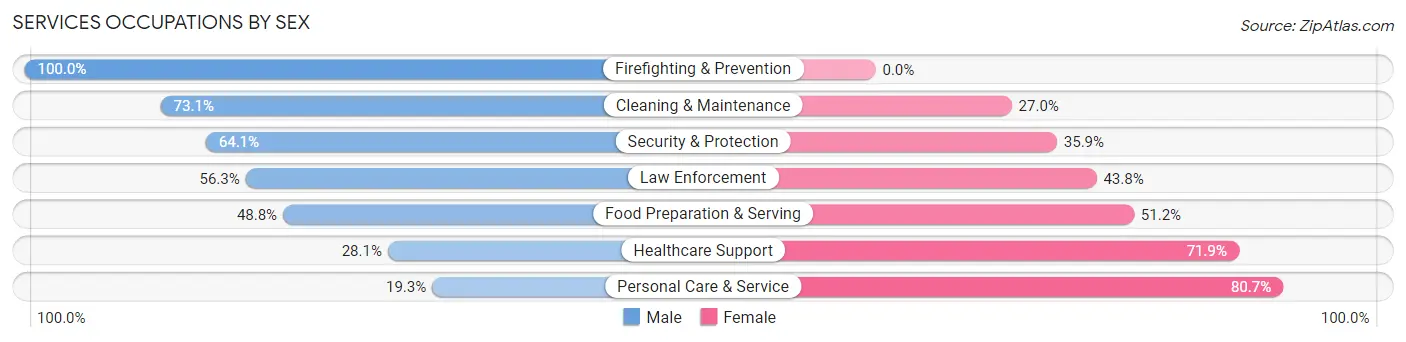
Services Occupations by Sex
Within the Services occupations in Kusilvak Census Area, the most male-oriented occupations are Firefighting & Prevention (100.0%), Cleaning & Maintenance (73.1%), and Security & Protection (64.1%), while the most female-oriented occupations are Personal Care & Service (80.7%), Healthcare Support (71.9%), and Food Preparation & Serving (51.2%).
| Occupation | Male | Female |
| Healthcare Support | 25 (28.1%) | 64 (71.9%) |
| Security & Protection | 25 (64.1%) | 14 (35.9%) |
| Firefighting & Prevention | 7 (100.0%) | 0 (0.0%) |
| Law Enforcement | 18 (56.2%) | 14 (43.8%) |
| Food Preparation & Serving | 42 (48.8%) | 44 (51.2%) |
| Cleaning & Maintenance | 206 (73.1%) | 76 (27.0%) |
| Personal Care & Service | 17 (19.3%) | 71 (80.7%) |
| Total (Category) | 315 (53.9%) | 269 (46.1%) |
| Total (Overall) | 1,315 (53.7%) | 1,133 (46.3%) |
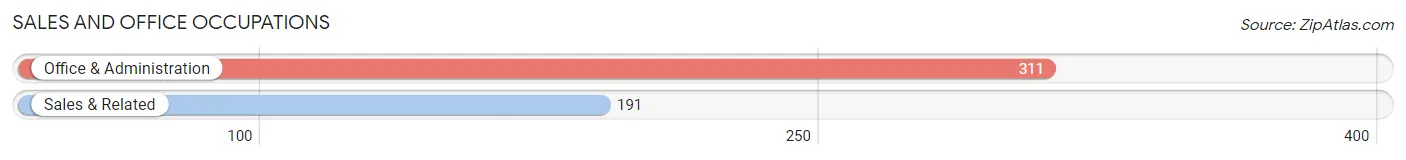
Sales and Office Occupations
The most common Sales and Office occupations in Kusilvak Census Area are Office & Administration (311 | 12.7%), and Sales & Related (191 | 7.8%).
Sales and Office Occupations by Sex
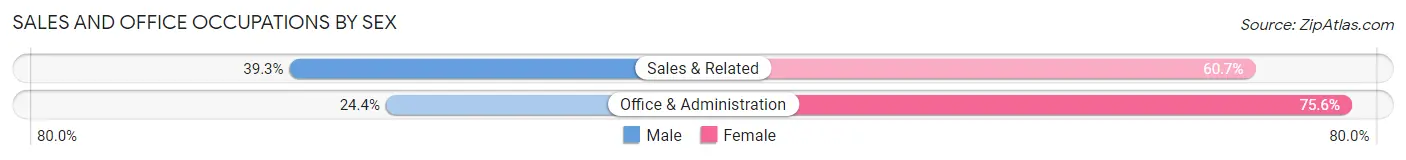
| Occupation | Male | Female |
| Sales & Related | 75 (39.3%) | 116 (60.7%) |
| Office & Administration | 76 (24.4%) | 235 (75.6%) |
| Total (Category) | 151 (30.1%) | 351 (69.9%) |
| Total (Overall) | 1,315 (53.7%) | 1,133 (46.3%) |
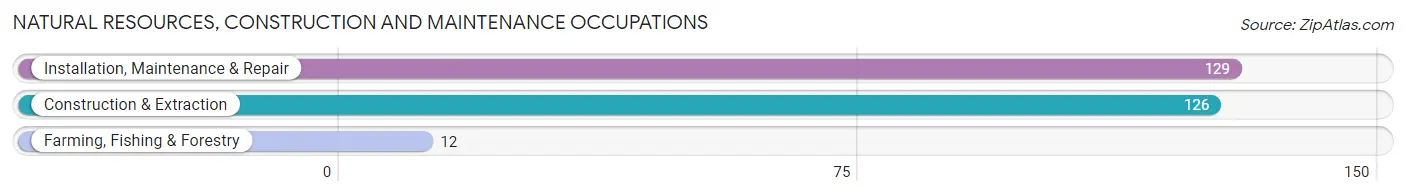
Natural Resources, Construction and Maintenance Occupations
The most common Natural Resources, Construction and Maintenance occupations in Kusilvak Census Area are Installation, Maintenance & Repair (129 | 5.3%), Construction & Extraction (126 | 5.1%), and Farming, Fishing & Forestry (12 | 0.5%).
Natural Resources, Construction and Maintenance Occupations by Sex
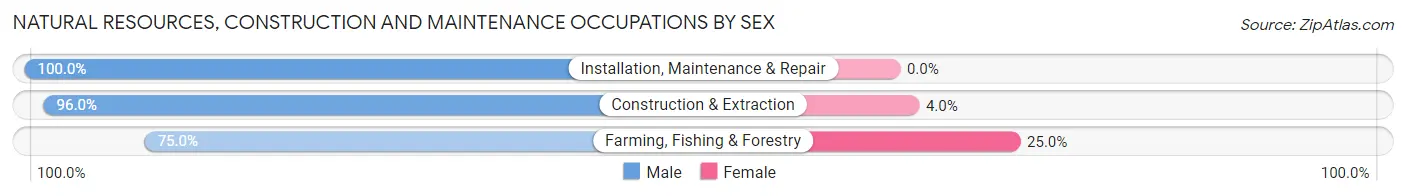
| Occupation | Male | Female |
| Farming, Fishing & Forestry | 9 (75.0%) | 3 (25.0%) |
| Construction & Extraction | 121 (96.0%) | 5 (4.0%) |
| Installation, Maintenance & Repair | 129 (100.0%) | 0 (0.0%) |
| Total (Category) | 259 (97.0%) | 8 (3.0%) |
| Total (Overall) | 1,315 (53.7%) | 1,133 (46.3%) |
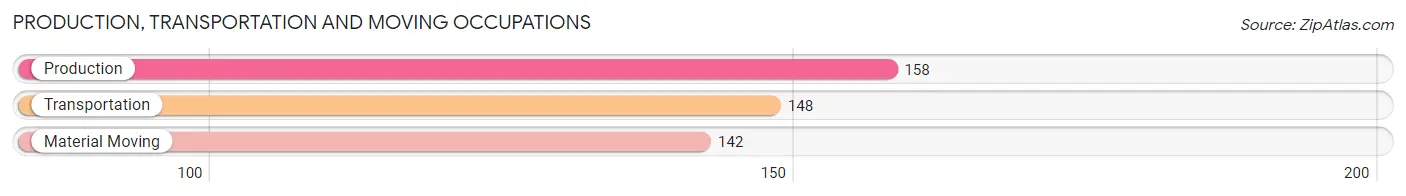
Production, Transportation and Moving Occupations
The most common Production, Transportation and Moving occupations in Kusilvak Census Area are Production (158 | 6.5%), Transportation (148 | 6.0%), and Material Moving (142 | 5.8%).
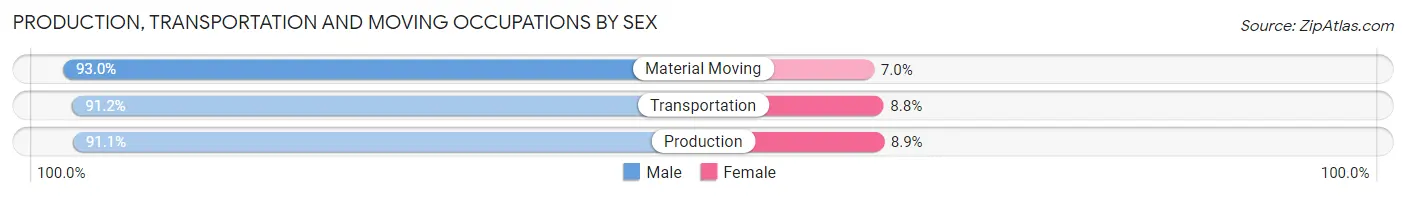
Production, Transportation and Moving Occupations by Sex
| Occupation | Male | Female |
| Production | 144 (91.1%) | 14 (8.9%) |
| Transportation | 135 (91.2%) | 13 (8.8%) |
| Material Moving | 132 (93.0%) | 10 (7.0%) |
| Total (Category) | 411 (91.7%) | 37 (8.3%) |
| Total (Overall) | 1,315 (53.7%) | 1,133 (46.3%) |
Employment Industries by Sex in Kusilvak Census Area
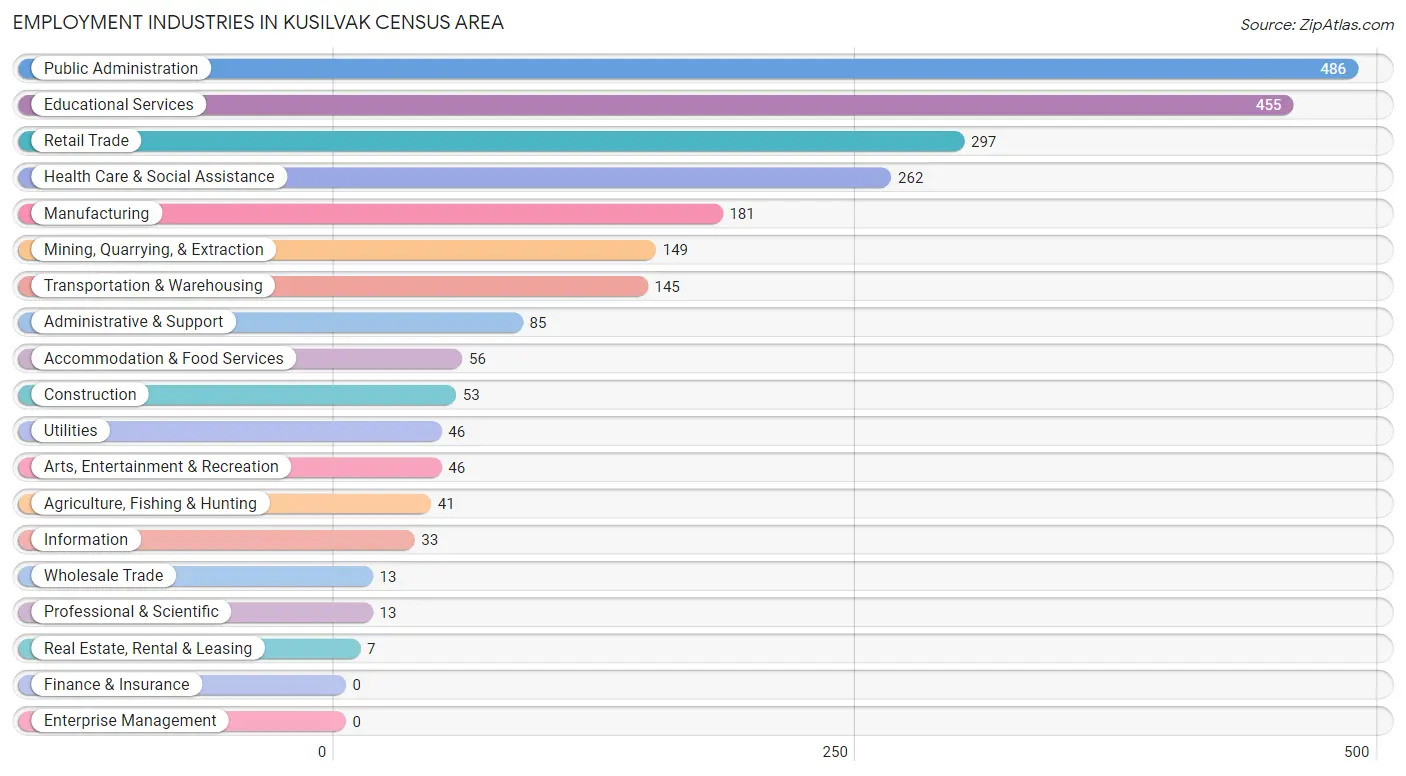
Employment Industries in Kusilvak Census Area
The major employment industries in Kusilvak Census Area include Public Administration (486 | 19.9%), Educational Services (455 | 18.6%), Retail Trade (297 | 12.1%), Health Care & Social Assistance (262 | 10.7%), and Manufacturing (181 | 7.4%).
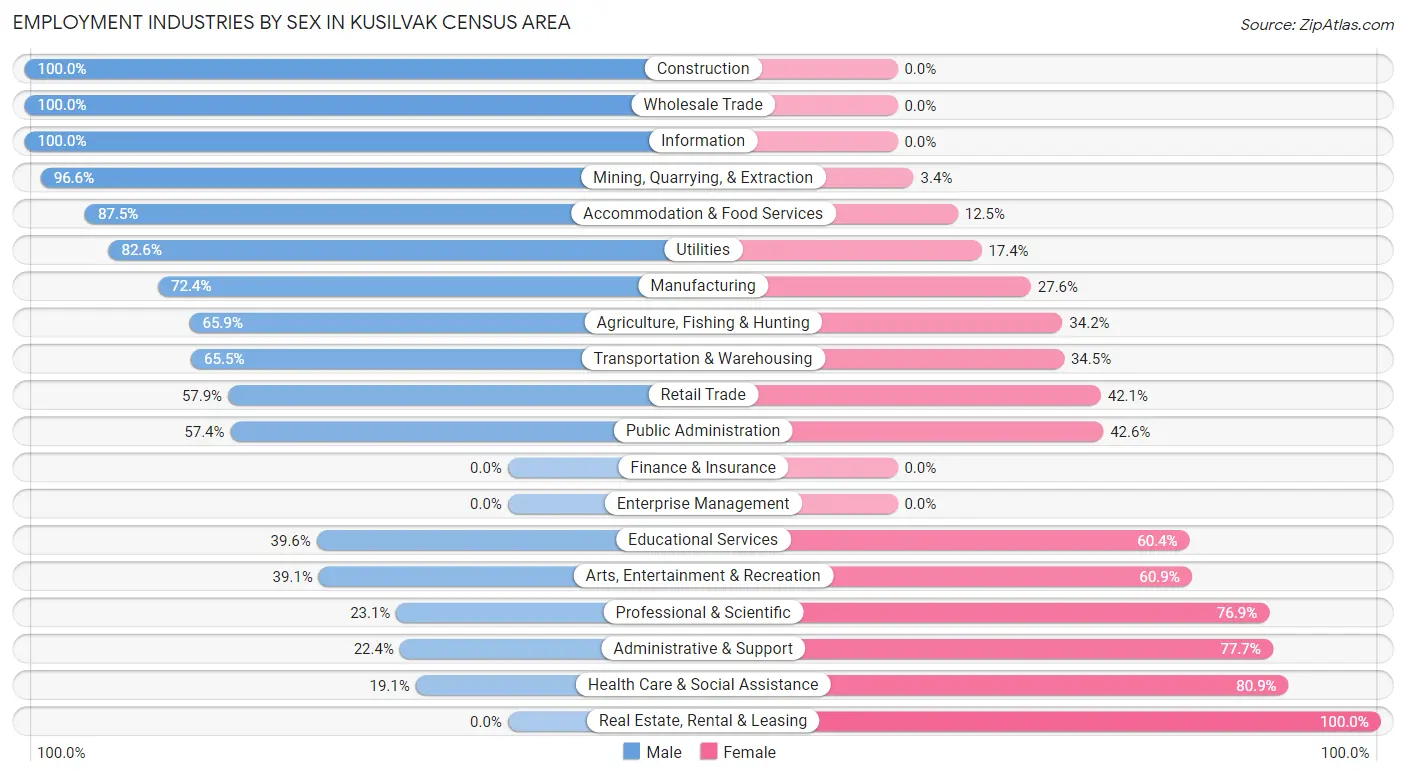
Employment Industries by Sex in Kusilvak Census Area
The Kusilvak Census Area industries that see more men than women are Construction (100.0%), Wholesale Trade (100.0%), and Information (100.0%), whereas the industries that tend to have a higher number of women are Real Estate, Rental & Leasing (100.0%), Health Care & Social Assistance (80.9%), and Administrative & Support (77.6%).
| Industry | Male | Female |
| Agriculture, Fishing & Hunting | 27 (65.8%) | 14 (34.2%) |
| Mining, Quarrying, & Extraction | 144 (96.6%) | 5 (3.4%) |
| Construction | 53 (100.0%) | 0 (0.0%) |
| Manufacturing | 131 (72.4%) | 50 (27.6%) |
| Wholesale Trade | 13 (100.0%) | 0 (0.0%) |
| Retail Trade | 172 (57.9%) | 125 (42.1%) |
| Transportation & Warehousing | 95 (65.5%) | 50 (34.5%) |
| Utilities | 38 (82.6%) | 8 (17.4%) |
| Information | 33 (100.0%) | 0 (0.0%) |
| Finance & Insurance | 0 (0.0%) | 0 (0.0%) |
| Real Estate, Rental & Leasing | 0 (0.0%) | 7 (100.0%) |
| Professional & Scientific | 3 (23.1%) | 10 (76.9%) |
| Enterprise Management | 0 (0.0%) | 0 (0.0%) |
| Administrative & Support | 19 (22.4%) | 66 (77.6%) |
| Educational Services | 180 (39.6%) | 275 (60.4%) |
| Health Care & Social Assistance | 50 (19.1%) | 212 (80.9%) |
| Arts, Entertainment & Recreation | 18 (39.1%) | 28 (60.9%) |
| Accommodation & Food Services | 49 (87.5%) | 7 (12.5%) |
| Public Administration | 279 (57.4%) | 207 (42.6%) |
| Total | 1,315 (53.7%) | 1,133 (46.3%) |
Education in Kusilvak Census Area
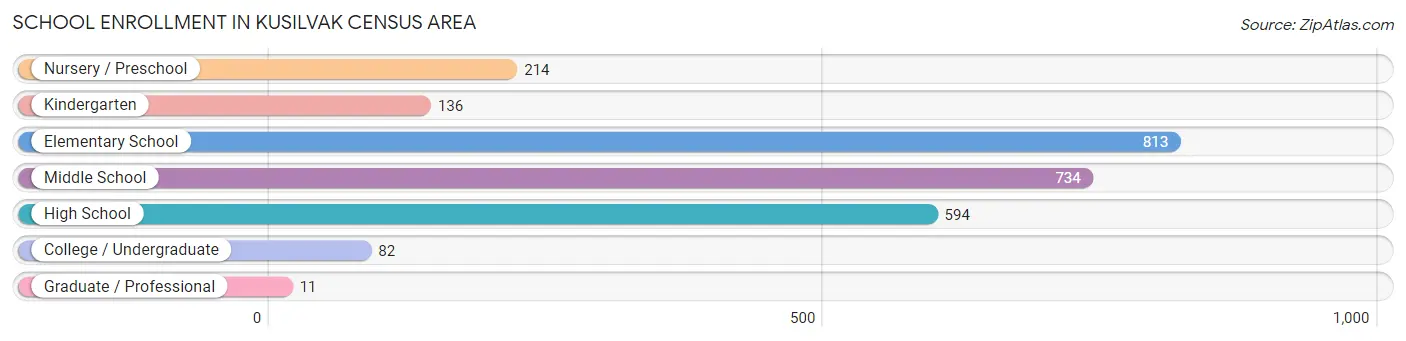
School Enrollment in Kusilvak Census Area
The most common levels of schooling among the 2,584 students in Kusilvak Census Area are elementary school (813 | 31.5%), middle school (734 | 28.4%), and high school (594 | 23.0%).
| School Level | # Students | % Students |
| Nursery / Preschool | 214 | 8.3% |
| Kindergarten | 136 | 5.3% |
| Elementary School | 813 | 31.5% |
| Middle School | 734 | 28.4% |
| High School | 594 | 23.0% |
| College / Undergraduate | 82 | 3.2% |
| Graduate / Professional | 11 | 0.4% |
| Total | 2,584 | 100.0% |
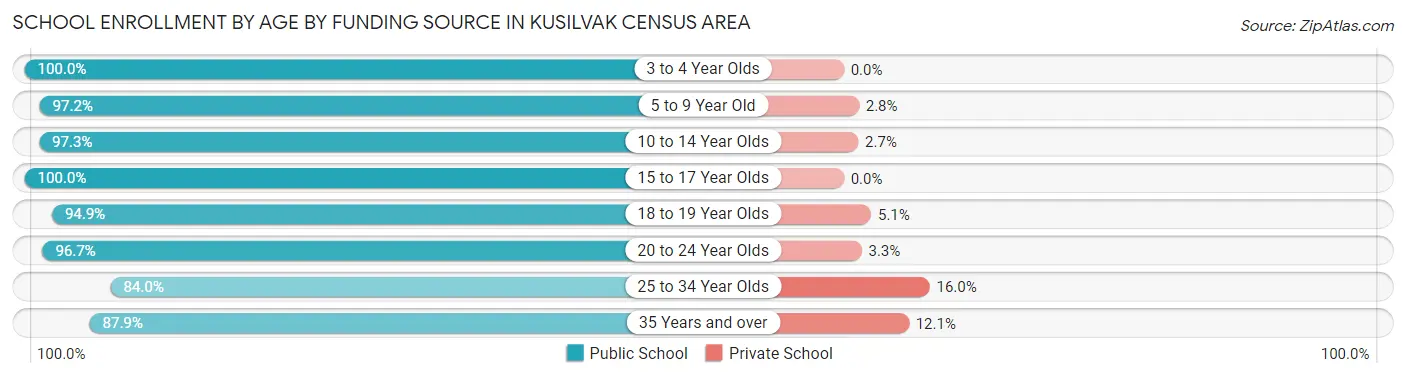
School Enrollment by Age by Funding Source in Kusilvak Census Area
Out of a total of 2,584 students who are enrolled in schools in Kusilvak Census Area, 62 (2.4%) attend a private institution, while the remaining 2,522 (97.6%) are enrolled in public schools. The age group of 25 to 34 year olds has the highest likelihood of being enrolled in private schools, with 4 (16.0% in the age bracket) enrolled. Conversely, the age group of 3 to 4 year olds has the lowest likelihood of being enrolled in a private school, with 177 (100.0% in the age bracket) attending a public institution.
| Age Bracket | Public School | Private School |
| 3 to 4 Year Olds | 177 (100.0%) | 0 (0.0%) |
| 5 to 9 Year Old | 866 (97.2%) | 25 (2.8%) |
| 10 to 14 Year Olds | 866 (97.3%) | 24 (2.7%) |
| 15 to 17 Year Olds | 440 (100.0%) | 0 (0.0%) |
| 18 to 19 Year Olds | 93 (94.9%) | 5 (5.1%) |
| 20 to 24 Year Olds | 29 (96.7%) | 1 (3.3%) |
| 25 to 34 Year Olds | 21 (84.0%) | 4 (16.0%) |
| 35 Years and over | 29 (87.9%) | 4 (12.1%) |
| Total | 2,522 (97.6%) | 62 (2.4%) |
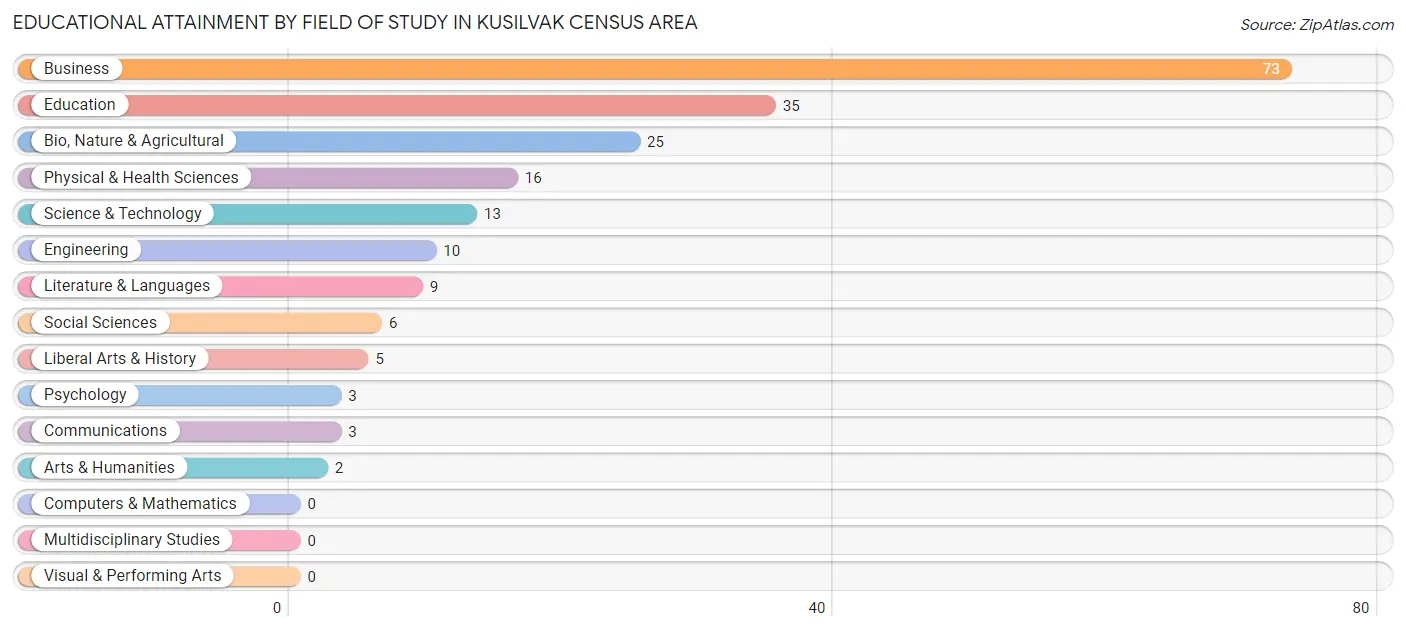
Educational Attainment by Field of Study in Kusilvak Census Area
Business (73 | 36.5%), education (35 | 17.5%), bio, nature & agricultural (25 | 12.5%), physical & health sciences (16 | 8.0%), and science & technology (13 | 6.5%) are the most common fields of study among 200 individuals in Kusilvak Census Area who have obtained a bachelor's degree or higher.
| Field of Study | # Graduates | % Graduates |
| Computers & Mathematics | 0 | 0.0% |
| Bio, Nature & Agricultural | 25 | 12.5% |
| Physical & Health Sciences | 16 | 8.0% |
| Psychology | 3 | 1.5% |
| Social Sciences | 6 | 3.0% |
| Engineering | 10 | 5.0% |
| Multidisciplinary Studies | 0 | 0.0% |
| Science & Technology | 13 | 6.5% |
| Business | 73 | 36.5% |
| Education | 35 | 17.5% |
| Literature & Languages | 9 | 4.5% |
| Liberal Arts & History | 5 | 2.5% |
| Visual & Performing Arts | 0 | 0.0% |
| Communications | 3 | 1.5% |
| Arts & Humanities | 2 | 1.0% |
| Total | 200 | 100.0% |
Transportation & Commute in Kusilvak Census Area
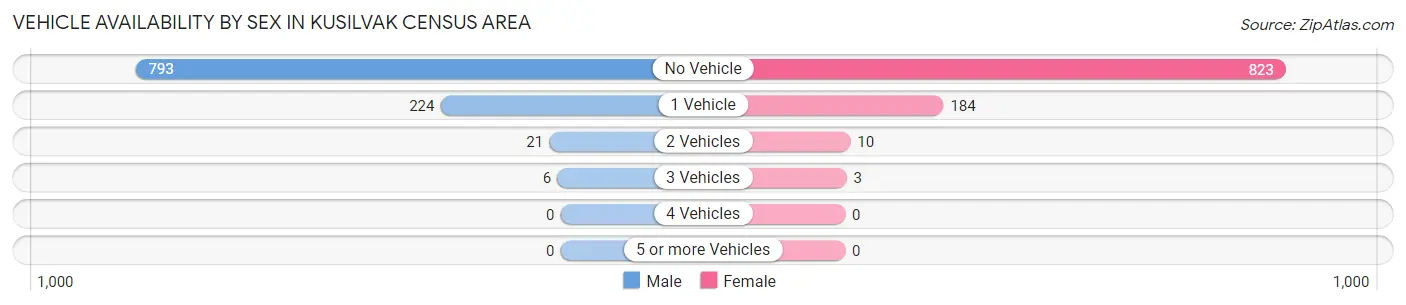
Vehicle Availability by Sex in Kusilvak Census Area
The most prevalent vehicle ownership categories in Kusilvak Census Area are males with no vehicle (793, accounting for 76.0%) and females with no vehicle (823, making up 77.7%).
| Vehicles Available | Male | Female |
| No Vehicle | 793 (76.0%) | 823 (80.7%) |
| 1 Vehicle | 224 (21.5%) | 184 (18.0%) |
| 2 Vehicles | 21 (2.0%) | 10 (1.0%) |
| 3 Vehicles | 6 (0.6%) | 3 (0.3%) |
| 4 Vehicles | 0 (0.0%) | 0 (0.0%) |
| 5 or more Vehicles | 0 (0.0%) | 0 (0.0%) |
| Total | 1,044 (100.0%) | 1,020 (100.0%) |
Commute Time in Kusilvak Census Area
The most frequently occuring commute durations in Kusilvak Census Area are 5 to 9 minutes (1,241 commuters, 54.1%), less than 5 minutes (569 commuters, 24.8%), and 10 to 14 minutes (355 commuters, 15.5%).
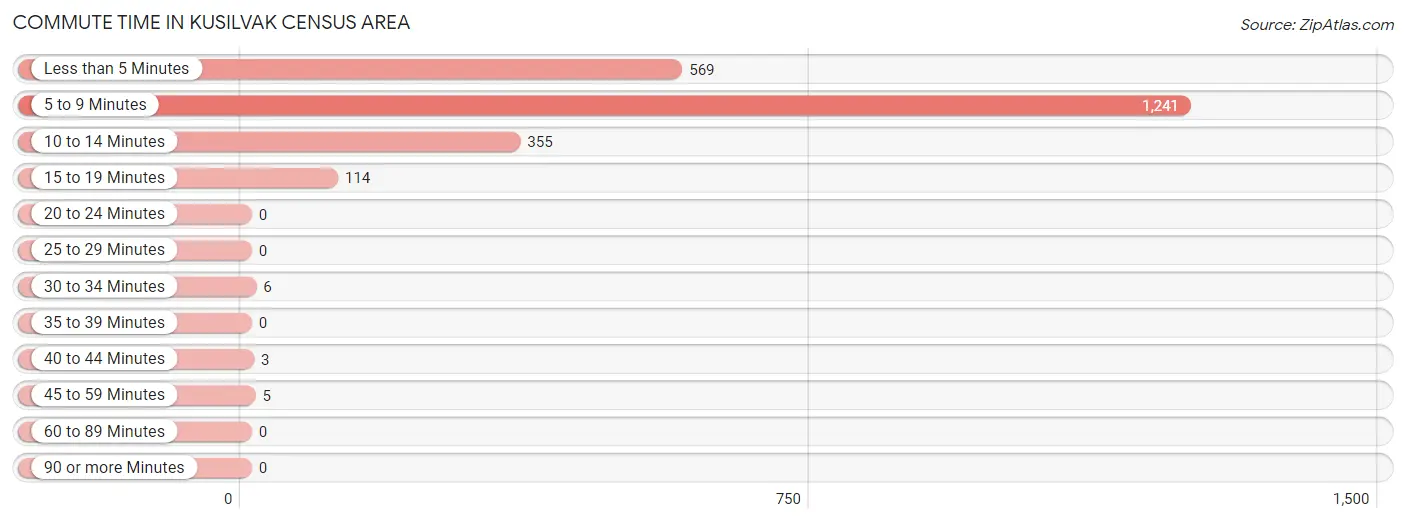
| Commute Time | # Commuters | % Commuters |
| Less than 5 Minutes | 569 | 24.8% |
| 5 to 9 Minutes | 1,241 | 54.1% |
| 10 to 14 Minutes | 355 | 15.5% |
| 15 to 19 Minutes | 114 | 5.0% |
| 20 to 24 Minutes | 0 | 0.0% |
| 25 to 29 Minutes | 0 | 0.0% |
| 30 to 34 Minutes | 6 | 0.3% |
| 35 to 39 Minutes | 0 | 0.0% |
| 40 to 44 Minutes | 3 | 0.1% |
| 45 to 59 Minutes | 5 | 0.2% |
| 60 to 89 Minutes | 0 | 0.0% |
| 90 or more Minutes | 0 | 0.0% |
Commute Time by Sex in Kusilvak Census Area
The most common commute times in Kusilvak Census Area are 5 to 9 minutes (728 commuters, 57.6%) for males and 5 to 9 minutes (513 commuters, 49.9%) for females.
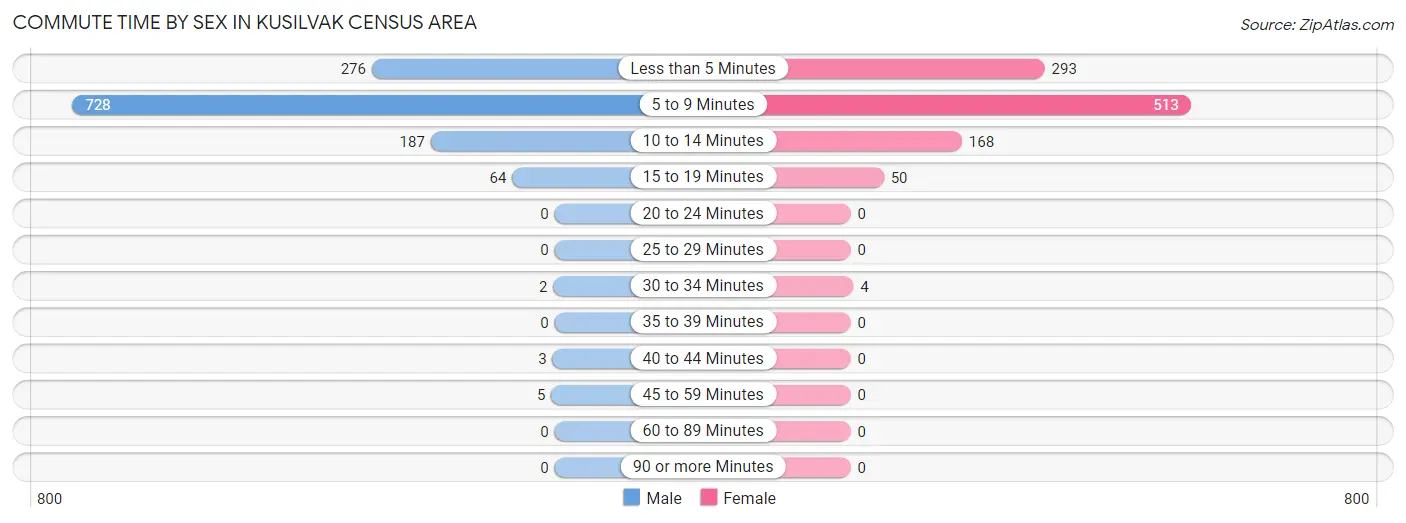
| Commute Time | Male | Female |
| Less than 5 Minutes | 276 (21.8%) | 293 (28.5%) |
| 5 to 9 Minutes | 728 (57.6%) | 513 (49.9%) |
| 10 to 14 Minutes | 187 (14.8%) | 168 (16.3%) |
| 15 to 19 Minutes | 64 (5.1%) | 50 (4.9%) |
| 20 to 24 Minutes | 0 (0.0%) | 0 (0.0%) |
| 25 to 29 Minutes | 0 (0.0%) | 0 (0.0%) |
| 30 to 34 Minutes | 2 (0.2%) | 4 (0.4%) |
| 35 to 39 Minutes | 0 (0.0%) | 0 (0.0%) |
| 40 to 44 Minutes | 3 (0.2%) | 0 (0.0%) |
| 45 to 59 Minutes | 5 (0.4%) | 0 (0.0%) |
| 60 to 89 Minutes | 0 (0.0%) | 0 (0.0%) |
| 90 or more Minutes | 0 (0.0%) | 0 (0.0%) |
Time of Departure to Work by Sex in Kusilvak Census Area
The most frequent times of departure to work in Kusilvak Census Area are 8:30 AM to 8:59 AM (206, 16.3%) for males and 8:00 AM to 8:29 AM (241, 23.4%) for females.
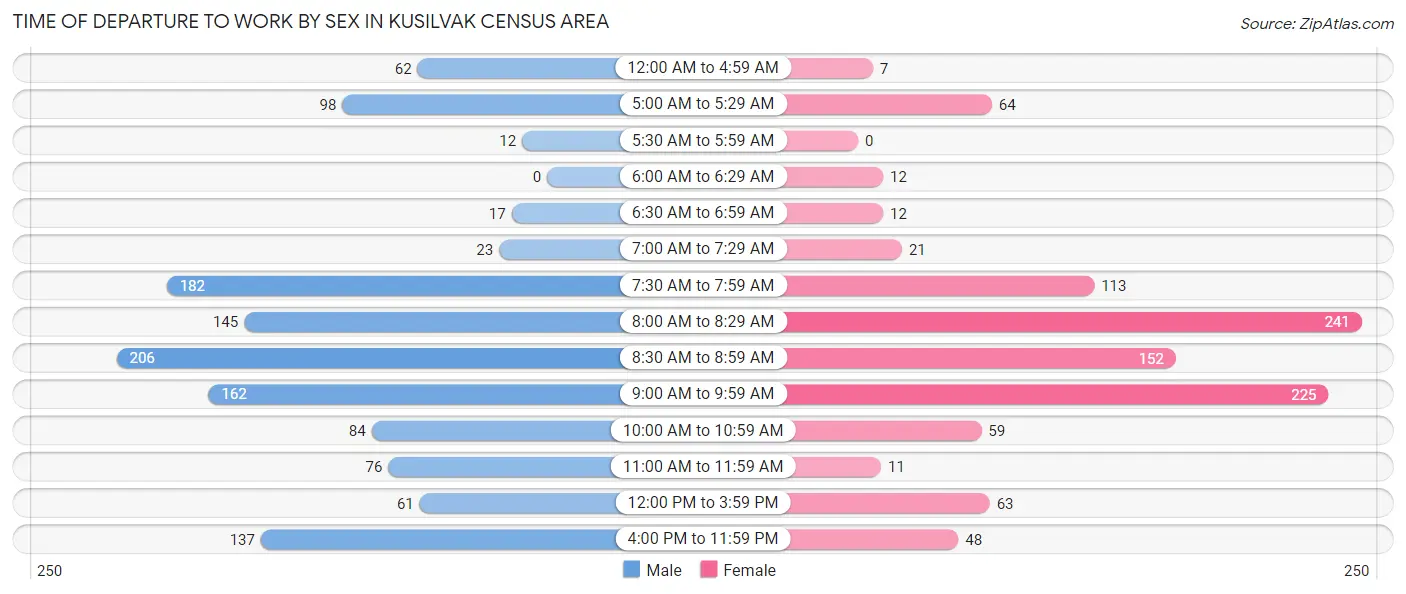
| Time of Departure | Male | Female |
| 12:00 AM to 4:59 AM | 62 (4.9%) | 7 (0.7%) |
| 5:00 AM to 5:29 AM | 98 (7.7%) | 64 (6.2%) |
| 5:30 AM to 5:59 AM | 12 (0.9%) | 0 (0.0%) |
| 6:00 AM to 6:29 AM | 0 (0.0%) | 12 (1.2%) |
| 6:30 AM to 6:59 AM | 17 (1.3%) | 12 (1.2%) |
| 7:00 AM to 7:29 AM | 23 (1.8%) | 21 (2.0%) |
| 7:30 AM to 7:59 AM | 182 (14.4%) | 113 (11.0%) |
| 8:00 AM to 8:29 AM | 145 (11.5%) | 241 (23.4%) |
| 8:30 AM to 8:59 AM | 206 (16.3%) | 152 (14.8%) |
| 9:00 AM to 9:59 AM | 162 (12.8%) | 225 (21.9%) |
| 10:00 AM to 10:59 AM | 84 (6.6%) | 59 (5.7%) |
| 11:00 AM to 11:59 AM | 76 (6.0%) | 11 (1.1%) |
| 12:00 PM to 3:59 PM | 61 (4.8%) | 63 (6.1%) |
| 4:00 PM to 11:59 PM | 137 (10.8%) | 48 (4.7%) |
| Total | 1,265 (100.0%) | 1,028 (100.0%) |
Housing Occupancy in Kusilvak Census Area
Occupancy by Ownership in Kusilvak Census Area
Of the total 1,864 dwellings in Kusilvak Census Area, owner-occupied units account for 1,322 (70.9%), while renter-occupied units make up 542 (29.1%).
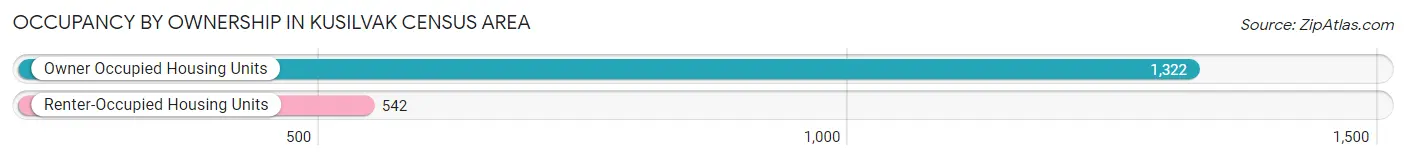
| Occupancy | # Housing Units | % Housing Units |
| Owner Occupied Housing Units | 1,322 | 70.9% |
| Renter-Occupied Housing Units | 542 | 29.1% |
| Total Occupied Housing Units | 1,864 | 100.0% |
Occupancy by Household Size in Kusilvak Census Area
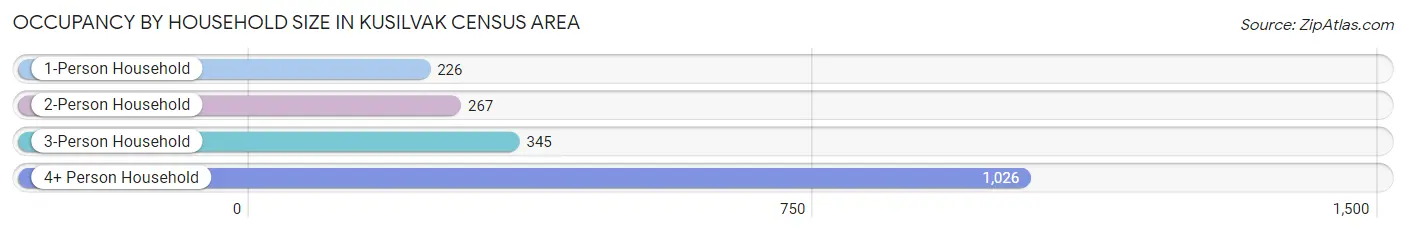
| Household Size | # Housing Units | % Housing Units |
| 1-Person Household | 226 | 12.1% |
| 2-Person Household | 267 | 14.3% |
| 3-Person Household | 345 | 18.5% |
| 4+ Person Household | 1,026 | 55.0% |
| Total Housing Units | 1,864 | 100.0% |
Occupancy by Ownership by Household Size in Kusilvak Census Area
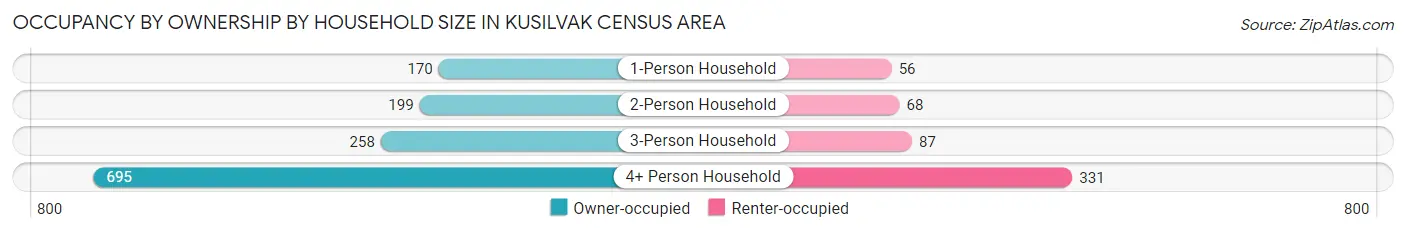
| Household Size | Owner-occupied | Renter-occupied |
| 1-Person Household | 170 (75.2%) | 56 (24.8%) |
| 2-Person Household | 199 (74.5%) | 68 (25.5%) |
| 3-Person Household | 258 (74.8%) | 87 (25.2%) |
| 4+ Person Household | 695 (67.7%) | 331 (32.3%) |
| Total Housing Units | 1,322 (70.9%) | 542 (29.1%) |
Occupancy by Educational Attainment in Kusilvak Census Area
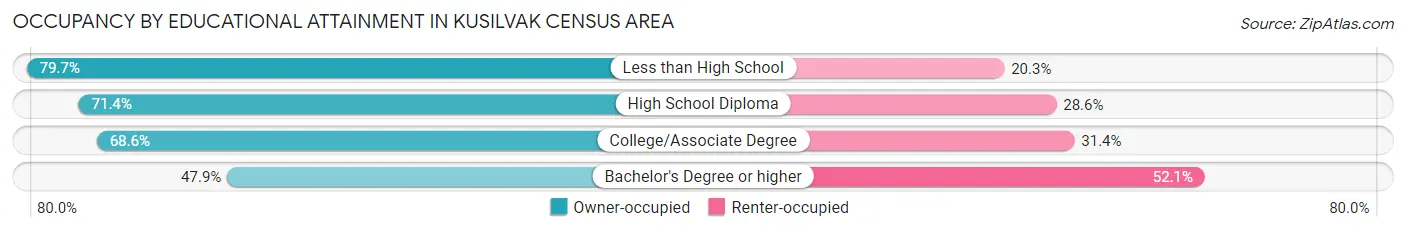
| Household Size | Owner-occupied | Renter-occupied |
| Less than High School | 259 (79.7%) | 66 (20.3%) |
| High School Diploma | 680 (71.4%) | 272 (28.6%) |
| College/Associate Degree | 338 (68.6%) | 155 (31.4%) |
| Bachelor's Degree or higher | 45 (47.9%) | 49 (52.1%) |
Occupancy by Age of Householder in Kusilvak Census Area
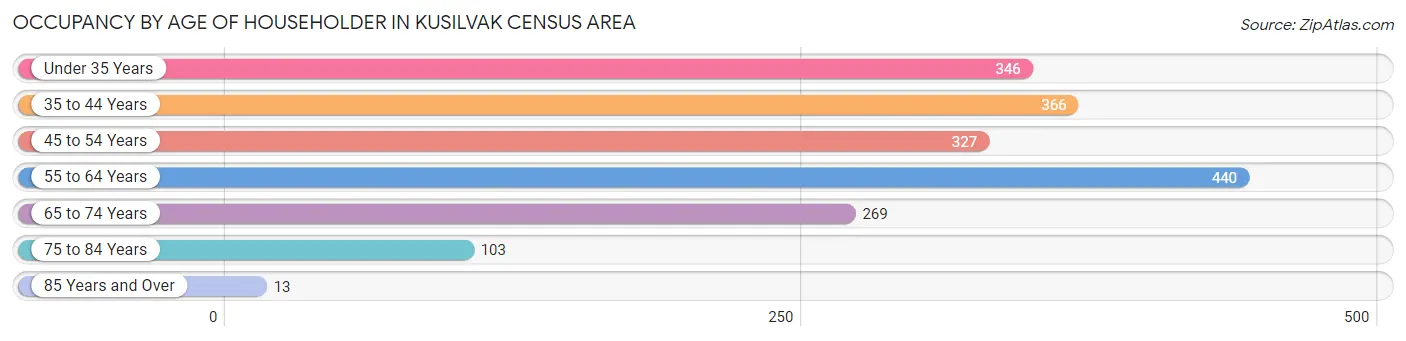
| Age Bracket | # Households | % Households |
| Under 35 Years | 346 | 18.6% |
| 35 to 44 Years | 366 | 19.6% |
| 45 to 54 Years | 327 | 17.5% |
| 55 to 64 Years | 440 | 23.6% |
| 65 to 74 Years | 269 | 14.4% |
| 75 to 84 Years | 103 | 5.5% |
| 85 Years and Over | 13 | 0.7% |
| Total | 1,864 | 100.0% |
Housing Finances in Kusilvak Census Area
Median Income by Occupancy in Kusilvak Census Area
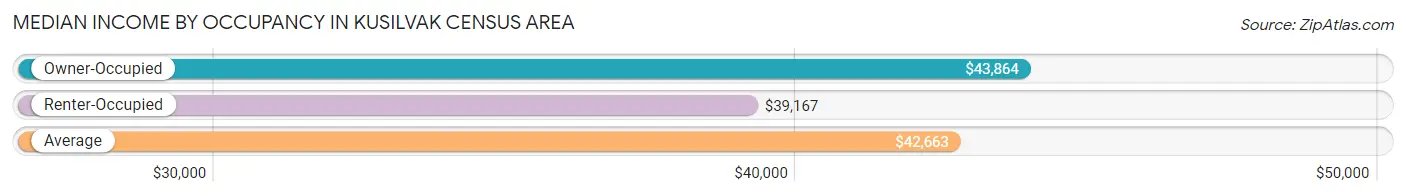
| Occupancy Type | # Households | Median Income |
| Owner-Occupied | 1,322 (70.9%) | $43,864 |
| Renter-Occupied | 542 (29.1%) | $39,167 |
| Average | 1,864 (100.0%) | $42,663 |
Occupancy by Householder Income Bracket in Kusilvak Census Area
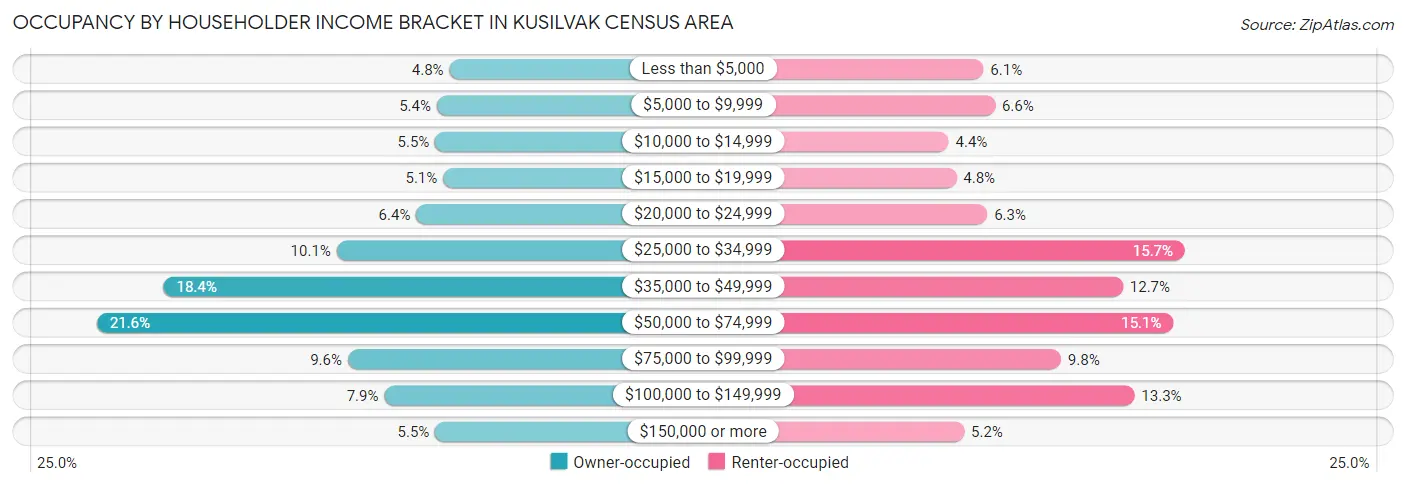
| Income Bracket | Owner-occupied | Renter-occupied |
| Less than $5,000 | 63 (4.8%) | 33 (6.1%) |
| $5,000 to $9,999 | 71 (5.4%) | 36 (6.6%) |
| $10,000 to $14,999 | 72 (5.4%) | 24 (4.4%) |
| $15,000 to $19,999 | 67 (5.1%) | 26 (4.8%) |
| $20,000 to $24,999 | 84 (6.4%) | 34 (6.3%) |
| $25,000 to $34,999 | 134 (10.1%) | 85 (15.7%) |
| $35,000 to $49,999 | 243 (18.4%) | 69 (12.7%) |
| $50,000 to $74,999 | 285 (21.6%) | 82 (15.1%) |
| $75,000 to $99,999 | 127 (9.6%) | 53 (9.8%) |
| $100,000 to $149,999 | 104 (7.9%) | 72 (13.3%) |
| $150,000 or more | 72 (5.4%) | 28 (5.2%) |
| Total | 1,322 (100.0%) | 542 (100.0%) |
Monthly Housing Cost Tiers in Kusilvak Census Area
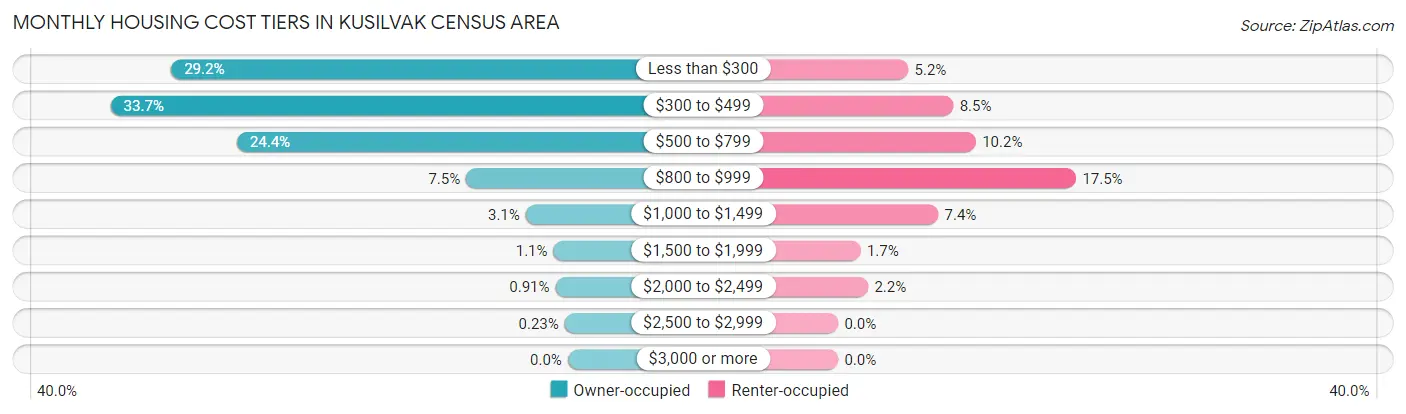
| Monthly Cost | Owner-occupied | Renter-occupied |
| Less than $300 | 386 (29.2%) | 28 (5.2%) |
| $300 to $499 | 445 (33.7%) | 46 (8.5%) |
| $500 to $799 | 322 (24.4%) | 55 (10.2%) |
| $800 to $999 | 99 (7.5%) | 95 (17.5%) |
| $1,000 to $1,499 | 41 (3.1%) | 40 (7.4%) |
| $1,500 to $1,999 | 14 (1.1%) | 9 (1.7%) |
| $2,000 to $2,499 | 12 (0.9%) | 12 (2.2%) |
| $2,500 to $2,999 | 3 (0.2%) | 0 (0.0%) |
| $3,000 or more | 0 (0.0%) | 0 (0.0%) |
| Total | 1,322 (100.0%) | 542 (100.0%) |
Physical Housing Characteristics in Kusilvak Census Area
Housing Structures in Kusilvak Census Area
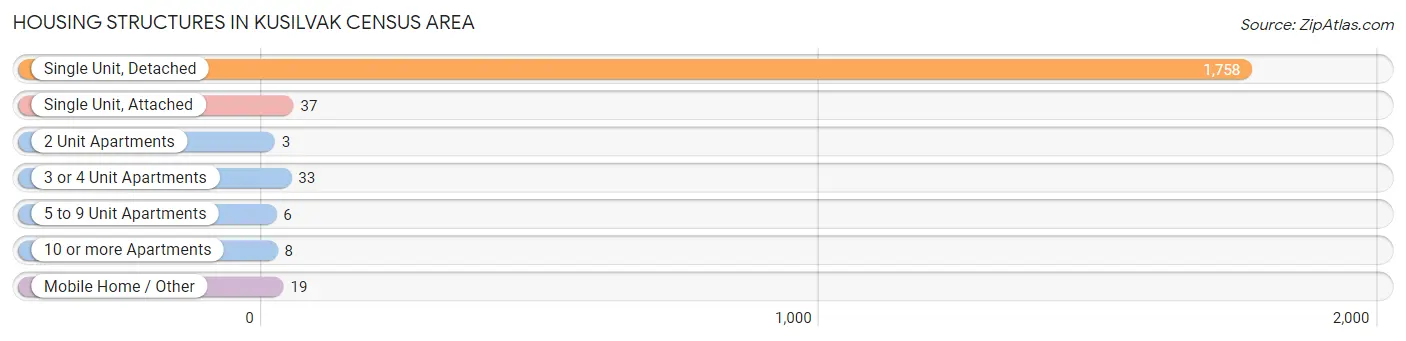
| Structure Type | # Housing Units | % Housing Units |
| Single Unit, Detached | 1,758 | 94.3% |
| Single Unit, Attached | 37 | 2.0% |
| 2 Unit Apartments | 3 | 0.2% |
| 3 or 4 Unit Apartments | 33 | 1.8% |
| 5 to 9 Unit Apartments | 6 | 0.3% |
| 10 or more Apartments | 8 | 0.4% |
| Mobile Home / Other | 19 | 1.0% |
| Total | 1,864 | 100.0% |
Housing Structures by Occupancy in Kusilvak Census Area
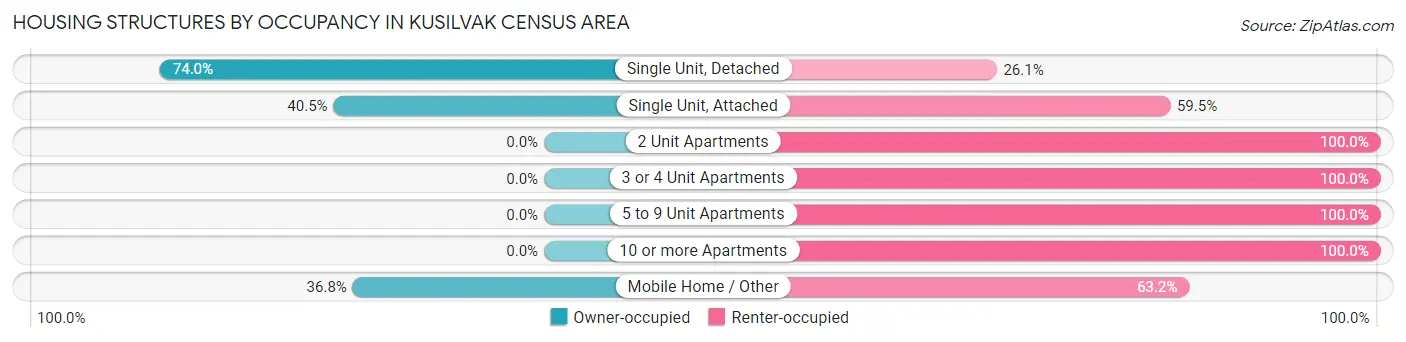
| Structure Type | Owner-occupied | Renter-occupied |
| Single Unit, Detached | 1,300 (74.0%) | 458 (26.1%) |
| Single Unit, Attached | 15 (40.5%) | 22 (59.5%) |
| 2 Unit Apartments | 0 (0.0%) | 3 (100.0%) |
| 3 or 4 Unit Apartments | 0 (0.0%) | 33 (100.0%) |
| 5 to 9 Unit Apartments | 0 (0.0%) | 6 (100.0%) |
| 10 or more Apartments | 0 (0.0%) | 8 (100.0%) |
| Mobile Home / Other | 7 (36.8%) | 12 (63.2%) |
| Total | 1,322 (70.9%) | 542 (29.1%) |
Housing Structures by Number of Rooms in Kusilvak Census Area
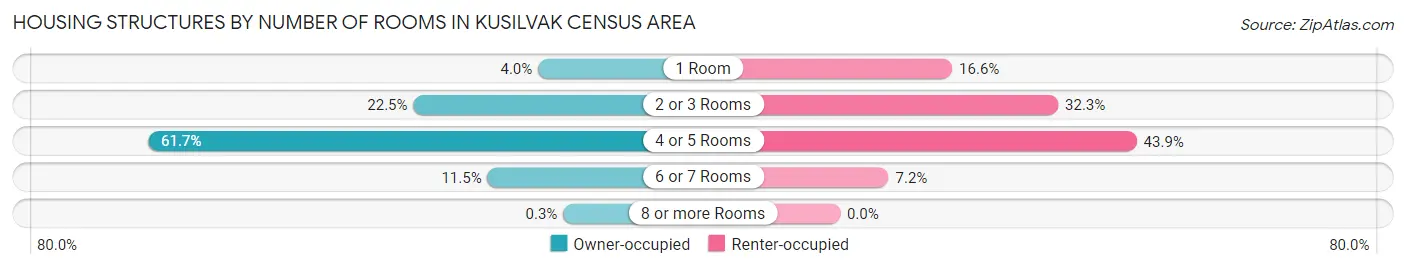
| Number of Rooms | Owner-occupied | Renter-occupied |
| 1 Room | 53 (4.0%) | 90 (16.6%) |
| 2 or 3 Rooms | 297 (22.5%) | 175 (32.3%) |
| 4 or 5 Rooms | 816 (61.7%) | 238 (43.9%) |
| 6 or 7 Rooms | 152 (11.5%) | 39 (7.2%) |
| 8 or more Rooms | 4 (0.3%) | 0 (0.0%) |
| Total | 1,322 (100.0%) | 542 (100.0%) |
Housing Structure by Heating Type in Kusilvak Census Area
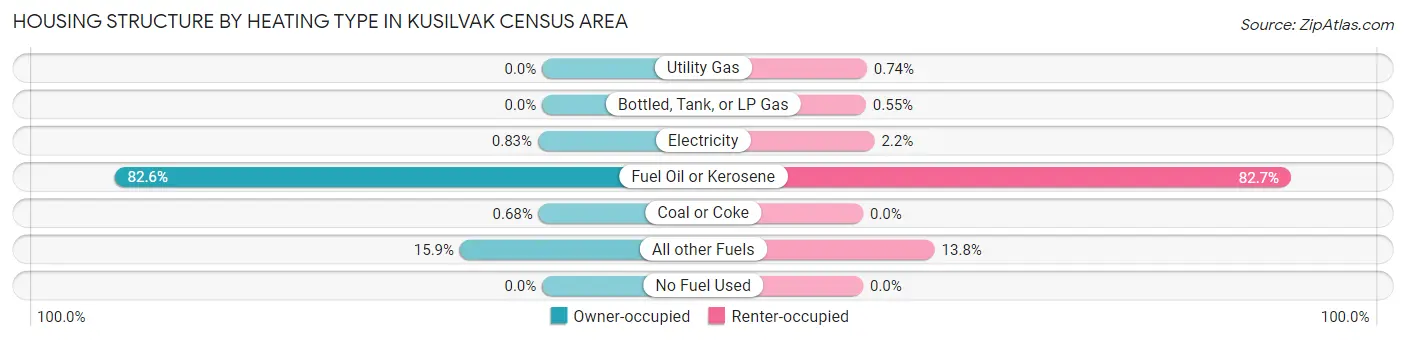
| Heating Type | Owner-occupied | Renter-occupied |
| Utility Gas | 0 (0.0%) | 4 (0.7%) |
| Bottled, Tank, or LP Gas | 0 (0.0%) | 3 (0.5%) |
| Electricity | 11 (0.8%) | 12 (2.2%) |
| Fuel Oil or Kerosene | 1,092 (82.6%) | 448 (82.7%) |
| Coal or Coke | 9 (0.7%) | 0 (0.0%) |
| All other Fuels | 210 (15.9%) | 75 (13.8%) |
| No Fuel Used | 0 (0.0%) | 0 (0.0%) |
| Total | 1,322 (100.0%) | 542 (100.0%) |
Household Vehicle Usage in Kusilvak Census Area
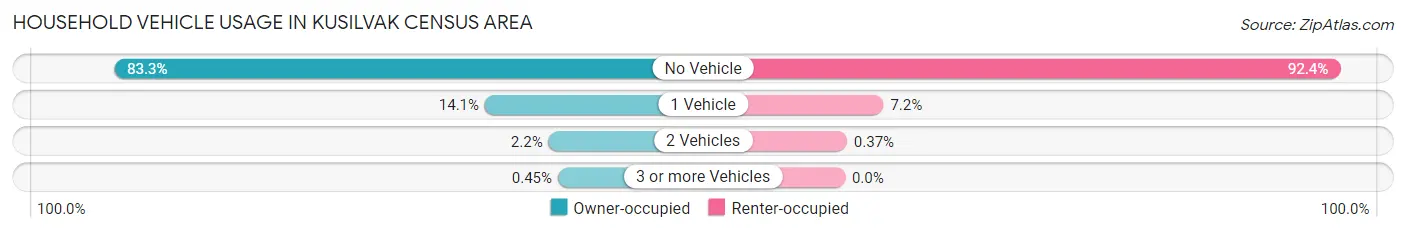
| Vehicles per Household | Owner-occupied | Renter-occupied |
| No Vehicle | 1,101 (83.3%) | 501 (92.4%) |
| 1 Vehicle | 186 (14.1%) | 39 (7.2%) |
| 2 Vehicles | 29 (2.2%) | 2 (0.4%) |
| 3 or more Vehicles | 6 (0.4%) | 0 (0.0%) |
| Total | 1,322 (100.0%) | 542 (100.0%) |
Real Estate & Mortgages in Kusilvak Census Area
Real Estate and Mortgage Overview in Kusilvak Census Area
| Characteristic | Without Mortgage | With Mortgage |
| Housing Units | 1,094 | 228 |
| Median Property Value | $73,000 | $173,500 |
| Median Household Income | $42,679 | $14 |
| Monthly Housing Costs | $384 | $0 |
| Real Estate Taxes | $199 | $218 |
Property Value by Mortgage Status in Kusilvak Census Area
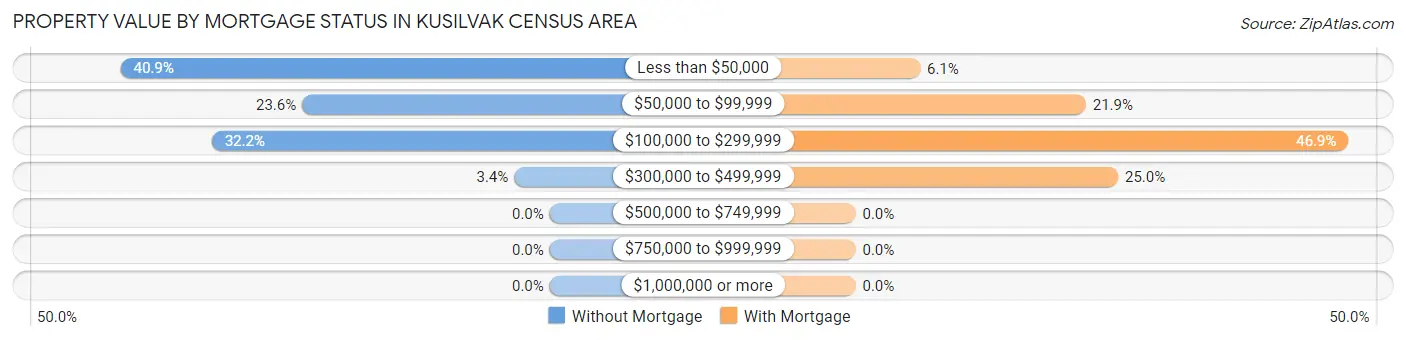
| Property Value | Without Mortgage | With Mortgage |
| Less than $50,000 | 447 (40.9%) | 14 (6.1%) |
| $50,000 to $99,999 | 258 (23.6%) | 50 (21.9%) |
| $100,000 to $299,999 | 352 (32.2%) | 107 (46.9%) |
| $300,000 to $499,999 | 37 (3.4%) | 57 (25.0%) |
| $500,000 to $749,999 | 0 (0.0%) | 0 (0.0%) |
| $750,000 to $999,999 | 0 (0.0%) | 0 (0.0%) |
| $1,000,000 or more | 0 (0.0%) | 0 (0.0%) |
| Total | 1,094 (100.0%) | 228 (100.0%) |
Household Income by Mortgage Status in Kusilvak Census Area
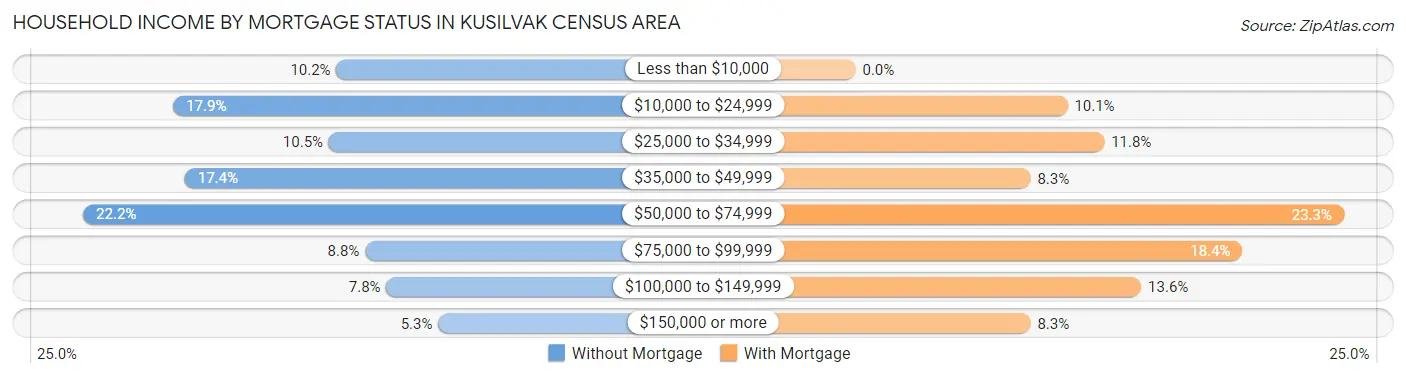
| Household Income | Without Mortgage | With Mortgage |
| Less than $10,000 | 111 (10.2%) | 0 (0.0%) |
| $10,000 to $24,999 | 196 (17.9%) | 23 (10.1%) |
| $25,000 to $34,999 | 115 (10.5%) | 27 (11.8%) |
| $35,000 to $49,999 | 190 (17.4%) | 19 (8.3%) |
| $50,000 to $74,999 | 243 (22.2%) | 53 (23.3%) |
| $75,000 to $99,999 | 96 (8.8%) | 42 (18.4%) |
| $100,000 to $149,999 | 85 (7.8%) | 31 (13.6%) |
| $150,000 or more | 58 (5.3%) | 19 (8.3%) |
| Total | 1,094 (100.0%) | 228 (100.0%) |
Property Value to Household Income Ratio in Kusilvak Census Area
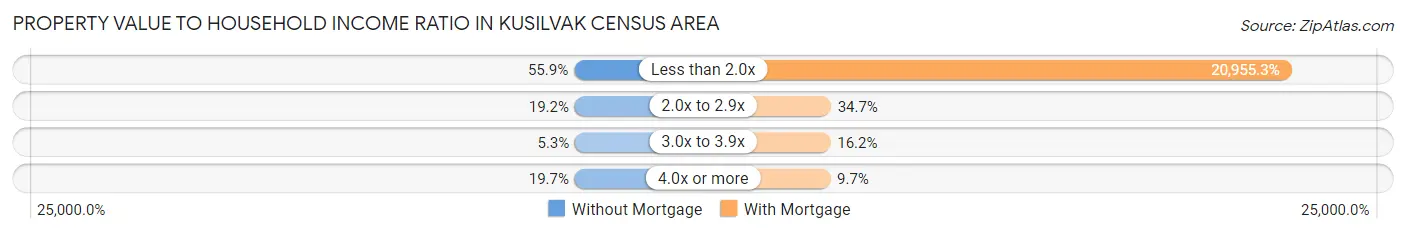
| Value-to-Income Ratio | Without Mortgage | With Mortgage |
| Less than 2.0x | 611 (55.8%) | 47,778 (20,955.3%) |
| 2.0x to 2.9x | 210 (19.2%) | 79 (34.6%) |
| 3.0x to 3.9x | 58 (5.3%) | 37 (16.2%) |
| 4.0x or more | 215 (19.7%) | 22 (9.7%) |
| Total | 1,094 (100.0%) | 228 (100.0%) |
Real Estate Taxes by Mortgage Status in Kusilvak Census Area
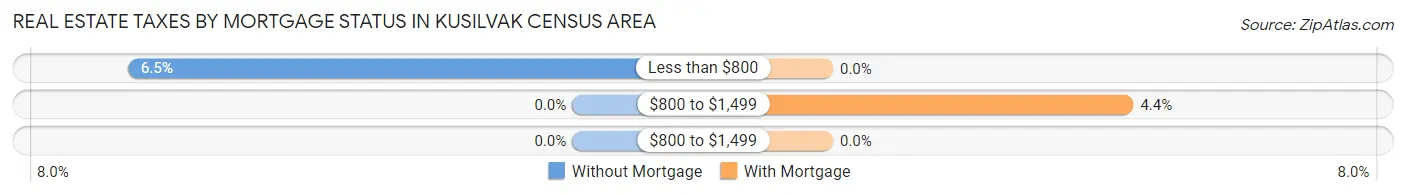
| Property Taxes | Without Mortgage | With Mortgage |
| Less than $800 | 71 (6.5%) | 0 (0.0%) |
| $800 to $1,499 | 0 (0.0%) | 10 (4.4%) |
| $800 to $1,499 | 0 (0.0%) | 0 (0.0%) |
| Total | 1,094 (100.0%) | 228 (100.0%) |
Health & Disability in Kusilvak Census Area
Health Insurance Coverage by Age in Kusilvak Census Area
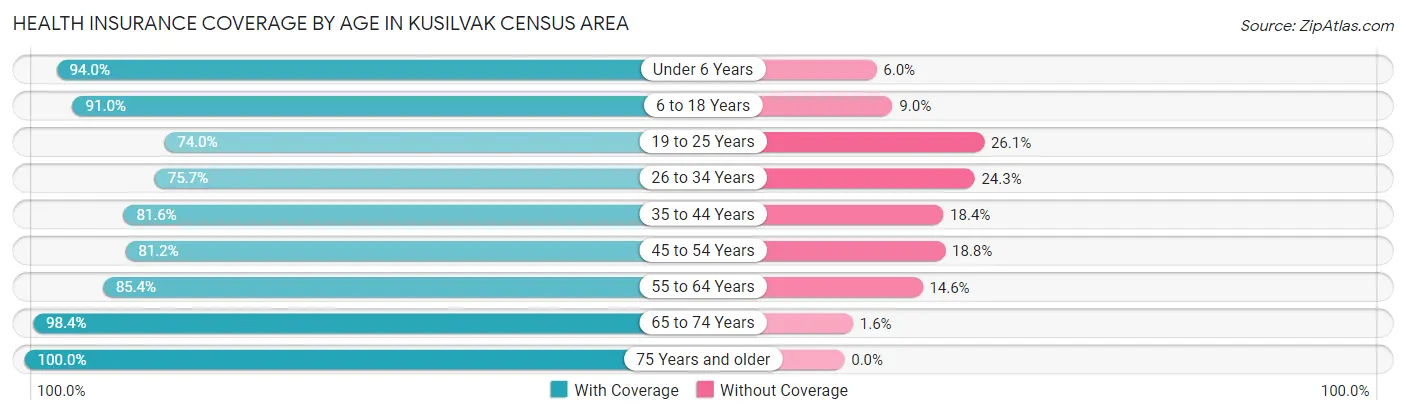
| Age Bracket | With Coverage | Without Coverage |
| Under 6 Years | 1,198 (94.0%) | 76 (6.0%) |
| 6 to 18 Years | 2,100 (91.0%) | 207 (9.0%) |
| 19 to 25 Years | 650 (74.0%) | 229 (26.1%) |
| 26 to 34 Years | 820 (75.7%) | 263 (24.3%) |
| 35 to 44 Years | 668 (81.6%) | 151 (18.4%) |
| 45 to 54 Years | 596 (81.2%) | 138 (18.8%) |
| 55 to 64 Years | 639 (85.4%) | 109 (14.6%) |
| 65 to 74 Years | 369 (98.4%) | 6 (1.6%) |
| 75 Years and older | 136 (100.0%) | 0 (0.0%) |
| Total | 7,176 (85.9%) | 1,179 (14.1%) |
Health Insurance Coverage by Citizenship Status in Kusilvak Census Area
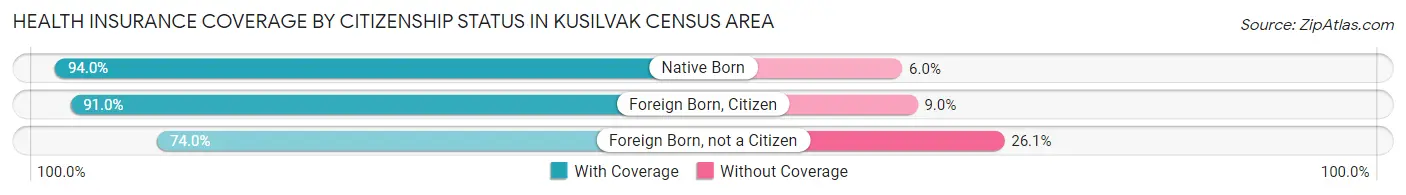
| Citizenship Status | With Coverage | Without Coverage |
| Native Born | 1,198 (94.0%) | 76 (6.0%) |
| Foreign Born, Citizen | 2,100 (91.0%) | 207 (9.0%) |
| Foreign Born, not a Citizen | 650 (74.0%) | 229 (26.1%) |
Health Insurance Coverage by Household Income in Kusilvak Census Area
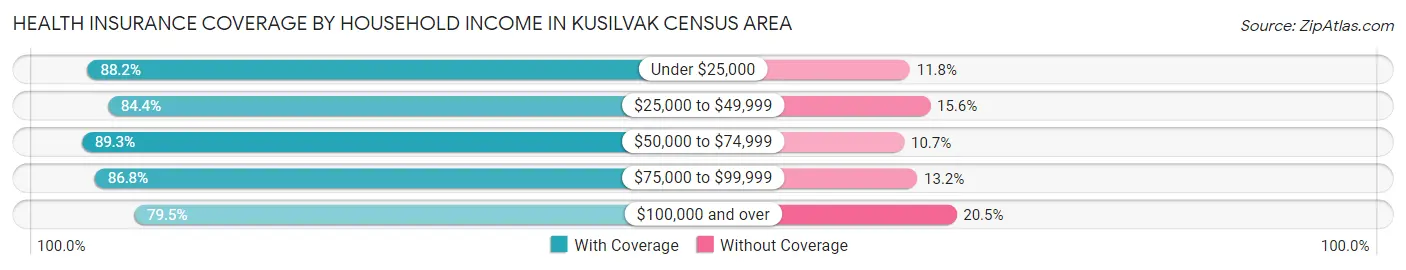
| Household Income | With Coverage | Without Coverage |
| Under $25,000 | 1,405 (88.2%) | 188 (11.8%) |
| $25,000 to $49,999 | 1,834 (84.4%) | 339 (15.6%) |
| $50,000 to $74,999 | 1,349 (89.3%) | 162 (10.7%) |
| $75,000 to $99,999 | 890 (86.8%) | 135 (13.2%) |
| $100,000 and over | 1,375 (79.5%) | 355 (20.5%) |
Public vs Private Health Insurance Coverage by Age in Kusilvak Census Area
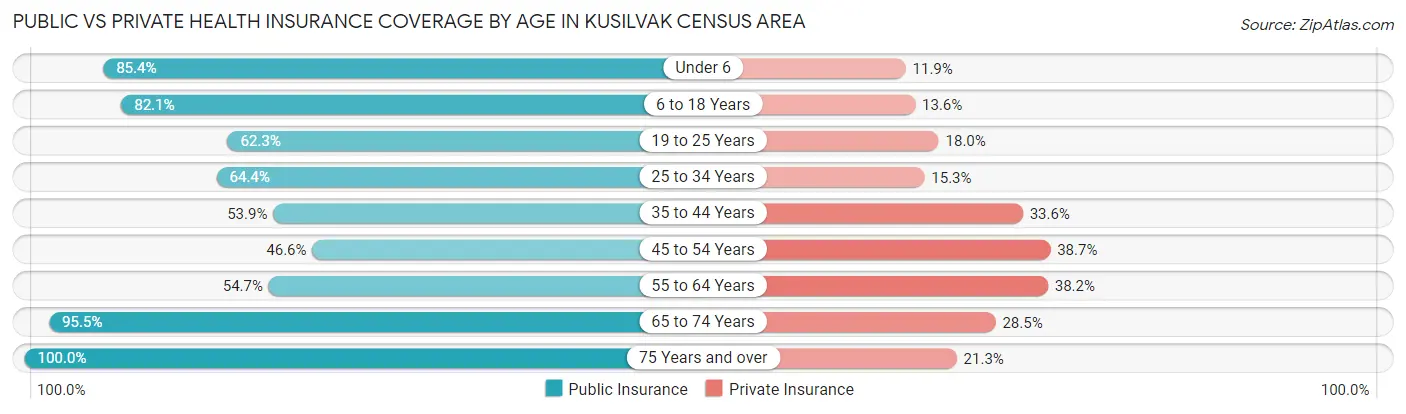
| Age Bracket | Public Insurance | Private Insurance |
| Under 6 | 1,088 (85.4%) | 151 (11.8%) |
| 6 to 18 Years | 1,893 (82.1%) | 314 (13.6%) |
| 19 to 25 Years | 548 (62.3%) | 158 (18.0%) |
| 25 to 34 Years | 697 (64.4%) | 166 (15.3%) |
| 35 to 44 Years | 441 (53.8%) | 275 (33.6%) |
| 45 to 54 Years | 342 (46.6%) | 284 (38.7%) |
| 55 to 64 Years | 409 (54.7%) | 286 (38.2%) |
| 65 to 74 Years | 358 (95.5%) | 107 (28.5%) |
| 75 Years and over | 136 (100.0%) | 29 (21.3%) |
| Total | 5,912 (70.8%) | 1,770 (21.2%) |
Disability Status by Sex by Age in Kusilvak Census Area
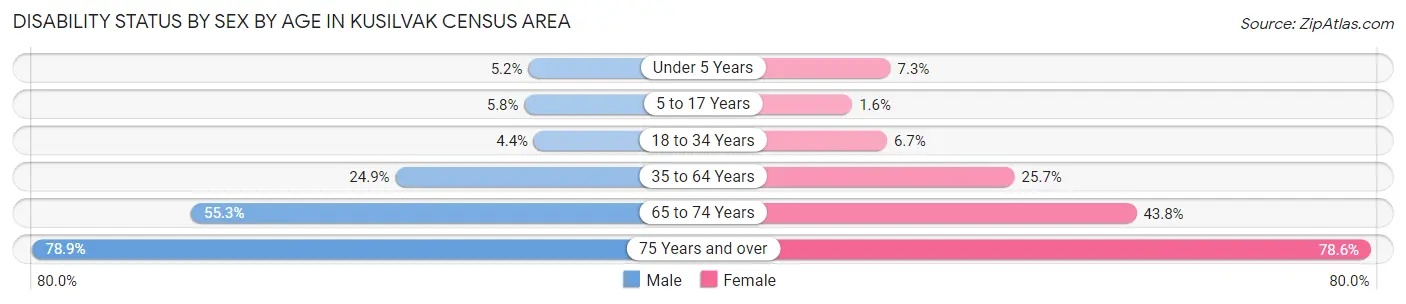
| Age Bracket | Male | Female |
| Under 5 Years | 30 (5.2%) | 37 (7.2%) |
| 5 to 17 Years | 73 (5.8%) | 17 (1.5%) |
| 18 to 34 Years | 50 (4.4%) | 64 (6.7%) |
| 35 to 64 Years | 332 (24.9%) | 249 (25.7%) |
| 65 to 74 Years | 110 (55.3%) | 77 (43.8%) |
| 75 Years and over | 41 (78.8%) | 66 (78.6%) |
Disability Class by Sex by Age in Kusilvak Census Area
Disability Class: Hearing Difficulty
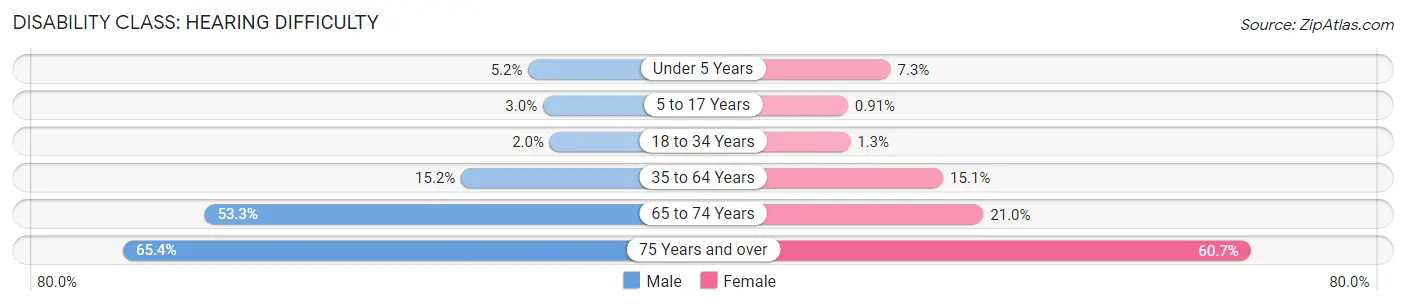
| Age Bracket | Male | Female |
| Under 5 Years | 30 (5.2%) | 37 (7.2%) |
| 5 to 17 Years | 38 (3.0%) | 10 (0.9%) |
| 18 to 34 Years | 23 (2.0%) | 12 (1.3%) |
| 35 to 64 Years | 202 (15.2%) | 146 (15.0%) |
| 65 to 74 Years | 106 (53.3%) | 37 (21.0%) |
| 75 Years and over | 34 (65.4%) | 51 (60.7%) |
Disability Class: Vision Difficulty
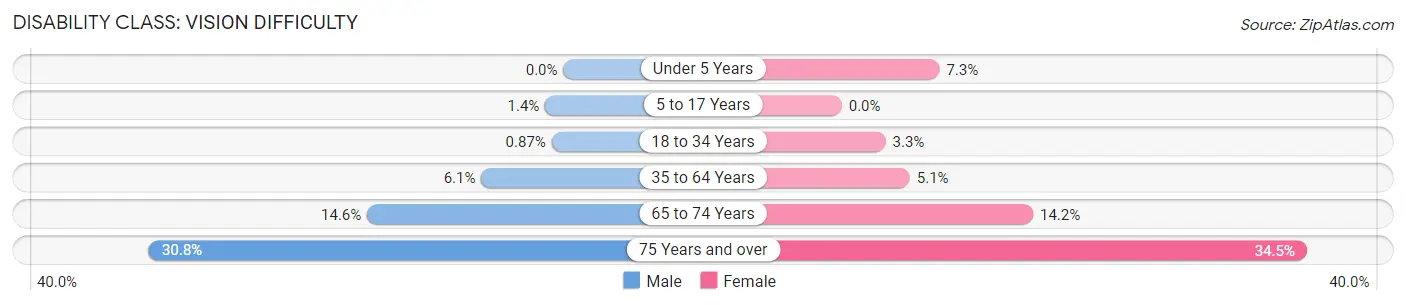
| Age Bracket | Male | Female |
| Under 5 Years | 0 (0.0%) | 37 (7.2%) |
| 5 to 17 Years | 17 (1.3%) | 0 (0.0%) |
| 18 to 34 Years | 10 (0.9%) | 31 (3.3%) |
| 35 to 64 Years | 81 (6.1%) | 49 (5.1%) |
| 65 to 74 Years | 29 (14.6%) | 25 (14.2%) |
| 75 Years and over | 16 (30.8%) | 29 (34.5%) |
Disability Class: Cognitive Difficulty
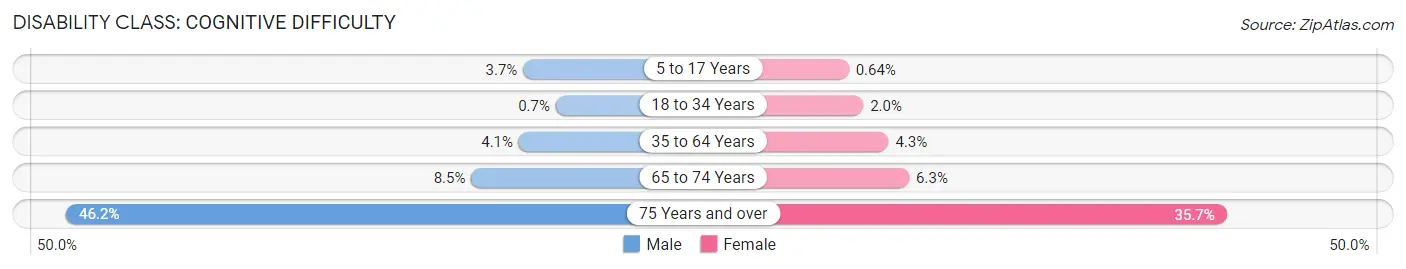
| Age Bracket | Male | Female |
| 5 to 17 Years | 47 (3.7%) | 7 (0.6%) |
| 18 to 34 Years | 8 (0.7%) | 19 (2.0%) |
| 35 to 64 Years | 55 (4.1%) | 42 (4.3%) |
| 65 to 74 Years | 17 (8.5%) | 11 (6.2%) |
| 75 Years and over | 24 (46.2%) | 30 (35.7%) |
Disability Class: Ambulatory Difficulty
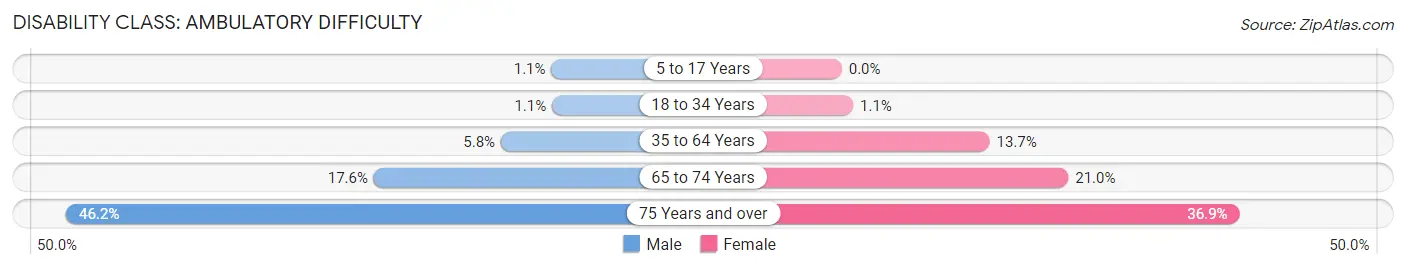
| Age Bracket | Male | Female |
| 5 to 17 Years | 14 (1.1%) | 0 (0.0%) |
| 18 to 34 Years | 12 (1.1%) | 10 (1.1%) |
| 35 to 64 Years | 77 (5.8%) | 133 (13.7%) |
| 65 to 74 Years | 35 (17.6%) | 37 (21.0%) |
| 75 Years and over | 24 (46.2%) | 31 (36.9%) |
Disability Class: Self-Care Difficulty
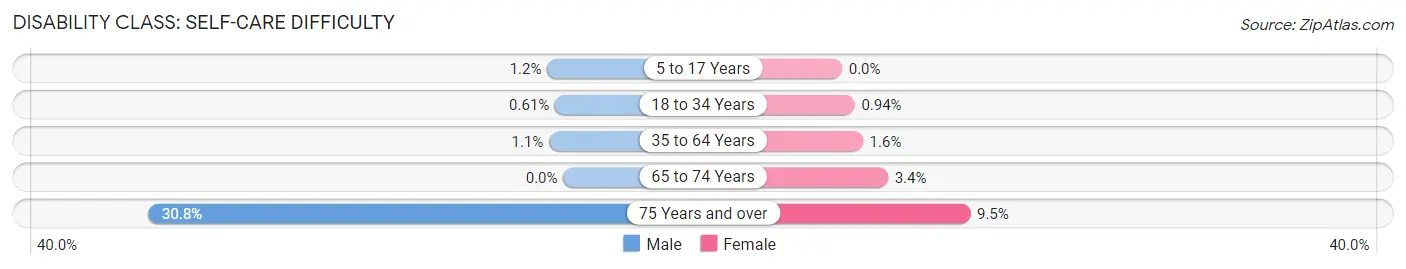
| Age Bracket | Male | Female |
| 5 to 17 Years | 15 (1.2%) | 0 (0.0%) |
| 18 to 34 Years | 7 (0.6%) | 9 (0.9%) |
| 35 to 64 Years | 14 (1.1%) | 15 (1.5%) |
| 65 to 74 Years | 0 (0.0%) | 6 (3.4%) |
| 75 Years and over | 16 (30.8%) | 8 (9.5%) |
Technology Access in Kusilvak Census Area
Computing Device Access in Kusilvak Census Area
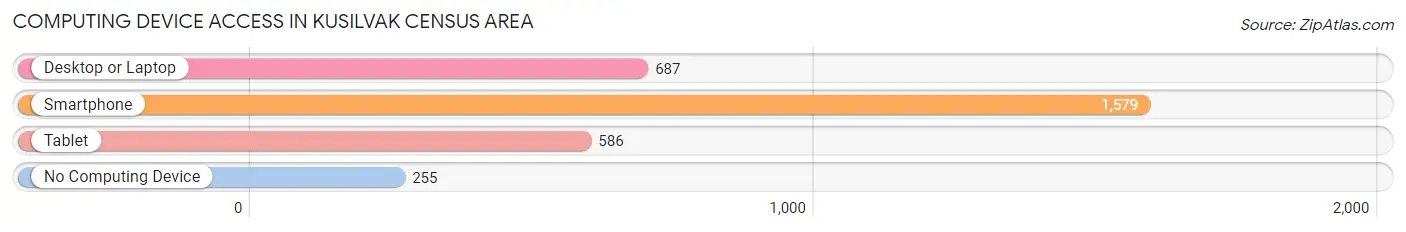
| Device Type | # Households | % Households |
| Desktop or Laptop | 687 | 36.9% |
| Smartphone | 1,579 | 84.7% |
| Tablet | 586 | 31.4% |
| No Computing Device | 255 | 13.7% |
| Total | 1,864 | 100.0% |
Internet Access in Kusilvak Census Area
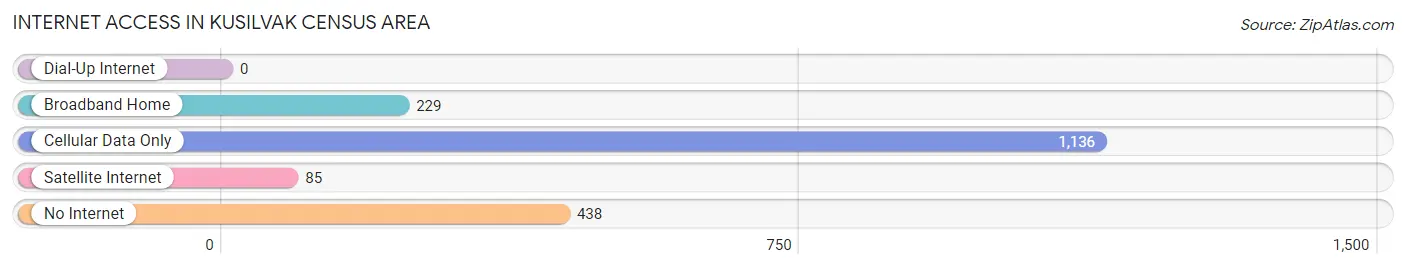
| Internet Type | # Households | % Households |
| Dial-Up Internet | 0 | 0.0% |
| Broadband Home | 229 | 12.3% |
| Cellular Data Only | 1,136 | 60.9% |
| Satellite Internet | 85 | 4.6% |
| No Internet | 438 | 23.5% |
| Total | 1,864 | 100.0% |
Kusilvak Census Area Summary
Kusilvak Census Area is a census area located in the U.S. state of Alaska. It is part of the Unorganized Borough and is located in the western part of the state. The census area is named after the Kusilvak River, which flows through the area. As of the 2010 census, the population was 7,459.
Geography
Kusilvak Census Area is located in western Alaska, bordered by the Yukon-Kuskokwim Delta to the west, the Bering Sea to the north, the Nome Census Area to the east, and the Bethel Census Area to the south. The census area covers an area of 24,711 square miles (63,945 km2), making it the largest county-equivalent in the United States. The terrain is mostly flat, with some hills and mountains in the northern and eastern parts of the area. The climate is subarctic, with long, cold winters and short, cool summers.
History
The area now known as Kusilvak Census Area has been inhabited by the Yup'ik people for thousands of years. The area was first explored by Europeans in the late 18th century, when Russian fur traders arrived in the area. The area was later explored by American whalers and traders in the 19th century. In 1884, the area was incorporated into the Alaska Territory.
In the early 20th century, the area was home to several gold mining operations. The area was also home to several military bases during World War II. In 1959, Alaska became a state, and the area was organized into the Kusilvak Census Area.
Economy
The economy of Kusilvak Census Area is largely based on subsistence activities, such as fishing, hunting, and gathering. The area is also home to several small-scale commercial fishing operations. The area is also home to several small businesses, such as stores, restaurants, and lodges.
Demographics
As of the 2010 census, there were 7,459 people, 2,717 households, and 1,945 families living in the census area. The population density was 0.3 people per square mile (0.1/km2). The racial makeup of the area was 66.3% Native American, 28.2% White, 0.3% Asian, 0.2% Black or African American, 0.1% Pacific Islander, and 4.9% from other races.
The median income for a household in the area was $30,938, and the median income for a family was $35,938. The per capita income for the area was $14,938. About 24.3% of families and 28.2% of the population were below the poverty line, including 36.2% of those under age 18 and 16.2% of those age 65 or over.
The area is home to several Native American tribes, including the Yup'ik, Inupiat, and Aleut. The area is also home to several non-Native American communities, including the towns of Bethel, Hooper Bay, and Nunam Iqua.
Common Questions
What is the Total Population of Kusilvak Census Area?
Total Population of Kusilvak Census Area is 8,372.
What is the Total Male Population of Kusilvak Census Area?
Total Male Population of Kusilvak Census Area is 4,576.
What is the Total Female Population of Kusilvak Census Area?
Total Female Population of Kusilvak Census Area is 3,796.
What is the Ratio of Males per 100 Females in Kusilvak Census Area?
There are 120.55 Males per 100 Females in Kusilvak Census Area.
What is the Ratio of Females per 100 Males in Kusilvak Census Area?
There are 82.95 Females per 100 Males in Kusilvak Census Area.
What is the Median Population Age in Kusilvak Census Area?
Median Population Age in Kusilvak Census Area is 23.7 Years.
What is the Average Family Size in Kusilvak Census Area
Average Family Size in Kusilvak Census Area is 4.6 People.
What is the Average Household Size in Kusilvak Census Area
Average Household Size in Kusilvak Census Area is 4.3 People.
What is Per Capita Income in Kusilvak Census Area?
Per Capita income in Kusilvak Census Area is $17,166.
What is the Median Family Income in Kusilvak Census Area?
Median Family Income in Kusilvak Census Area is $43,882.
What is the Median Household income in Kusilvak Census Area?
Median Household Income in Kusilvak Census Area is $42,663.
What is Income or Wage Gap in Kusilvak Census Area?
Income or Wage Gap in Kusilvak Census Area is 7.3%.
Women in Kusilvak Census Area earn 92.7 cents for every dollar earned by a man.
What is Family Income Deficit in Kusilvak Census Area?
Family Income Deficit in Kusilvak Census Area is $14,029.
Families that are below poverty line in Kusilvak Census Area earn $14,029 less on average than the poverty threshold level.
What is Inequality or Gini Index in Kusilvak Census Area?
Inequality or Gini Index in Kusilvak Census Area is 0.45.
How Large is the Labor Force in Kusilvak Census Area?
There are 3,112 People in the Labor Forcein in Kusilvak Census Area.
What is the Percentage of People in the Labor Force in Kusilvak Census Area?
59.8% of People are in the Labor Force in Kusilvak Census Area.
What is the Unemployment Rate in Kusilvak Census Area?
Unemployment Rate in Kusilvak Census Area is 20.9%.