Kodiak Island Borough, AK
Kodiak Island Borough Map
Kodiak Island Borough Overview
13,065
TOTAL POPULATION
6,991
MALE POPULATION
6,074
FEMALE POPULATION
115.10
MALES / 100 FEMALES
86.88
FEMALES / 100 MALES
35.1
MEDIAN AGE
3.4
AVG FAMILY SIZE
2.9
AVG HOUSEHOLD SIZE
$39,563
PER CAPITA INCOME
$104,276
AVG FAMILY INCOME
$91,138
AVG HOUSEHOLD INCOME
5.7%
WAGE / INCOME GAP [ % ]
94.3¢/ $1
WAGE / INCOME GAP [ $ ]
0.40
INEQUALITY / GINI INDEX
7,468
LABOR FORCE [ PEOPLE ]
73.5%
PERCENT IN LABOR FORCE
5.7%
UNEMPLOYMENT RATE
Kodiak Island Borough Area Codes
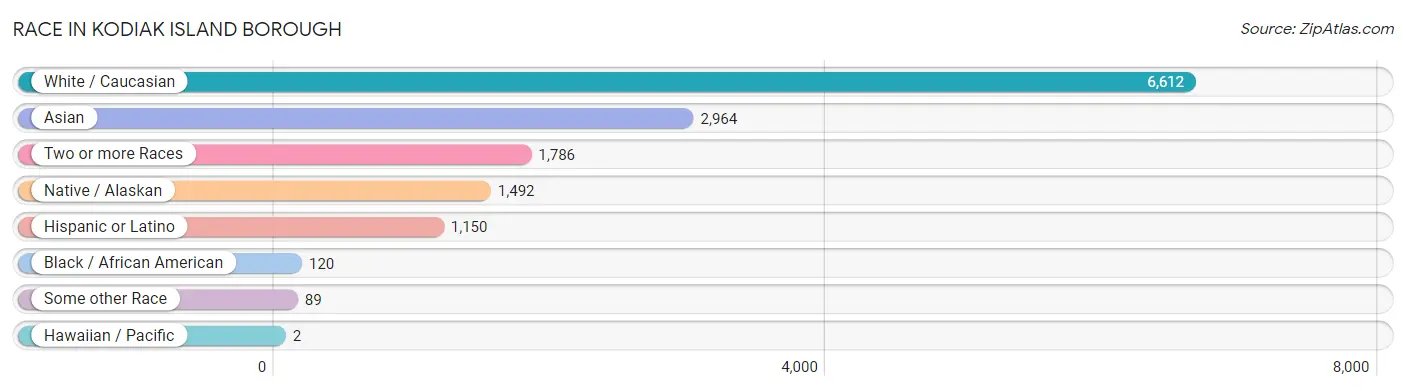
Race in Kodiak Island Borough
The most populous races in Kodiak Island Borough are White / Caucasian (6,612 | 50.6%), Asian (2,964 | 22.7%), and Two or more Races (1,786 | 13.7%).
| Race | # Population | % Population |
| Asian | 2,964 | 22.7% |
| Black / African American | 120 | 0.9% |
| Hawaiian / Pacific | 2 | 0.0% |
| Hispanic or Latino | 1,150 | 8.8% |
| Native / Alaskan | 1,492 | 11.4% |
| White / Caucasian | 6,612 | 50.6% |
| Two or more Races | 1,786 | 13.7% |
| Some other Race | 89 | 0.7% |
| Total | 13,065 | 100.0% |
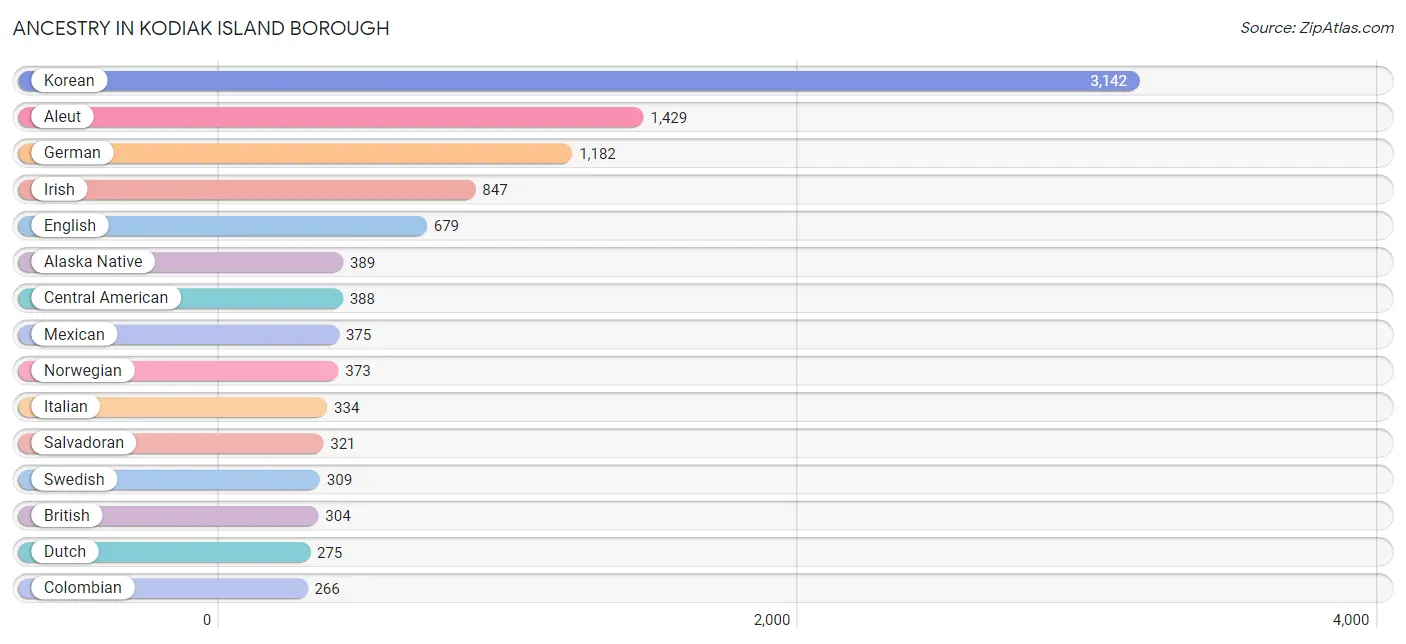
Ancestry in Kodiak Island Borough
The most populous ancestries reported in Kodiak Island Borough are Korean (3,142 | 24.0%), Aleut (1,429 | 10.9%), German (1,182 | 9.0%), Irish (847 | 6.5%), and English (679 | 5.2%), together accounting for 55.7% of all Kodiak Island Borough residents.
| Ancestry | # Population | % Population |
| African | 1 | 0.0% |
| Alaska Native | 389 | 3.0% |
| Alaskan Athabascan | 44 | 0.3% |
| Aleut | 1,429 | 10.9% |
| American | 253 | 1.9% |
| Austrian | 40 | 0.3% |
| Basque | 3 | 0.0% |
| Belizean | 7 | 0.1% |
| Bhutanese | 92 | 0.7% |
| British | 304 | 2.3% |
| British West Indian | 16 | 0.1% |
| Burmese | 28 | 0.2% |
| Canadian | 81 | 0.6% |
| Central American | 388 | 3.0% |
| Cherokee | 1 | 0.0% |
| Chippewa | 14 | 0.1% |
| Colombian | 266 | 2.0% |
| Croatian | 1 | 0.0% |
| Crow | 62 | 0.5% |
| Czech | 2 | 0.0% |
| Danish | 157 | 1.2% |
| Dominican | 34 | 0.3% |
| Dutch | 275 | 2.1% |
| Eastern European | 5 | 0.0% |
| English | 679 | 5.2% |
| European | 178 | 1.4% |
| Finnish | 50 | 0.4% |
| French | 130 | 1.0% |
| French Canadian | 27 | 0.2% |
| German | 1,182 | 9.0% |
| Greek | 43 | 0.3% |
| Guatemalan | 67 | 0.5% |
| Hungarian | 14 | 0.1% |
| Indian (Asian) | 14 | 0.1% |
| Inupiat | 7 | 0.1% |
| Irish | 847 | 6.5% |
| Italian | 334 | 2.6% |
| Jamaican | 1 | 0.0% |
| Korean | 3,142 | 24.0% |
| Lithuanian | 20 | 0.2% |
| Malaysian | 14 | 0.1% |
| Mexican | 375 | 2.9% |
| Mexican American Indian | 3 | 0.0% |
| Native Hawaiian | 199 | 1.5% |
| Navajo | 12 | 0.1% |
| Nigerian | 3 | 0.0% |
| Northern European | 23 | 0.2% |
| Norwegian | 373 | 2.9% |
| Pakistani | 8 | 0.1% |
| Polish | 215 | 1.7% |
| Portuguese | 33 | 0.3% |
| Potawatomi | 1 | 0.0% |
| Pueblo | 6 | 0.1% |
| Puerto Rican | 38 | 0.3% |
| Russian | 112 | 0.9% |
| Salvadoran | 321 | 2.5% |
| Samoan | 3 | 0.0% |
| Scandinavian | 67 | 0.5% |
| Scotch-Irish | 113 | 0.9% |
| Scottish | 134 | 1.0% |
| Slavic | 5 | 0.0% |
| South American | 266 | 2.0% |
| Spaniard | 48 | 0.4% |
| Sri Lankan | 20 | 0.2% |
| Subsaharan African | 4 | 0.0% |
| Swedish | 309 | 2.4% |
| Swiss | 9 | 0.1% |
| Tlingit-Haida | 67 | 0.5% |
| Ukrainian | 26 | 0.2% |
| Welsh | 74 | 0.6% |
| Yugoslavian | 17 | 0.1% |
| Yup'ik | 43 | 0.3% | View All 72 Rows |
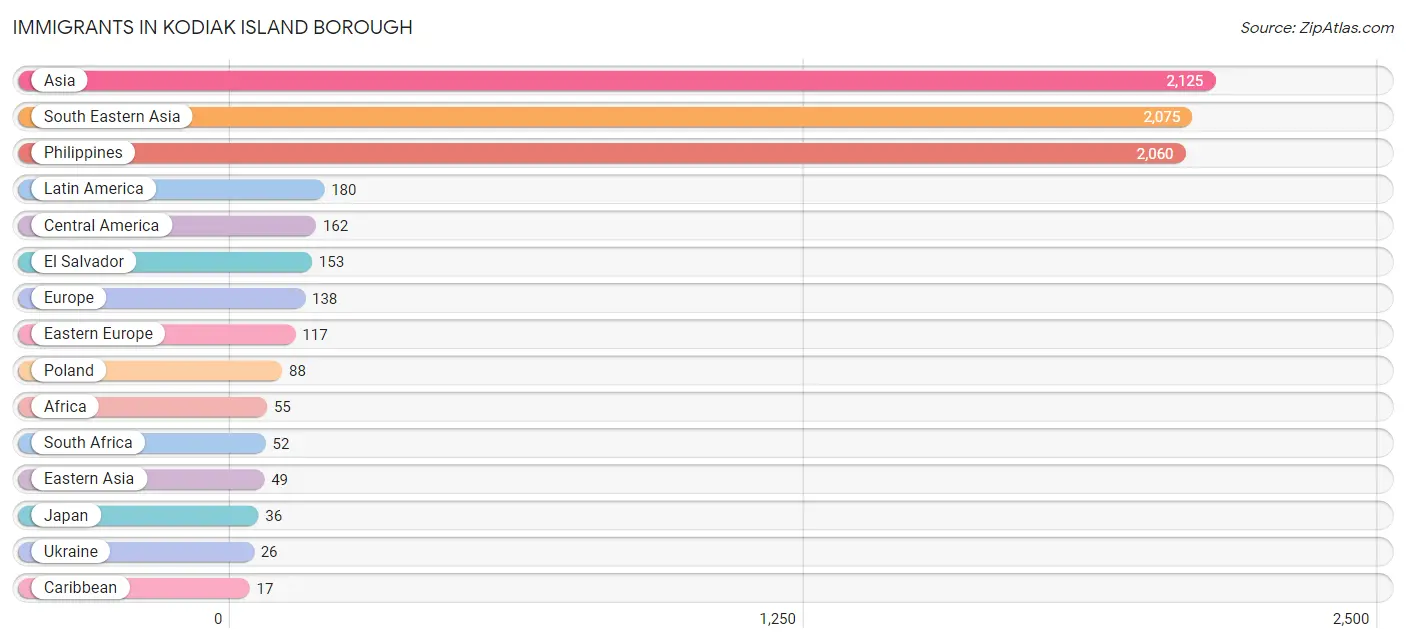
Immigrants in Kodiak Island Borough
The most numerous immigrant groups reported in Kodiak Island Borough came from Asia (2,125 | 16.3%), South Eastern Asia (2,075 | 15.9%), Philippines (2,060 | 15.8%), Latin America (180 | 1.4%), and Central America (162 | 1.2%), together accounting for 50.5% of all Kodiak Island Borough residents.
| Immigration Origin | # Population | % Population |
| Africa | 55 | 0.4% |
| Armenia | 1 | 0.0% |
| Asia | 2,125 | 16.3% |
| Belize | 7 | 0.1% |
| Canada | 14 | 0.1% |
| Caribbean | 17 | 0.1% |
| Central America | 162 | 1.2% |
| Colombia | 1 | 0.0% |
| Dominican Republic | 16 | 0.1% |
| Eastern Asia | 49 | 0.4% |
| Eastern Europe | 117 | 0.9% |
| El Salvador | 153 | 1.2% |
| Europe | 138 | 1.1% |
| Germany | 12 | 0.1% |
| Ireland | 9 | 0.1% |
| Jamaica | 1 | 0.0% |
| Japan | 36 | 0.3% |
| Korea | 13 | 0.1% |
| Latin America | 180 | 1.4% |
| Lithuania | 3 | 0.0% |
| Mexico | 2 | 0.0% |
| Nigeria | 3 | 0.0% |
| Northern Europe | 9 | 0.1% |
| Oceania | 13 | 0.1% |
| Philippines | 2,060 | 15.8% |
| Poland | 88 | 0.7% |
| South Africa | 52 | 0.4% |
| South America | 1 | 0.0% |
| South Eastern Asia | 2,075 | 15.9% |
| Ukraine | 26 | 0.2% |
| Vietnam | 15 | 0.1% |
| Western Africa | 3 | 0.0% |
| Western Asia | 1 | 0.0% |
| Western Europe | 12 | 0.1% | View All 34 Rows |
Sex and Age in Kodiak Island Borough
Sex and Age in Kodiak Island Borough
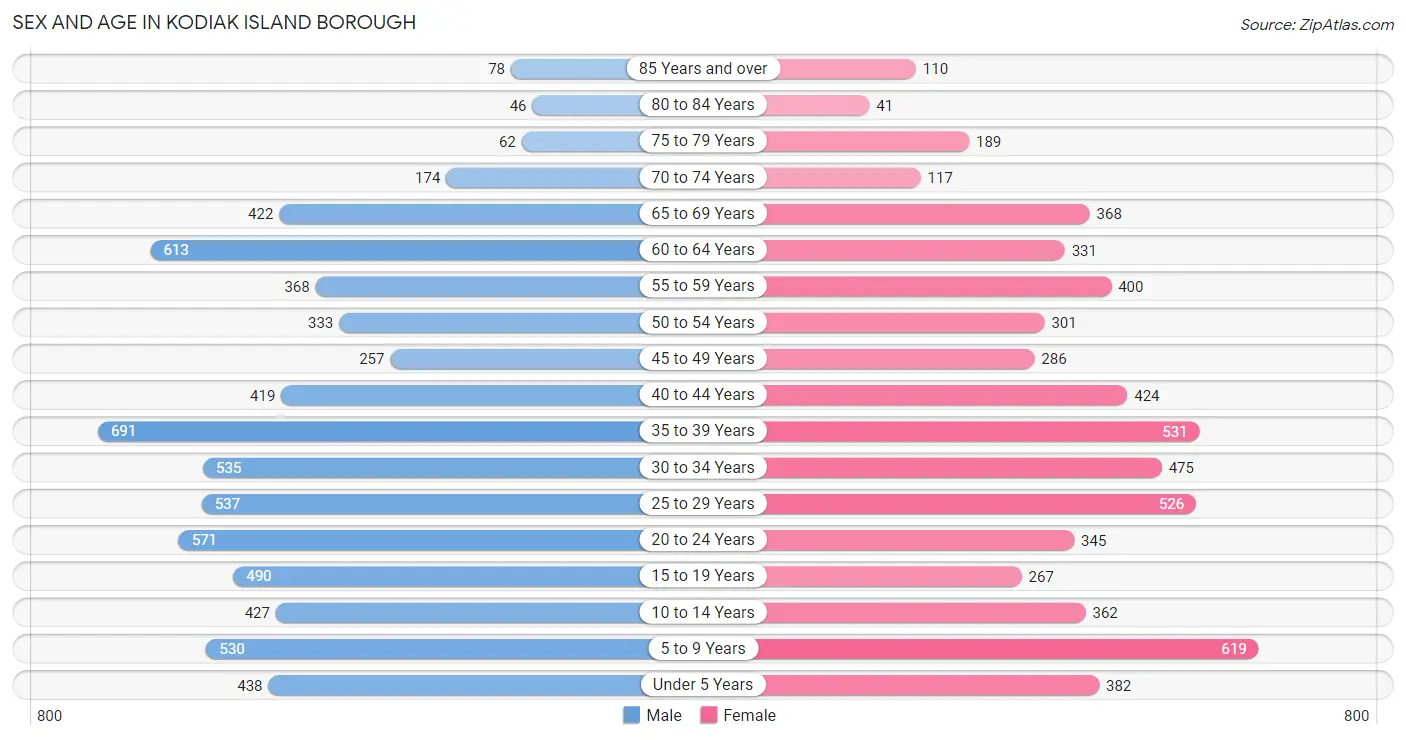
The most populous age groups in Kodiak Island Borough are 35 to 39 Years (691 | 9.9%) for men and 5 to 9 Years (619 | 10.2%) for women.
| Age Bracket | Male | Female |
| Under 5 Years | 438 (6.3%) | 382 (6.3%) |
| 5 to 9 Years | 530 (7.6%) | 619 (10.2%) |
| 10 to 14 Years | 427 (6.1%) | 362 (6.0%) |
| 15 to 19 Years | 490 (7.0%) | 267 (4.4%) |
| 20 to 24 Years | 571 (8.2%) | 345 (5.7%) |
| 25 to 29 Years | 537 (7.7%) | 526 (8.7%) |
| 30 to 34 Years | 535 (7.6%) | 475 (7.8%) |
| 35 to 39 Years | 691 (9.9%) | 531 (8.7%) |
| 40 to 44 Years | 419 (6.0%) | 424 (7.0%) |
| 45 to 49 Years | 257 (3.7%) | 286 (4.7%) |
| 50 to 54 Years | 333 (4.8%) | 301 (5.0%) |
| 55 to 59 Years | 368 (5.3%) | 400 (6.6%) |
| 60 to 64 Years | 613 (8.8%) | 331 (5.4%) |
| 65 to 69 Years | 422 (6.0%) | 368 (6.1%) |
| 70 to 74 Years | 174 (2.5%) | 117 (1.9%) |
| 75 to 79 Years | 62 (0.9%) | 189 (3.1%) |
| 80 to 84 Years | 46 (0.7%) | 41 (0.7%) |
| 85 Years and over | 78 (1.1%) | 110 (1.8%) |
| Total | 6,991 (100.0%) | 6,074 (100.0%) |
Families and Households in Kodiak Island Borough
Median Family Size in Kodiak Island Borough
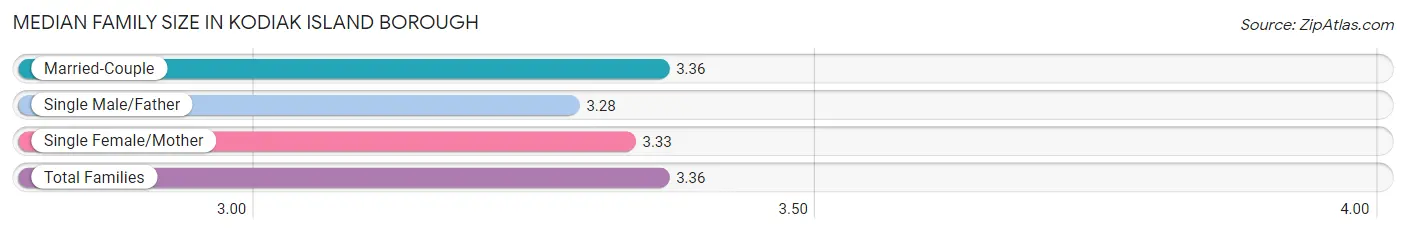
The median family size in Kodiak Island Borough is 3.36 persons per family, with married-couple families (2,658 | 83.0%) accounting for the largest median family size of 3.36 persons per family. On the other hand, single male/father families (43 | 1.3%) represent the smallest median family size with 3.28 persons per family.
| Family Type | # Families | Family Size |
| Married-Couple | 2,658 (83.0%) | 3.36 |
| Single Male/Father | 43 (1.3%) | 3.28 |
| Single Female/Mother | 503 (15.7%) | 3.33 |
| Total Families | 3,204 (100.0%) | 3.36 |
Median Household Size in Kodiak Island Borough
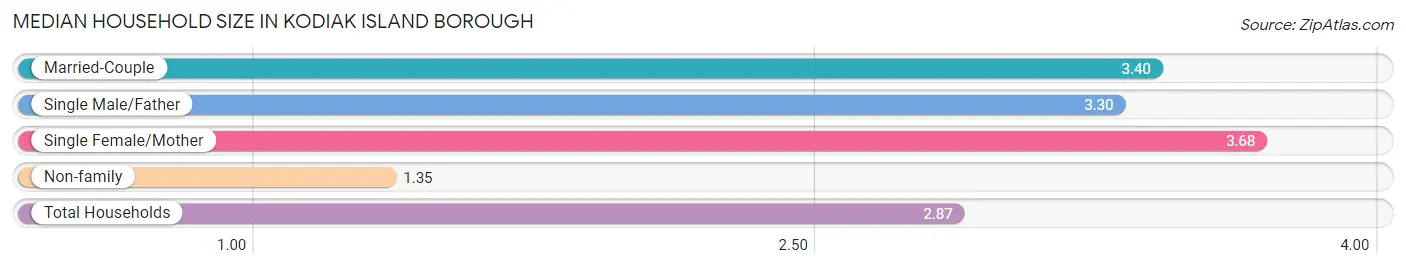
The median household size in Kodiak Island Borough is 2.87 persons per household, with single female/mother households (503 | 11.4%) accounting for the largest median household size of 3.68 persons per household. non-family households (1,211 | 27.4%) represent the smallest median household size with 1.35 persons per household.
| Household Type | # Households | Household Size |
| Married-Couple | 2,658 (60.2%) | 3.40 |
| Single Male/Father | 43 (1.0%) | 3.30 |
| Single Female/Mother | 503 (11.4%) | 3.68 |
| Non-family | 1,211 (27.4%) | 1.35 |
| Total Households | 4,415 (100.0%) | 2.87 |
Household Size by Marriage Status in Kodiak Island Borough
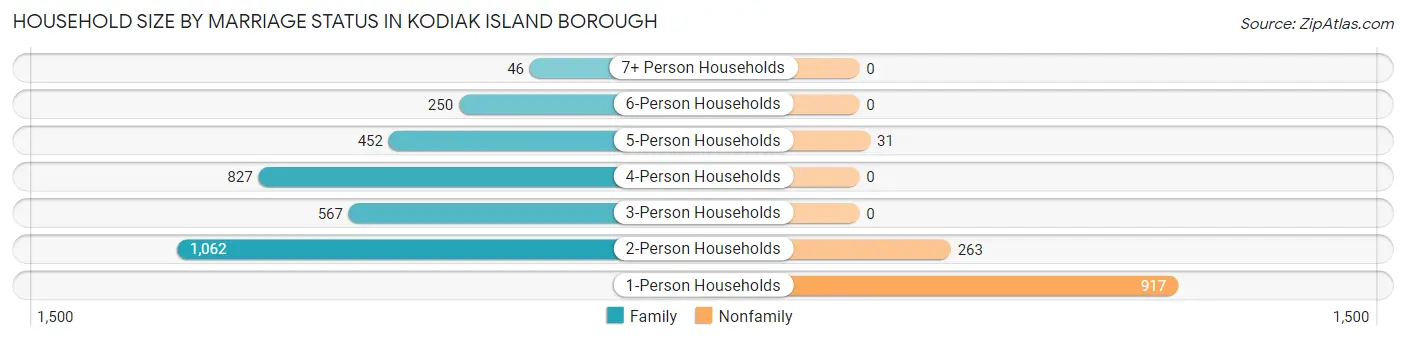
Out of a total of 4,415 households in Kodiak Island Borough, 3,204 (72.6%) are family households, while 1,211 (27.4%) are nonfamily households. The most numerous type of family households are 2-person households, comprising 1,062, and the most common type of nonfamily households are 1-person households, comprising 917.
| Household Size | Family Households | Nonfamily Households |
| 1-Person Households | - | 917 (20.8%) |
| 2-Person Households | 1,062 (24.0%) | 263 (6.0%) |
| 3-Person Households | 567 (12.8%) | 0 (0.0%) |
| 4-Person Households | 827 (18.7%) | 0 (0.0%) |
| 5-Person Households | 452 (10.2%) | 31 (0.7%) |
| 6-Person Households | 250 (5.7%) | 0 (0.0%) |
| 7+ Person Households | 46 (1.0%) | 0 (0.0%) |
| Total | 3,204 (72.6%) | 1,211 (27.4%) |
Female Fertility in Kodiak Island Borough
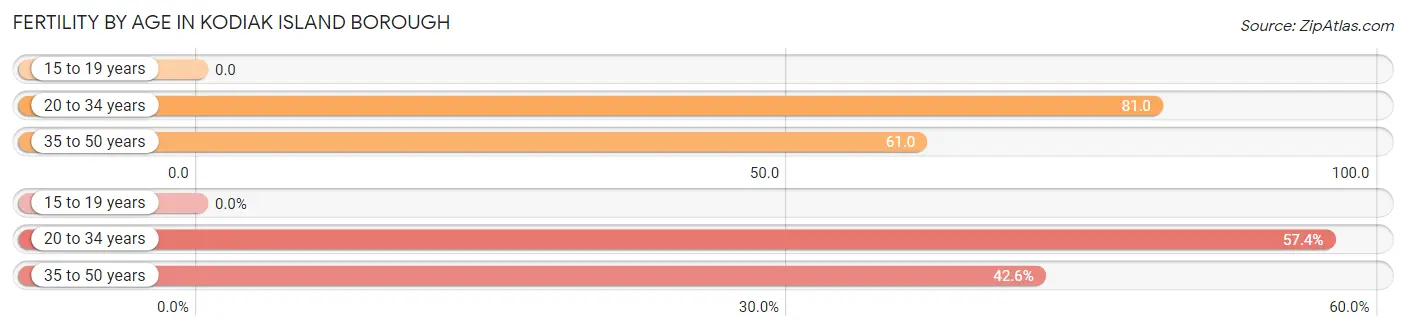
Fertility by Age in Kodiak Island Borough
Average fertility rate in Kodiak Island Borough is 65.0 births per 1,000 women. Women in the age bracket of 20 to 34 years have the highest fertility rate with 81.0 births per 1,000 women. Women in the age bracket of 20 to 34 years acount for 57.4% of all women with births.
| Age Bracket | Women with Births | Births / 1,000 Women |
| 15 to 19 years | 0 (0.0%) | 0.0 |
| 20 to 34 years | 109 (57.4%) | 81.0 |
| 35 to 50 years | 81 (42.6%) | 61.0 |
| Total | 190 (100.0%) | 65.0 |
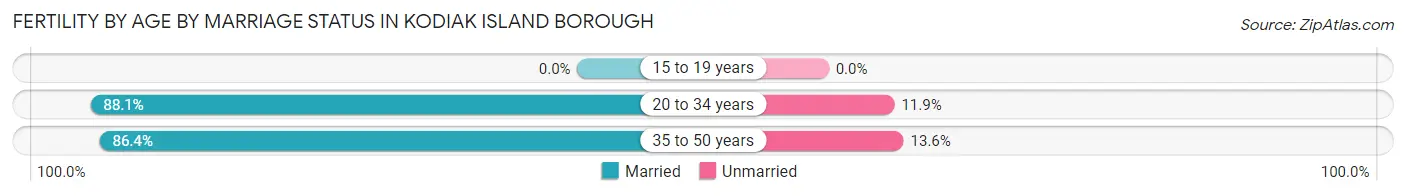
Fertility by Age by Marriage Status in Kodiak Island Borough
87.4% of women with births (190) in Kodiak Island Borough are married. The highest percentage of unmarried women with births falls into 35 to 50 years age bracket with 13.6% of them unmarried at the time of birth, while the lowest percentage of unmarried women with births belong to 20 to 34 years age bracket with 11.9% of them unmarried.
| Age Bracket | Married | Unmarried |
| 15 to 19 years | 0 (0.0%) | 0 (0.0%) |
| 20 to 34 years | 96 (88.1%) | 13 (11.9%) |
| 35 to 50 years | 70 (86.4%) | 11 (13.6%) |
| Total | 166 (87.4%) | 24 (12.6%) |
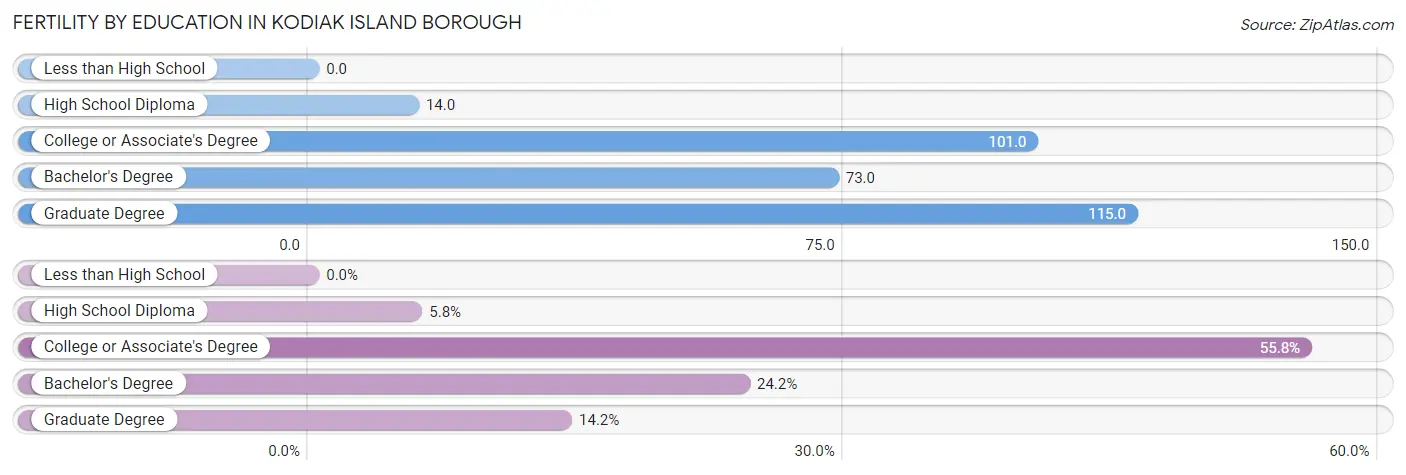
Fertility by Education in Kodiak Island Borough
| Educational Attainment | Women with Births | Births / 1,000 Women |
| Less than High School | 0 (0.0%) | 0.0 |
| High School Diploma | 11 (5.8%) | 14.0 |
| College or Associate's Degree | 106 (55.8%) | 101.0 |
| Bachelor's Degree | 46 (24.2%) | 73.0 |
| Graduate Degree | 27 (14.2%) | 115.0 |
| Total | 190 (100.0%) | 65.0 |
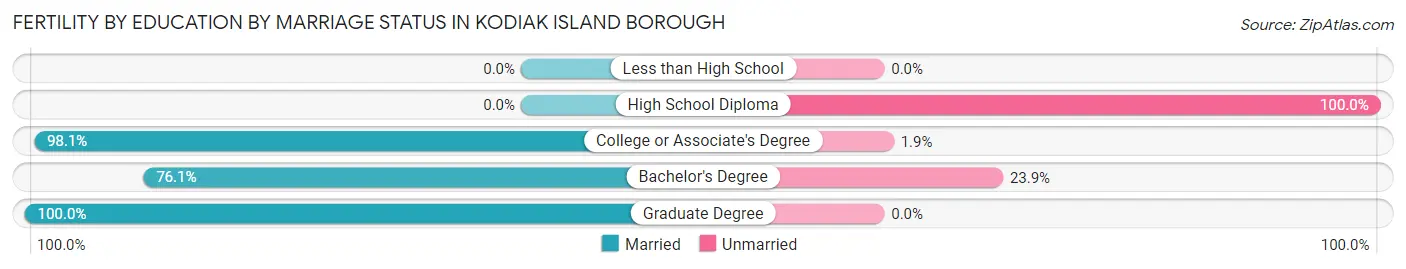
Fertility by Education by Marriage Status in Kodiak Island Borough
12.6% of women with births in Kodiak Island Borough are unmarried. Women with the educational attainment of graduate degree are most likely to be married with 100.0% of them married at childbirth, while women with the educational attainment of high school diploma are least likely to be married with 100.0% of them unmarried at childbirth.
| Educational Attainment | Married | Unmarried |
| Less than High School | 0 (0.0%) | 0 (0.0%) |
| High School Diploma | 0 (0.0%) | 11 (100.0%) |
| College or Associate's Degree | 104 (98.1%) | 2 (1.9%) |
| Bachelor's Degree | 35 (76.1%) | 11 (23.9%) |
| Graduate Degree | 27 (100.0%) | 0 (0.0%) |
| Total | 166 (87.4%) | 24 (12.6%) |
Income in Kodiak Island Borough
Income Overview in Kodiak Island Borough
Per Capita Income in Kodiak Island Borough is $39,563, while median incomes of families and households are $104,276 and $91,138 respectively.
| Characteristic | Number | Measure |
| Per Capita Income | 13,065 | $39,563 |
| Median Family Income | 3,204 | $104,276 |
| Mean Family Income | 3,204 | $113,186 |
| Median Household Income | 4,415 | $91,138 |
| Mean Household Income | 4,415 | $106,803 |
| Income Deficit | 3,204 | $0 |
| Wage / Income Gap (%) | 13,065 | 5.73% |
| Wage / Income Gap ($) | 13,065 | 94.27¢ per $1 |
| Gini / Inequality Index | 13,065 | 0.40 |
Earnings by Sex in Kodiak Island Borough
Average Earnings in Kodiak Island Borough are $37,674, $38,899 for men and $36,669 for women, a difference of 5.7%.
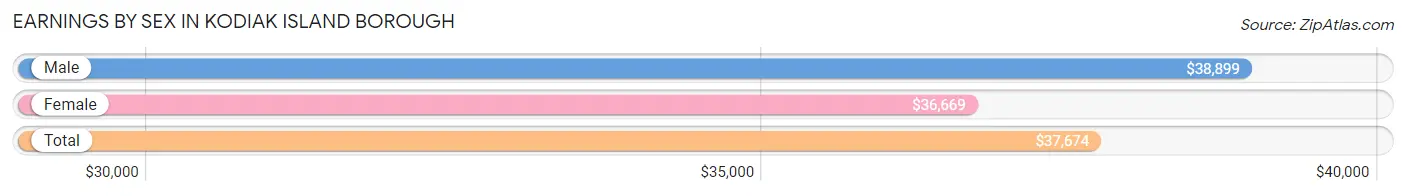
| Sex | Number | Average Earnings |
| Male | 4,540 (56.9%) | $38,899 |
| Female | 3,433 (43.1%) | $36,669 |
| Total | 7,973 (100.0%) | $37,674 |
Earnings by Sex by Income Bracket in Kodiak Island Borough
The most common earnings brackets in Kodiak Island Borough are $75,000 to $99,999 for men (704 | 15.5%) and $100,000+ for women (380 | 11.1%).
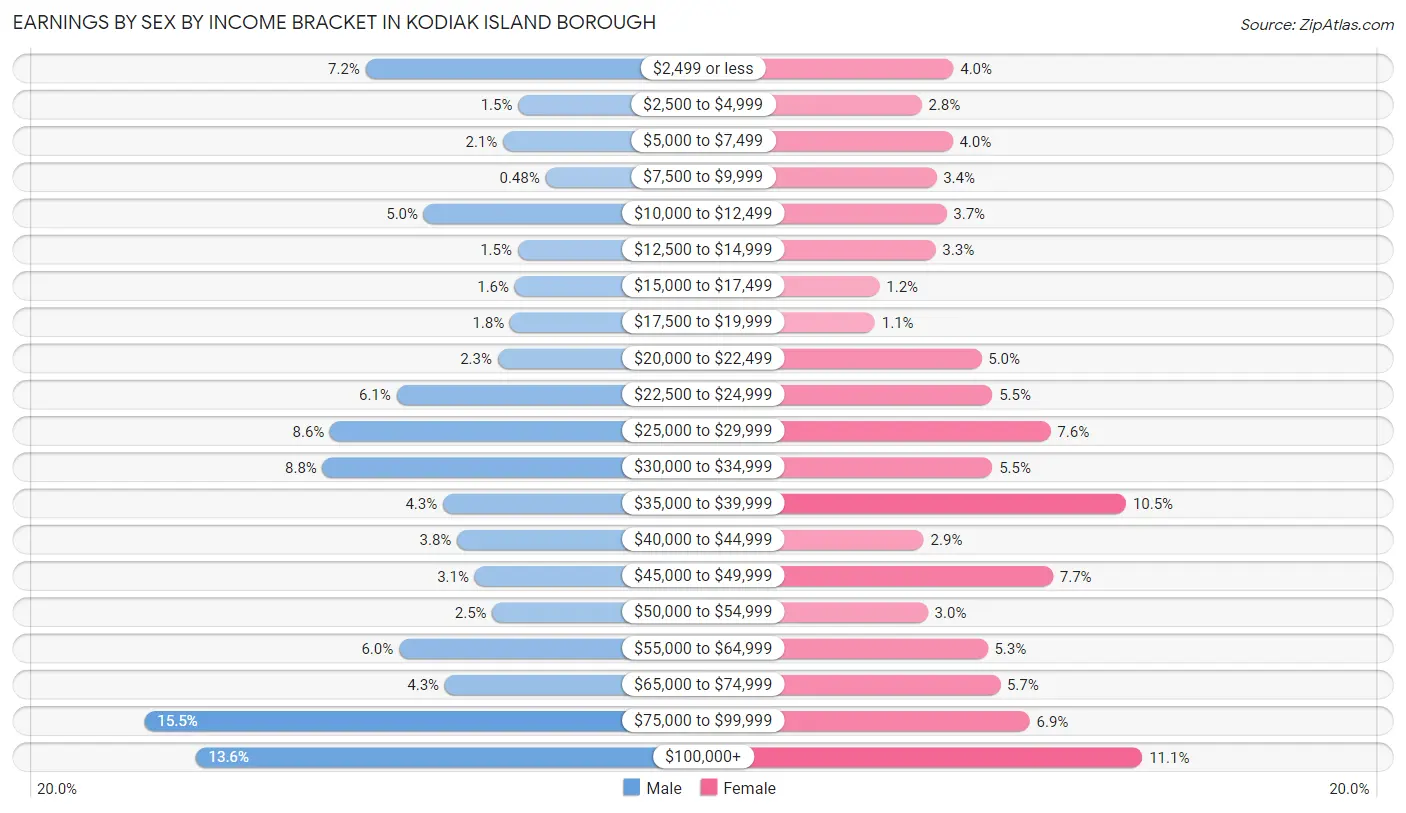
| Income | Male | Female |
| $2,499 or less | 328 (7.2%) | 137 (4.0%) |
| $2,500 to $4,999 | 68 (1.5%) | 96 (2.8%) |
| $5,000 to $7,499 | 94 (2.1%) | 136 (4.0%) |
| $7,500 to $9,999 | 22 (0.5%) | 115 (3.4%) |
| $10,000 to $12,499 | 229 (5.0%) | 128 (3.7%) |
| $12,500 to $14,999 | 69 (1.5%) | 114 (3.3%) |
| $15,000 to $17,499 | 74 (1.6%) | 42 (1.2%) |
| $17,500 to $19,999 | 82 (1.8%) | 36 (1.1%) |
| $20,000 to $22,499 | 103 (2.3%) | 173 (5.0%) |
| $22,500 to $24,999 | 275 (6.1%) | 187 (5.4%) |
| $25,000 to $29,999 | 388 (8.6%) | 262 (7.6%) |
| $30,000 to $34,999 | 401 (8.8%) | 187 (5.4%) |
| $35,000 to $39,999 | 196 (4.3%) | 359 (10.5%) |
| $40,000 to $44,999 | 172 (3.8%) | 99 (2.9%) |
| $45,000 to $49,999 | 142 (3.1%) | 265 (7.7%) |
| $50,000 to $54,999 | 112 (2.5%) | 104 (3.0%) |
| $55,000 to $64,999 | 271 (6.0%) | 181 (5.3%) |
| $65,000 to $74,999 | 193 (4.3%) | 197 (5.7%) |
| $75,000 to $99,999 | 704 (15.5%) | 235 (6.9%) |
| $100,000+ | 617 (13.6%) | 380 (11.1%) |
| Total | 4,540 (100.0%) | 3,433 (100.0%) |
Earnings by Sex by Educational Attainment in Kodiak Island Borough
Average earnings in Kodiak Island Borough are $46,813 for men and $38,311 for women, a difference of 18.2%. Men with an educational attainment of bachelor's degree enjoy the highest average annual earnings of $79,228, while those with less than high school education earn the least with $27,035. Women with an educational attainment of graduate degree earn the most with the average annual earnings of $103,778, while those with less than high school education have the smallest earnings of $26,354.
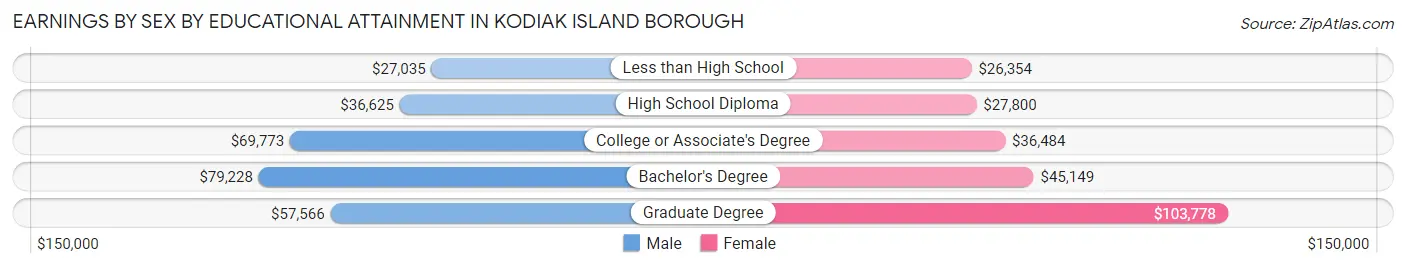
| Educational Attainment | Male Income | Female Income |
| Less than High School | $27,035 | $26,354 |
| High School Diploma | $36,625 | $27,800 |
| College or Associate's Degree | $69,773 | $36,484 |
| Bachelor's Degree | $79,228 | $45,149 |
| Graduate Degree | $57,566 | $103,778 |
| Total | $46,813 | $38,311 |
Family Income in Kodiak Island Borough
Family Income Brackets in Kodiak Island Borough
According to the Kodiak Island Borough family income data, there are 961 families falling into the $100,000 to $149,999 income range, which is the most common income bracket and makes up 30.0% of all families. Conversely, the $15,000 to $24,999 income bracket is the least frequent group with only 64 families (2.0%) belonging to this category.
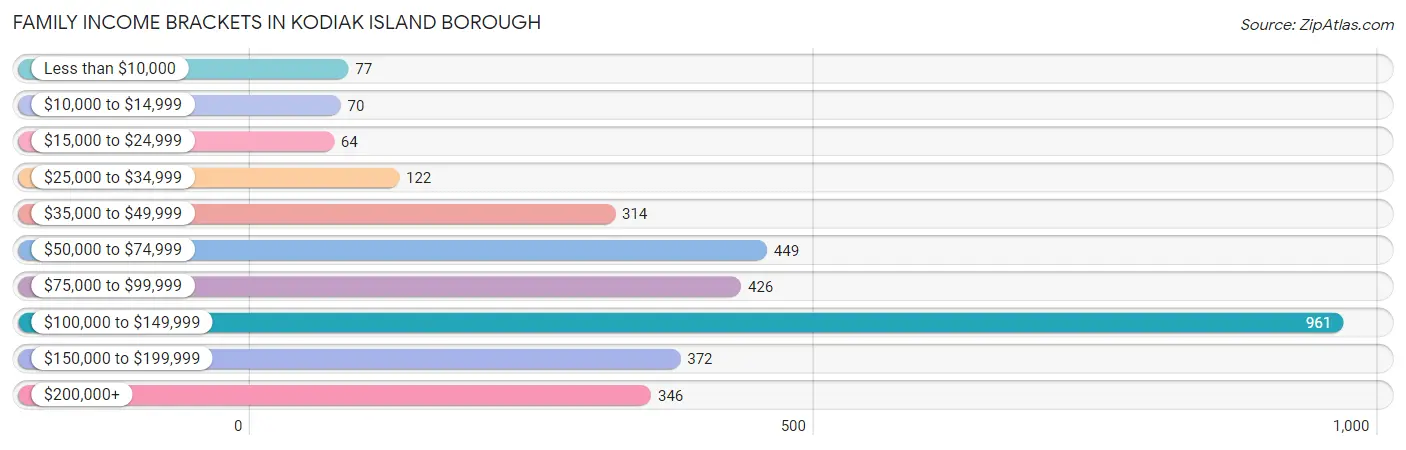
| Income Bracket | # Families | % Families |
| Less than $10,000 | 77 | 2.4% |
| $10,000 to $14,999 | 70 | 2.2% |
| $15,000 to $24,999 | 64 | 2.0% |
| $25,000 to $34,999 | 122 | 3.8% |
| $35,000 to $49,999 | 314 | 9.8% |
| $50,000 to $74,999 | 449 | 14.0% |
| $75,000 to $99,999 | 426 | 13.3% |
| $100,000 to $149,999 | 961 | 30.0% |
| $150,000 to $199,999 | 372 | 11.6% |
| $200,000+ | 346 | 10.8% |
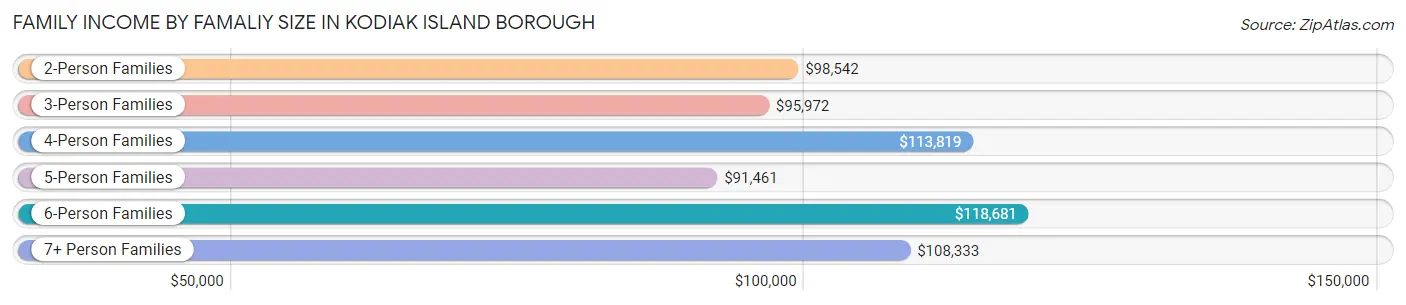
Family Income by Famaliy Size in Kodiak Island Borough
6-person families (176 | 5.5%) account for the highest median family income in Kodiak Island Borough with $118,681 per family, while 2-person families (1,114 | 34.8%) have the highest median income of $49,271 per family member.
| Income Bracket | # Families | Median Income |
| 2-Person Families | 1,114 (34.8%) | $98,542 |
| 3-Person Families | 633 (19.8%) | $95,972 |
| 4-Person Families | 725 (22.6%) | $113,819 |
| 5-Person Families | 510 (15.9%) | $91,461 |
| 6-Person Families | 176 (5.5%) | $118,681 |
| 7+ Person Families | 46 (1.4%) | $108,333 |
| Total | 3,204 (100.0%) | $104,276 |
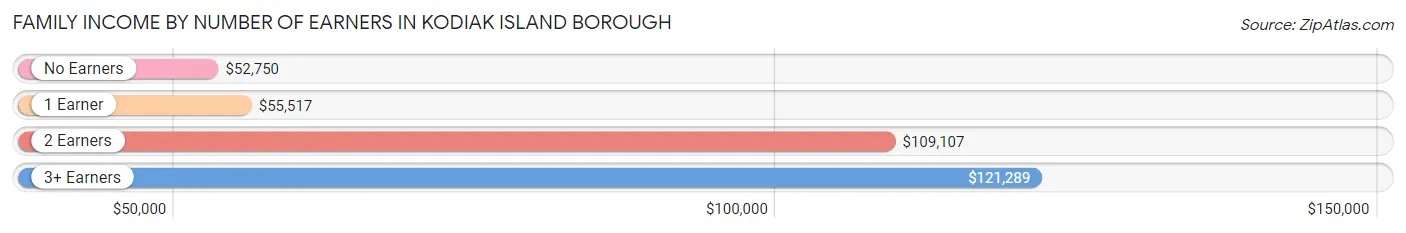
Family Income by Number of Earners in Kodiak Island Borough
The median family income in Kodiak Island Borough is $104,276, with families comprising 3+ earners (485) having the highest median family income of $121,289, while families with no earners (219) have the lowest median family income of $52,750, accounting for 15.1% and 6.8% of families, respectively.
| Number of Earners | # Families | Median Income |
| No Earners | 219 (6.8%) | $52,750 |
| 1 Earner | 710 (22.2%) | $55,517 |
| 2 Earners | 1,790 (55.9%) | $109,107 |
| 3+ Earners | 485 (15.1%) | $121,289 |
| Total | 3,204 (100.0%) | $104,276 |
Household Income in Kodiak Island Borough
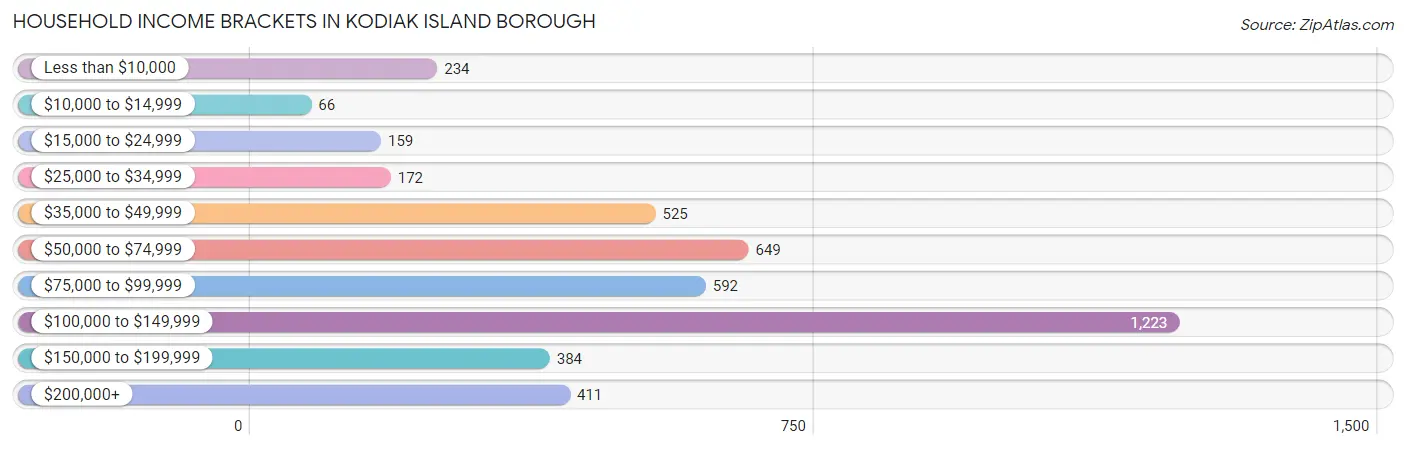
Household Income Brackets in Kodiak Island Borough
With 1,223 households falling in the category, the $100,000 to $149,999 income range is the most frequent in Kodiak Island Borough, accounting for 27.7% of all households. In contrast, only 66 households (1.5%) fall into the $10,000 to $14,999 income bracket, making it the least populous group.
| Income Bracket | # Households | % Households |
| Less than $10,000 | 234 | 5.3% |
| $10,000 to $14,999 | 66 | 1.5% |
| $15,000 to $24,999 | 159 | 3.6% |
| $25,000 to $34,999 | 172 | 3.9% |
| $35,000 to $49,999 | 525 | 11.9% |
| $50,000 to $74,999 | 649 | 14.7% |
| $75,000 to $99,999 | 592 | 13.4% |
| $100,000 to $149,999 | 1,223 | 27.7% |
| $150,000 to $199,999 | 384 | 8.7% |
| $200,000+ | 411 | 9.3% |
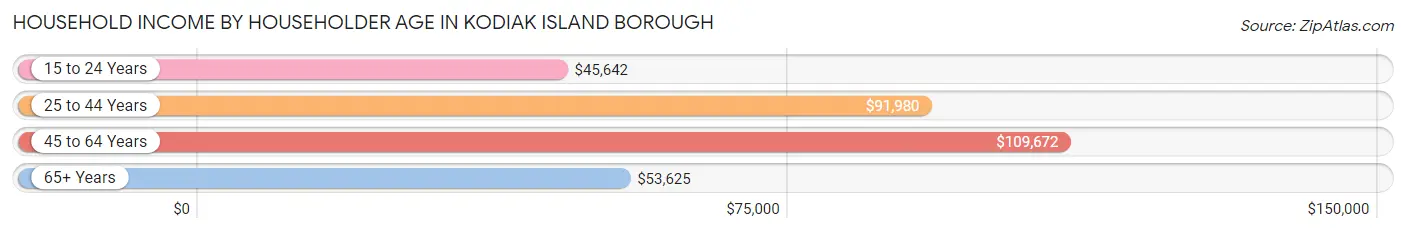
Household Income by Householder Age in Kodiak Island Borough
The median household income in Kodiak Island Borough is $91,138, with the highest median household income of $109,672 found in the 45 to 64 years age bracket for the primary householder. A total of 1,417 households (32.1%) fall into this category. Meanwhile, the 15 to 24 years age bracket for the primary householder has the lowest median household income of $45,642, with 311 households (7.0%) in this group.
| Income Bracket | # Households | Median Income |
| 15 to 24 Years | 311 (7.0%) | $45,642 |
| 25 to 44 Years | 1,999 (45.3%) | $91,980 |
| 45 to 64 Years | 1,417 (32.1%) | $109,672 |
| 65+ Years | 688 (15.6%) | $53,625 |
| Total | 4,415 (100.0%) | $91,138 |
Poverty in Kodiak Island Borough
Income Below Poverty by Sex and Age in Kodiak Island Borough
With 6.8% poverty level for males and 9.4% for females among the residents of Kodiak Island Borough, 15 year old males and under 5 year old females are the most vulnerable to poverty, with 15 males (27.8%) and 69 females (18.1%) in their respective age groups living below the poverty level.
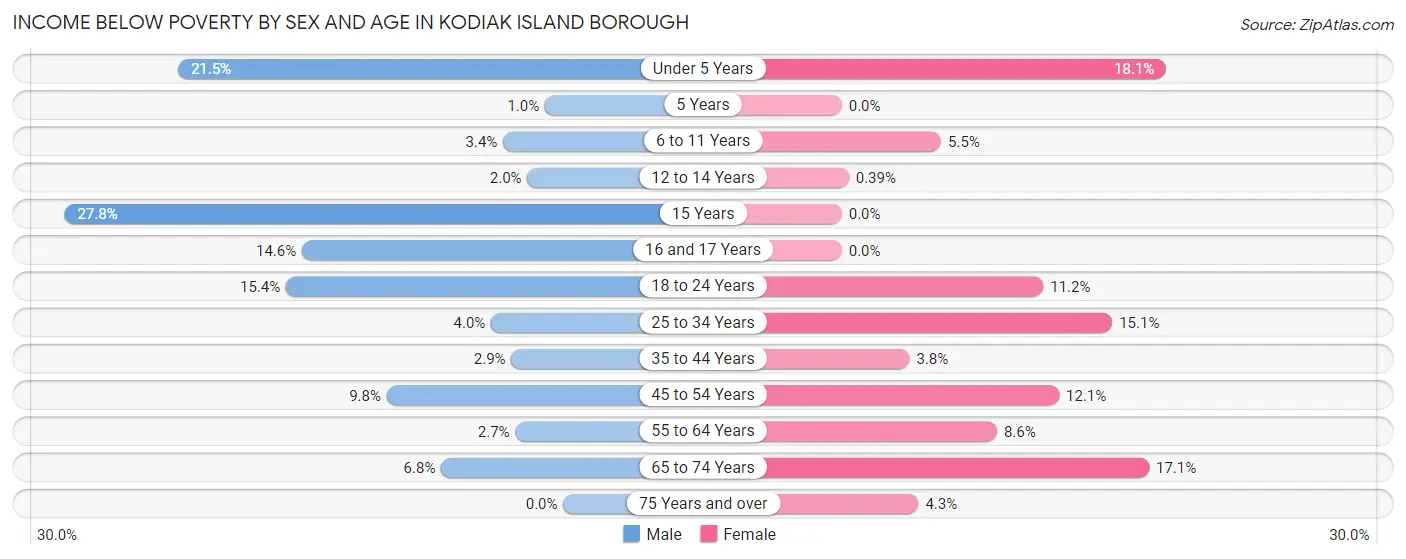
| Age Bracket | Male | Female |
| Under 5 Years | 91 (21.5%) | 69 (18.1%) |
| 5 Years | 1 (1.0%) | 0 (0.0%) |
| 6 to 11 Years | 22 (3.4%) | 32 (5.5%) |
| 12 to 14 Years | 4 (2.0%) | 1 (0.4%) |
| 15 Years | 15 (27.8%) | 0 (0.0%) |
| 16 and 17 Years | 24 (14.5%) | 0 (0.0%) |
| 18 to 24 Years | 109 (15.4%) | 44 (11.2%) |
| 25 to 34 Years | 42 (4.0%) | 150 (15.1%) |
| 35 to 44 Years | 32 (2.9%) | 36 (3.8%) |
| 45 to 54 Years | 58 (9.8%) | 71 (12.1%) |
| 55 to 64 Years | 26 (2.7%) | 63 (8.6%) |
| 65 to 74 Years | 40 (6.8%) | 83 (17.1%) |
| 75 Years and over | 0 (0.0%) | 14 (4.3%) |
| Total | 464 (6.8%) | 563 (9.4%) |
Income Above Poverty by Sex and Age in Kodiak Island Borough
According to the poverty statistics in Kodiak Island Borough, males aged 75 years and over and females aged 5 years are the age groups that are most secure financially, with 100.0% of males and 100.0% of females in these age groups living above the poverty line.
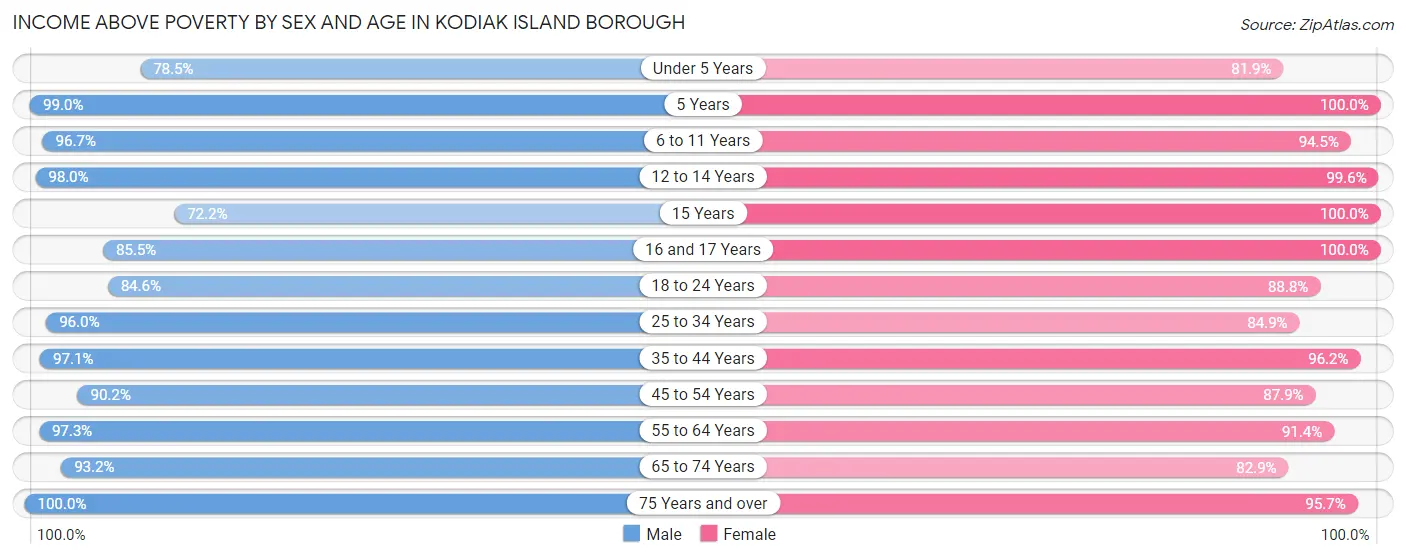
| Age Bracket | Male | Female |
| Under 5 Years | 333 (78.5%) | 313 (81.9%) |
| 5 Years | 97 (99.0%) | 143 (100.0%) |
| 6 to 11 Years | 634 (96.7%) | 547 (94.5%) |
| 12 to 14 Years | 196 (98.0%) | 258 (99.6%) |
| 15 Years | 39 (72.2%) | 92 (100.0%) |
| 16 and 17 Years | 141 (85.5%) | 65 (100.0%) |
| 18 to 24 Years | 597 (84.6%) | 348 (88.8%) |
| 25 to 34 Years | 1,004 (96.0%) | 846 (84.9%) |
| 35 to 44 Years | 1,075 (97.1%) | 919 (96.2%) |
| 45 to 54 Years | 532 (90.2%) | 516 (87.9%) |
| 55 to 64 Years | 948 (97.3%) | 666 (91.4%) |
| 65 to 74 Years | 548 (93.2%) | 402 (82.9%) |
| 75 Years and over | 177 (100.0%) | 314 (95.7%) |
| Total | 6,321 (93.2%) | 5,429 (90.6%) |
Income Below Poverty Among Married-Couple Families in Kodiak Island Borough
The poverty statistics for married-couple families in Kodiak Island Borough show that 1.8% or 47 of the total 2,658 families live below the poverty line. Families with no children have the highest poverty rate of 3.6%, comprising of 47 families. On the other hand, families with 1 or 2 children have the lowest poverty rate of 0.0%, which includes 0 families.
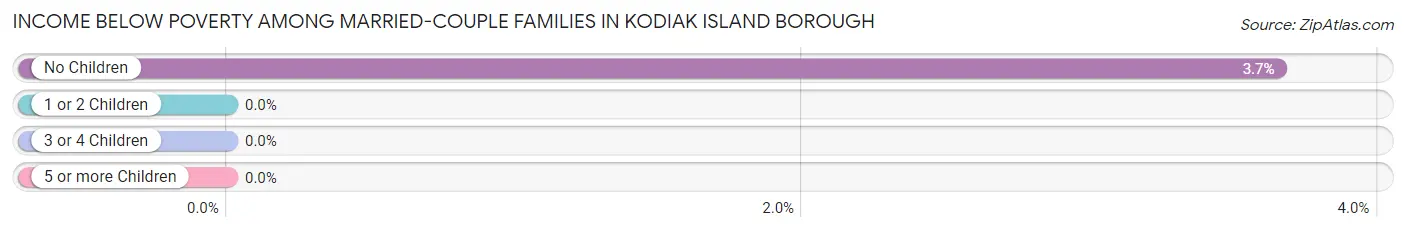
| Children | Above Poverty | Below Poverty |
| No Children | 1,241 (96.4%) | 47 (3.6%) |
| 1 or 2 Children | 1,026 (100.0%) | 0 (0.0%) |
| 3 or 4 Children | 335 (100.0%) | 0 (0.0%) |
| 5 or more Children | 9 (100.0%) | 0 (0.0%) |
| Total | 2,611 (98.2%) | 47 (1.8%) |
Income Below Poverty Among Single-Parent Households in Kodiak Island Borough
According to the poverty data in Kodiak Island Borough, 23.3% or 10 single-father households and 33.8% or 170 single-mother households are living below the poverty line. Among single-father households, those with 1 or 2 children have the highest poverty rate, with 10 households (55.6%) experiencing poverty. Likewise, among single-mother households, those with 1 or 2 children have the highest poverty rate, with 127 households (46.9%) falling below the poverty line.
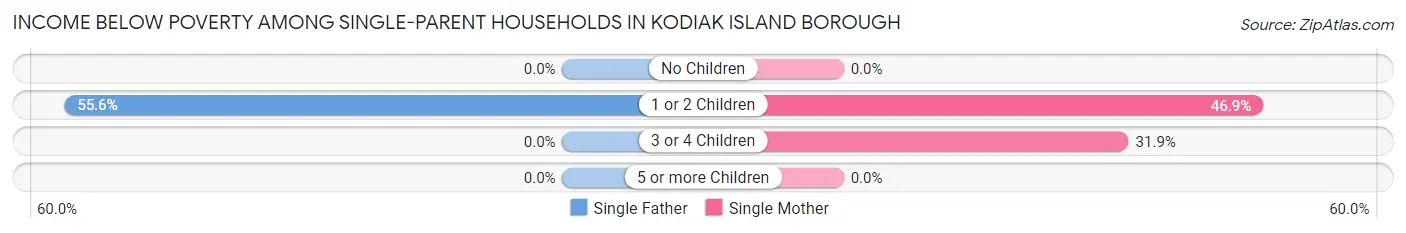
| Children | Single Father | Single Mother |
| No Children | 0 (0.0%) | 0 (0.0%) |
| 1 or 2 Children | 10 (55.6%) | 127 (46.9%) |
| 3 or 4 Children | 0 (0.0%) | 43 (31.9%) |
| 5 or more Children | 0 (0.0%) | 0 (0.0%) |
| Total | 10 (23.3%) | 170 (33.8%) |
Income Below Poverty Among Married-Couple vs Single-Parent Households in Kodiak Island Borough
The poverty data for Kodiak Island Borough shows that 47 of the married-couple family households (1.8%) and 180 of the single-parent households (33.0%) are living below the poverty level. Within the married-couple family households, those with no children have the highest poverty rate, with 47 households (3.6%) falling below the poverty line. Among the single-parent households, those with 1 or 2 children have the highest poverty rate, with 137 household (47.4%) living below poverty.
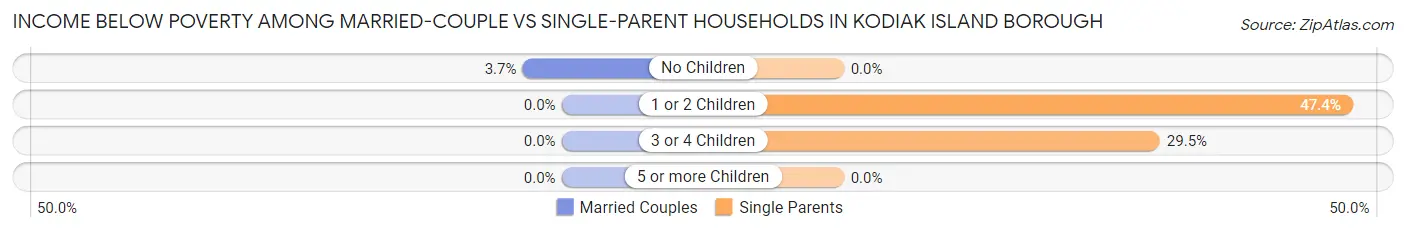
| Children | Married-Couple Families | Single-Parent Households |
| No Children | 47 (3.6%) | 0 (0.0%) |
| 1 or 2 Children | 0 (0.0%) | 137 (47.4%) |
| 3 or 4 Children | 0 (0.0%) | 43 (29.4%) |
| 5 or more Children | 0 (0.0%) | 0 (0.0%) |
| Total | 47 (1.8%) | 180 (33.0%) |
Employment Characteristics in Kodiak Island Borough
Employment by Class of Employer in Kodiak Island Borough
Among the 6,890 employed individuals in Kodiak Island Borough, private company employees (2,815 | 40.9%), federal government employees (1,868 | 27.1%), and not-for-profit organizations (726 | 10.5%) make up the most common classes of employment.
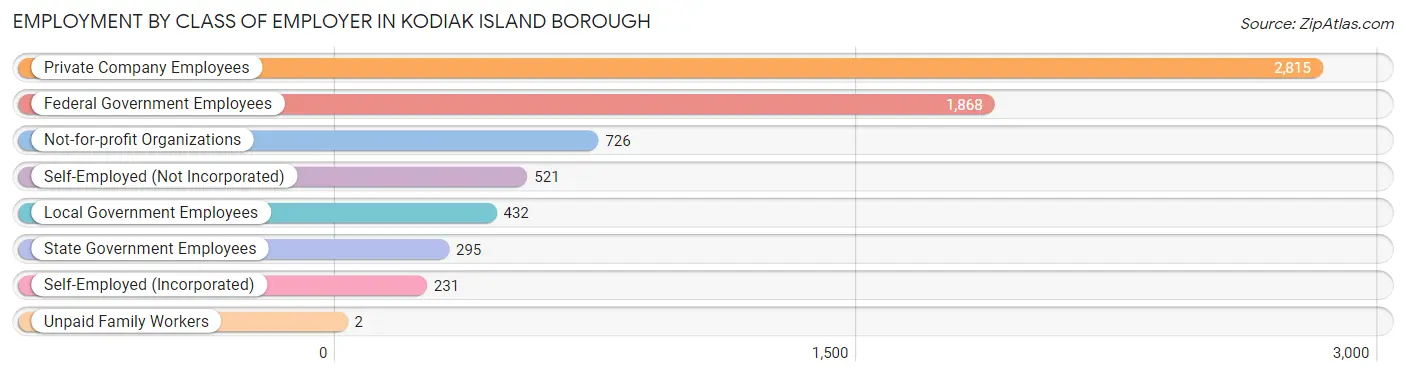
| Employer Class | # Employees | % Employees |
| Private Company Employees | 2,815 | 40.9% |
| Self-Employed (Incorporated) | 231 | 3.4% |
| Self-Employed (Not Incorporated) | 521 | 7.6% |
| Not-for-profit Organizations | 726 | 10.5% |
| Local Government Employees | 432 | 6.3% |
| State Government Employees | 295 | 4.3% |
| Federal Government Employees | 1,868 | 27.1% |
| Unpaid Family Workers | 2 | 0.0% |
| Total | 6,890 | 100.0% |
Employment Status by Age in Kodiak Island Borough
According to the labor force statistics for Kodiak Island Borough, out of the total population over 16 years of age (10,161), 73.5% or 7,468 individuals are in the labor force, with 5.7% or 426 of them unemployed. The age group with the highest labor force participation rate is 35 to 44 years, with 92.3% or 1,906 individuals in the labor force. Within the labor force, the 20 to 24 years age range has the highest percentage of unemployed individuals, with 17.6% or 148 of them being unemployed.
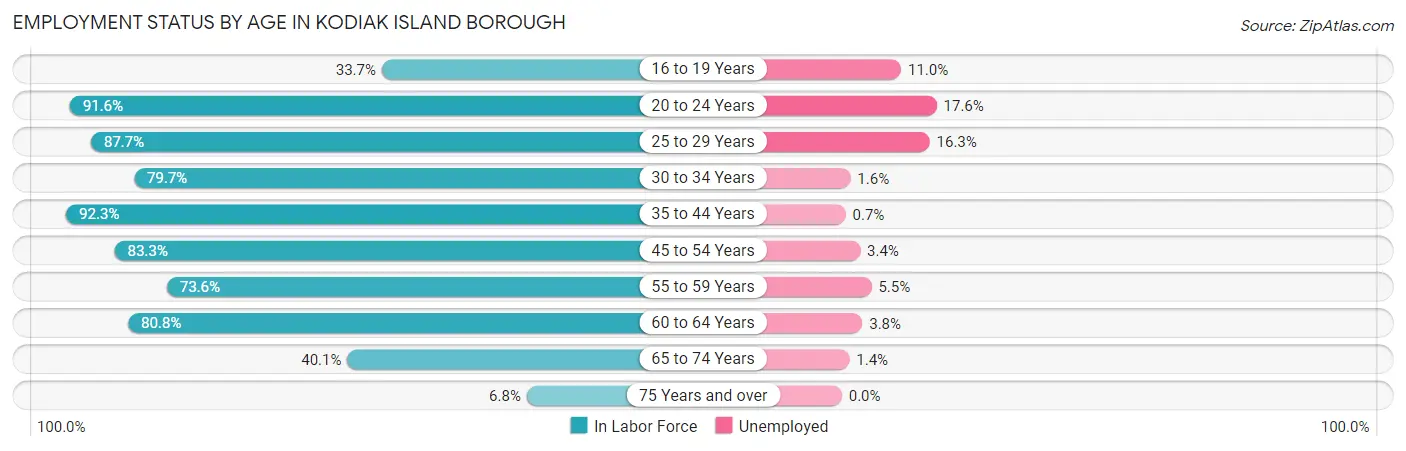
| Age Bracket | In Labor Force | Unemployed |
| 16 to 19 Years | 206 (33.7%) | 23 (11.0%) |
| 20 to 24 Years | 839 (91.6%) | 148 (17.6%) |
| 25 to 29 Years | 932 (87.7%) | 152 (16.3%) |
| 30 to 34 Years | 805 (79.7%) | 13 (1.6%) |
| 35 to 44 Years | 1,906 (92.3%) | 13 (0.7%) |
| 45 to 54 Years | 980 (83.3%) | 33 (3.4%) |
| 55 to 59 Years | 565 (73.6%) | 31 (5.5%) |
| 60 to 64 Years | 763 (80.8%) | 29 (3.8%) |
| 65 to 74 Years | 433 (40.1%) | 6 (1.4%) |
| 75 Years and over | 36 (6.8%) | 0 (0.0%) |
| Total | 7,468 (73.5%) | 426 (5.7%) |
Employment Status by Educational Attainment in Kodiak Island Borough
According to labor force statistics for Kodiak Island Borough, 84.7% of individuals (5,952) out of the total population between 25 and 64 years of age (7,027) are in the labor force, with 4.7% or 280 of them being unemployed. The group with the highest labor force participation rate are those with the educational attainment of bachelor's degree or higher, with 90.7% or 1,751 individuals in the labor force. Within the labor force, individuals with less than high school education have the highest percentage of unemployment, with 15.4% or 70 of them being unemployed.
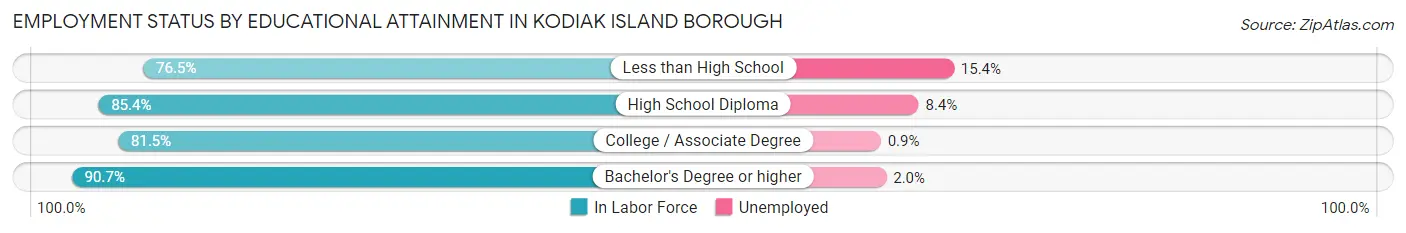
| Educational Attainment | In Labor Force | Unemployed |
| Less than High School | 456 (76.5%) | 92 (15.4%) |
| High School Diploma | 1,682 (85.4%) | 165 (8.4%) |
| College / Associate Degree | 2,063 (81.5%) | 23 (0.9%) |
| Bachelor's Degree or higher | 1,751 (90.7%) | 39 (2.0%) |
| Total | 5,952 (84.7%) | 330 (4.7%) |
Employment Occupations by Sex in Kodiak Island Borough
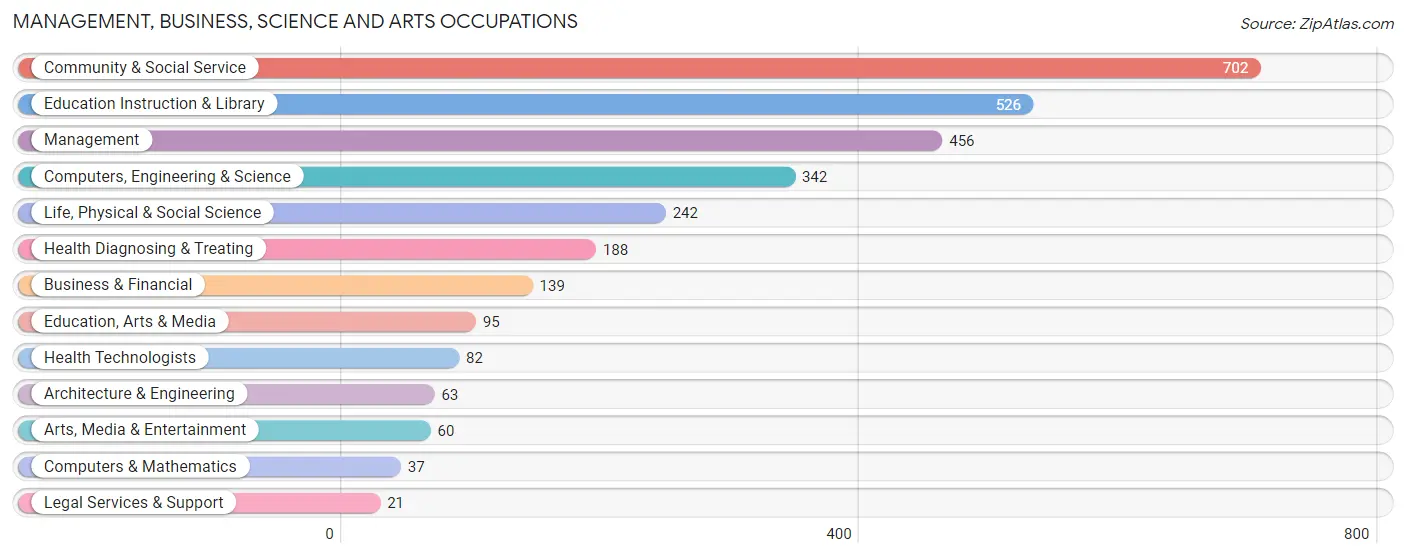
Management, Business, Science and Arts Occupations
The most common Management, Business, Science and Arts occupations in Kodiak Island Borough are Community & Social Service (702 | 11.4%), Education Instruction & Library (526 | 8.6%), Management (456 | 7.4%), Computers, Engineering & Science (342 | 5.6%), and Life, Physical & Social Science (242 | 3.9%).
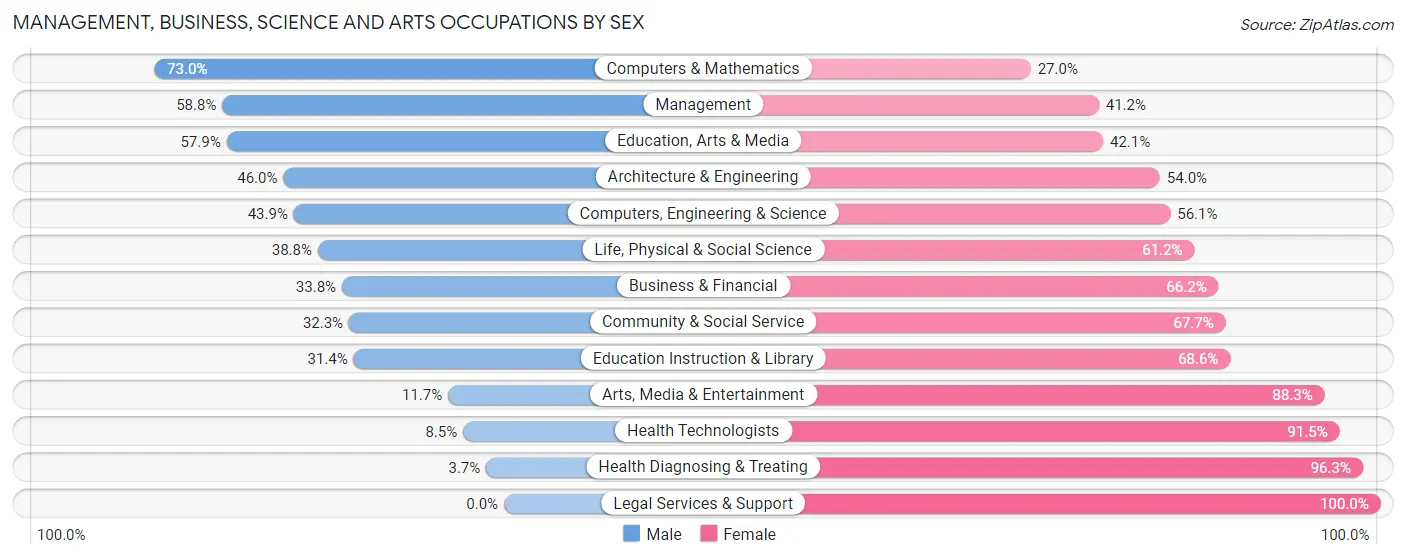
Management, Business, Science and Arts Occupations by Sex
Within the Management, Business, Science and Arts occupations in Kodiak Island Borough, the most male-oriented occupations are Computers & Mathematics (73.0%), Management (58.8%), and Education, Arts & Media (57.9%), while the most female-oriented occupations are Legal Services & Support (100.0%), Health Diagnosing & Treating (96.3%), and Health Technologists (91.5%).
| Occupation | Male | Female |
| Management | 268 (58.8%) | 188 (41.2%) |
| Business & Financial | 47 (33.8%) | 92 (66.2%) |
| Computers, Engineering & Science | 150 (43.9%) | 192 (56.1%) |
| Computers & Mathematics | 27 (73.0%) | 10 (27.0%) |
| Architecture & Engineering | 29 (46.0%) | 34 (54.0%) |
| Life, Physical & Social Science | 94 (38.8%) | 148 (61.2%) |
| Community & Social Service | 227 (32.3%) | 475 (67.7%) |
| Education, Arts & Media | 55 (57.9%) | 40 (42.1%) |
| Legal Services & Support | 0 (0.0%) | 21 (100.0%) |
| Education Instruction & Library | 165 (31.4%) | 361 (68.6%) |
| Arts, Media & Entertainment | 7 (11.7%) | 53 (88.3%) |
| Health Diagnosing & Treating | 7 (3.7%) | 181 (96.3%) |
| Health Technologists | 7 (8.5%) | 75 (91.5%) |
| Total (Category) | 699 (38.3%) | 1,128 (61.7%) |
| Total (Overall) | 3,069 (50.0%) | 3,070 (50.0%) |
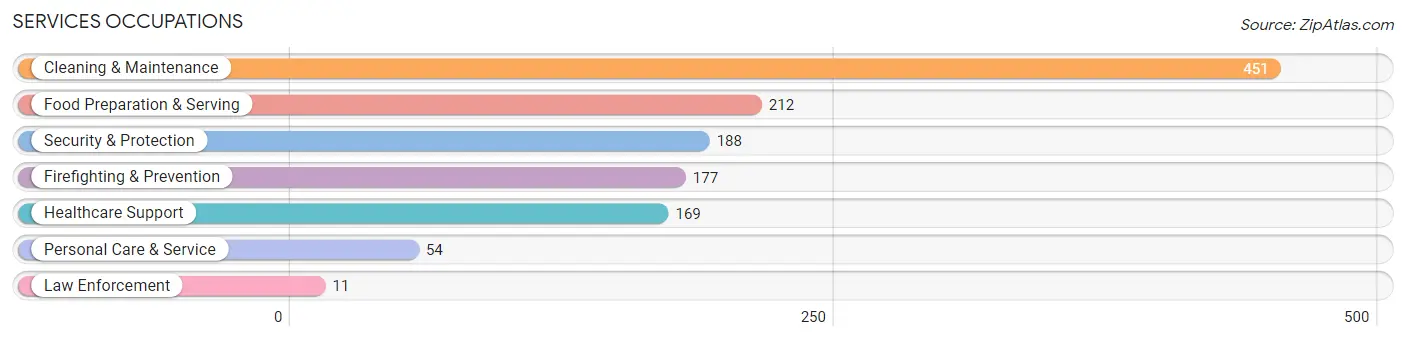
Services Occupations
The most common Services occupations in Kodiak Island Borough are Cleaning & Maintenance (451 | 7.3%), Food Preparation & Serving (212 | 3.5%), Security & Protection (188 | 3.1%), Firefighting & Prevention (177 | 2.9%), and Healthcare Support (169 | 2.8%).
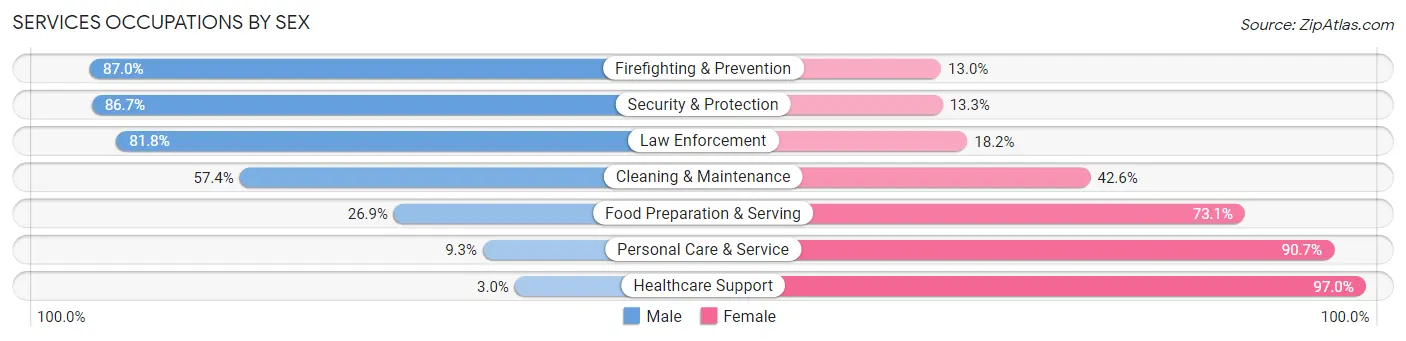
Services Occupations by Sex
Within the Services occupations in Kodiak Island Borough, the most male-oriented occupations are Firefighting & Prevention (87.0%), Security & Protection (86.7%), and Law Enforcement (81.8%), while the most female-oriented occupations are Healthcare Support (97.0%), Personal Care & Service (90.7%), and Food Preparation & Serving (73.1%).
| Occupation | Male | Female |
| Healthcare Support | 5 (3.0%) | 164 (97.0%) |
| Security & Protection | 163 (86.7%) | 25 (13.3%) |
| Firefighting & Prevention | 154 (87.0%) | 23 (13.0%) |
| Law Enforcement | 9 (81.8%) | 2 (18.2%) |
| Food Preparation & Serving | 57 (26.9%) | 155 (73.1%) |
| Cleaning & Maintenance | 259 (57.4%) | 192 (42.6%) |
| Personal Care & Service | 5 (9.3%) | 49 (90.7%) |
| Total (Category) | 489 (45.5%) | 585 (54.5%) |
| Total (Overall) | 3,069 (50.0%) | 3,070 (50.0%) |
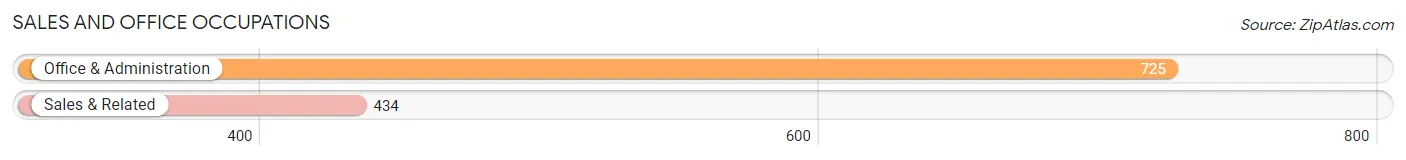
Sales and Office Occupations
The most common Sales and Office occupations in Kodiak Island Borough are Office & Administration (725 | 11.8%), and Sales & Related (434 | 7.1%).
Sales and Office Occupations by Sex
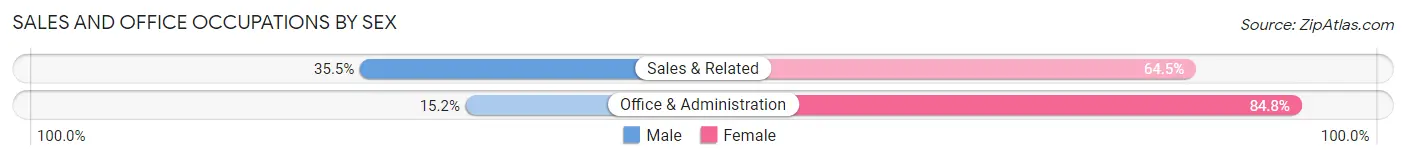
| Occupation | Male | Female |
| Sales & Related | 154 (35.5%) | 280 (64.5%) |
| Office & Administration | 110 (15.2%) | 615 (84.8%) |
| Total (Category) | 264 (22.8%) | 895 (77.2%) |
| Total (Overall) | 3,069 (50.0%) | 3,070 (50.0%) |
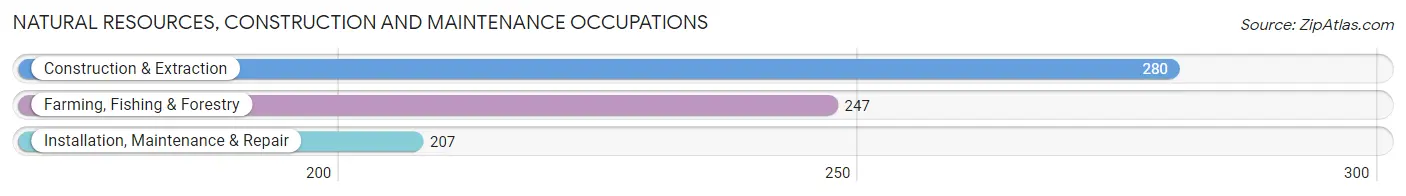
Natural Resources, Construction and Maintenance Occupations
The most common Natural Resources, Construction and Maintenance occupations in Kodiak Island Borough are Construction & Extraction (280 | 4.6%), Farming, Fishing & Forestry (247 | 4.0%), and Installation, Maintenance & Repair (207 | 3.4%).
Natural Resources, Construction and Maintenance Occupations by Sex
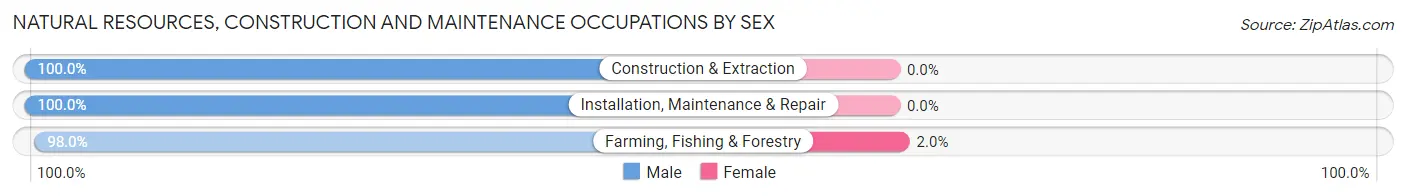
| Occupation | Male | Female |
| Farming, Fishing & Forestry | 242 (98.0%) | 5 (2.0%) |
| Construction & Extraction | 280 (100.0%) | 0 (0.0%) |
| Installation, Maintenance & Repair | 207 (100.0%) | 0 (0.0%) |
| Total (Category) | 729 (99.3%) | 5 (0.7%) |
| Total (Overall) | 3,069 (50.0%) | 3,070 (50.0%) |
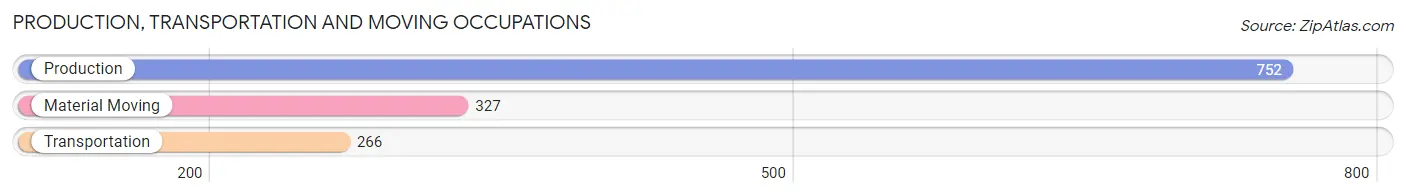
Production, Transportation and Moving Occupations
The most common Production, Transportation and Moving occupations in Kodiak Island Borough are Production (752 | 12.2%), Material Moving (327 | 5.3%), and Transportation (266 | 4.3%).
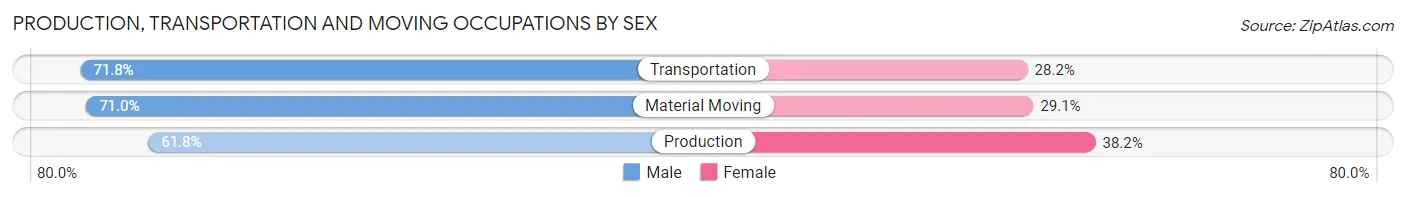
Production, Transportation and Moving Occupations by Sex
| Occupation | Male | Female |
| Production | 465 (61.8%) | 287 (38.2%) |
| Transportation | 191 (71.8%) | 75 (28.2%) |
| Material Moving | 232 (71.0%) | 95 (29.0%) |
| Total (Category) | 888 (66.0%) | 457 (34.0%) |
| Total (Overall) | 3,069 (50.0%) | 3,070 (50.0%) |
Employment Industries by Sex in Kodiak Island Borough
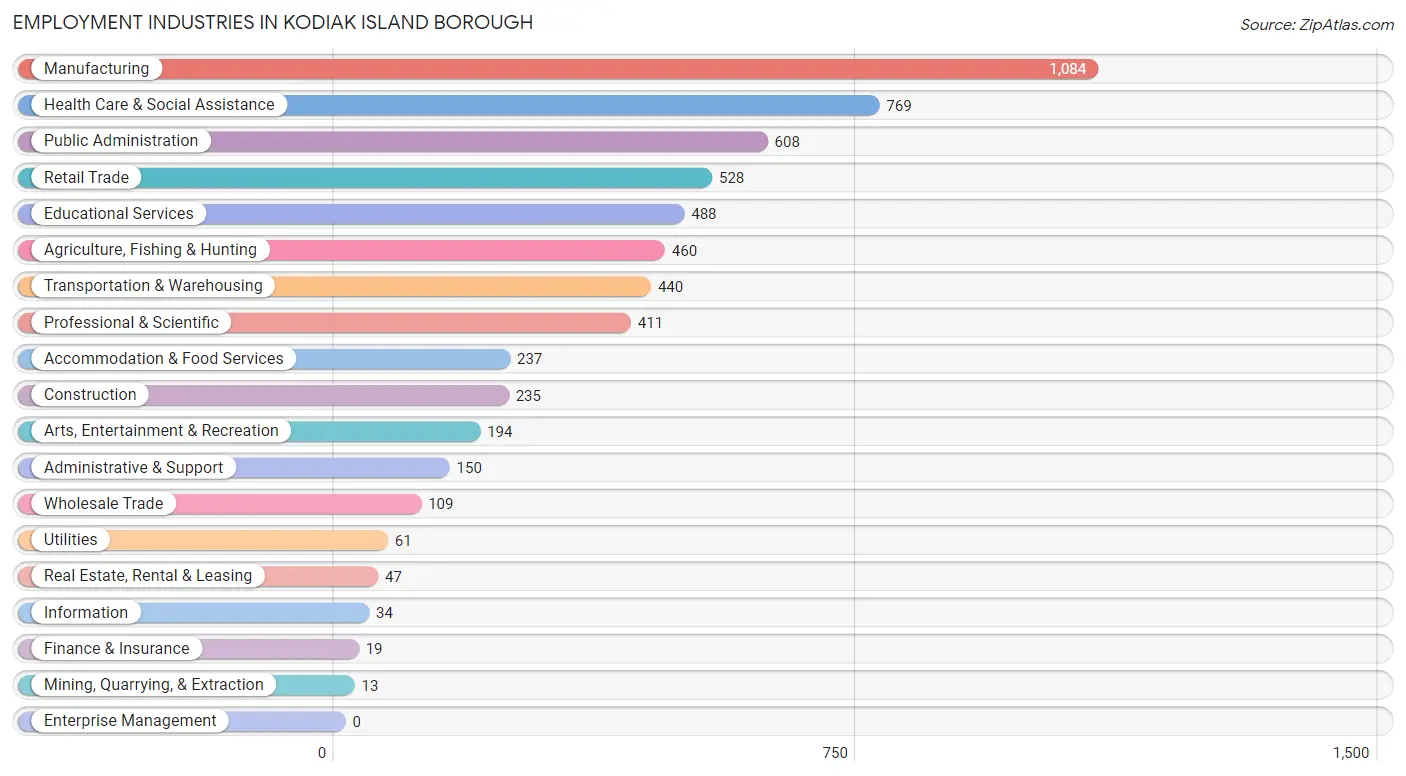
Employment Industries in Kodiak Island Borough
The major employment industries in Kodiak Island Borough include Manufacturing (1,084 | 17.7%), Health Care & Social Assistance (769 | 12.5%), Public Administration (608 | 9.9%), Retail Trade (528 | 8.6%), and Educational Services (488 | 8.0%).
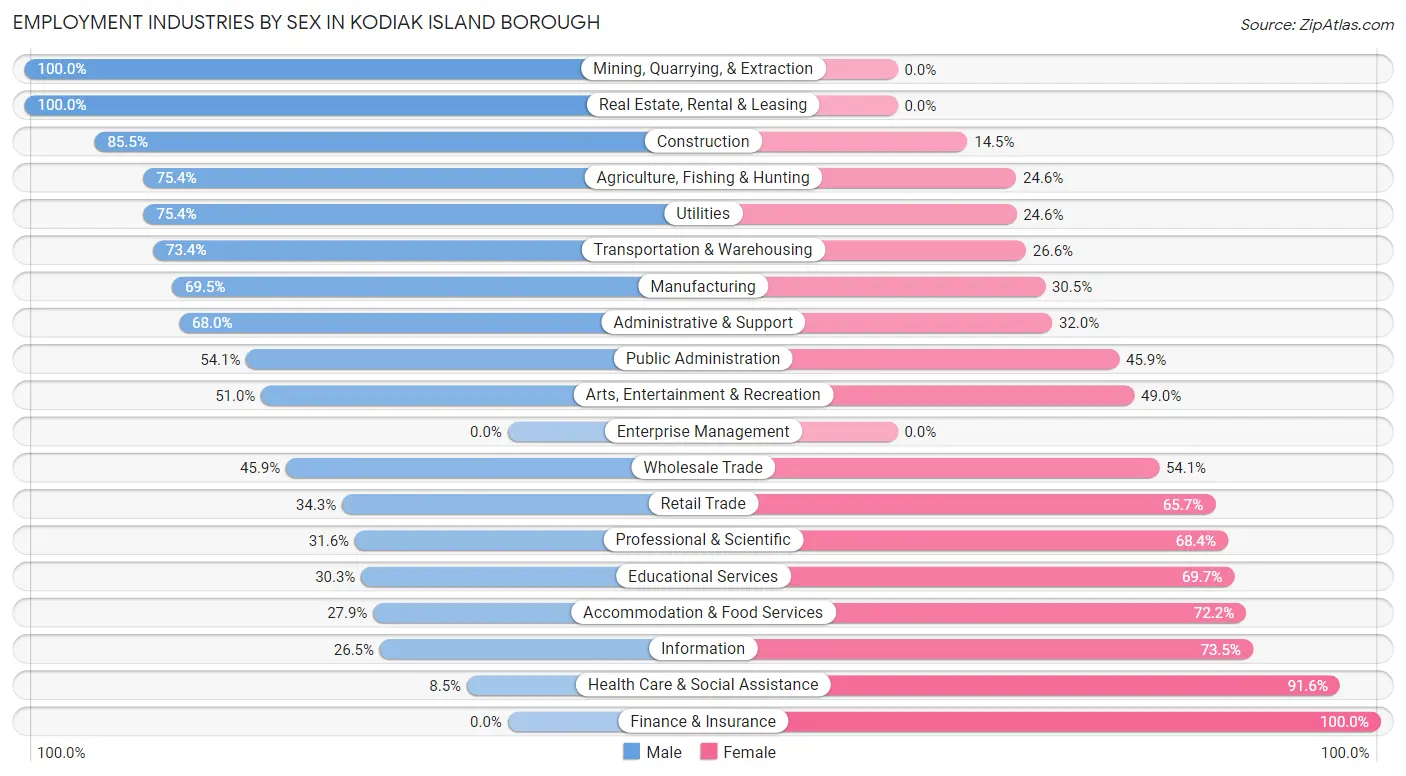
Employment Industries by Sex in Kodiak Island Borough
The Kodiak Island Borough industries that see more men than women are Mining, Quarrying, & Extraction (100.0%), Real Estate, Rental & Leasing (100.0%), and Construction (85.5%), whereas the industries that tend to have a higher number of women are Finance & Insurance (100.0%), Health Care & Social Assistance (91.5%), and Information (73.5%).
| Industry | Male | Female |
| Agriculture, Fishing & Hunting | 347 (75.4%) | 113 (24.6%) |
| Mining, Quarrying, & Extraction | 13 (100.0%) | 0 (0.0%) |
| Construction | 201 (85.5%) | 34 (14.5%) |
| Manufacturing | 753 (69.5%) | 331 (30.5%) |
| Wholesale Trade | 50 (45.9%) | 59 (54.1%) |
| Retail Trade | 181 (34.3%) | 347 (65.7%) |
| Transportation & Warehousing | 323 (73.4%) | 117 (26.6%) |
| Utilities | 46 (75.4%) | 15 (24.6%) |
| Information | 9 (26.5%) | 25 (73.5%) |
| Finance & Insurance | 0 (0.0%) | 19 (100.0%) |
| Real Estate, Rental & Leasing | 47 (100.0%) | 0 (0.0%) |
| Professional & Scientific | 130 (31.6%) | 281 (68.4%) |
| Enterprise Management | 0 (0.0%) | 0 (0.0%) |
| Administrative & Support | 102 (68.0%) | 48 (32.0%) |
| Educational Services | 148 (30.3%) | 340 (69.7%) |
| Health Care & Social Assistance | 65 (8.5%) | 704 (91.5%) |
| Arts, Entertainment & Recreation | 99 (51.0%) | 95 (49.0%) |
| Accommodation & Food Services | 66 (27.9%) | 171 (72.2%) |
| Public Administration | 329 (54.1%) | 279 (45.9%) |
| Total | 3,069 (50.0%) | 3,070 (50.0%) |
Education in Kodiak Island Borough
School Enrollment in Kodiak Island Borough
The most common levels of schooling among the 3,213 students in Kodiak Island Borough are elementary school (851 | 26.5%), middle school (680 | 21.2%), and high school (595 | 18.5%).
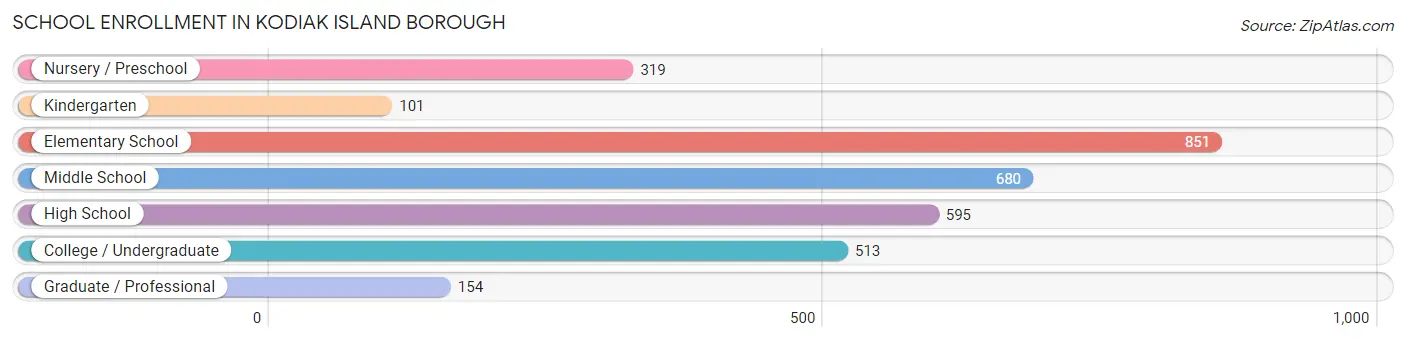
| School Level | # Students | % Students |
| Nursery / Preschool | 319 | 9.9% |
| Kindergarten | 101 | 3.1% |
| Elementary School | 851 | 26.5% |
| Middle School | 680 | 21.2% |
| High School | 595 | 18.5% |
| College / Undergraduate | 513 | 16.0% |
| Graduate / Professional | 154 | 4.8% |
| Total | 3,213 | 100.0% |
School Enrollment by Age by Funding Source in Kodiak Island Borough
Out of a total of 3,213 students who are enrolled in schools in Kodiak Island Borough, 710 (22.1%) attend a private institution, while the remaining 2,503 (77.9%) are enrolled in public schools. The age group of 3 to 4 year olds has the highest likelihood of being enrolled in private schools, with 133 (76.4% in the age bracket) enrolled. Conversely, the age group of 15 to 17 year olds has the lowest likelihood of being enrolled in a private school, with 343 (95.0% in the age bracket) attending a public institution.
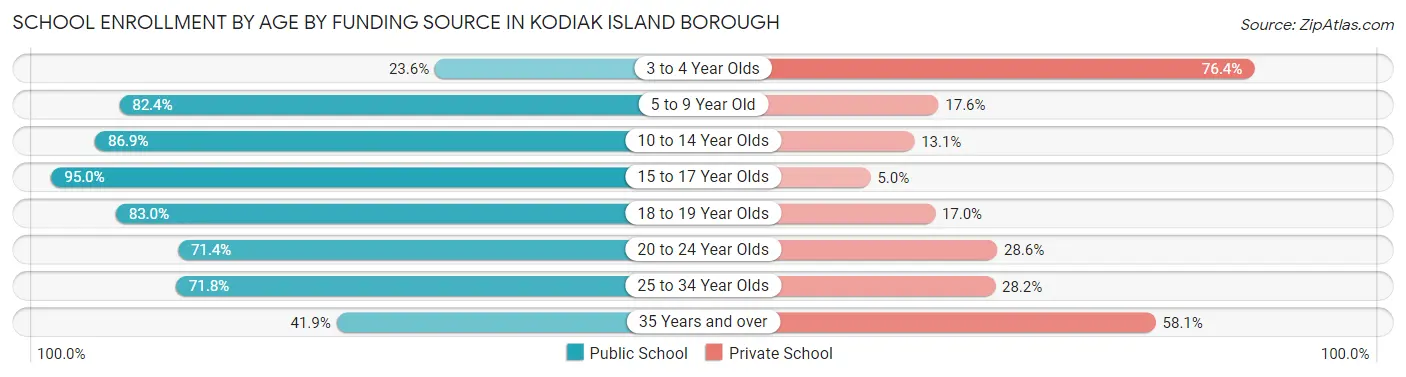
| Age Bracket | Public School | Private School |
| 3 to 4 Year Olds | 41 (23.6%) | 133 (76.4%) |
| 5 to 9 Year Old | 887 (82.4%) | 190 (17.6%) |
| 10 to 14 Year Olds | 681 (86.9%) | 103 (13.1%) |
| 15 to 17 Year Olds | 343 (95.0%) | 18 (5.0%) |
| 18 to 19 Year Olds | 205 (83.0%) | 42 (17.0%) |
| 20 to 24 Year Olds | 95 (71.4%) | 38 (28.6%) |
| 25 to 34 Year Olds | 163 (71.8%) | 64 (28.2%) |
| 35 Years and over | 88 (41.9%) | 122 (58.1%) |
| Total | 2,503 (77.9%) | 710 (22.1%) |
Educational Attainment by Field of Study in Kodiak Island Borough
Bio, nature & agricultural (572 | 22.0%), education (329 | 12.7%), business (318 | 12.2%), arts & humanities (297 | 11.4%), and science & technology (256 | 9.9%) are the most common fields of study among 2,597 individuals in Kodiak Island Borough who have obtained a bachelor's degree or higher.
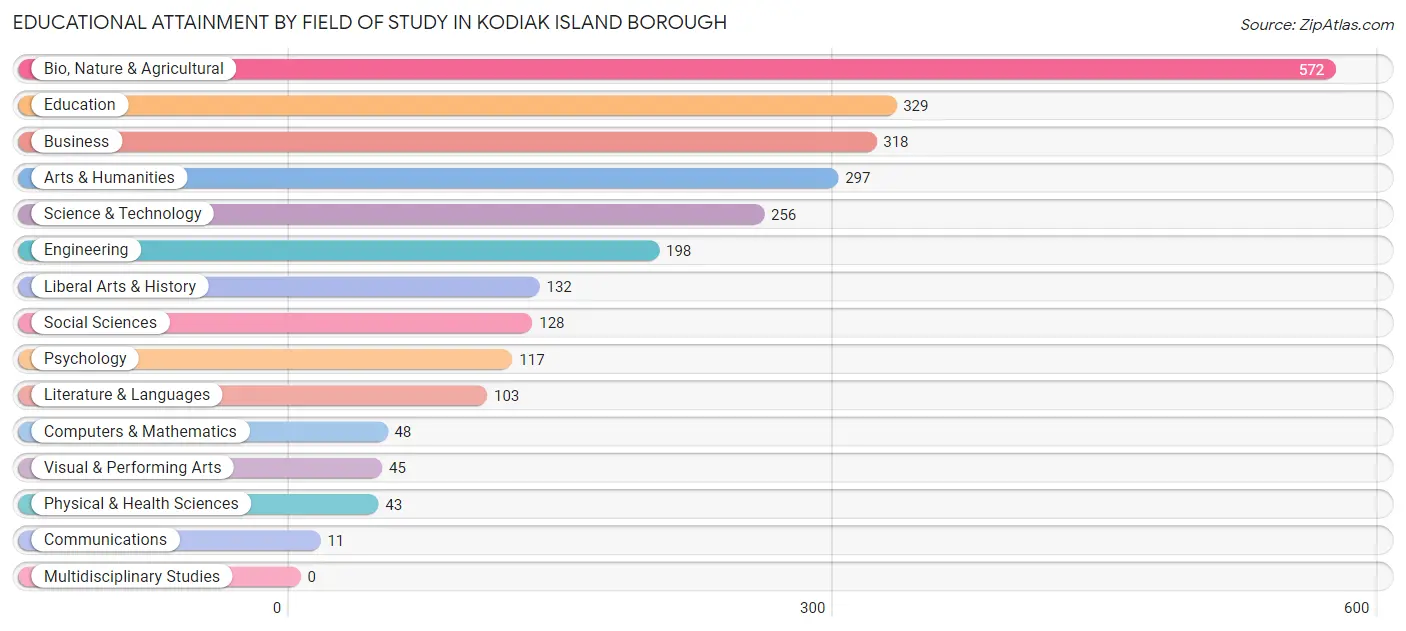
| Field of Study | # Graduates | % Graduates |
| Computers & Mathematics | 48 | 1.8% |
| Bio, Nature & Agricultural | 572 | 22.0% |
| Physical & Health Sciences | 43 | 1.7% |
| Psychology | 117 | 4.5% |
| Social Sciences | 128 | 4.9% |
| Engineering | 198 | 7.6% |
| Multidisciplinary Studies | 0 | 0.0% |
| Science & Technology | 256 | 9.9% |
| Business | 318 | 12.2% |
| Education | 329 | 12.7% |
| Literature & Languages | 103 | 4.0% |
| Liberal Arts & History | 132 | 5.1% |
| Visual & Performing Arts | 45 | 1.7% |
| Communications | 11 | 0.4% |
| Arts & Humanities | 297 | 11.4% |
| Total | 2,597 | 100.0% |
Transportation & Commute in Kodiak Island Borough
Vehicle Availability by Sex in Kodiak Island Borough
The most prevalent vehicle ownership categories in Kodiak Island Borough are males with 2 vehicles (1,523, accounting for 42.1%) and females with 2 vehicles (1,536, making up 51.4%).
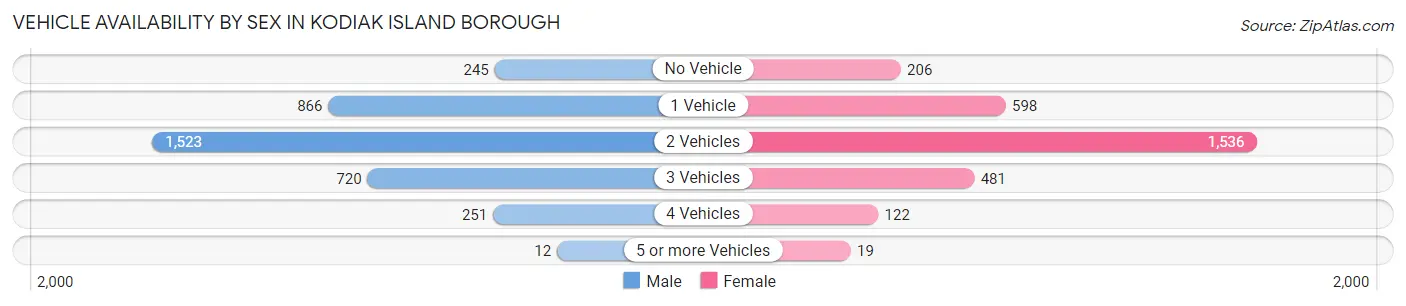
| Vehicles Available | Male | Female |
| No Vehicle | 245 (6.8%) | 206 (7.0%) |
| 1 Vehicle | 866 (23.9%) | 598 (20.2%) |
| 2 Vehicles | 1,523 (42.1%) | 1,536 (51.9%) |
| 3 Vehicles | 720 (19.9%) | 481 (16.2%) |
| 4 Vehicles | 251 (6.9%) | 122 (4.1%) |
| 5 or more Vehicles | 12 (0.3%) | 19 (0.6%) |
| Total | 3,617 (100.0%) | 2,962 (100.0%) |
Commute Time in Kodiak Island Borough
The most frequently occuring commute durations in Kodiak Island Borough are 10 to 14 minutes (1,884 commuters, 29.2%), 5 to 9 minutes (1,867 commuters, 29.0%), and 15 to 19 minutes (1,006 commuters, 15.6%).
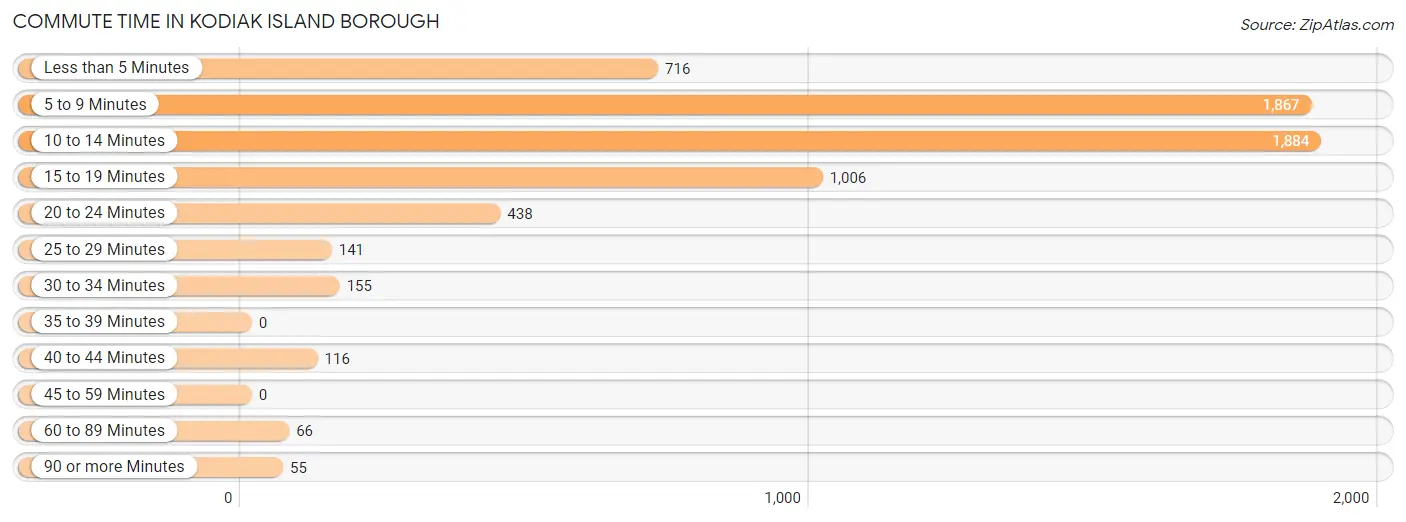
| Commute Time | # Commuters | % Commuters |
| Less than 5 Minutes | 716 | 11.1% |
| 5 to 9 Minutes | 1,867 | 29.0% |
| 10 to 14 Minutes | 1,884 | 29.2% |
| 15 to 19 Minutes | 1,006 | 15.6% |
| 20 to 24 Minutes | 438 | 6.8% |
| 25 to 29 Minutes | 141 | 2.2% |
| 30 to 34 Minutes | 155 | 2.4% |
| 35 to 39 Minutes | 0 | 0.0% |
| 40 to 44 Minutes | 116 | 1.8% |
| 45 to 59 Minutes | 0 | 0.0% |
| 60 to 89 Minutes | 66 | 1.0% |
| 90 or more Minutes | 55 | 0.9% |
Commute Time by Sex in Kodiak Island Borough
The most common commute times in Kodiak Island Borough are 10 to 14 minutes (1,262 commuters, 34.6%) for males and 5 to 9 minutes (1,006 commuters, 35.9%) for females.
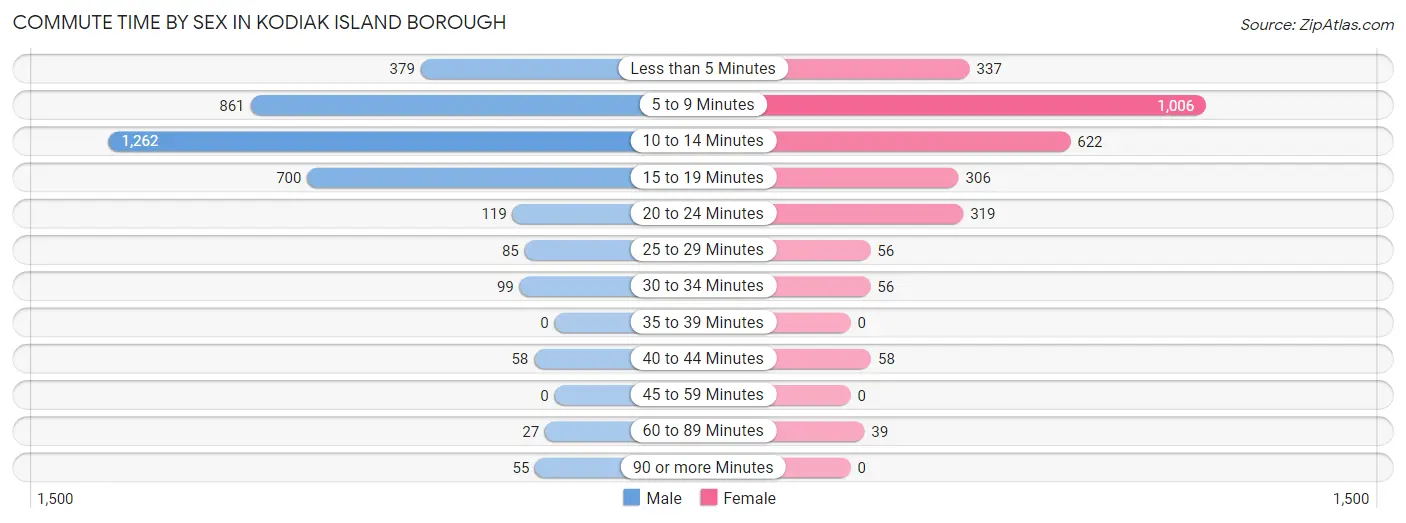
| Commute Time | Male | Female |
| Less than 5 Minutes | 379 (10.4%) | 337 (12.0%) |
| 5 to 9 Minutes | 861 (23.6%) | 1,006 (35.9%) |
| 10 to 14 Minutes | 1,262 (34.6%) | 622 (22.2%) |
| 15 to 19 Minutes | 700 (19.2%) | 306 (10.9%) |
| 20 to 24 Minutes | 119 (3.3%) | 319 (11.4%) |
| 25 to 29 Minutes | 85 (2.3%) | 56 (2.0%) |
| 30 to 34 Minutes | 99 (2.7%) | 56 (2.0%) |
| 35 to 39 Minutes | 0 (0.0%) | 0 (0.0%) |
| 40 to 44 Minutes | 58 (1.6%) | 58 (2.1%) |
| 45 to 59 Minutes | 0 (0.0%) | 0 (0.0%) |
| 60 to 89 Minutes | 27 (0.7%) | 39 (1.4%) |
| 90 or more Minutes | 55 (1.5%) | 0 (0.0%) |
Time of Departure to Work by Sex in Kodiak Island Borough
The most frequent times of departure to work in Kodiak Island Borough are 7:30 AM to 7:59 AM (718, 19.7%) for males and 7:30 AM to 7:59 AM (524, 18.7%) for females.
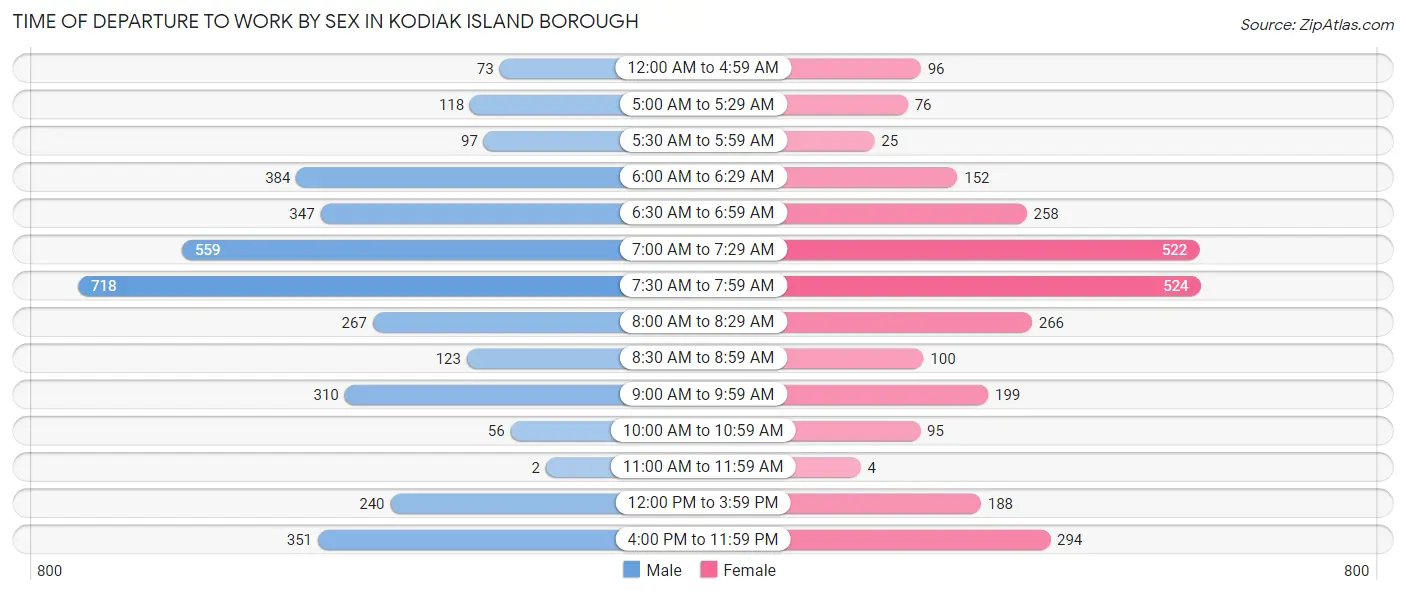
| Time of Departure | Male | Female |
| 12:00 AM to 4:59 AM | 73 (2.0%) | 96 (3.4%) |
| 5:00 AM to 5:29 AM | 118 (3.2%) | 76 (2.7%) |
| 5:30 AM to 5:59 AM | 97 (2.7%) | 25 (0.9%) |
| 6:00 AM to 6:29 AM | 384 (10.5%) | 152 (5.4%) |
| 6:30 AM to 6:59 AM | 347 (9.5%) | 258 (9.2%) |
| 7:00 AM to 7:29 AM | 559 (15.3%) | 522 (18.6%) |
| 7:30 AM to 7:59 AM | 718 (19.7%) | 524 (18.7%) |
| 8:00 AM to 8:29 AM | 267 (7.3%) | 266 (9.5%) |
| 8:30 AM to 8:59 AM | 123 (3.4%) | 100 (3.6%) |
| 9:00 AM to 9:59 AM | 310 (8.5%) | 199 (7.1%) |
| 10:00 AM to 10:59 AM | 56 (1.5%) | 95 (3.4%) |
| 11:00 AM to 11:59 AM | 2 (0.1%) | 4 (0.1%) |
| 12:00 PM to 3:59 PM | 240 (6.6%) | 188 (6.7%) |
| 4:00 PM to 11:59 PM | 351 (9.6%) | 294 (10.5%) |
| Total | 3,645 (100.0%) | 2,799 (100.0%) |
Housing Occupancy in Kodiak Island Borough
Occupancy by Ownership in Kodiak Island Borough
Of the total 4,415 dwellings in Kodiak Island Borough, owner-occupied units account for 2,500 (56.6%), while renter-occupied units make up 1,915 (43.4%).
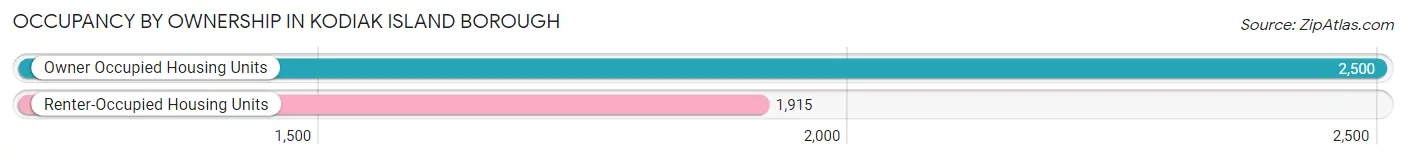
| Occupancy | # Housing Units | % Housing Units |
| Owner Occupied Housing Units | 2,500 | 56.6% |
| Renter-Occupied Housing Units | 1,915 | 43.4% |
| Total Occupied Housing Units | 4,415 | 100.0% |
Occupancy by Household Size in Kodiak Island Borough
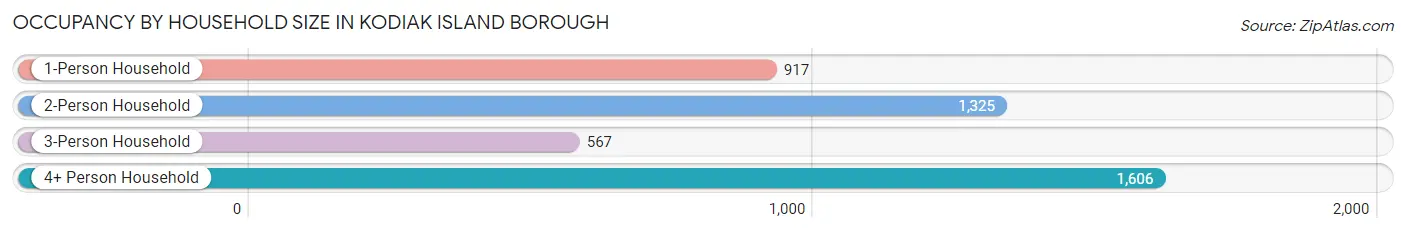
| Household Size | # Housing Units | % Housing Units |
| 1-Person Household | 917 | 20.8% |
| 2-Person Household | 1,325 | 30.0% |
| 3-Person Household | 567 | 12.8% |
| 4+ Person Household | 1,606 | 36.4% |
| Total Housing Units | 4,415 | 100.0% |
Occupancy by Ownership by Household Size in Kodiak Island Borough
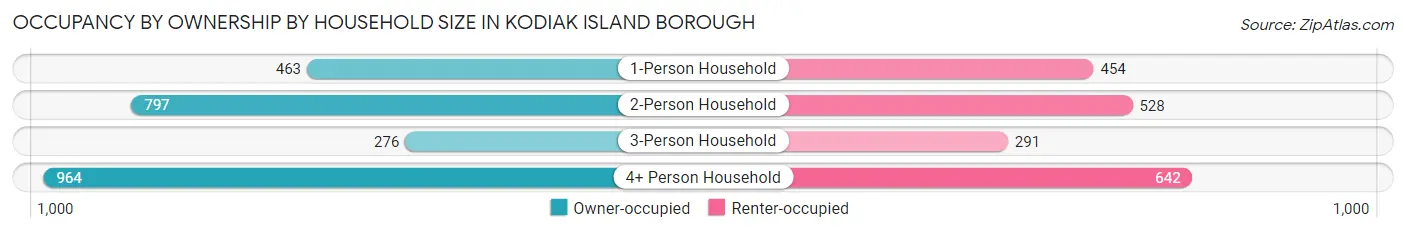
| Household Size | Owner-occupied | Renter-occupied |
| 1-Person Household | 463 (50.5%) | 454 (49.5%) |
| 2-Person Household | 797 (60.2%) | 528 (39.9%) |
| 3-Person Household | 276 (48.7%) | 291 (51.3%) |
| 4+ Person Household | 964 (60.0%) | 642 (40.0%) |
| Total Housing Units | 2,500 (56.6%) | 1,915 (43.4%) |
Occupancy by Educational Attainment in Kodiak Island Borough
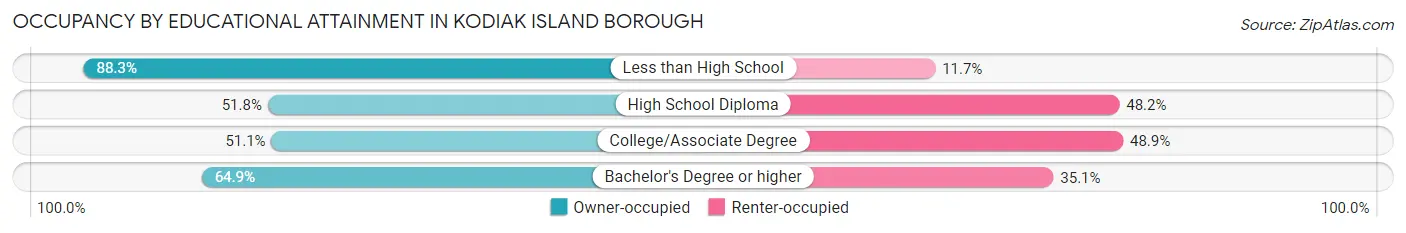
| Household Size | Owner-occupied | Renter-occupied |
| Less than High School | 166 (88.3%) | 22 (11.7%) |
| High School Diploma | 633 (51.8%) | 589 (48.2%) |
| College/Associate Degree | 918 (51.1%) | 880 (48.9%) |
| Bachelor's Degree or higher | 783 (64.9%) | 424 (35.1%) |
Occupancy by Age of Householder in Kodiak Island Borough
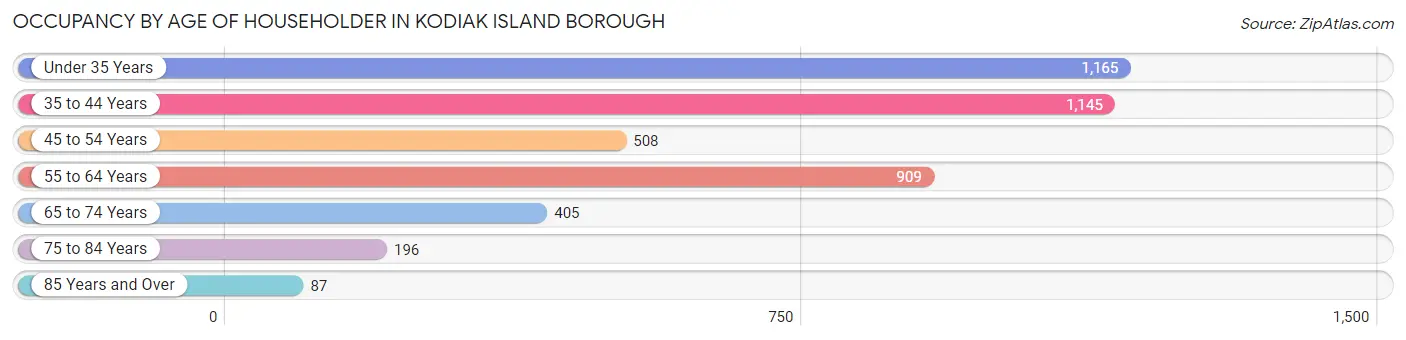
| Age Bracket | # Households | % Households |
| Under 35 Years | 1,165 | 26.4% |
| 35 to 44 Years | 1,145 | 25.9% |
| 45 to 54 Years | 508 | 11.5% |
| 55 to 64 Years | 909 | 20.6% |
| 65 to 74 Years | 405 | 9.2% |
| 75 to 84 Years | 196 | 4.4% |
| 85 Years and Over | 87 | 2.0% |
| Total | 4,415 | 100.0% |
Housing Finances in Kodiak Island Borough
Median Income by Occupancy in Kodiak Island Borough
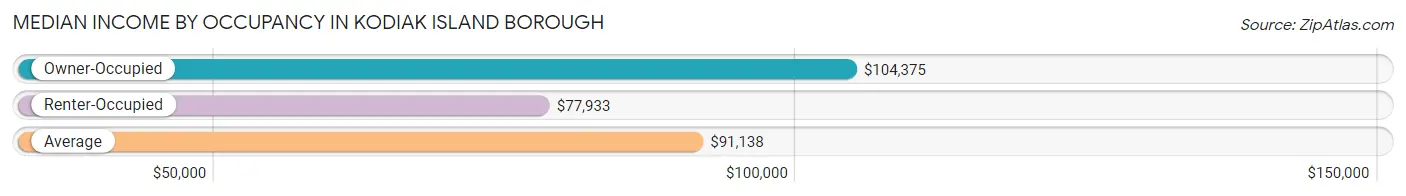
| Occupancy Type | # Households | Median Income |
| Owner-Occupied | 2,500 (56.6%) | $104,375 |
| Renter-Occupied | 1,915 (43.4%) | $77,933 |
| Average | 4,415 (100.0%) | $91,138 |
Occupancy by Householder Income Bracket in Kodiak Island Borough
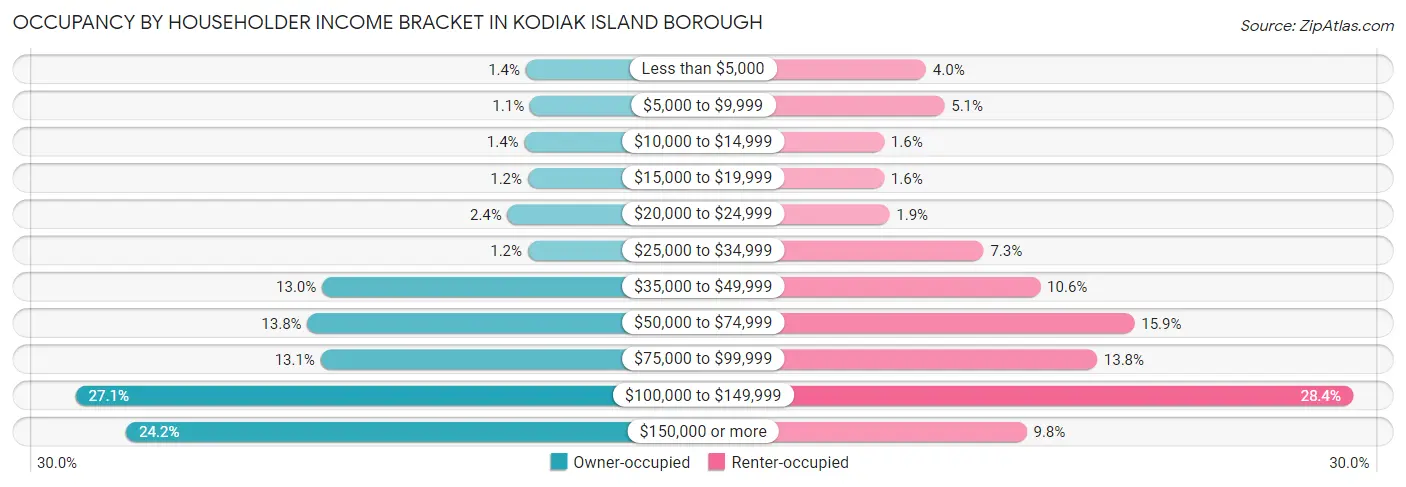
| Income Bracket | Owner-occupied | Renter-occupied |
| Less than $5,000 | 34 (1.4%) | 77 (4.0%) |
| $5,000 to $9,999 | 28 (1.1%) | 97 (5.1%) |
| $10,000 to $14,999 | 36 (1.4%) | 31 (1.6%) |
| $15,000 to $19,999 | 31 (1.2%) | 31 (1.6%) |
| $20,000 to $24,999 | 60 (2.4%) | 37 (1.9%) |
| $25,000 to $34,999 | 31 (1.2%) | 140 (7.3%) |
| $35,000 to $49,999 | 325 (13.0%) | 202 (10.5%) |
| $50,000 to $74,999 | 346 (13.8%) | 305 (15.9%) |
| $75,000 to $99,999 | 327 (13.1%) | 264 (13.8%) |
| $100,000 to $149,999 | 677 (27.1%) | 544 (28.4%) |
| $150,000 or more | 605 (24.2%) | 187 (9.8%) |
| Total | 2,500 (100.0%) | 1,915 (100.0%) |
Monthly Housing Cost Tiers in Kodiak Island Borough
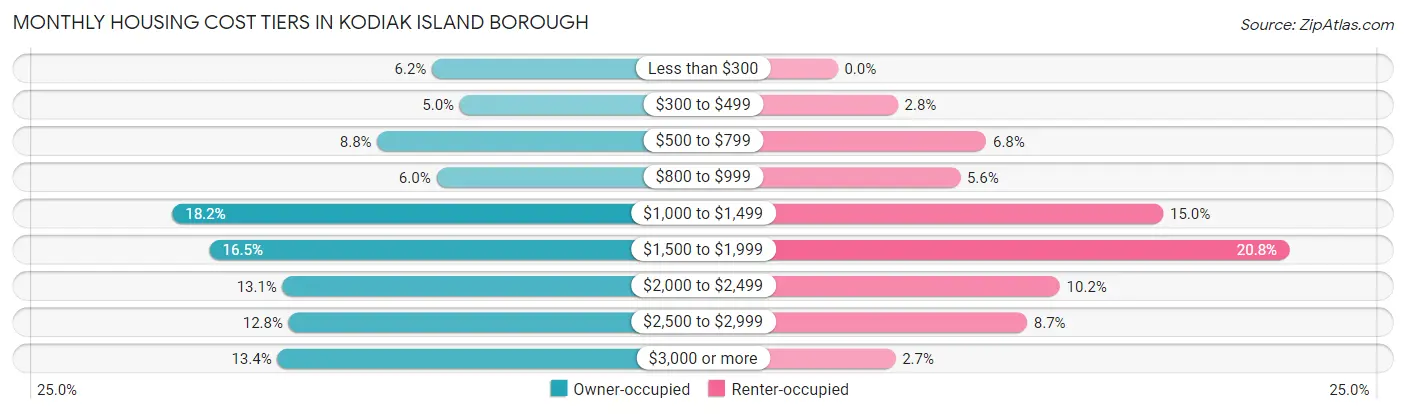
| Monthly Cost | Owner-occupied | Renter-occupied |
| Less than $300 | 156 (6.2%) | 0 (0.0%) |
| $300 to $499 | 124 (5.0%) | 53 (2.8%) |
| $500 to $799 | 219 (8.8%) | 131 (6.8%) |
| $800 to $999 | 151 (6.0%) | 108 (5.6%) |
| $1,000 to $1,499 | 455 (18.2%) | 287 (15.0%) |
| $1,500 to $1,999 | 412 (16.5%) | 398 (20.8%) |
| $2,000 to $2,499 | 328 (13.1%) | 196 (10.2%) |
| $2,500 to $2,999 | 321 (12.8%) | 167 (8.7%) |
| $3,000 or more | 334 (13.4%) | 51 (2.7%) |
| Total | 2,500 (100.0%) | 1,915 (100.0%) |
Physical Housing Characteristics in Kodiak Island Borough
Housing Structures in Kodiak Island Borough
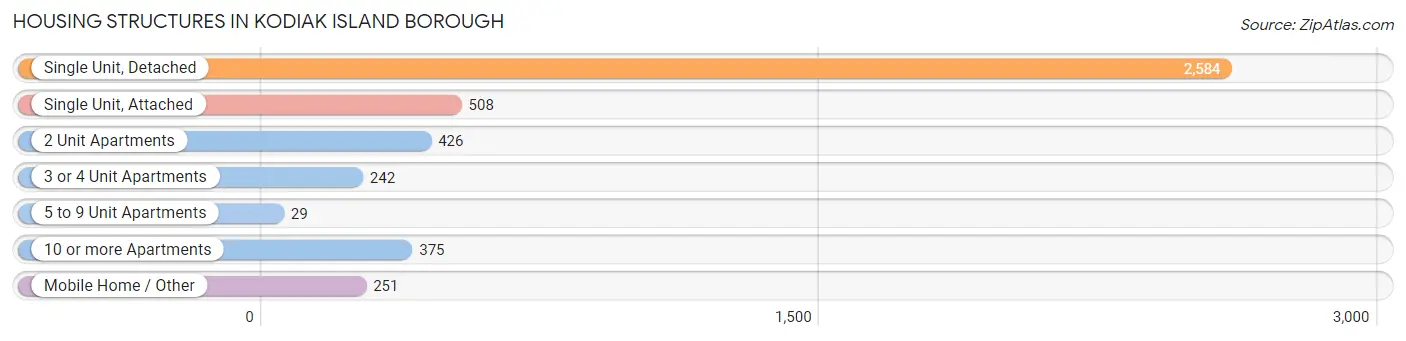
| Structure Type | # Housing Units | % Housing Units |
| Single Unit, Detached | 2,584 | 58.5% |
| Single Unit, Attached | 508 | 11.5% |
| 2 Unit Apartments | 426 | 9.7% |
| 3 or 4 Unit Apartments | 242 | 5.5% |
| 5 to 9 Unit Apartments | 29 | 0.7% |
| 10 or more Apartments | 375 | 8.5% |
| Mobile Home / Other | 251 | 5.7% |
| Total | 4,415 | 100.0% |
Housing Structures by Occupancy in Kodiak Island Borough
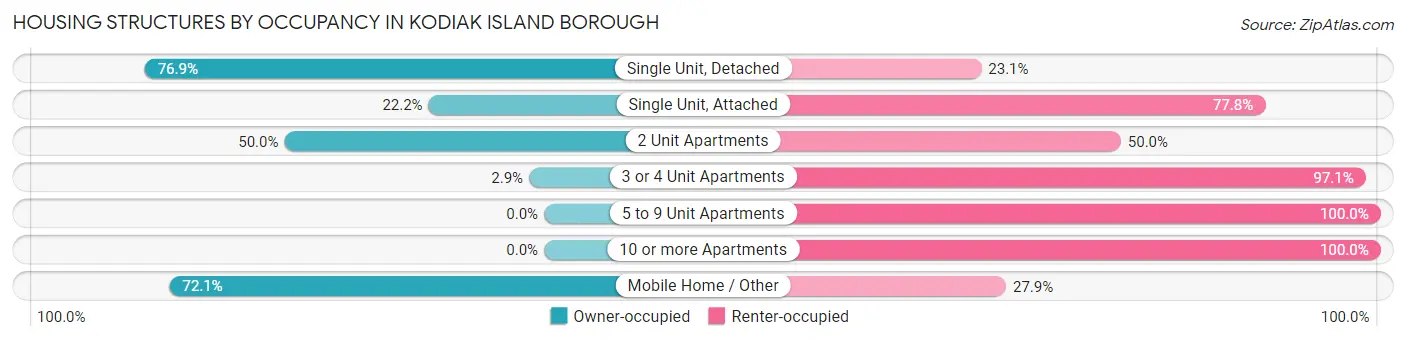
| Structure Type | Owner-occupied | Renter-occupied |
| Single Unit, Detached | 1,986 (76.9%) | 598 (23.1%) |
| Single Unit, Attached | 113 (22.2%) | 395 (77.8%) |
| 2 Unit Apartments | 213 (50.0%) | 213 (50.0%) |
| 3 or 4 Unit Apartments | 7 (2.9%) | 235 (97.1%) |
| 5 to 9 Unit Apartments | 0 (0.0%) | 29 (100.0%) |
| 10 or more Apartments | 0 (0.0%) | 375 (100.0%) |
| Mobile Home / Other | 181 (72.1%) | 70 (27.9%) |
| Total | 2,500 (56.6%) | 1,915 (43.4%) |
Housing Structures by Number of Rooms in Kodiak Island Borough
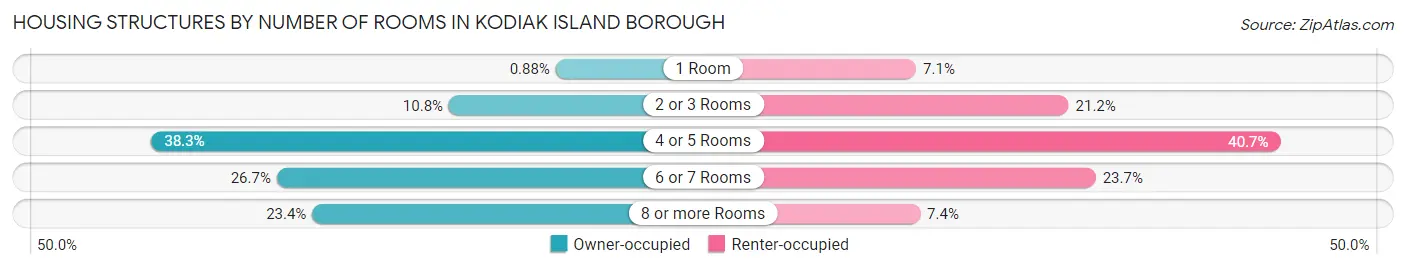
| Number of Rooms | Owner-occupied | Renter-occupied |
| 1 Room | 22 (0.9%) | 135 (7.0%) |
| 2 or 3 Rooms | 269 (10.8%) | 405 (21.1%) |
| 4 or 5 Rooms | 957 (38.3%) | 780 (40.7%) |
| 6 or 7 Rooms | 667 (26.7%) | 453 (23.7%) |
| 8 or more Rooms | 585 (23.4%) | 142 (7.4%) |
| Total | 2,500 (100.0%) | 1,915 (100.0%) |
Housing Structure by Heating Type in Kodiak Island Borough
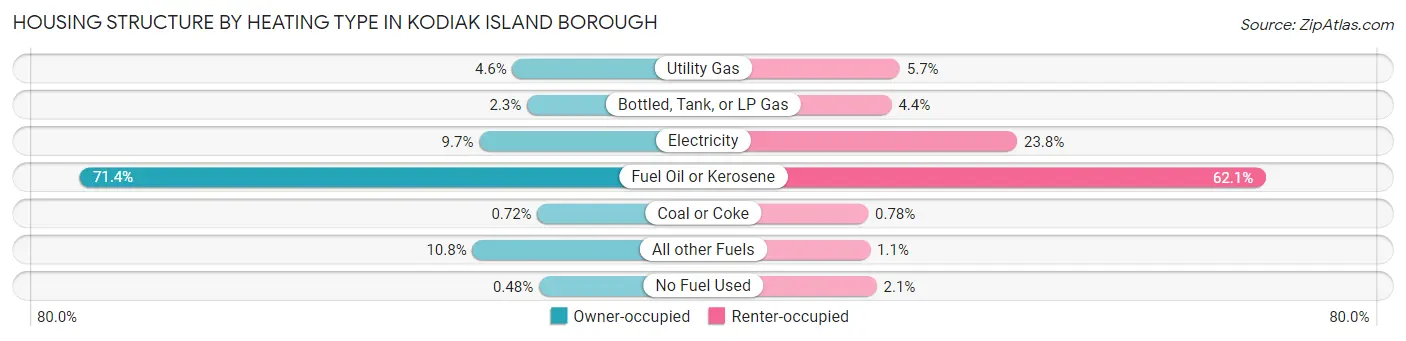
| Heating Type | Owner-occupied | Renter-occupied |
| Utility Gas | 114 (4.6%) | 109 (5.7%) |
| Bottled, Tank, or LP Gas | 58 (2.3%) | 84 (4.4%) |
| Electricity | 243 (9.7%) | 456 (23.8%) |
| Fuel Oil or Kerosene | 1,786 (71.4%) | 1,190 (62.1%) |
| Coal or Coke | 18 (0.7%) | 15 (0.8%) |
| All other Fuels | 269 (10.8%) | 21 (1.1%) |
| No Fuel Used | 12 (0.5%) | 40 (2.1%) |
| Total | 2,500 (100.0%) | 1,915 (100.0%) |
Household Vehicle Usage in Kodiak Island Borough
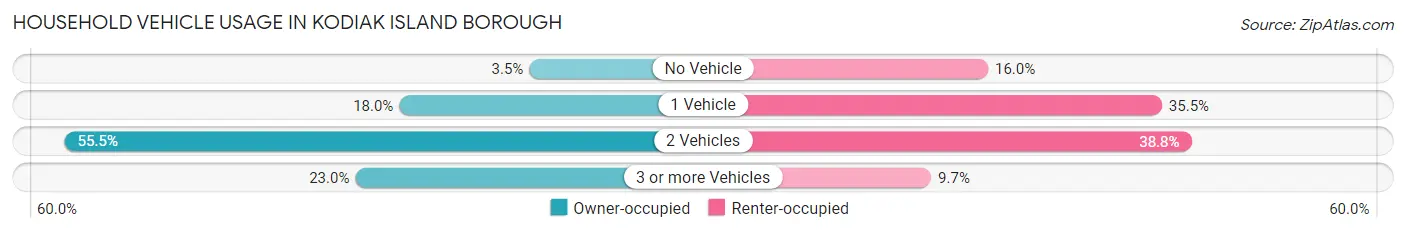
| Vehicles per Household | Owner-occupied | Renter-occupied |
| No Vehicle | 87 (3.5%) | 307 (16.0%) |
| 1 Vehicle | 451 (18.0%) | 680 (35.5%) |
| 2 Vehicles | 1,388 (55.5%) | 743 (38.8%) |
| 3 or more Vehicles | 574 (23.0%) | 185 (9.7%) |
| Total | 2,500 (100.0%) | 1,915 (100.0%) |
Real Estate & Mortgages in Kodiak Island Borough
Real Estate and Mortgage Overview in Kodiak Island Borough
| Characteristic | Without Mortgage | With Mortgage |
| Housing Units | 757 | 1,743 |
| Median Property Value | $242,100 | $402,100 |
| Median Household Income | $58,690 | $455 |
| Monthly Housing Costs | $646 | $334 |
| Real Estate Taxes | $2,482 | $49 |
Property Value by Mortgage Status in Kodiak Island Borough
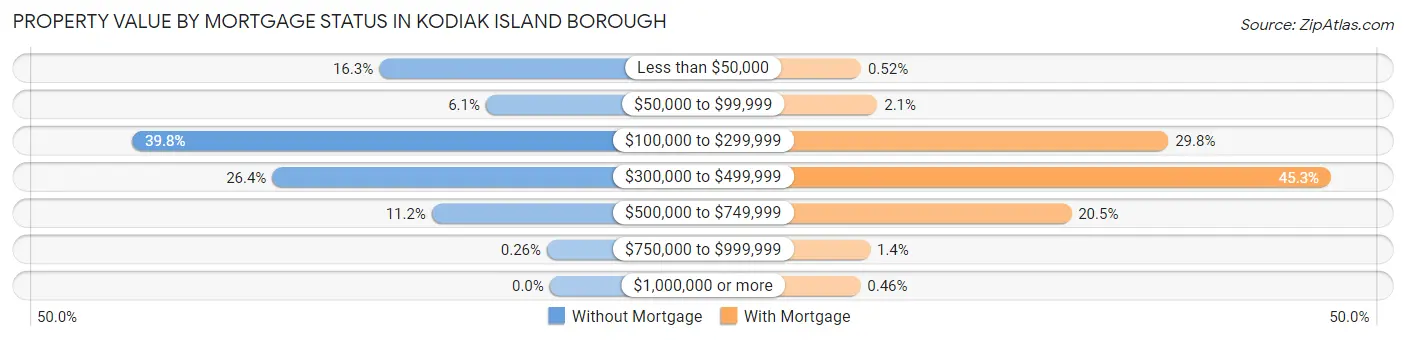
| Property Value | Without Mortgage | With Mortgage |
| Less than $50,000 | 123 (16.3%) | 9 (0.5%) |
| $50,000 to $99,999 | 46 (6.1%) | 36 (2.1%) |
| $100,000 to $299,999 | 301 (39.8%) | 519 (29.8%) |
| $300,000 to $499,999 | 200 (26.4%) | 789 (45.3%) |
| $500,000 to $749,999 | 85 (11.2%) | 358 (20.5%) |
| $750,000 to $999,999 | 2 (0.3%) | 24 (1.4%) |
| $1,000,000 or more | 0 (0.0%) | 8 (0.5%) |
| Total | 757 (100.0%) | 1,743 (100.0%) |
Household Income by Mortgage Status in Kodiak Island Borough
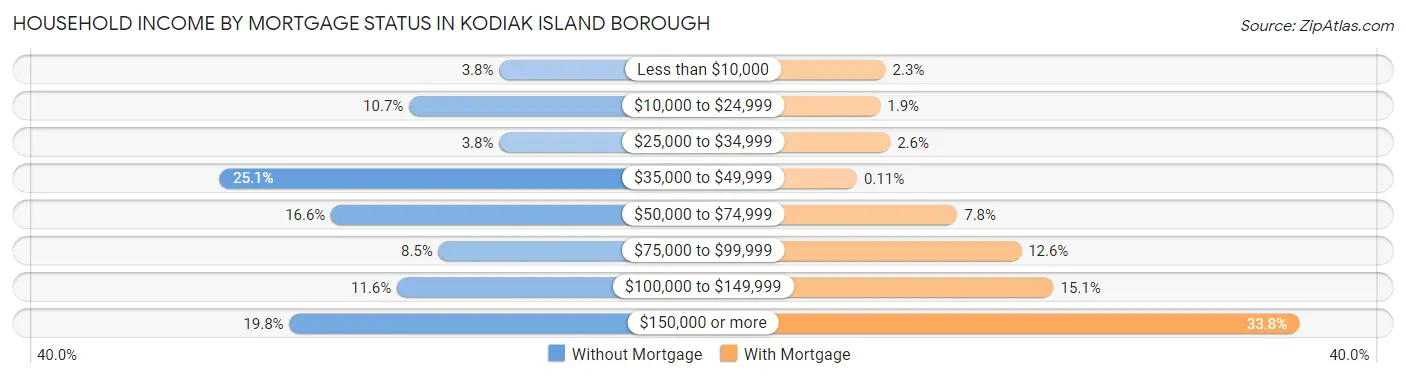
| Household Income | Without Mortgage | With Mortgage |
| Less than $10,000 | 29 (3.8%) | 40 (2.3%) |
| $10,000 to $24,999 | 81 (10.7%) | 33 (1.9%) |
| $25,000 to $34,999 | 29 (3.8%) | 46 (2.6%) |
| $35,000 to $49,999 | 190 (25.1%) | 2 (0.1%) |
| $50,000 to $74,999 | 126 (16.6%) | 135 (7.7%) |
| $75,000 to $99,999 | 64 (8.5%) | 220 (12.6%) |
| $100,000 to $149,999 | 88 (11.6%) | 263 (15.1%) |
| $150,000 or more | 150 (19.8%) | 589 (33.8%) |
| Total | 757 (100.0%) | 1,743 (100.0%) |
Property Value to Household Income Ratio in Kodiak Island Borough
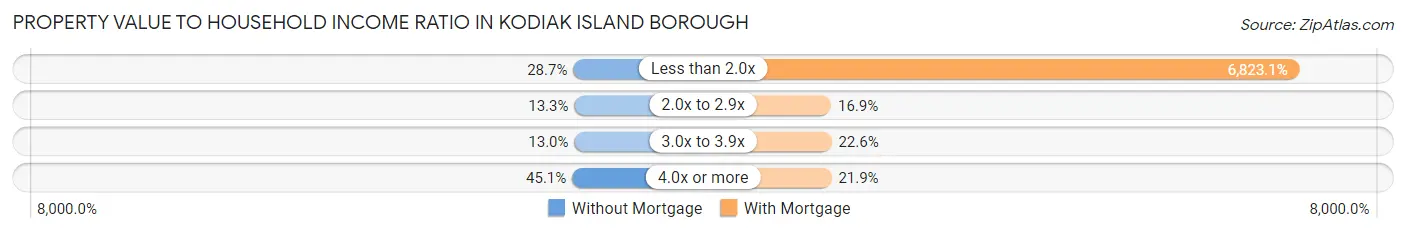
| Value-to-Income Ratio | Without Mortgage | With Mortgage |
| Less than 2.0x | 217 (28.7%) | 118,927 (6,823.1%) |
| 2.0x to 2.9x | 101 (13.3%) | 294 (16.9%) |
| 3.0x to 3.9x | 98 (13.0%) | 394 (22.6%) |
| 4.0x or more | 341 (45.1%) | 382 (21.9%) |
| Total | 757 (100.0%) | 1,743 (100.0%) |
Real Estate Taxes by Mortgage Status in Kodiak Island Borough
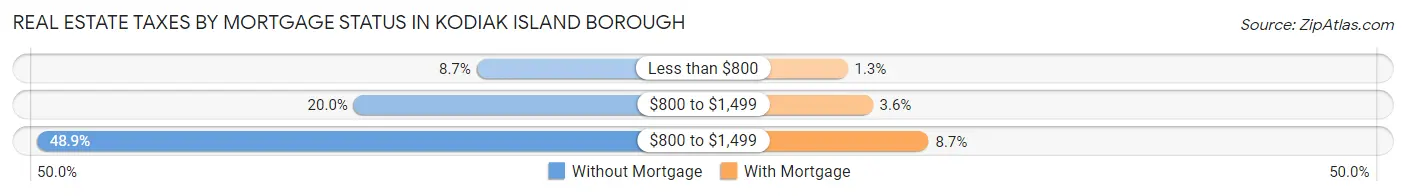
| Property Taxes | Without Mortgage | With Mortgage |
| Less than $800 | 66 (8.7%) | 23 (1.3%) |
| $800 to $1,499 | 151 (20.0%) | 63 (3.6%) |
| $800 to $1,499 | 370 (48.9%) | 152 (8.7%) |
| Total | 757 (100.0%) | 1,743 (100.0%) |
Health & Disability in Kodiak Island Borough
Health Insurance Coverage by Age in Kodiak Island Borough
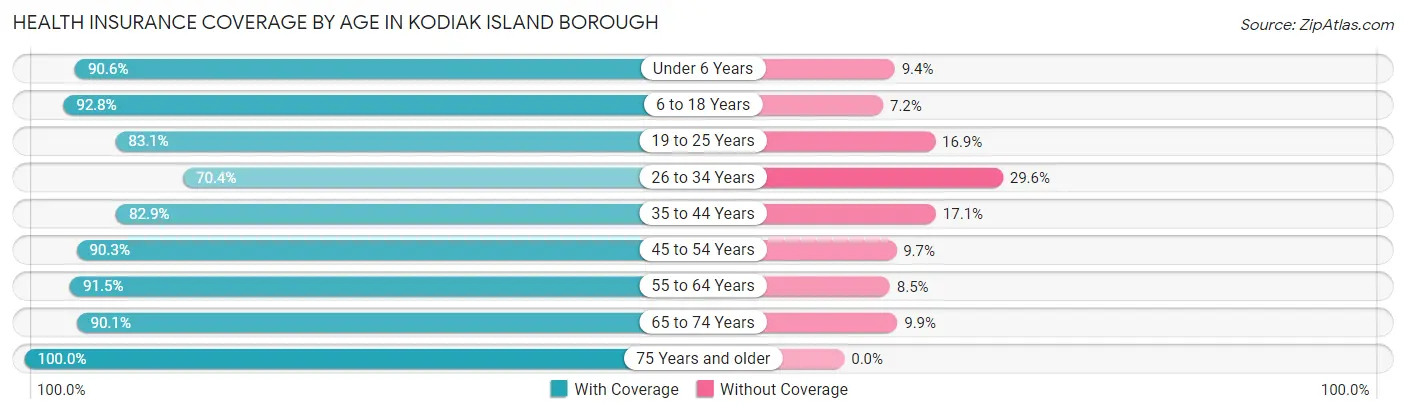
| Age Bracket | With Coverage | Without Coverage |
| Under 6 Years | 964 (90.6%) | 100 (9.4%) |
| 6 to 18 Years | 2,070 (92.8%) | 161 (7.2%) |
| 19 to 25 Years | 854 (83.1%) | 174 (16.9%) |
| 26 to 34 Years | 1,115 (70.4%) | 468 (29.6%) |
| 35 to 44 Years | 1,418 (82.9%) | 292 (17.1%) |
| 45 to 54 Years | 1,054 (90.3%) | 113 (9.7%) |
| 55 to 64 Years | 1,562 (91.5%) | 145 (8.5%) |
| 65 to 74 Years | 967 (90.1%) | 106 (9.9%) |
| 75 Years and older | 505 (100.0%) | 0 (0.0%) |
| Total | 10,509 (87.1%) | 1,559 (12.9%) |
Health Insurance Coverage by Citizenship Status in Kodiak Island Borough
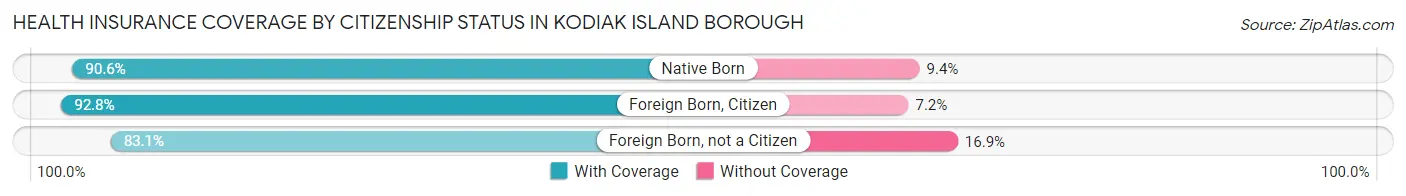
| Citizenship Status | With Coverage | Without Coverage |
| Native Born | 964 (90.6%) | 100 (9.4%) |
| Foreign Born, Citizen | 2,070 (92.8%) | 161 (7.2%) |
| Foreign Born, not a Citizen | 854 (83.1%) | 174 (16.9%) |
Health Insurance Coverage by Household Income in Kodiak Island Borough
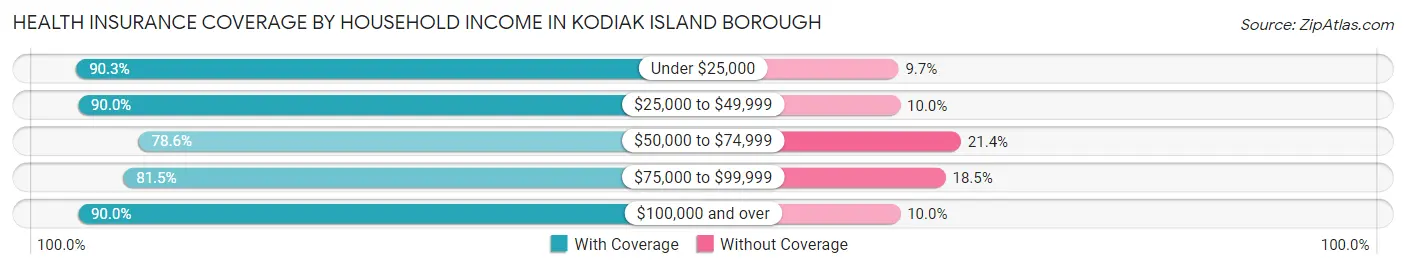
| Household Income | With Coverage | Without Coverage |
| Under $25,000 | 560 (90.3%) | 60 (9.7%) |
| $25,000 to $49,999 | 1,279 (90.0%) | 142 (10.0%) |
| $50,000 to $74,999 | 1,460 (78.6%) | 397 (21.4%) |
| $75,000 to $99,999 | 1,150 (81.5%) | 261 (18.5%) |
| $100,000 and over | 5,922 (90.0%) | 659 (10.0%) |
Public vs Private Health Insurance Coverage by Age in Kodiak Island Borough
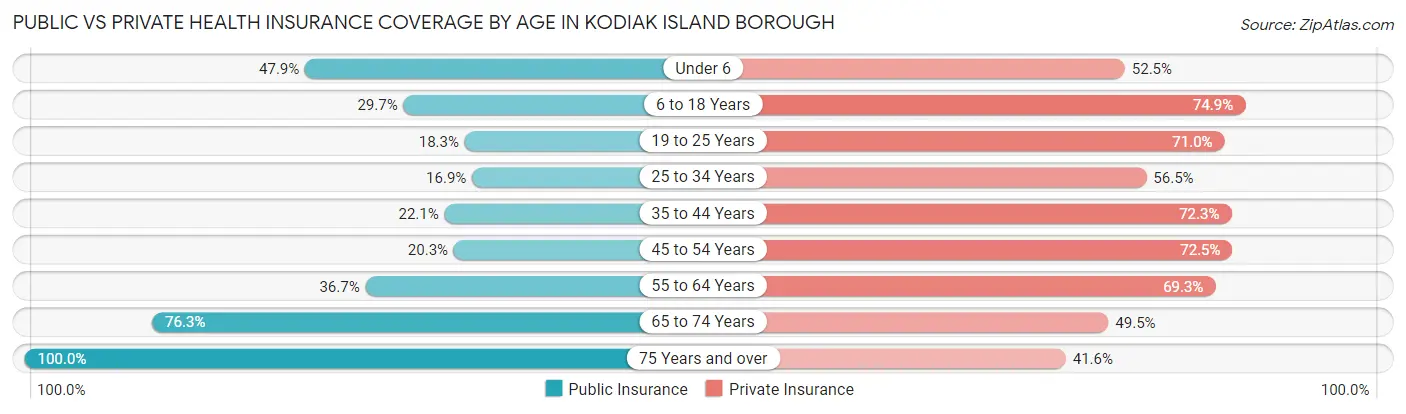
| Age Bracket | Public Insurance | Private Insurance |
| Under 6 | 510 (47.9%) | 559 (52.5%) |
| 6 to 18 Years | 662 (29.7%) | 1,670 (74.9%) |
| 19 to 25 Years | 188 (18.3%) | 730 (71.0%) |
| 25 to 34 Years | 268 (16.9%) | 895 (56.5%) |
| 35 to 44 Years | 377 (22.1%) | 1,236 (72.3%) |
| 45 to 54 Years | 237 (20.3%) | 846 (72.5%) |
| 55 to 64 Years | 627 (36.7%) | 1,183 (69.3%) |
| 65 to 74 Years | 819 (76.3%) | 531 (49.5%) |
| 75 Years and over | 505 (100.0%) | 210 (41.6%) |
| Total | 4,193 (34.7%) | 7,860 (65.1%) |
Disability Status by Sex by Age in Kodiak Island Borough
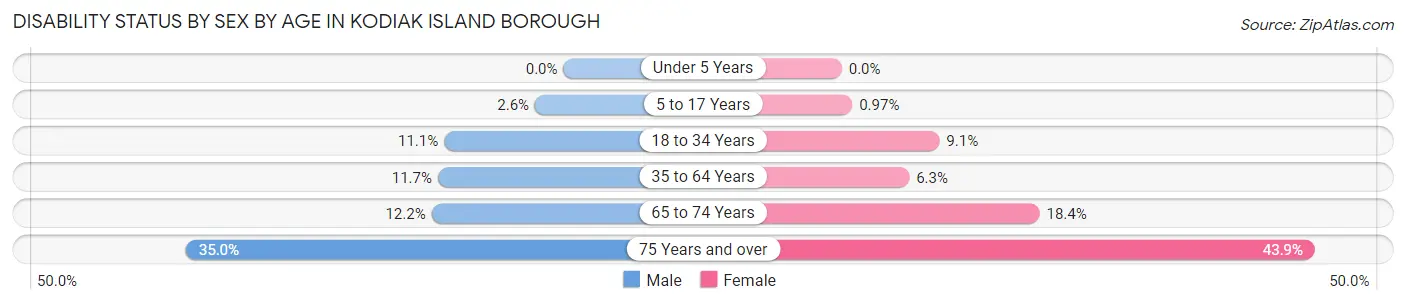
| Age Bracket | Male | Female |
| Under 5 Years | 0 (0.0%) | 0 (0.0%) |
| 5 to 17 Years | 31 (2.6%) | 11 (1.0%) |
| 18 to 34 Years | 153 (11.1%) | 126 (9.1%) |
| 35 to 64 Years | 281 (11.7%) | 136 (6.3%) |
| 65 to 74 Years | 72 (12.2%) | 89 (18.3%) |
| 75 Years and over | 62 (35.0%) | 144 (43.9%) |
Disability Class by Sex by Age in Kodiak Island Borough
Disability Class: Hearing Difficulty
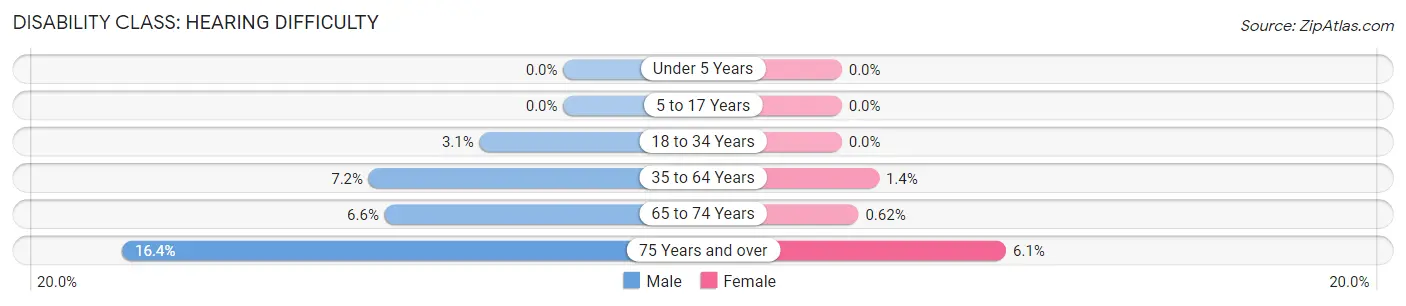
| Age Bracket | Male | Female |
| Under 5 Years | 0 (0.0%) | 0 (0.0%) |
| 5 to 17 Years | 0 (0.0%) | 0 (0.0%) |
| 18 to 34 Years | 43 (3.1%) | 0 (0.0%) |
| 35 to 64 Years | 174 (7.2%) | 30 (1.4%) |
| 65 to 74 Years | 39 (6.6%) | 3 (0.6%) |
| 75 Years and over | 29 (16.4%) | 20 (6.1%) |
Disability Class: Vision Difficulty
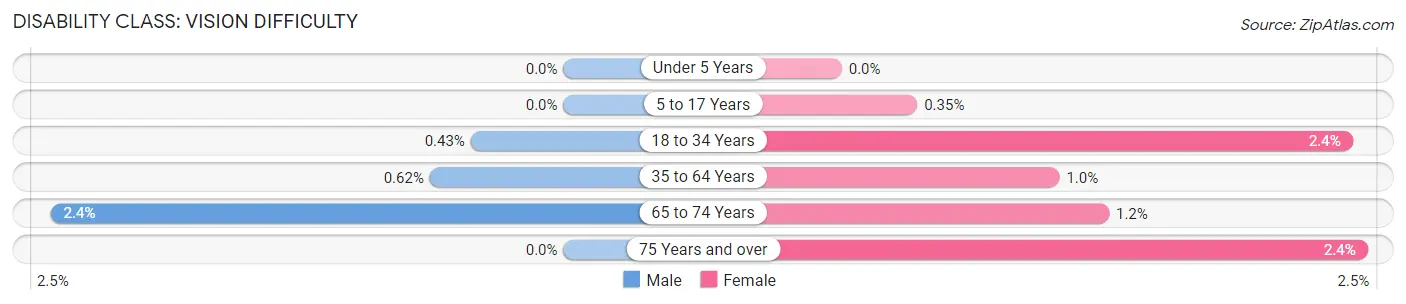
| Age Bracket | Male | Female |
| Under 5 Years | 0 (0.0%) | 0 (0.0%) |
| 5 to 17 Years | 0 (0.0%) | 4 (0.4%) |
| 18 to 34 Years | 6 (0.4%) | 33 (2.4%) |
| 35 to 64 Years | 15 (0.6%) | 22 (1.0%) |
| 65 to 74 Years | 14 (2.4%) | 6 (1.2%) |
| 75 Years and over | 0 (0.0%) | 8 (2.4%) |
Disability Class: Cognitive Difficulty
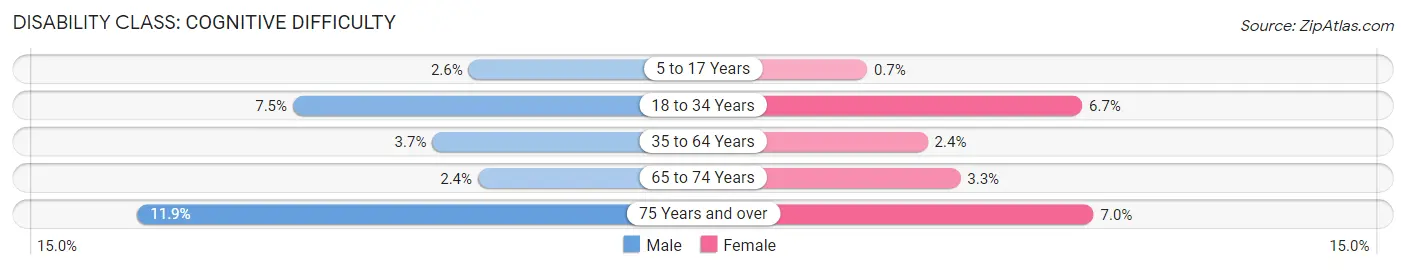
| Age Bracket | Male | Female |
| 5 to 17 Years | 31 (2.6%) | 8 (0.7%) |
| 18 to 34 Years | 104 (7.5%) | 93 (6.7%) |
| 35 to 64 Years | 88 (3.6%) | 52 (2.4%) |
| 65 to 74 Years | 14 (2.4%) | 16 (3.3%) |
| 75 Years and over | 21 (11.9%) | 23 (7.0%) |
Disability Class: Ambulatory Difficulty
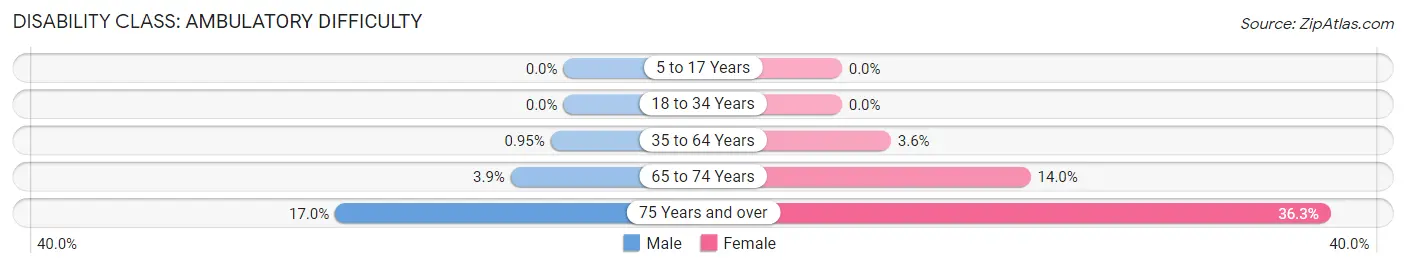
| Age Bracket | Male | Female |
| 5 to 17 Years | 0 (0.0%) | 0 (0.0%) |
| 18 to 34 Years | 0 (0.0%) | 0 (0.0%) |
| 35 to 64 Years | 23 (0.9%) | 79 (3.6%) |
| 65 to 74 Years | 23 (3.9%) | 68 (14.0%) |
| 75 Years and over | 30 (17.0%) | 119 (36.3%) |
Disability Class: Self-Care Difficulty
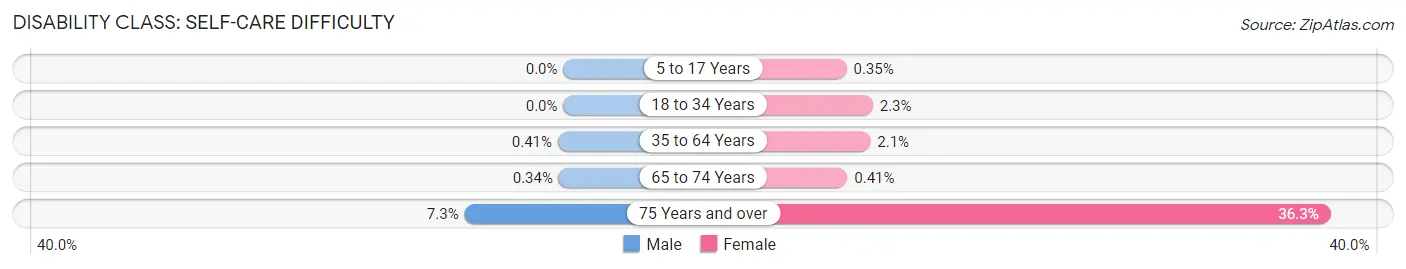
| Age Bracket | Male | Female |
| 5 to 17 Years | 0 (0.0%) | 4 (0.4%) |
| 18 to 34 Years | 0 (0.0%) | 32 (2.3%) |
| 35 to 64 Years | 10 (0.4%) | 46 (2.1%) |
| 65 to 74 Years | 2 (0.3%) | 2 (0.4%) |
| 75 Years and over | 13 (7.3%) | 119 (36.3%) |
Technology Access in Kodiak Island Borough
Computing Device Access in Kodiak Island Borough
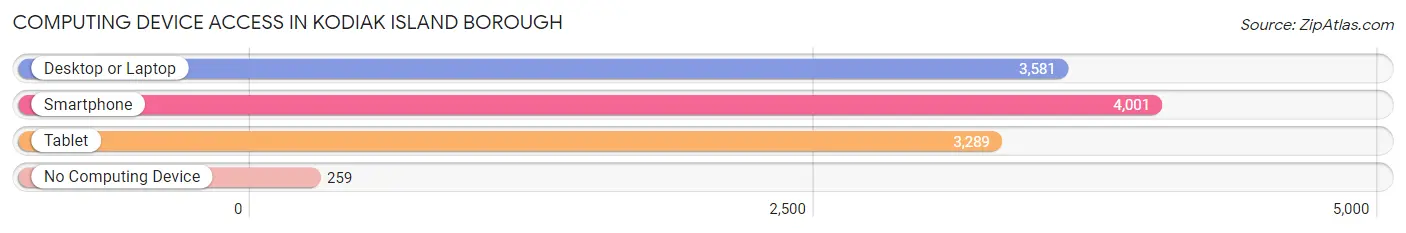
| Device Type | # Households | % Households |
| Desktop or Laptop | 3,581 | 81.1% |
| Smartphone | 4,001 | 90.6% |
| Tablet | 3,289 | 74.5% |
| No Computing Device | 259 | 5.9% |
| Total | 4,415 | 100.0% |
Internet Access in Kodiak Island Borough
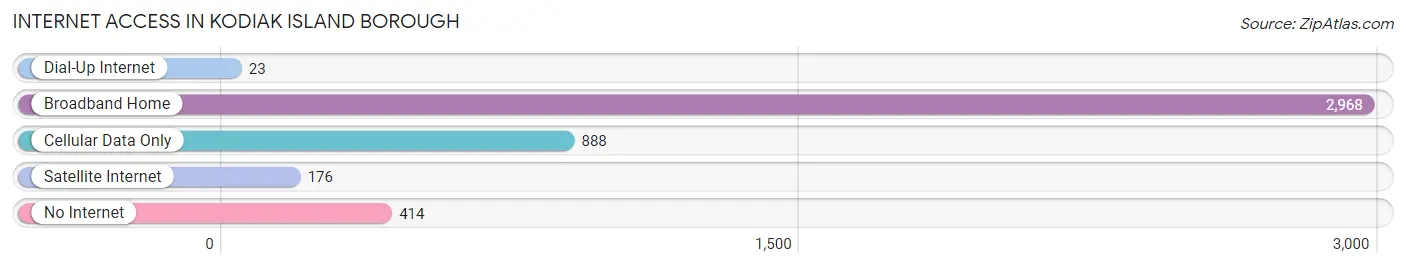
| Internet Type | # Households | % Households |
| Dial-Up Internet | 23 | 0.5% |
| Broadband Home | 2,968 | 67.2% |
| Cellular Data Only | 888 | 20.1% |
| Satellite Internet | 176 | 4.0% |
| No Internet | 414 | 9.4% |
| Total | 4,415 | 100.0% |
Kodiak Island Borough Summary
Kodiak Island Borough is located in the Gulf of Alaska, off the coast of the state of Alaska. It is the second largest borough in the state, covering an area of 6,921 square miles. The borough is home to a population of 13,942 people, as of the 2010 census.
Geography
Kodiak Island Borough is located in the Gulf of Alaska, off the coast of the state of Alaska. It is the second largest borough in the state, covering an area of 6,921 square miles. The borough is made up of two main islands, Kodiak Island and Afognak Island, as well as several smaller islands. The terrain of the borough is mostly mountainous, with the highest point being Mount Chiginagak, at an elevation of 4,716 feet. The climate of the borough is generally mild, with temperatures ranging from the mid-30s in the winter to the mid-60s in the summer.
History
Kodiak Island has been inhabited by humans for thousands of years. The first known inhabitants were the Alutiiq people, who have lived in the area for at least 7,000 years. The first Europeans to visit the island were Russian explorers in 1763. The Russians established a fur trading post on the island, and the Alutiiq people were forced to work as laborers for the Russians. In 1867, the United States purchased Alaska from Russia, and the island became part of the United States. In 1912, the Alaska Territorial Legislature created the Kodiak Island Borough, which was officially incorporated in 1963.
Economy
Kodiak Island Borough’s economy is largely based on fishing and tourism. The fishing industry is the largest employer in the borough, with the majority of the jobs being in the commercial fishing industry. The borough is also home to several seafood processing plants, which process and package fish for sale. Tourism is also an important part of the borough’s economy, with visitors coming to the area to take advantage of the borough’s natural beauty and outdoor activities. The borough is also home to several military bases, which provide jobs for local residents.
Demographics
As of the 2010 census, the population of Kodiak Island Borough was 13,942. The population is largely made up of Native Americans, with the largest group being the Alutiiq people, who make up about 40% of the population. The borough is also home to a large number of immigrants, with the largest group being Filipino Americans, who make up about 10% of the population. The median household income in the borough is $63,945, and the median age is 37.
Kodiak Island Borough is a unique and beautiful place, with a rich history and culture. The borough’s economy is largely based on fishing and tourism, and the population is largely made up of Native Americans and immigrants. The borough is home to a variety of outdoor activities, and is a popular destination for visitors from all over the world.
Common Questions
What is the Total Population of Kodiak Island Borough?
Total Population of Kodiak Island Borough is 13,065.
What is the Total Male Population of Kodiak Island Borough?
Total Male Population of Kodiak Island Borough is 6,991.
What is the Total Female Population of Kodiak Island Borough?
Total Female Population of Kodiak Island Borough is 6,074.
What is the Ratio of Males per 100 Females in Kodiak Island Borough?
There are 115.10 Males per 100 Females in Kodiak Island Borough.
What is the Ratio of Females per 100 Males in Kodiak Island Borough?
There are 86.88 Females per 100 Males in Kodiak Island Borough.
What is the Median Population Age in Kodiak Island Borough?
Median Population Age in Kodiak Island Borough is 35.1 Years.
What is the Average Family Size in Kodiak Island Borough
Average Family Size in Kodiak Island Borough is 3.4 People.
What is the Average Household Size in Kodiak Island Borough
Average Household Size in Kodiak Island Borough is 2.9 People.
What is Per Capita Income in Kodiak Island Borough?
Per Capita income in Kodiak Island Borough is $39,563.
What is the Median Family Income in Kodiak Island Borough?
Median Family Income in Kodiak Island Borough is $104,276.
What is the Median Household income in Kodiak Island Borough?
Median Household Income in Kodiak Island Borough is $91,138.
What is Income or Wage Gap in Kodiak Island Borough?
Income or Wage Gap in Kodiak Island Borough is 5.7%.
Women in Kodiak Island Borough earn 94.3 cents for every dollar earned by a man.
What is Inequality or Gini Index in Kodiak Island Borough?
Inequality or Gini Index in Kodiak Island Borough is 0.40.
How Large is the Labor Force in Kodiak Island Borough?
There are 7,468 People in the Labor Forcein in Kodiak Island Borough.
What is the Percentage of People in the Labor Force in Kodiak Island Borough?
73.5% of People are in the Labor Force in Kodiak Island Borough.
What is the Unemployment Rate in Kodiak Island Borough?
Unemployment Rate in Kodiak Island Borough is 5.7%.