Ketchikan Gateway Borough, AK
Ketchikan Gateway Borough Map
Ketchikan Gateway Borough Overview
13,910
TOTAL POPULATION
7,232
MALE POPULATION
6,678
FEMALE POPULATION
108.30
MALES / 100 FEMALES
92.34
FEMALES / 100 MALES
40.6
MEDIAN AGE
3.0
AVG FAMILY SIZE
2.5
AVG HOUSEHOLD SIZE
$44,368
PER CAPITA INCOME
$105,493
AVG FAMILY INCOME
$82,763
AVG HOUSEHOLD INCOME
31.7%
WAGE / INCOME GAP [ % ]
68.3¢/ $1
WAGE / INCOME GAP [ $ ]
0.44
INEQUALITY / GINI INDEX
7,480
LABOR FORCE [ PEOPLE ]
66.0%
PERCENT IN LABOR FORCE
4.1%
UNEMPLOYMENT RATE
Ketchikan Gateway Borough Area Codes
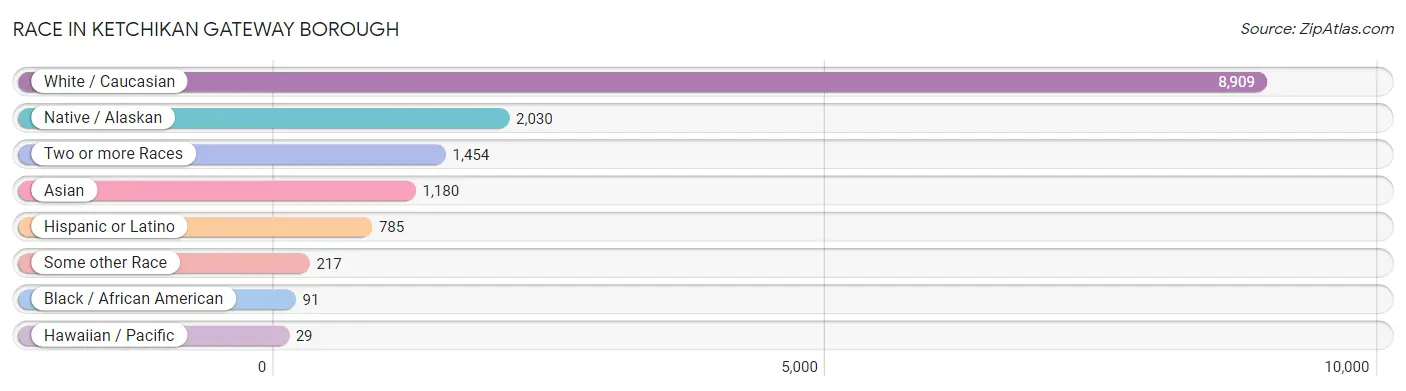
Race in Ketchikan Gateway Borough
The most populous races in Ketchikan Gateway Borough are White / Caucasian (8,909 | 64.0%), Native / Alaskan (2,030 | 14.6%), and Two or more Races (1,454 | 10.4%).
| Race | # Population | % Population |
| Asian | 1,180 | 8.5% |
| Black / African American | 91 | 0.6% |
| Hawaiian / Pacific | 29 | 0.2% |
| Hispanic or Latino | 785 | 5.6% |
| Native / Alaskan | 2,030 | 14.6% |
| White / Caucasian | 8,909 | 64.0% |
| Two or more Races | 1,454 | 10.4% |
| Some other Race | 217 | 1.6% |
| Total | 13,910 | 100.0% |
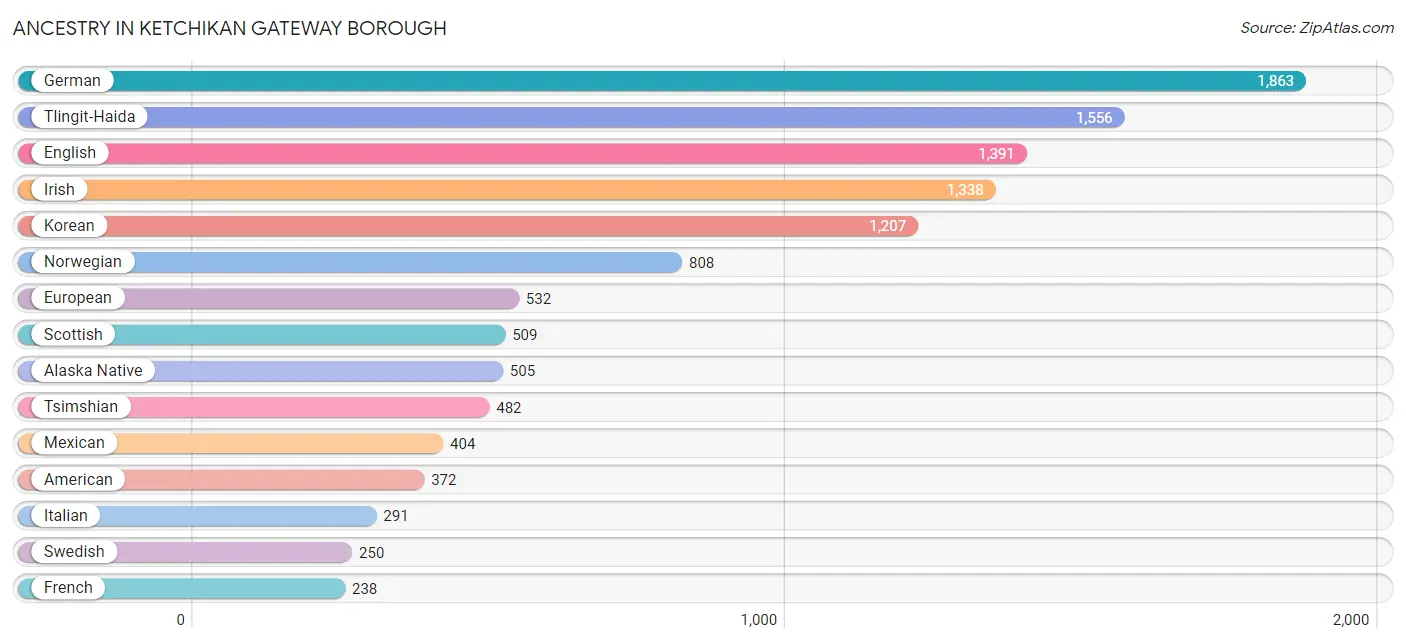
Ancestry in Ketchikan Gateway Borough
The most populous ancestries reported in Ketchikan Gateway Borough are German (1,863 | 13.4%), Tlingit-Haida (1,556 | 11.2%), English (1,391 | 10.0%), Irish (1,338 | 9.6%), and Korean (1,207 | 8.7%), together accounting for 52.9% of all Ketchikan Gateway Borough residents.
| Ancestry | # Population | % Population |
| African | 36 | 0.3% |
| Alaska Native | 505 | 3.6% |
| Alaskan Athabascan | 34 | 0.2% |
| Albanian | 30 | 0.2% |
| Aleut | 155 | 1.1% |
| American | 372 | 2.7% |
| Apache | 17 | 0.1% |
| Arab | 11 | 0.1% |
| Armenian | 4 | 0.0% |
| Australian | 17 | 0.1% |
| Austrian | 22 | 0.2% |
| Belgian | 29 | 0.2% |
| Bhutanese | 20 | 0.1% |
| Blackfeet | 37 | 0.3% |
| British | 160 | 1.1% |
| Burmese | 27 | 0.2% |
| Canadian | 50 | 0.4% |
| Central American | 48 | 0.4% |
| Cherokee | 92 | 0.7% |
| Cheyenne | 6 | 0.0% |
| Chippewa | 26 | 0.2% |
| Colombian | 28 | 0.2% |
| Creek | 6 | 0.0% |
| Croatian | 5 | 0.0% |
| Cuban | 46 | 0.3% |
| Czech | 37 | 0.3% |
| Czechoslovakian | 4 | 0.0% |
| Danish | 75 | 0.5% |
| Dutch | 112 | 0.8% |
| Eastern European | 17 | 0.1% |
| English | 1,391 | 10.0% |
| European | 532 | 3.8% |
| Finnish | 115 | 0.8% |
| French | 238 | 1.7% |
| French American Indian | 15 | 0.1% |
| French Canadian | 56 | 0.4% |
| German | 1,863 | 13.4% |
| Greek | 14 | 0.1% |
| Guatemalan | 21 | 0.2% |
| Hungarian | 56 | 0.4% |
| Icelander | 14 | 0.1% |
| Indian (Asian) | 14 | 0.1% |
| Inupiat | 66 | 0.5% |
| Irish | 1,338 | 9.6% |
| Iroquois | 5 | 0.0% |
| Italian | 291 | 2.1% |
| Korean | 1,207 | 8.7% |
| Laotian | 7 | 0.1% |
| Lebanese | 11 | 0.1% |
| Lithuanian | 10 | 0.1% |
| Luxembourger | 4 | 0.0% |
| Mexican | 404 | 2.9% |
| Native Hawaiian | 23 | 0.2% |
| Navajo | 6 | 0.0% |
| Nigerian | 15 | 0.1% |
| Northern European | 44 | 0.3% |
| Norwegian | 808 | 5.8% |
| Paiute | 10 | 0.1% |
| Pakistani | 7 | 0.1% |
| Pennsylvania German | 7 | 0.1% |
| Peruvian | 85 | 0.6% |
| Polish | 194 | 1.4% |
| Portuguese | 68 | 0.5% |
| Puerto Rican | 70 | 0.5% |
| Puget Sound Salish | 2 | 0.0% |
| Russian | 72 | 0.5% |
| Salvadoran | 27 | 0.2% |
| Samoan | 28 | 0.2% |
| Scandinavian | 237 | 1.7% |
| Scotch-Irish | 184 | 1.3% |
| Scottish | 509 | 3.7% |
| Seminole | 1 | 0.0% |
| Sioux | 24 | 0.2% |
| Slovene | 13 | 0.1% |
| South African | 18 | 0.1% |
| South American | 113 | 0.8% |
| South American Indian | 6 | 0.0% |
| Spaniard | 8 | 0.1% |
| Spanish | 36 | 0.3% |
| Sri Lankan | 47 | 0.3% |
| Subsaharan African | 69 | 0.5% |
| Swedish | 250 | 1.8% |
| Swiss | 16 | 0.1% |
| Thai | 62 | 0.4% |
| Tlingit-Haida | 1,556 | 11.2% |
| Tsimshian | 482 | 3.5% |
| Ukrainian | 7 | 0.1% |
| Welsh | 157 | 1.1% |
| West Indian | 22 | 0.2% |
| Yaqui | 25 | 0.2% |
| Yup'ik | 20 | 0.1% | View All 91 Rows |
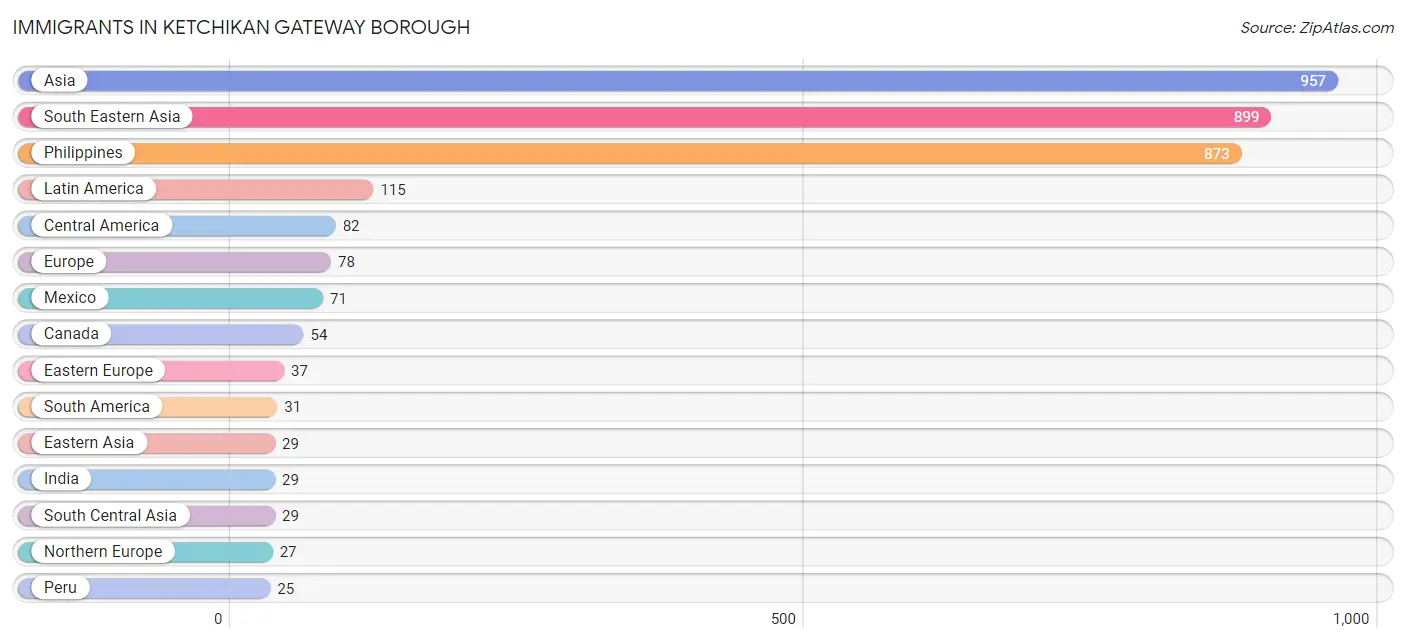
Immigrants in Ketchikan Gateway Borough
The most numerous immigrant groups reported in Ketchikan Gateway Borough came from Asia (957 | 6.9%), South Eastern Asia (899 | 6.5%), Philippines (873 | 6.3%), Latin America (115 | 0.8%), and Central America (82 | 0.6%), together accounting for 21.0% of all Ketchikan Gateway Borough residents.
| Immigration Origin | # Population | % Population |
| Africa | 21 | 0.2% |
| Asia | 957 | 6.9% |
| Australia | 6 | 0.0% |
| Canada | 54 | 0.4% |
| Caribbean | 2 | 0.0% |
| Central America | 82 | 0.6% |
| China | 7 | 0.1% |
| Colombia | 1 | 0.0% |
| Cuba | 1 | 0.0% |
| Eastern Africa | 2 | 0.0% |
| Eastern Asia | 29 | 0.2% |
| Eastern Europe | 37 | 0.3% |
| Europe | 78 | 0.6% |
| Germany | 7 | 0.1% |
| Guatemala | 11 | 0.1% |
| India | 29 | 0.2% |
| Ireland | 5 | 0.0% |
| Italy | 4 | 0.0% |
| Jamaica | 1 | 0.0% |
| Japan | 16 | 0.1% |
| Korea | 6 | 0.0% |
| Latin America | 115 | 0.8% |
| Mexico | 71 | 0.5% |
| Netherlands | 3 | 0.0% |
| Nigeria | 10 | 0.1% |
| North Macedonia | 24 | 0.2% |
| Northern Europe | 27 | 0.2% |
| Oceania | 21 | 0.2% |
| Peru | 25 | 0.2% |
| Philippines | 873 | 6.3% |
| Romania | 5 | 0.0% |
| Russia | 4 | 0.0% |
| South Africa | 9 | 0.1% |
| South America | 31 | 0.2% |
| South Central Asia | 29 | 0.2% |
| South Eastern Asia | 899 | 6.5% |
| Southern Europe | 4 | 0.0% |
| Thailand | 20 | 0.1% |
| Vietnam | 6 | 0.0% |
| Western Africa | 10 | 0.1% |
| Western Europe | 10 | 0.1% |
| Zimbabwe | 2 | 0.0% | View All 42 Rows |
Sex and Age in Ketchikan Gateway Borough
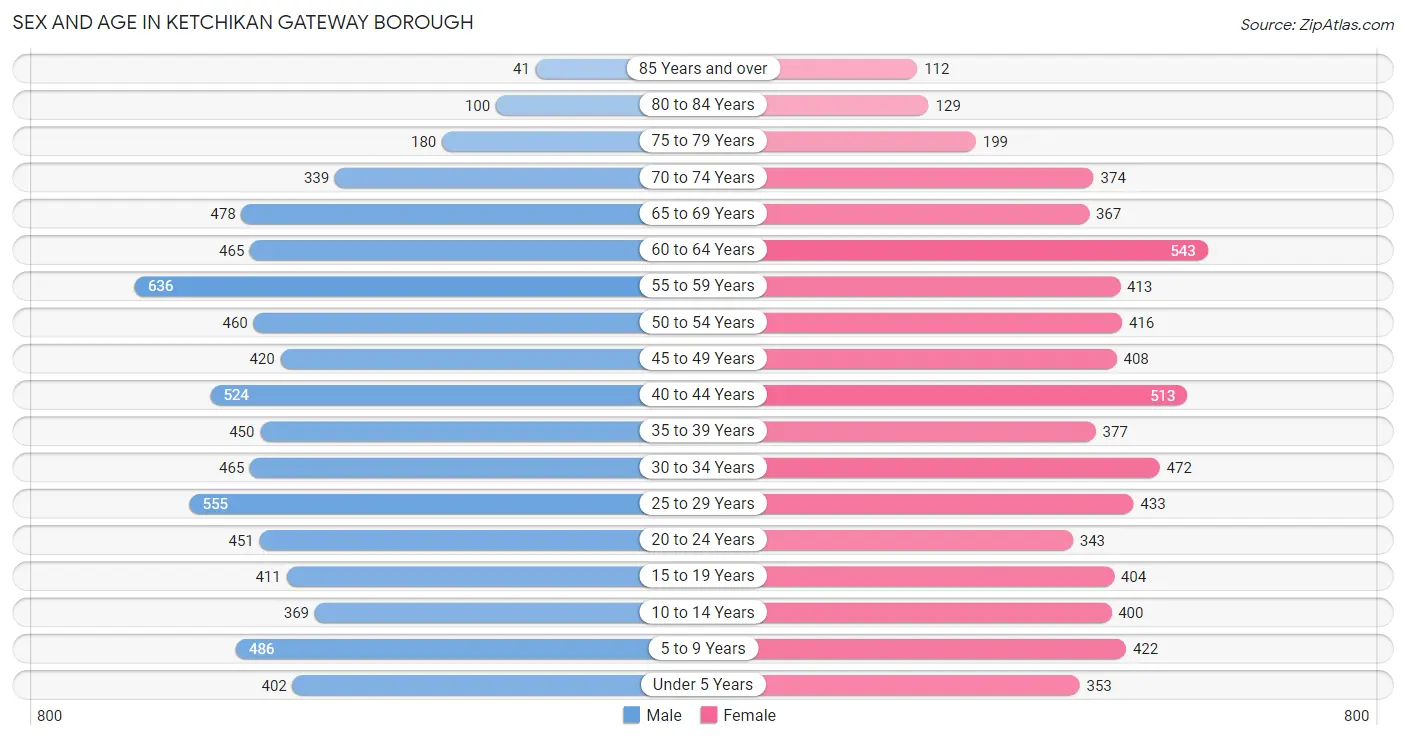
Sex and Age in Ketchikan Gateway Borough
The most populous age groups in Ketchikan Gateway Borough are 55 to 59 Years (636 | 8.8%) for men and 60 to 64 Years (543 | 8.1%) for women.
| Age Bracket | Male | Female |
| Under 5 Years | 402 (5.6%) | 353 (5.3%) |
| 5 to 9 Years | 486 (6.7%) | 422 (6.3%) |
| 10 to 14 Years | 369 (5.1%) | 400 (6.0%) |
| 15 to 19 Years | 411 (5.7%) | 404 (6.0%) |
| 20 to 24 Years | 451 (6.2%) | 343 (5.1%) |
| 25 to 29 Years | 555 (7.7%) | 433 (6.5%) |
| 30 to 34 Years | 465 (6.4%) | 472 (7.1%) |
| 35 to 39 Years | 450 (6.2%) | 377 (5.7%) |
| 40 to 44 Years | 524 (7.2%) | 513 (7.7%) |
| 45 to 49 Years | 420 (5.8%) | 408 (6.1%) |
| 50 to 54 Years | 460 (6.4%) | 416 (6.2%) |
| 55 to 59 Years | 636 (8.8%) | 413 (6.2%) |
| 60 to 64 Years | 465 (6.4%) | 543 (8.1%) |
| 65 to 69 Years | 478 (6.6%) | 367 (5.5%) |
| 70 to 74 Years | 339 (4.7%) | 374 (5.6%) |
| 75 to 79 Years | 180 (2.5%) | 199 (3.0%) |
| 80 to 84 Years | 100 (1.4%) | 129 (1.9%) |
| 85 Years and over | 41 (0.6%) | 112 (1.7%) |
| Total | 7,232 (100.0%) | 6,678 (100.0%) |
Families and Households in Ketchikan Gateway Borough
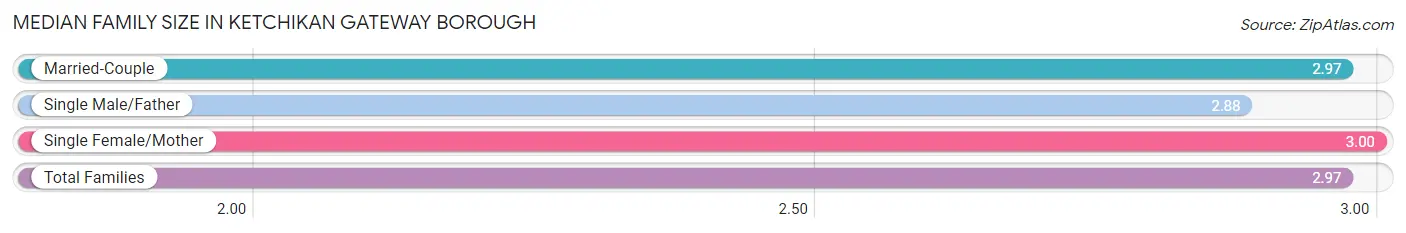
Median Family Size in Ketchikan Gateway Borough
The median family size in Ketchikan Gateway Borough is 2.97 persons per family, with single female/mother families (589 | 16.5%) accounting for the largest median family size of 3 persons per family. On the other hand, single male/father families (302 | 8.5%) represent the smallest median family size with 2.88 persons per family.
| Family Type | # Families | Family Size |
| Married-Couple | 2,682 (75.1%) | 2.97 |
| Single Male/Father | 302 (8.5%) | 2.88 |
| Single Female/Mother | 589 (16.5%) | 3.00 |
| Total Families | 3,573 (100.0%) | 2.97 |
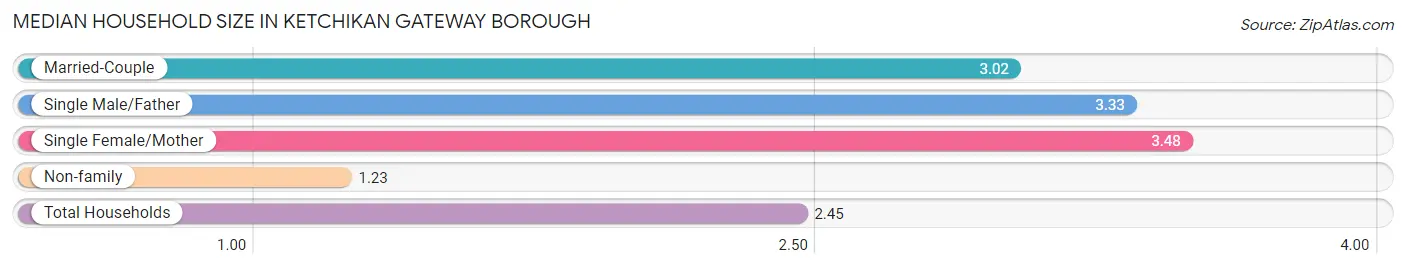
Median Household Size in Ketchikan Gateway Borough
The median household size in Ketchikan Gateway Borough is 2.45 persons per household, with single female/mother households (589 | 10.6%) accounting for the largest median household size of 3.48 persons per household. non-family households (1,995 | 35.8%) represent the smallest median household size with 1.23 persons per household.
| Household Type | # Households | Household Size |
| Married-Couple | 2,682 (48.2%) | 3.02 |
| Single Male/Father | 302 (5.4%) | 3.33 |
| Single Female/Mother | 589 (10.6%) | 3.48 |
| Non-family | 1,995 (35.8%) | 1.23 |
| Total Households | 5,568 (100.0%) | 2.45 |
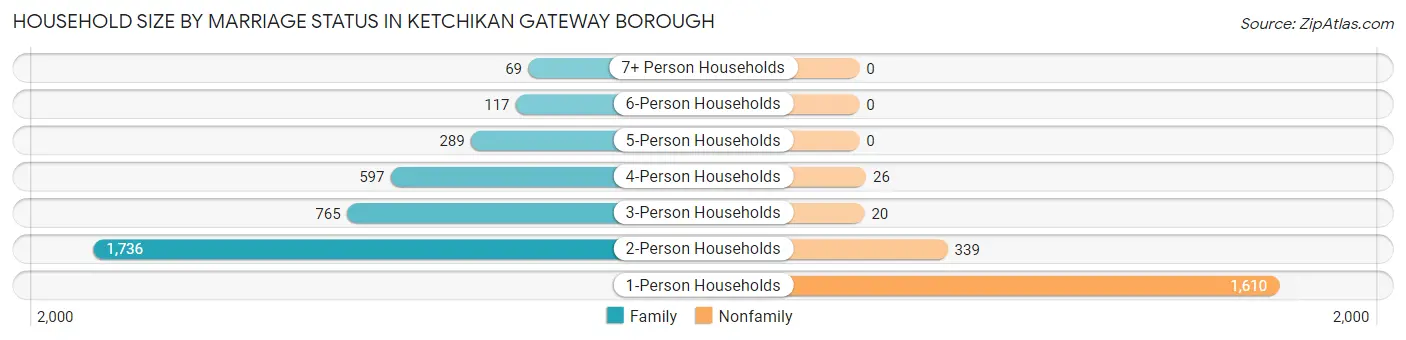
Household Size by Marriage Status in Ketchikan Gateway Borough
Out of a total of 5,568 households in Ketchikan Gateway Borough, 3,573 (64.2%) are family households, while 1,995 (35.8%) are nonfamily households. The most numerous type of family households are 2-person households, comprising 1,736, and the most common type of nonfamily households are 1-person households, comprising 1,610.
| Household Size | Family Households | Nonfamily Households |
| 1-Person Households | - | 1,610 (28.9%) |
| 2-Person Households | 1,736 (31.2%) | 339 (6.1%) |
| 3-Person Households | 765 (13.7%) | 20 (0.4%) |
| 4-Person Households | 597 (10.7%) | 26 (0.5%) |
| 5-Person Households | 289 (5.2%) | 0 (0.0%) |
| 6-Person Households | 117 (2.1%) | 0 (0.0%) |
| 7+ Person Households | 69 (1.2%) | 0 (0.0%) |
| Total | 3,573 (64.2%) | 1,995 (35.8%) |
Female Fertility in Ketchikan Gateway Borough
Fertility by Age in Ketchikan Gateway Borough
Average fertility rate in Ketchikan Gateway Borough is 33.0 births per 1,000 women. Women in the age bracket of 20 to 34 years have the highest fertility rate with 73.0 births per 1,000 women. Women in the age bracket of 20 to 34 years acount for 91.0% of all women with births.
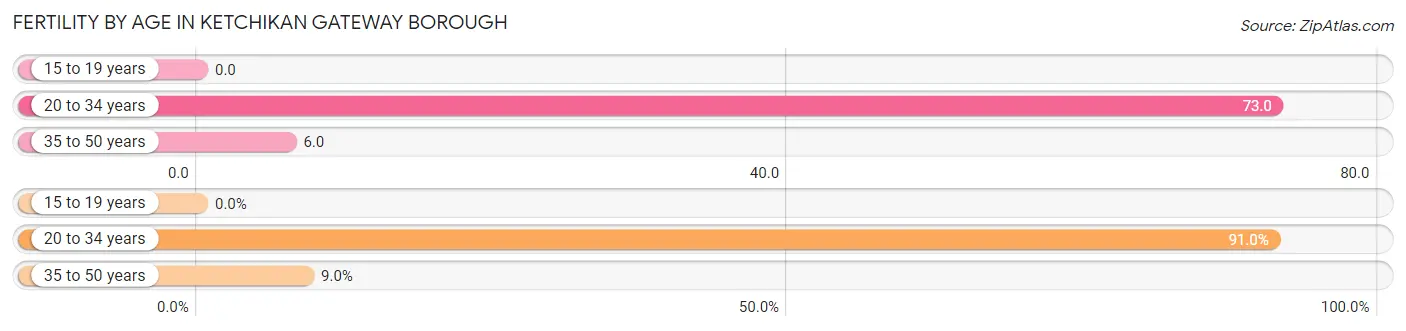
| Age Bracket | Women with Births | Births / 1,000 Women |
| 15 to 19 years | 0 (0.0%) | 0.0 |
| 20 to 34 years | 91 (91.0%) | 73.0 |
| 35 to 50 years | 9 (9.0%) | 6.0 |
| Total | 100 (100.0%) | 33.0 |
Fertility by Age by Marriage Status in Ketchikan Gateway Borough
47.0% of women with births (100) in Ketchikan Gateway Borough are married. The highest percentage of unmarried women with births falls into 20 to 34 years age bracket with 53.8% of them unmarried at the time of birth, while the lowest percentage of unmarried women with births belong to 35 to 50 years age bracket with 44.4% of them unmarried.
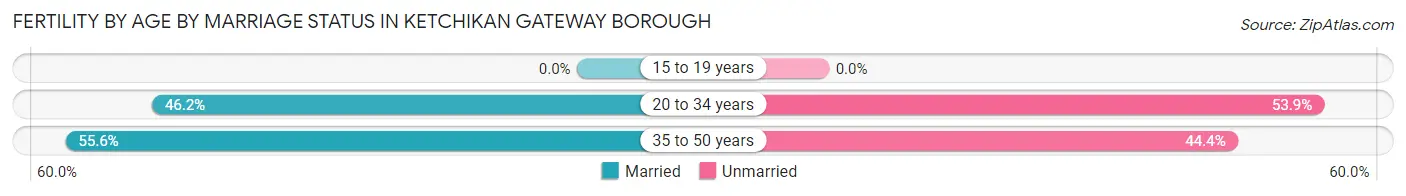
| Age Bracket | Married | Unmarried |
| 15 to 19 years | 0 (0.0%) | 0 (0.0%) |
| 20 to 34 years | 42 (46.2%) | 49 (53.8%) |
| 35 to 50 years | 5 (55.6%) | 4 (44.4%) |
| Total | 47 (47.0%) | 53 (53.0%) |
Fertility by Education in Ketchikan Gateway Borough
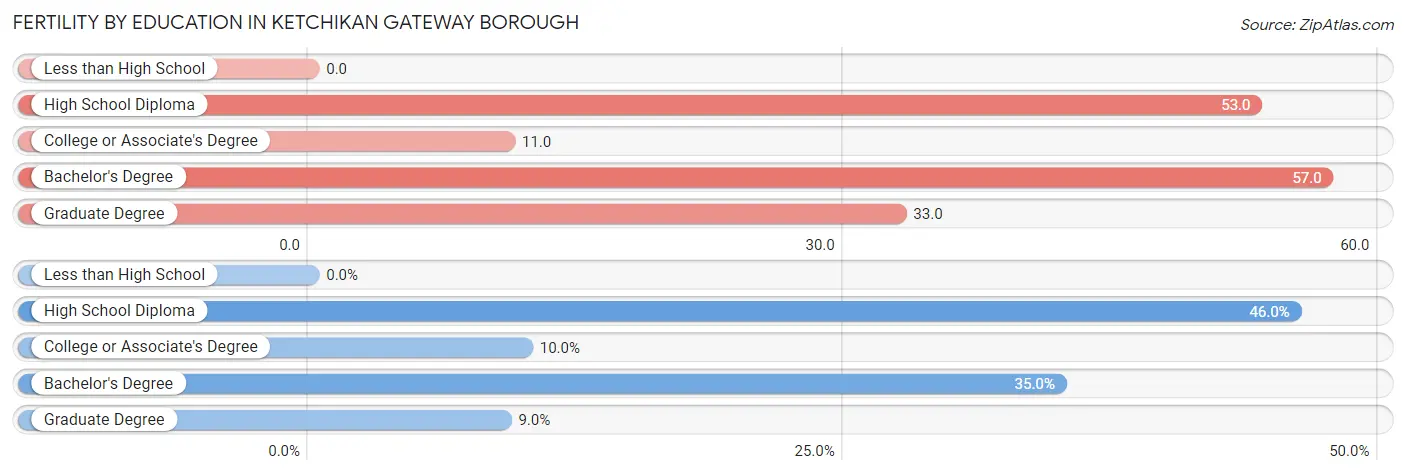
| Educational Attainment | Women with Births | Births / 1,000 Women |
| Less than High School | 0 (0.0%) | 0.0 |
| High School Diploma | 46 (46.0%) | 53.0 |
| College or Associate's Degree | 10 (10.0%) | 11.0 |
| Bachelor's Degree | 35 (35.0%) | 57.0 |
| Graduate Degree | 9 (9.0%) | 33.0 |
| Total | 100 (100.0%) | 33.0 |
Fertility by Education by Marriage Status in Ketchikan Gateway Borough
53.0% of women with births in Ketchikan Gateway Borough are unmarried. Women with the educational attainment of graduate degree are most likely to be married with 55.6% of them married at childbirth, while women with the educational attainment of high school diploma are least likely to be married with 58.7% of them unmarried at childbirth.
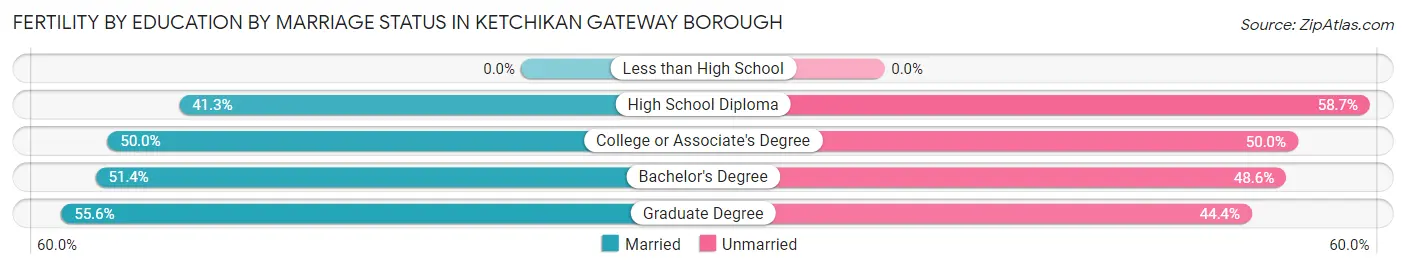
| Educational Attainment | Married | Unmarried |
| Less than High School | 0 (0.0%) | 0 (0.0%) |
| High School Diploma | 19 (41.3%) | 27 (58.7%) |
| College or Associate's Degree | 5 (50.0%) | 5 (50.0%) |
| Bachelor's Degree | 18 (51.4%) | 17 (48.6%) |
| Graduate Degree | 5 (55.6%) | 4 (44.4%) |
| Total | 47 (47.0%) | 53 (53.0%) |
Income in Ketchikan Gateway Borough
Income Overview in Ketchikan Gateway Borough
Per Capita Income in Ketchikan Gateway Borough is $44,368, while median incomes of families and households are $105,493 and $82,763 respectively.
| Characteristic | Number | Measure |
| Per Capita Income | 13,910 | $44,368 |
| Median Family Income | 3,573 | $105,493 |
| Mean Family Income | 3,573 | $124,940 |
| Median Household Income | 5,568 | $82,763 |
| Mean Household Income | 5,568 | $108,405 |
| Income Deficit | 3,573 | $0 |
| Wage / Income Gap (%) | 13,910 | 31.75% |
| Wage / Income Gap ($) | 13,910 | 68.25¢ per $1 |
| Gini / Inequality Index | 13,910 | 0.44 |
Earnings by Sex in Ketchikan Gateway Borough
Average Earnings in Ketchikan Gateway Borough are $46,905, $55,350 for men and $37,778 for women, a difference of 31.8%.
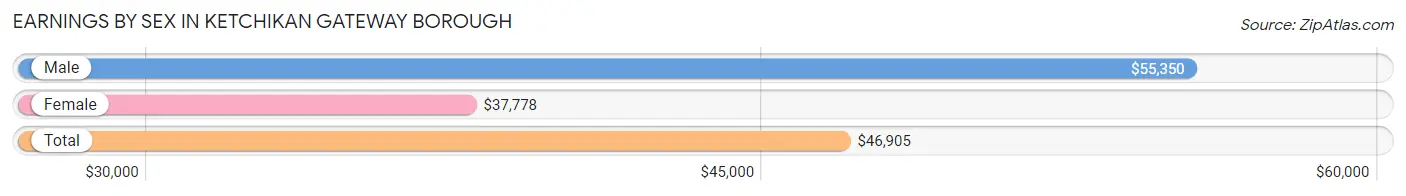
| Sex | Number | Average Earnings |
| Male | 4,416 (54.1%) | $55,350 |
| Female | 3,744 (45.9%) | $37,778 |
| Total | 8,160 (100.0%) | $46,905 |
Earnings by Sex by Income Bracket in Ketchikan Gateway Borough
The most common earnings brackets in Ketchikan Gateway Borough are $100,000+ for men (747 | 16.9%) and $100,000+ for women (400 | 10.7%).
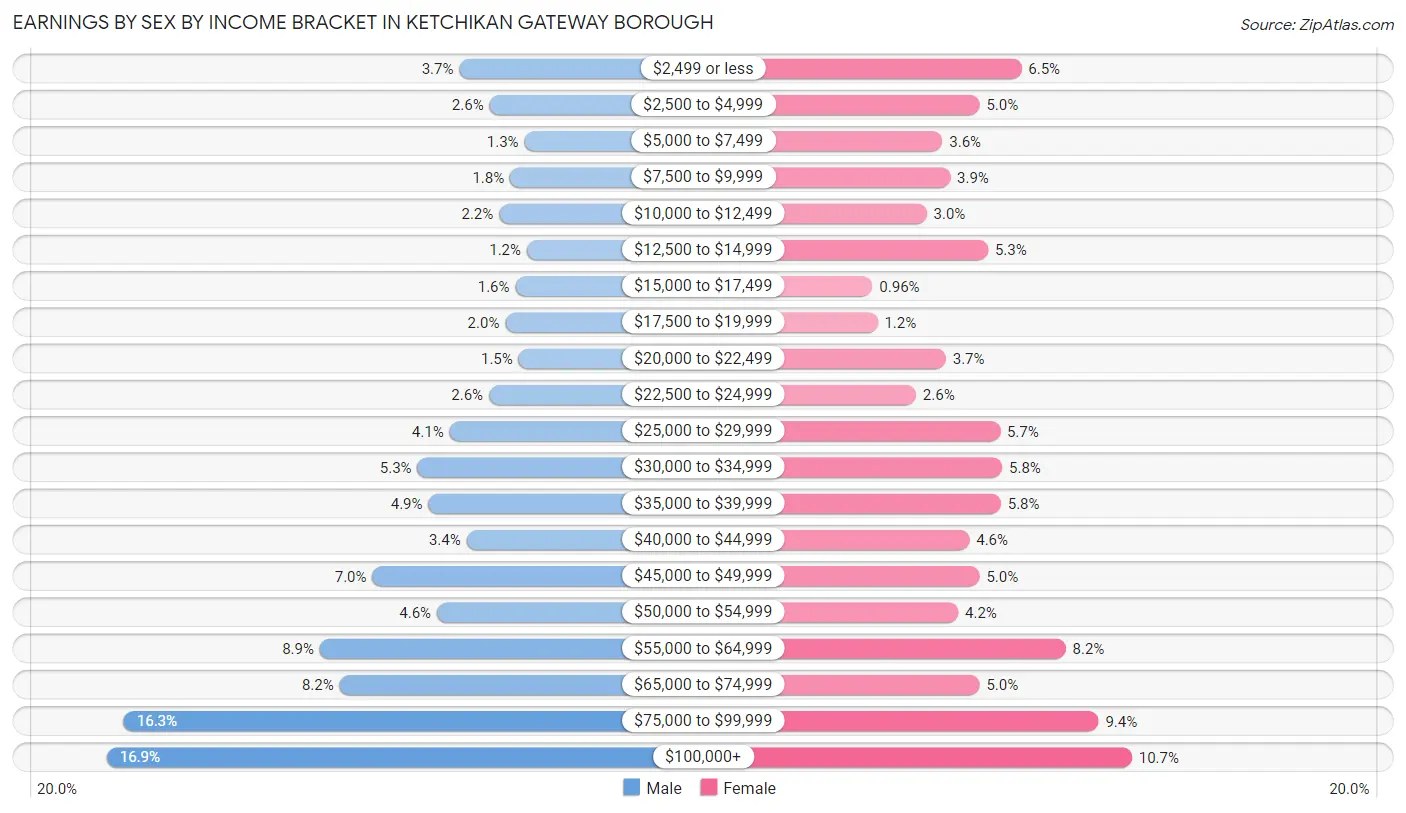
| Income | Male | Female |
| $2,499 or less | 164 (3.7%) | 245 (6.5%) |
| $2,500 to $4,999 | 114 (2.6%) | 186 (5.0%) |
| $5,000 to $7,499 | 56 (1.3%) | 134 (3.6%) |
| $7,500 to $9,999 | 80 (1.8%) | 145 (3.9%) |
| $10,000 to $12,499 | 98 (2.2%) | 112 (3.0%) |
| $12,500 to $14,999 | 52 (1.2%) | 198 (5.3%) |
| $15,000 to $17,499 | 71 (1.6%) | 36 (1.0%) |
| $17,500 to $19,999 | 88 (2.0%) | 43 (1.1%) |
| $20,000 to $22,499 | 66 (1.5%) | 139 (3.7%) |
| $22,500 to $24,999 | 115 (2.6%) | 97 (2.6%) |
| $25,000 to $29,999 | 180 (4.1%) | 215 (5.7%) |
| $30,000 to $34,999 | 233 (5.3%) | 218 (5.8%) |
| $35,000 to $39,999 | 215 (4.9%) | 216 (5.8%) |
| $40,000 to $44,999 | 152 (3.4%) | 172 (4.6%) |
| $45,000 to $49,999 | 308 (7.0%) | 186 (5.0%) |
| $50,000 to $54,999 | 201 (4.5%) | 156 (4.2%) |
| $55,000 to $64,999 | 395 (8.9%) | 307 (8.2%) |
| $65,000 to $74,999 | 362 (8.2%) | 186 (5.0%) |
| $75,000 to $99,999 | 719 (16.3%) | 353 (9.4%) |
| $100,000+ | 747 (16.9%) | 400 (10.7%) |
| Total | 4,416 (100.0%) | 3,744 (100.0%) |
Earnings by Sex by Educational Attainment in Ketchikan Gateway Borough
Average earnings in Ketchikan Gateway Borough are $59,865 for men and $44,235 for women, a difference of 26.1%. Men with an educational attainment of graduate degree enjoy the highest average annual earnings of $88,032, while those with high school diploma education earn the least with $50,295. Women with an educational attainment of graduate degree earn the most with the average annual earnings of $83,519, while those with high school diploma education have the smallest earnings of $31,667.
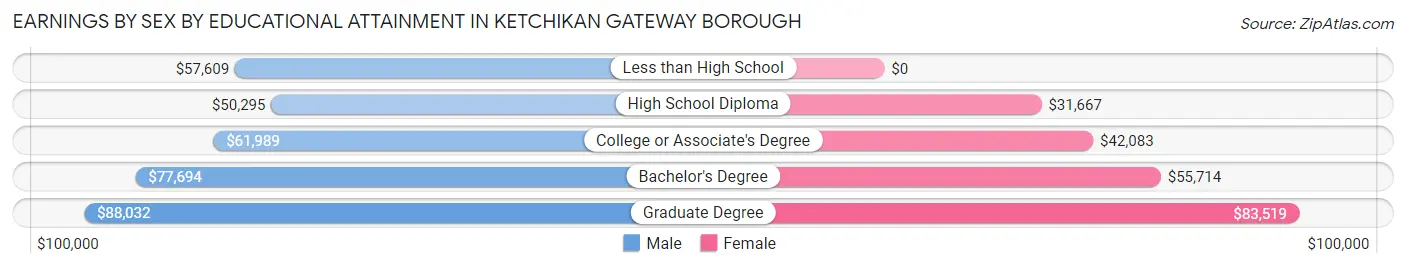
| Educational Attainment | Male Income | Female Income |
| Less than High School | $57,609 | $0 |
| High School Diploma | $50,295 | $31,667 |
| College or Associate's Degree | $61,989 | $42,083 |
| Bachelor's Degree | $77,694 | $55,714 |
| Graduate Degree | $88,032 | $83,519 |
| Total | $59,865 | $44,235 |
Family Income in Ketchikan Gateway Borough
Family Income Brackets in Ketchikan Gateway Borough
According to the Ketchikan Gateway Borough family income data, there are 865 families falling into the $100,000 to $149,999 income range, which is the most common income bracket and makes up 24.2% of all families. Conversely, the $10,000 to $14,999 income bracket is the least frequent group with only 21 families (0.6%) belonging to this category.
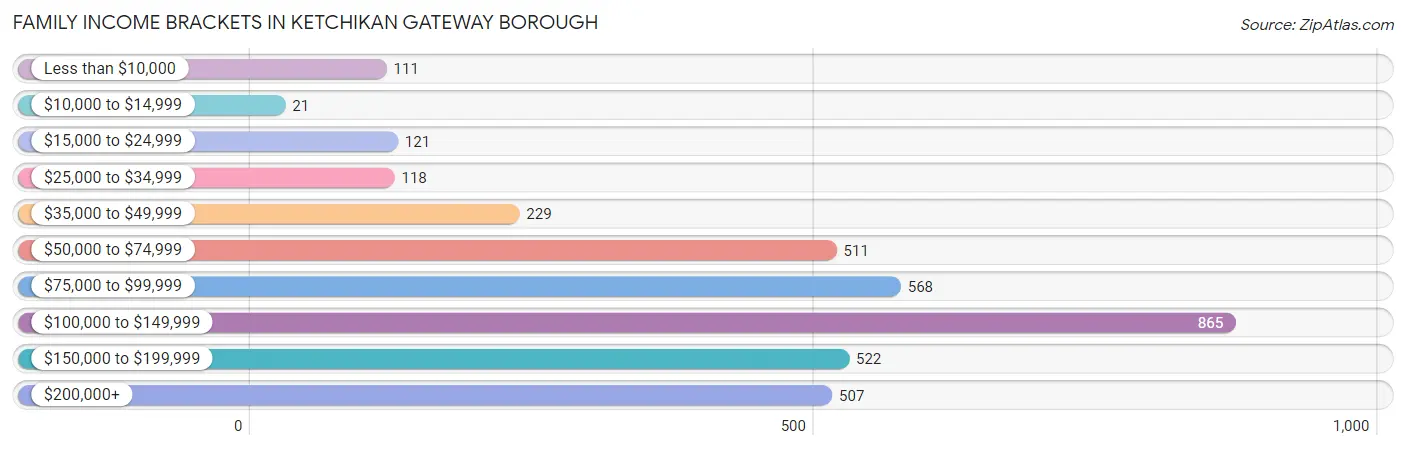
| Income Bracket | # Families | % Families |
| Less than $10,000 | 111 | 3.1% |
| $10,000 to $14,999 | 21 | 0.6% |
| $15,000 to $24,999 | 121 | 3.4% |
| $25,000 to $34,999 | 118 | 3.3% |
| $35,000 to $49,999 | 229 | 6.4% |
| $50,000 to $74,999 | 511 | 14.3% |
| $75,000 to $99,999 | 568 | 15.9% |
| $100,000 to $149,999 | 865 | 24.2% |
| $150,000 to $199,999 | 522 | 14.6% |
| $200,000+ | 507 | 14.2% |
Family Income by Famaliy Size in Ketchikan Gateway Borough
5-person families (214 | 6.0%) account for the highest median family income in Ketchikan Gateway Borough with $131,250 per family, while 2-person families (1,935 | 54.2%) have the highest median income of $50,288 per family member.
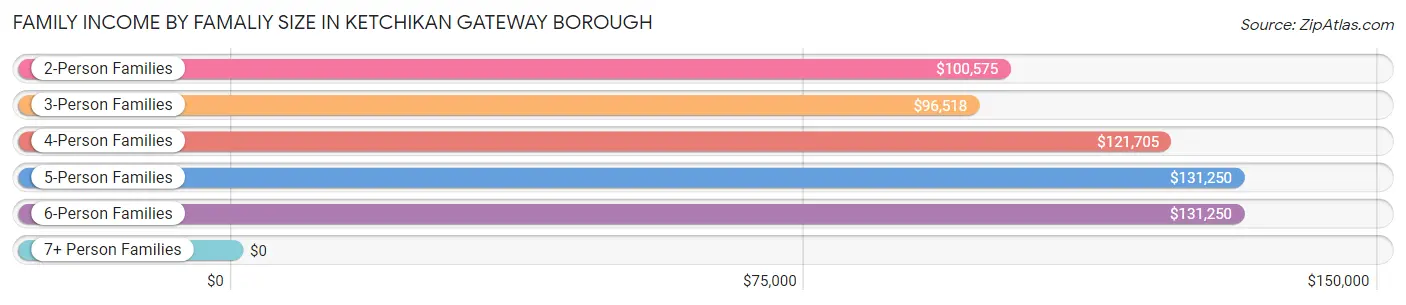
| Income Bracket | # Families | Median Income |
| 2-Person Families | 1,935 (54.2%) | $100,575 |
| 3-Person Families | 670 (18.8%) | $96,518 |
| 4-Person Families | 629 (17.6%) | $121,705 |
| 5-Person Families | 214 (6.0%) | $131,250 |
| 6-Person Families | 84 (2.4%) | $131,250 |
| 7+ Person Families | 41 (1.1%) | $0 |
| Total | 3,573 (100.0%) | $105,493 |
Family Income by Number of Earners in Ketchikan Gateway Borough
The median family income in Ketchikan Gateway Borough is $105,493, with families comprising 3+ earners (428) having the highest median family income of $170,156, while families with 1 earner (1,125) have the lowest median family income of $74,604, accounting for 12.0% and 31.5% of families, respectively.
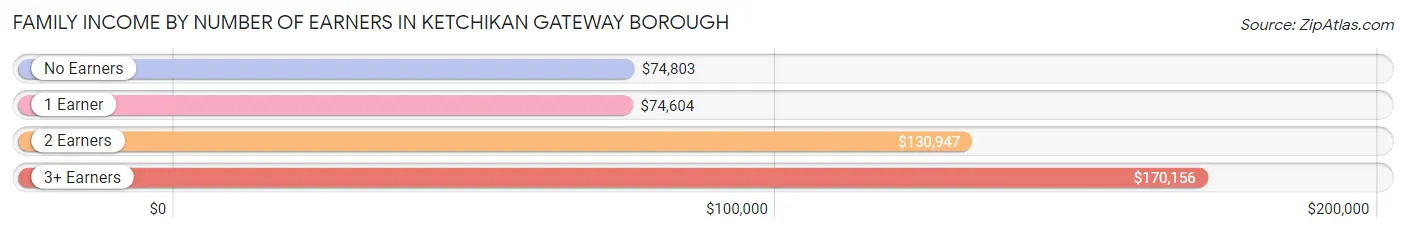
| Number of Earners | # Families | Median Income |
| No Earners | 417 (11.7%) | $74,803 |
| 1 Earner | 1,125 (31.5%) | $74,604 |
| 2 Earners | 1,603 (44.9%) | $130,947 |
| 3+ Earners | 428 (12.0%) | $170,156 |
| Total | 3,573 (100.0%) | $105,493 |
Household Income in Ketchikan Gateway Borough
Household Income Brackets in Ketchikan Gateway Borough
With 1,019 households falling in the category, the $100,000 to $149,999 income range is the most frequent in Ketchikan Gateway Borough, accounting for 18.3% of all households. In contrast, only 106 households (1.9%) fall into the $10,000 to $14,999 income bracket, making it the least populous group.
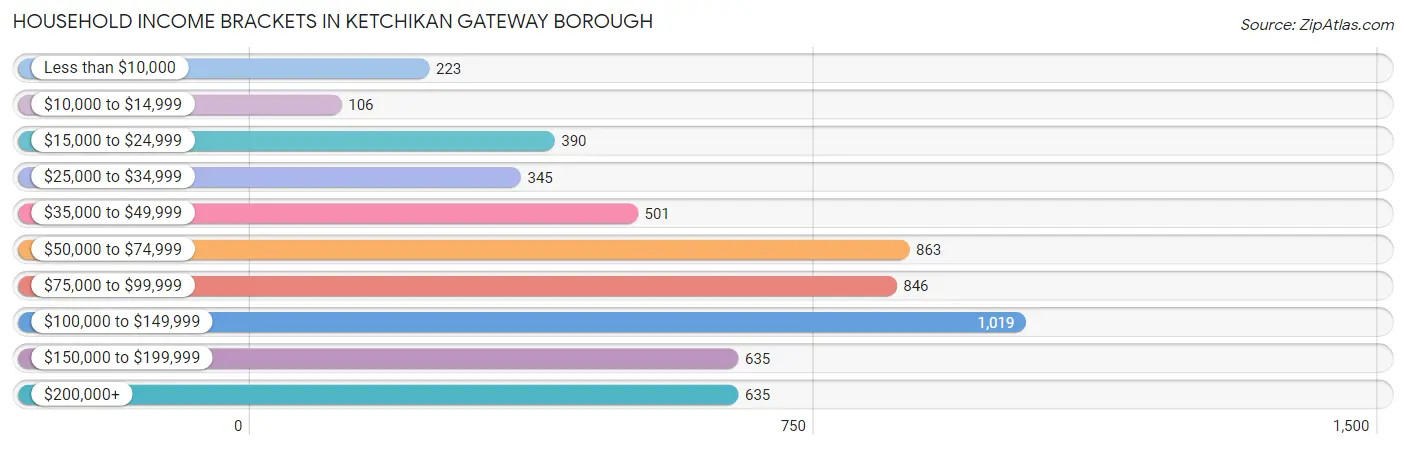
| Income Bracket | # Households | % Households |
| Less than $10,000 | 223 | 4.0% |
| $10,000 to $14,999 | 106 | 1.9% |
| $15,000 to $24,999 | 390 | 7.0% |
| $25,000 to $34,999 | 345 | 6.2% |
| $35,000 to $49,999 | 501 | 9.0% |
| $50,000 to $74,999 | 863 | 15.5% |
| $75,000 to $99,999 | 846 | 15.2% |
| $100,000 to $149,999 | 1,019 | 18.3% |
| $150,000 to $199,999 | 635 | 11.4% |
| $200,000+ | 635 | 11.4% |
Household Income by Householder Age in Ketchikan Gateway Borough
The median household income in Ketchikan Gateway Borough is $82,763, with the highest median household income of $100,134 found in the 45 to 64 years age bracket for the primary householder. A total of 2,117 households (38.0%) fall into this category. Meanwhile, the 65+ years age bracket for the primary householder has the lowest median household income of $66,667, with 1,520 households (27.3%) in this group.
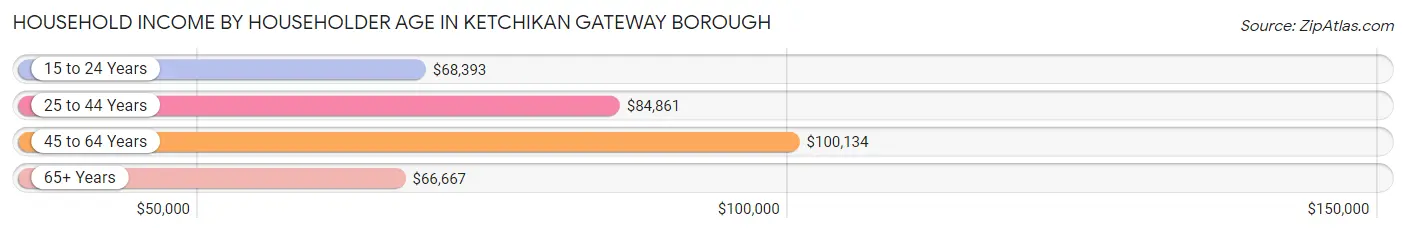
| Income Bracket | # Households | Median Income |
| 15 to 24 Years | 191 (3.4%) | $68,393 |
| 25 to 44 Years | 1,740 (31.2%) | $84,861 |
| 45 to 64 Years | 2,117 (38.0%) | $100,134 |
| 65+ Years | 1,520 (27.3%) | $66,667 |
| Total | 5,568 (100.0%) | $82,763 |
Poverty in Ketchikan Gateway Borough
Income Below Poverty by Sex and Age in Ketchikan Gateway Borough
With 9.0% poverty level for males and 10.4% for females among the residents of Ketchikan Gateway Borough, 15 year old males and 18 to 24 year old females are the most vulnerable to poverty, with 24 males (31.2%) and 121 females (24.2%) in their respective age groups living below the poverty level.
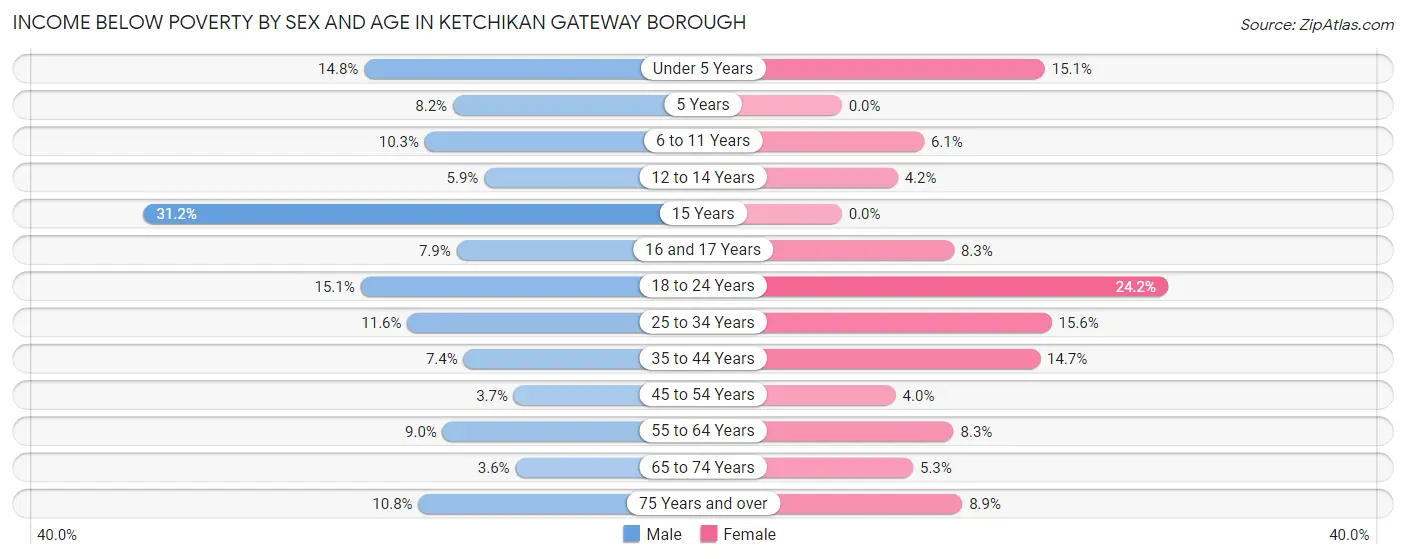
| Age Bracket | Male | Female |
| Under 5 Years | 59 (14.8%) | 52 (15.1%) |
| 5 Years | 5 (8.2%) | 0 (0.0%) |
| 6 to 11 Years | 63 (10.3%) | 28 (6.1%) |
| 12 to 14 Years | 10 (5.9%) | 11 (4.2%) |
| 15 Years | 24 (31.2%) | 0 (0.0%) |
| 16 and 17 Years | 13 (7.9%) | 15 (8.3%) |
| 18 to 24 Years | 86 (15.1%) | 121 (24.2%) |
| 25 to 34 Years | 117 (11.6%) | 141 (15.6%) |
| 35 to 44 Years | 70 (7.4%) | 131 (14.7%) |
| 45 to 54 Years | 32 (3.7%) | 33 (4.0%) |
| 55 to 64 Years | 98 (9.0%) | 79 (8.3%) |
| 65 to 74 Years | 29 (3.6%) | 39 (5.3%) |
| 75 Years and over | 34 (10.8%) | 39 (8.9%) |
| Total | 640 (9.0%) | 689 (10.4%) |
Income Above Poverty by Sex and Age in Ketchikan Gateway Borough
According to the poverty statistics in Ketchikan Gateway Borough, males aged 65 to 74 years and females aged 5 years are the age groups that are most secure financially, with 96.4% of males and 100.0% of females in these age groups living above the poverty line.
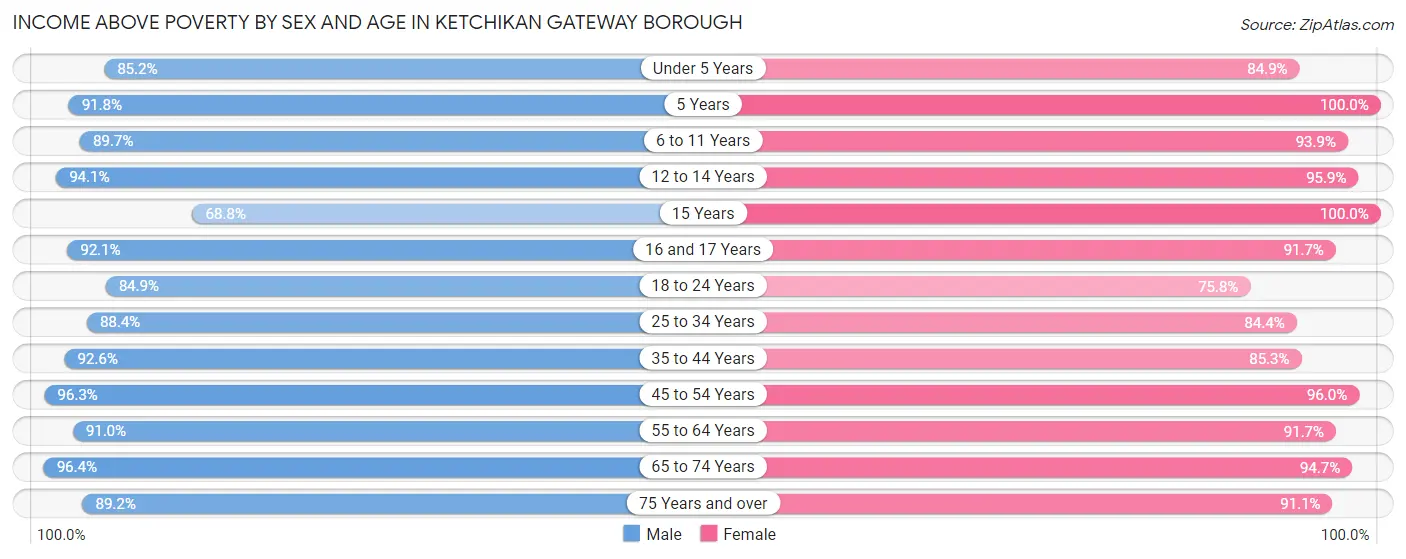
| Age Bracket | Male | Female |
| Under 5 Years | 340 (85.2%) | 293 (84.9%) |
| 5 Years | 56 (91.8%) | 72 (100.0%) |
| 6 to 11 Years | 549 (89.7%) | 431 (93.9%) |
| 12 to 14 Years | 160 (94.1%) | 254 (95.9%) |
| 15 Years | 53 (68.8%) | 66 (100.0%) |
| 16 and 17 Years | 151 (92.1%) | 165 (91.7%) |
| 18 to 24 Years | 485 (84.9%) | 379 (75.8%) |
| 25 to 34 Years | 893 (88.4%) | 764 (84.4%) |
| 35 to 44 Years | 875 (92.6%) | 759 (85.3%) |
| 45 to 54 Years | 838 (96.3%) | 791 (96.0%) |
| 55 to 64 Years | 996 (91.0%) | 873 (91.7%) |
| 65 to 74 Years | 786 (96.4%) | 698 (94.7%) |
| 75 Years and over | 282 (89.2%) | 397 (91.1%) |
| Total | 6,464 (91.0%) | 5,942 (89.6%) |
Income Below Poverty Among Married-Couple Families in Ketchikan Gateway Borough
The poverty statistics for married-couple families in Ketchikan Gateway Borough show that 2.8% or 76 of the total 2,682 families live below the poverty line. Families with 3 or 4 children have the highest poverty rate of 7.0%, comprising of 9 families. On the other hand, families with 5 or more children have the lowest poverty rate of 0.0%, which includes 0 families.
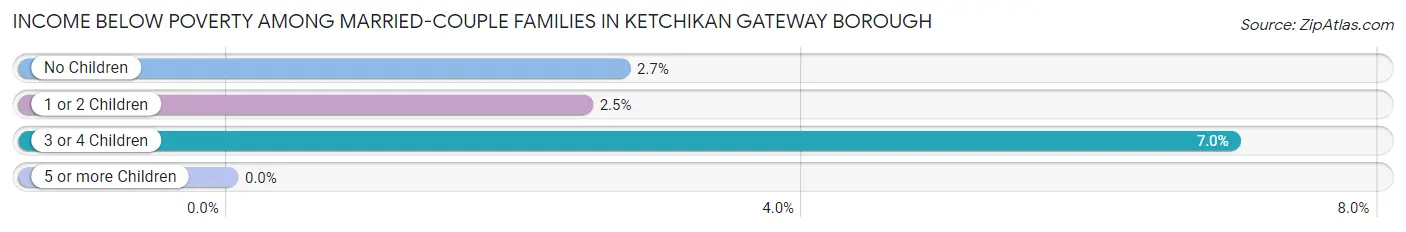
| Children | Above Poverty | Below Poverty |
| No Children | 1,639 (97.3%) | 46 (2.7%) |
| 1 or 2 Children | 829 (97.5%) | 21 (2.5%) |
| 3 or 4 Children | 120 (93.0%) | 9 (7.0%) |
| 5 or more Children | 18 (100.0%) | 0 (0.0%) |
| Total | 2,606 (97.2%) | 76 (2.8%) |
Income Below Poverty Among Single-Parent Households in Ketchikan Gateway Borough
According to the poverty data in Ketchikan Gateway Borough, 0.7% or 2 single-father households and 22.1% or 130 single-mother households are living below the poverty line. Among single-father households, those with no children have the highest poverty rate, with 2 households (1.6%) experiencing poverty. Likewise, among single-mother households, those with 3 or 4 children have the highest poverty rate, with 35 households (54.7%) falling below the poverty line.
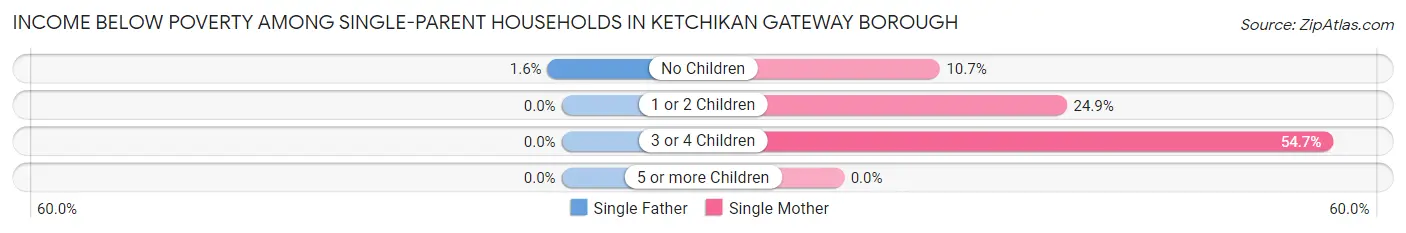
| Children | Single Father | Single Mother |
| No Children | 2 (1.6%) | 27 (10.7%) |
| 1 or 2 Children | 0 (0.0%) | 68 (24.9%) |
| 3 or 4 Children | 0 (0.0%) | 35 (54.7%) |
| 5 or more Children | 0 (0.0%) | 0 (0.0%) |
| Total | 2 (0.7%) | 130 (22.1%) |
Income Below Poverty Among Married-Couple vs Single-Parent Households in Ketchikan Gateway Borough
The poverty data for Ketchikan Gateway Borough shows that 76 of the married-couple family households (2.8%) and 132 of the single-parent households (14.8%) are living below the poverty level. Within the married-couple family households, those with 3 or 4 children have the highest poverty rate, with 9 households (7.0%) falling below the poverty line. Among the single-parent households, those with 3 or 4 children have the highest poverty rate, with 35 household (31.5%) living below poverty.
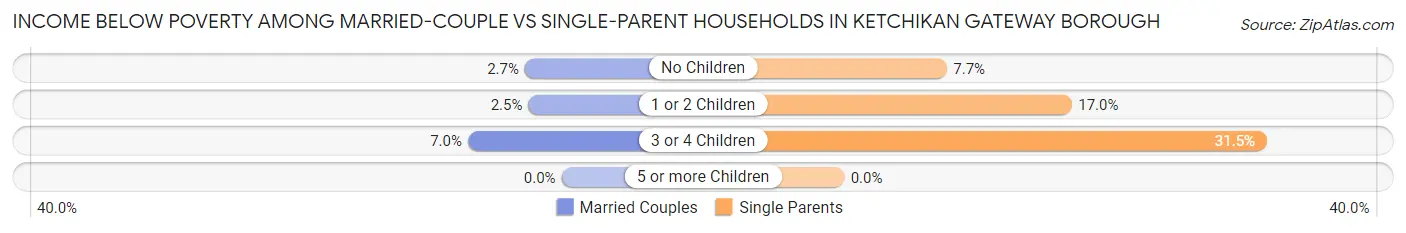
| Children | Married-Couple Families | Single-Parent Households |
| No Children | 46 (2.7%) | 29 (7.6%) |
| 1 or 2 Children | 21 (2.5%) | 68 (17.0%) |
| 3 or 4 Children | 9 (7.0%) | 35 (31.5%) |
| 5 or more Children | 0 (0.0%) | 0 (0.0%) |
| Total | 76 (2.8%) | 132 (14.8%) |
Employment Characteristics in Ketchikan Gateway Borough
Employment by Class of Employer in Ketchikan Gateway Borough
Among the 7,018 employed individuals in Ketchikan Gateway Borough, private company employees (3,413 | 48.6%), local government employees (980 | 14.0%), and not-for-profit organizations (768 | 10.9%) make up the most common classes of employment.
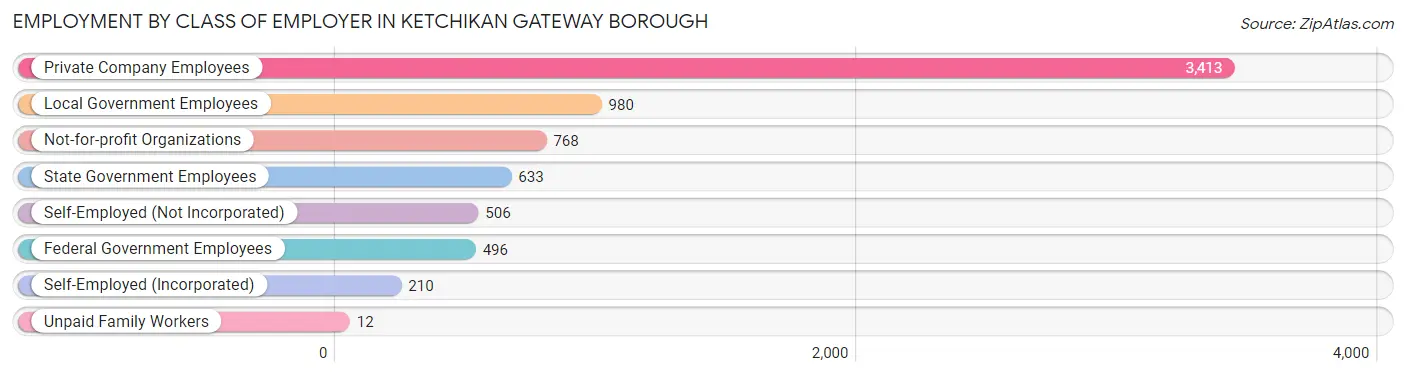
| Employer Class | # Employees | % Employees |
| Private Company Employees | 3,413 | 48.6% |
| Self-Employed (Incorporated) | 210 | 3.0% |
| Self-Employed (Not Incorporated) | 506 | 7.2% |
| Not-for-profit Organizations | 768 | 10.9% |
| Local Government Employees | 980 | 14.0% |
| State Government Employees | 633 | 9.0% |
| Federal Government Employees | 496 | 7.1% |
| Unpaid Family Workers | 12 | 0.2% |
| Total | 7,018 | 100.0% |
Employment Status by Age in Ketchikan Gateway Borough
According to the labor force statistics for Ketchikan Gateway Borough, out of the total population over 16 years of age (11,333), 66.0% or 7,480 individuals are in the labor force, with 4.1% or 307 of them unemployed. The age group with the highest labor force participation rate is 45 to 54 years, with 88.6% or 1,510 individuals in the labor force. Within the labor force, the 20 to 24 years age range has the highest percentage of unemployed individuals, with 10.2% or 58 of them being unemployed.
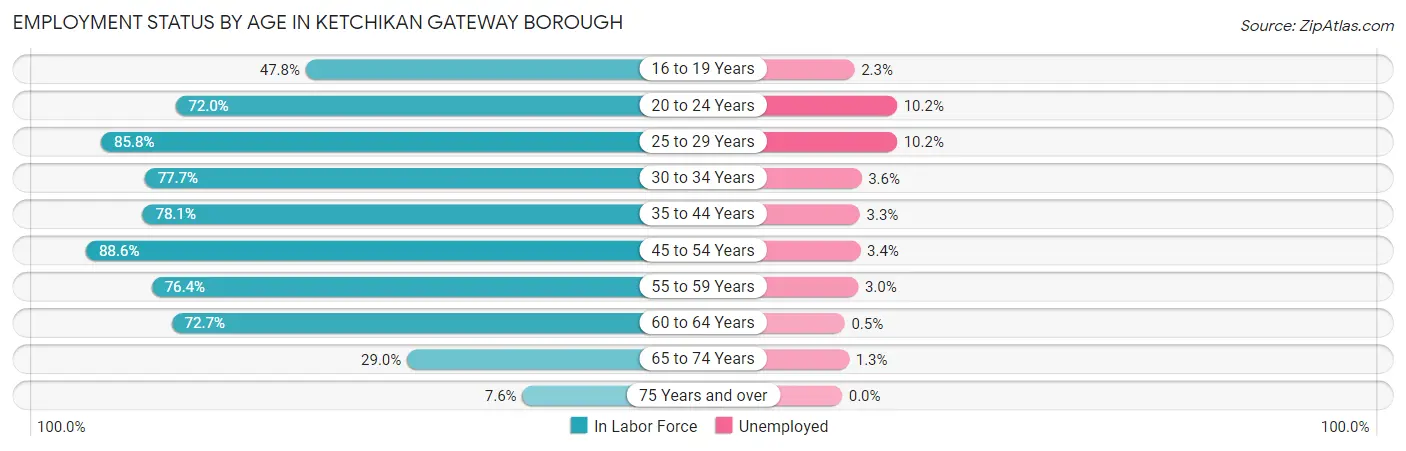
| Age Bracket | In Labor Force | Unemployed |
| 16 to 19 Years | 320 (47.8%) | 7 (2.3%) |
| 20 to 24 Years | 572 (72.0%) | 58 (10.2%) |
| 25 to 29 Years | 848 (85.8%) | 86 (10.2%) |
| 30 to 34 Years | 728 (77.7%) | 26 (3.6%) |
| 35 to 44 Years | 1,456 (78.1%) | 48 (3.3%) |
| 45 to 54 Years | 1,510 (88.6%) | 51 (3.4%) |
| 55 to 59 Years | 801 (76.4%) | 24 (3.0%) |
| 60 to 64 Years | 733 (72.7%) | 4 (0.5%) |
| 65 to 74 Years | 452 (29.0%) | 6 (1.3%) |
| 75 Years and over | 58 (7.6%) | 0 (0.0%) |
| Total | 7,480 (66.0%) | 307 (4.1%) |
Employment Status by Educational Attainment in Ketchikan Gateway Borough
According to labor force statistics for Ketchikan Gateway Borough, 80.5% of individuals (6,078) out of the total population between 25 and 64 years of age (7,550) are in the labor force, with 3.9% or 237 of them being unemployed. The group with the highest labor force participation rate are those with the educational attainment of bachelor's degree or higher, with 89.4% or 2,021 individuals in the labor force. Within the labor force, individuals with less than high school education have the highest percentage of unemployment, with 10.8% or 26 of them being unemployed.
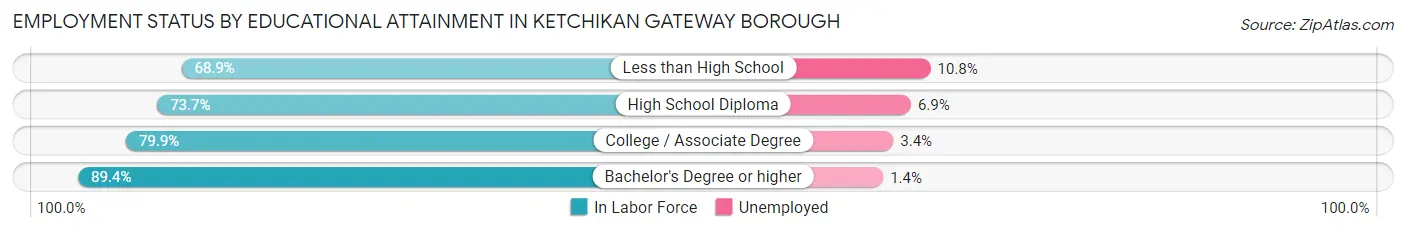
| Educational Attainment | In Labor Force | Unemployed |
| Less than High School | 241 (68.9%) | 38 (10.8%) |
| High School Diploma | 1,610 (73.7%) | 151 (6.9%) |
| College / Associate Degree | 2,200 (79.9%) | 94 (3.4%) |
| Bachelor's Degree or higher | 2,021 (89.4%) | 32 (1.4%) |
| Total | 6,078 (80.5%) | 294 (3.9%) |
Employment Occupations by Sex in Ketchikan Gateway Borough
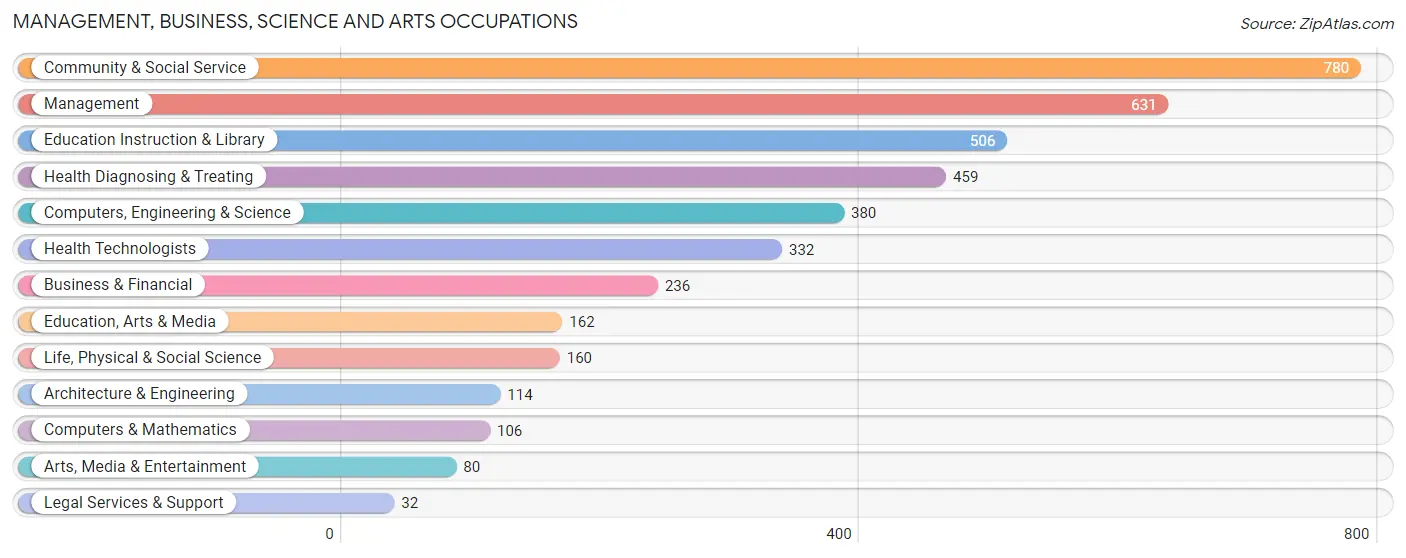
Management, Business, Science and Arts Occupations
The most common Management, Business, Science and Arts occupations in Ketchikan Gateway Borough are Community & Social Service (780 | 11.2%), Management (631 | 9.1%), Education Instruction & Library (506 | 7.3%), Health Diagnosing & Treating (459 | 6.6%), and Computers, Engineering & Science (380 | 5.5%).
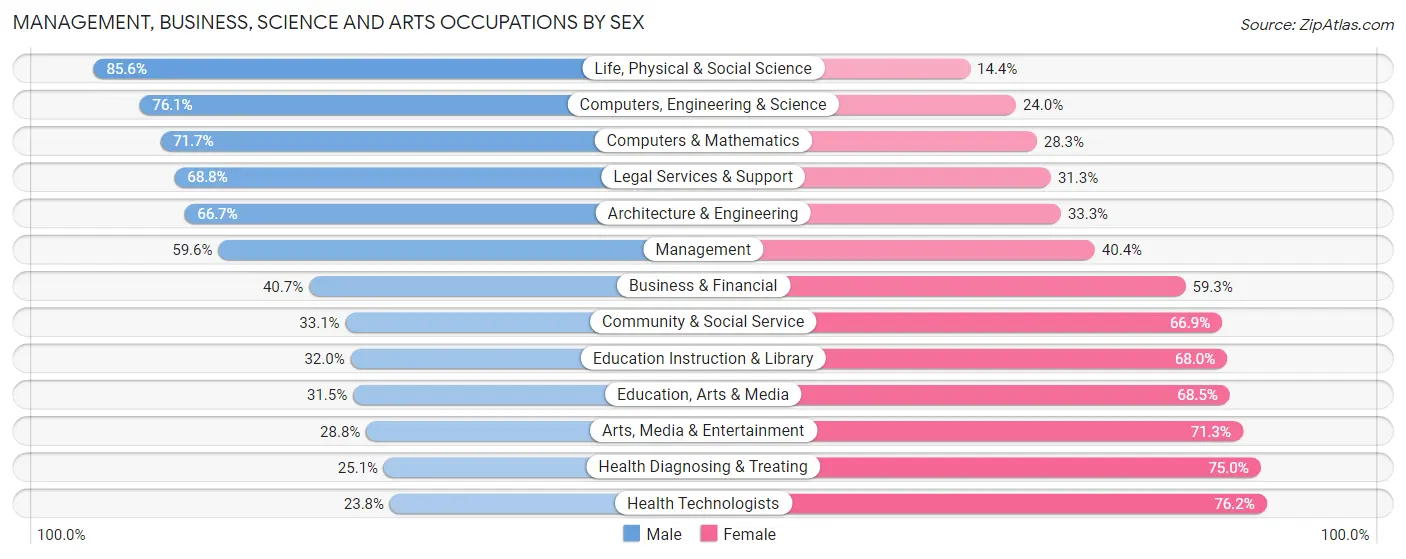
Management, Business, Science and Arts Occupations by Sex
Within the Management, Business, Science and Arts occupations in Ketchikan Gateway Borough, the most male-oriented occupations are Life, Physical & Social Science (85.6%), Computers, Engineering & Science (76.0%), and Computers & Mathematics (71.7%), while the most female-oriented occupations are Health Technologists (76.2%), Health Diagnosing & Treating (75.0%), and Arts, Media & Entertainment (71.3%).
| Occupation | Male | Female |
| Management | 376 (59.6%) | 255 (40.4%) |
| Business & Financial | 96 (40.7%) | 140 (59.3%) |
| Computers, Engineering & Science | 289 (76.0%) | 91 (23.9%) |
| Computers & Mathematics | 76 (71.7%) | 30 (28.3%) |
| Architecture & Engineering | 76 (66.7%) | 38 (33.3%) |
| Life, Physical & Social Science | 137 (85.6%) | 23 (14.4%) |
| Community & Social Service | 258 (33.1%) | 522 (66.9%) |
| Education, Arts & Media | 51 (31.5%) | 111 (68.5%) |
| Legal Services & Support | 22 (68.8%) | 10 (31.2%) |
| Education Instruction & Library | 162 (32.0%) | 344 (68.0%) |
| Arts, Media & Entertainment | 23 (28.7%) | 57 (71.3%) |
| Health Diagnosing & Treating | 115 (25.1%) | 344 (75.0%) |
| Health Technologists | 79 (23.8%) | 253 (76.2%) |
| Total (Category) | 1,134 (45.6%) | 1,352 (54.4%) |
| Total (Overall) | 3,753 (53.9%) | 3,213 (46.1%) |
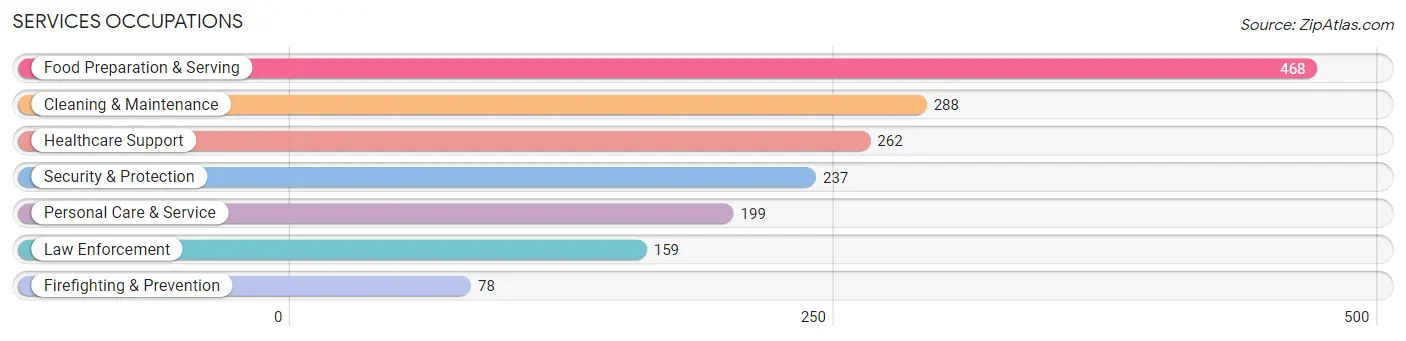
Services Occupations
The most common Services occupations in Ketchikan Gateway Borough are Food Preparation & Serving (468 | 6.7%), Cleaning & Maintenance (288 | 4.1%), Healthcare Support (262 | 3.8%), Security & Protection (237 | 3.4%), and Personal Care & Service (199 | 2.9%).
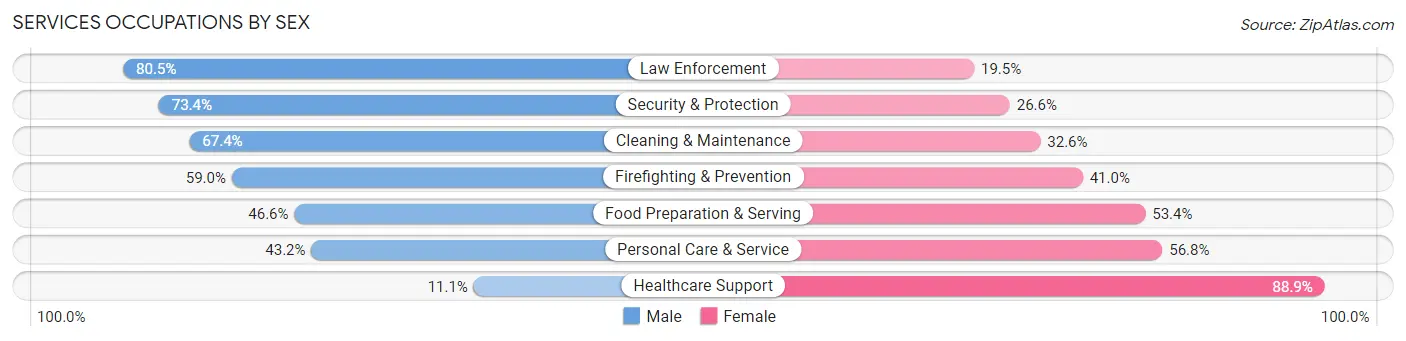
Services Occupations by Sex
Within the Services occupations in Ketchikan Gateway Borough, the most male-oriented occupations are Law Enforcement (80.5%), Security & Protection (73.4%), and Cleaning & Maintenance (67.4%), while the most female-oriented occupations are Healthcare Support (88.9%), Personal Care & Service (56.8%), and Food Preparation & Serving (53.4%).
| Occupation | Male | Female |
| Healthcare Support | 29 (11.1%) | 233 (88.9%) |
| Security & Protection | 174 (73.4%) | 63 (26.6%) |
| Firefighting & Prevention | 46 (59.0%) | 32 (41.0%) |
| Law Enforcement | 128 (80.5%) | 31 (19.5%) |
| Food Preparation & Serving | 218 (46.6%) | 250 (53.4%) |
| Cleaning & Maintenance | 194 (67.4%) | 94 (32.6%) |
| Personal Care & Service | 86 (43.2%) | 113 (56.8%) |
| Total (Category) | 701 (48.2%) | 753 (51.8%) |
| Total (Overall) | 3,753 (53.9%) | 3,213 (46.1%) |
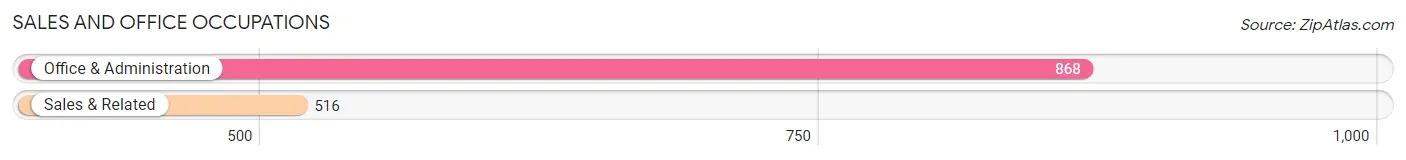
Sales and Office Occupations
The most common Sales and Office occupations in Ketchikan Gateway Borough are Office & Administration (868 | 12.5%), and Sales & Related (516 | 7.4%).
Sales and Office Occupations by Sex
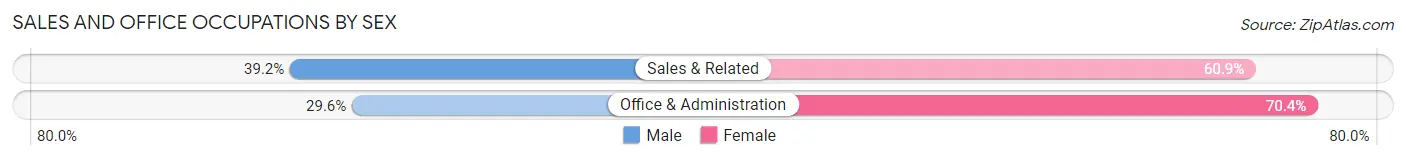
| Occupation | Male | Female |
| Sales & Related | 202 (39.2%) | 314 (60.9%) |
| Office & Administration | 257 (29.6%) | 611 (70.4%) |
| Total (Category) | 459 (33.2%) | 925 (66.8%) |
| Total (Overall) | 3,753 (53.9%) | 3,213 (46.1%) |
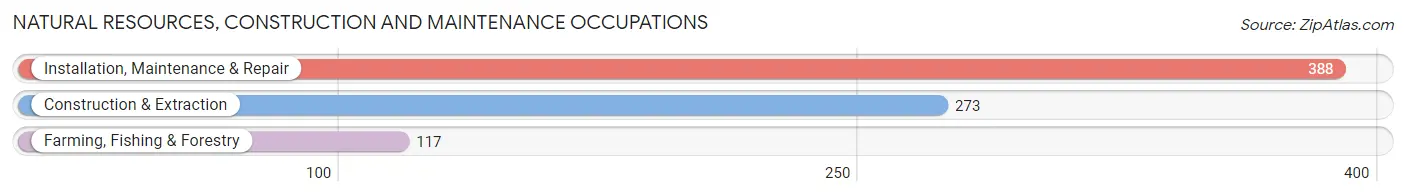
Natural Resources, Construction and Maintenance Occupations
The most common Natural Resources, Construction and Maintenance occupations in Ketchikan Gateway Borough are Installation, Maintenance & Repair (388 | 5.6%), Construction & Extraction (273 | 3.9%), and Farming, Fishing & Forestry (117 | 1.7%).
Natural Resources, Construction and Maintenance Occupations by Sex
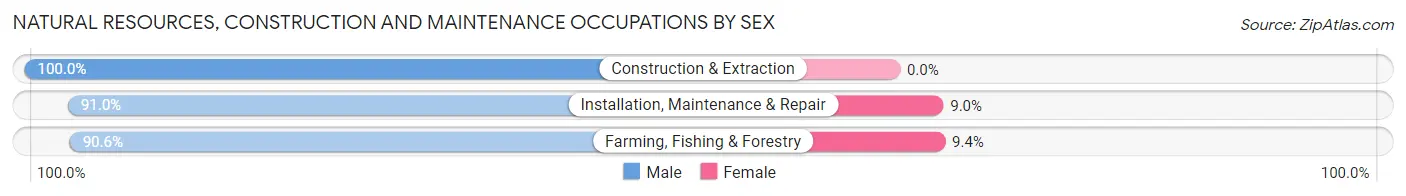
| Occupation | Male | Female |
| Farming, Fishing & Forestry | 106 (90.6%) | 11 (9.4%) |
| Construction & Extraction | 273 (100.0%) | 0 (0.0%) |
| Installation, Maintenance & Repair | 353 (91.0%) | 35 (9.0%) |
| Total (Category) | 732 (94.1%) | 46 (5.9%) |
| Total (Overall) | 3,753 (53.9%) | 3,213 (46.1%) |
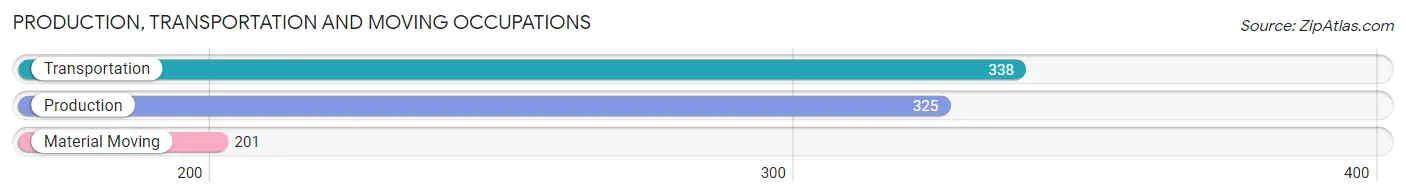
Production, Transportation and Moving Occupations
The most common Production, Transportation and Moving occupations in Ketchikan Gateway Borough are Transportation (338 | 4.9%), Production (325 | 4.7%), and Material Moving (201 | 2.9%).
Production, Transportation and Moving Occupations by Sex
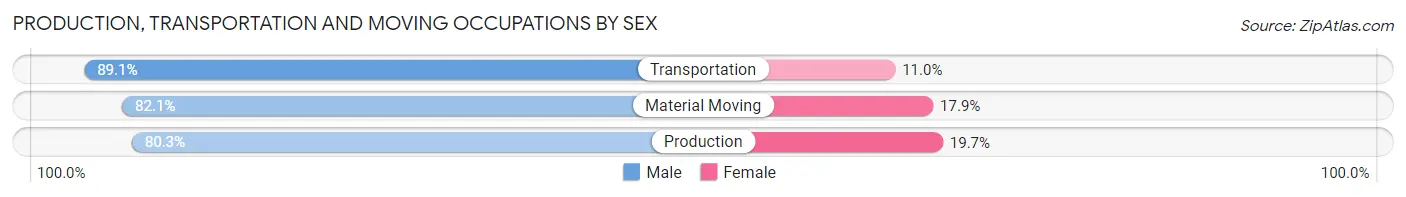
| Occupation | Male | Female |
| Production | 261 (80.3%) | 64 (19.7%) |
| Transportation | 301 (89.0%) | 37 (11.0%) |
| Material Moving | 165 (82.1%) | 36 (17.9%) |
| Total (Category) | 727 (84.1%) | 137 (15.9%) |
| Total (Overall) | 3,753 (53.9%) | 3,213 (46.1%) |
Employment Industries by Sex in Ketchikan Gateway Borough
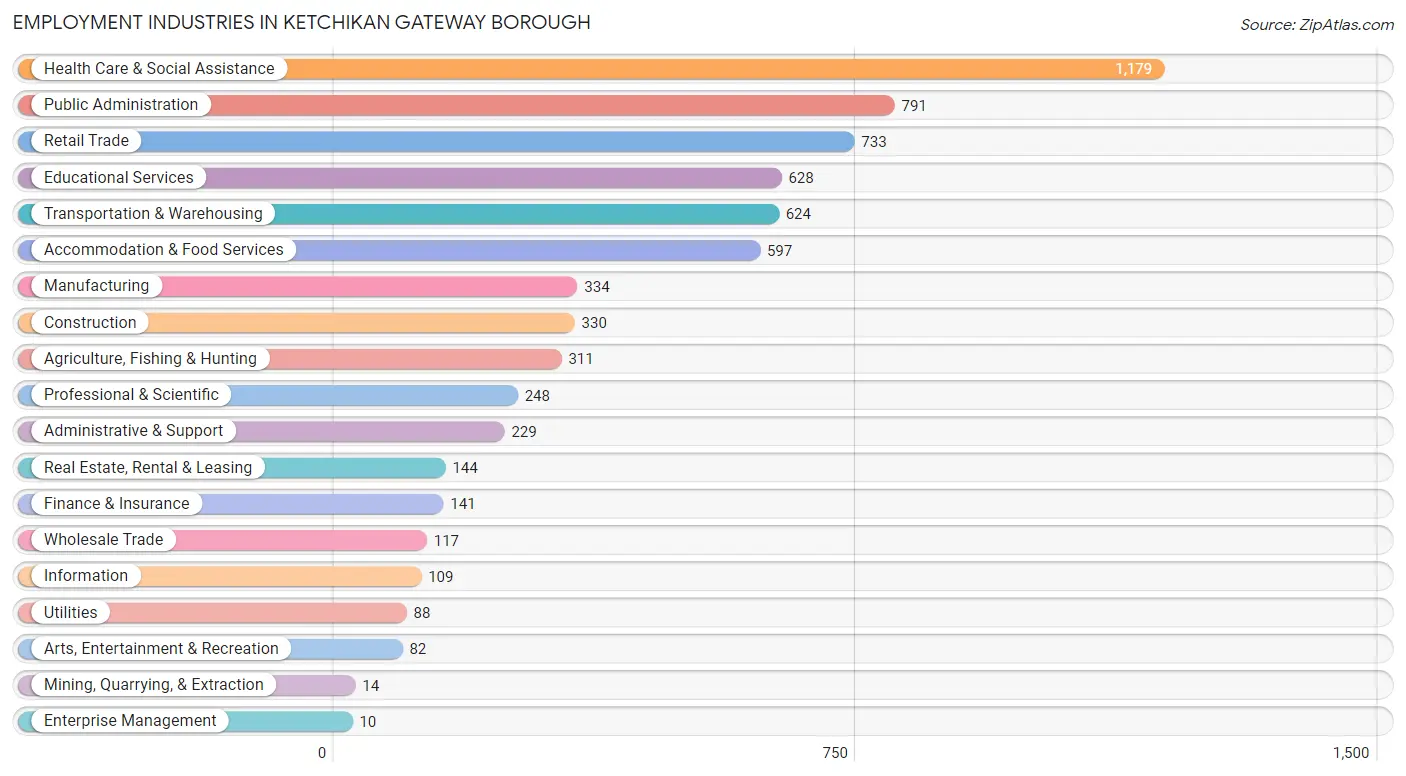
Employment Industries in Ketchikan Gateway Borough
The major employment industries in Ketchikan Gateway Borough include Health Care & Social Assistance (1,179 | 16.9%), Public Administration (791 | 11.4%), Retail Trade (733 | 10.5%), Educational Services (628 | 9.0%), and Transportation & Warehousing (624 | 9.0%).
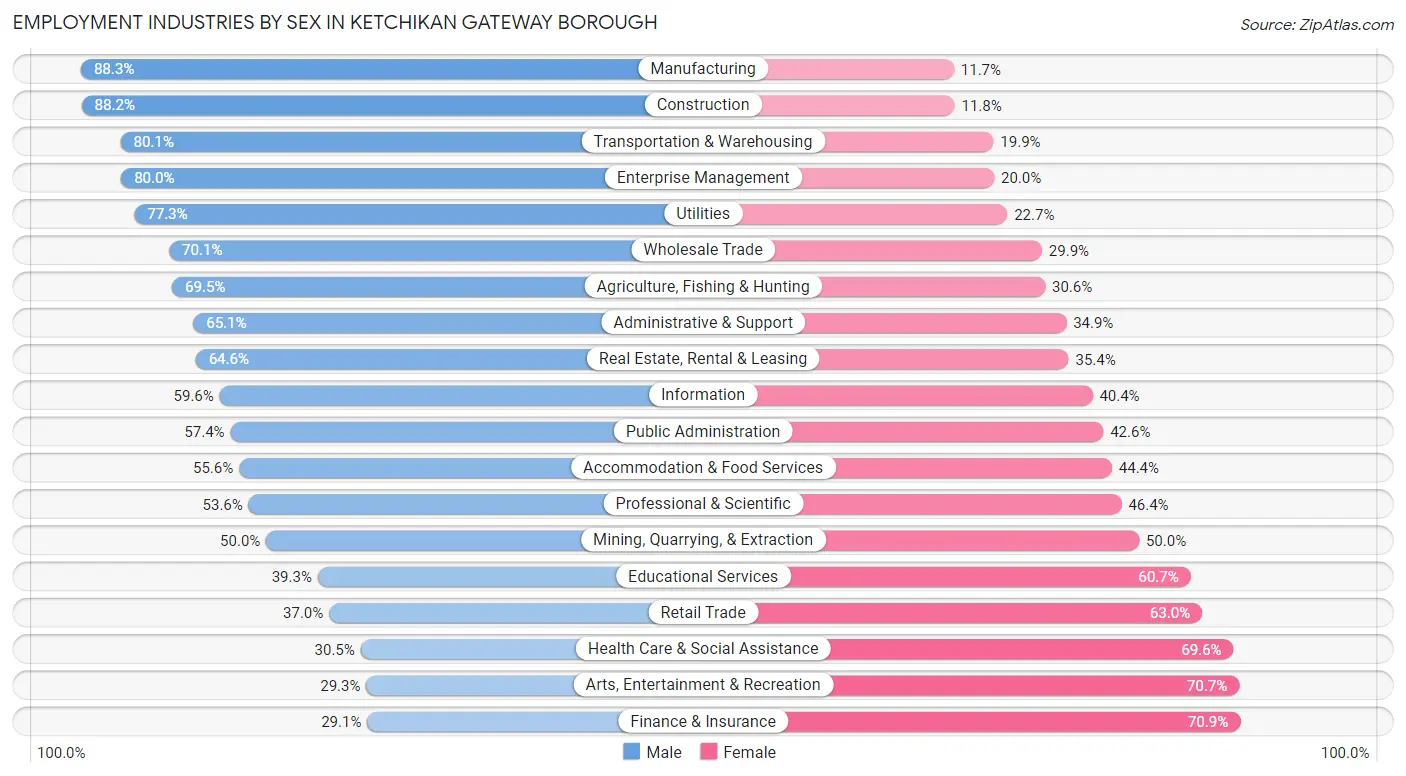
Employment Industries by Sex in Ketchikan Gateway Borough
The Ketchikan Gateway Borough industries that see more men than women are Manufacturing (88.3%), Construction (88.2%), and Transportation & Warehousing (80.1%), whereas the industries that tend to have a higher number of women are Finance & Insurance (70.9%), Arts, Entertainment & Recreation (70.7%), and Health Care & Social Assistance (69.6%).
| Industry | Male | Female |
| Agriculture, Fishing & Hunting | 216 (69.5%) | 95 (30.5%) |
| Mining, Quarrying, & Extraction | 7 (50.0%) | 7 (50.0%) |
| Construction | 291 (88.2%) | 39 (11.8%) |
| Manufacturing | 295 (88.3%) | 39 (11.7%) |
| Wholesale Trade | 82 (70.1%) | 35 (29.9%) |
| Retail Trade | 271 (37.0%) | 462 (63.0%) |
| Transportation & Warehousing | 500 (80.1%) | 124 (19.9%) |
| Utilities | 68 (77.3%) | 20 (22.7%) |
| Information | 65 (59.6%) | 44 (40.4%) |
| Finance & Insurance | 41 (29.1%) | 100 (70.9%) |
| Real Estate, Rental & Leasing | 93 (64.6%) | 51 (35.4%) |
| Professional & Scientific | 133 (53.6%) | 115 (46.4%) |
| Enterprise Management | 8 (80.0%) | 2 (20.0%) |
| Administrative & Support | 149 (65.1%) | 80 (34.9%) |
| Educational Services | 247 (39.3%) | 381 (60.7%) |
| Health Care & Social Assistance | 359 (30.4%) | 820 (69.6%) |
| Arts, Entertainment & Recreation | 24 (29.3%) | 58 (70.7%) |
| Accommodation & Food Services | 332 (55.6%) | 265 (44.4%) |
| Public Administration | 454 (57.4%) | 337 (42.6%) |
| Total | 3,753 (53.9%) | 3,213 (46.1%) |
Education in Ketchikan Gateway Borough
School Enrollment in Ketchikan Gateway Borough
The most common levels of schooling among the 2,779 students in Ketchikan Gateway Borough are elementary school (791 | 28.5%), high school (654 | 23.5%), and middle school (581 | 20.9%).
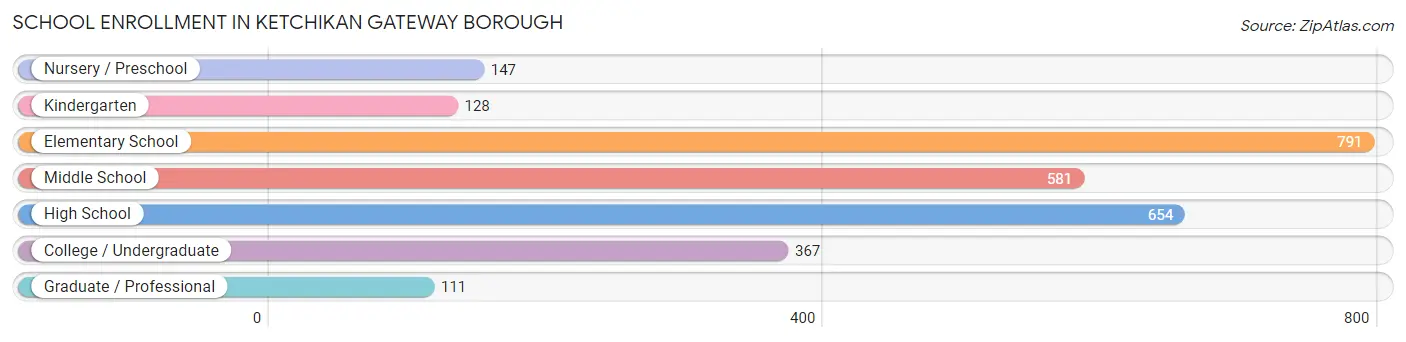
| School Level | # Students | % Students |
| Nursery / Preschool | 147 | 5.3% |
| Kindergarten | 128 | 4.6% |
| Elementary School | 791 | 28.5% |
| Middle School | 581 | 20.9% |
| High School | 654 | 23.5% |
| College / Undergraduate | 367 | 13.2% |
| Graduate / Professional | 111 | 4.0% |
| Total | 2,779 | 100.0% |
School Enrollment by Age by Funding Source in Ketchikan Gateway Borough
Out of a total of 2,779 students who are enrolled in schools in Ketchikan Gateway Borough, 372 (13.4%) attend a private institution, while the remaining 2,407 (86.6%) are enrolled in public schools. The age group of 3 to 4 year olds has the highest likelihood of being enrolled in private schools, with 34 (28.8% in the age bracket) enrolled. Conversely, the age group of 18 to 19 year olds has the lowest likelihood of being enrolled in a private school, with 112 (100.0% in the age bracket) attending a public institution.
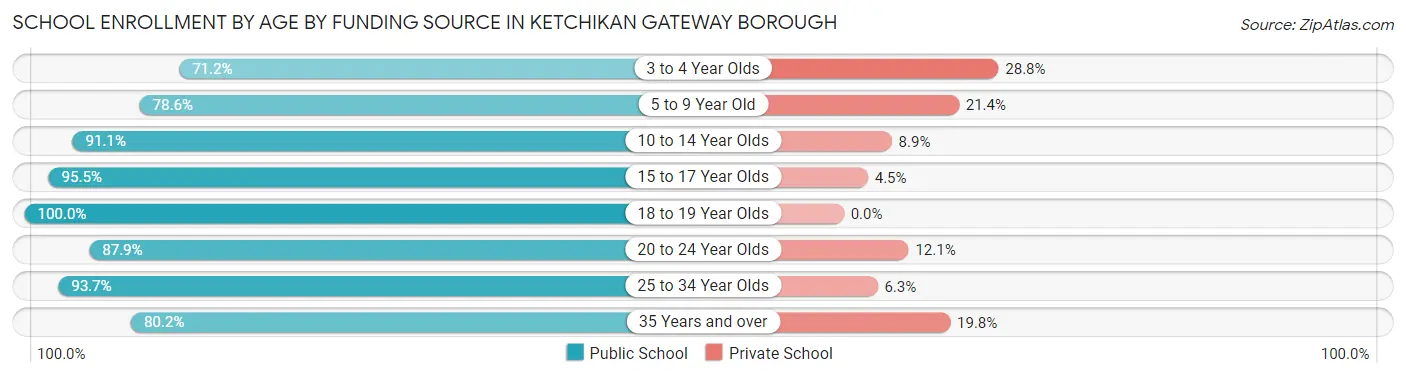
| Age Bracket | Public School | Private School |
| 3 to 4 Year Olds | 84 (71.2%) | 34 (28.8%) |
| 5 to 9 Year Old | 685 (78.6%) | 187 (21.4%) |
| 10 to 14 Year Olds | 662 (91.1%) | 65 (8.9%) |
| 15 to 17 Year Olds | 468 (95.5%) | 22 (4.5%) |
| 18 to 19 Year Olds | 112 (100.0%) | 0 (0.0%) |
| 20 to 24 Year Olds | 51 (87.9%) | 7 (12.1%) |
| 25 to 34 Year Olds | 164 (93.7%) | 11 (6.3%) |
| 35 Years and over | 182 (80.2%) | 45 (19.8%) |
| Total | 2,407 (86.6%) | 372 (13.4%) |
Educational Attainment by Field of Study in Ketchikan Gateway Borough
Business (395 | 13.3%), education (390 | 13.1%), science & technology (378 | 12.7%), bio, nature & agricultural (293 | 9.8%), and social sciences (234 | 7.9%) are the most common fields of study among 2,980 individuals in Ketchikan Gateway Borough who have obtained a bachelor's degree or higher.
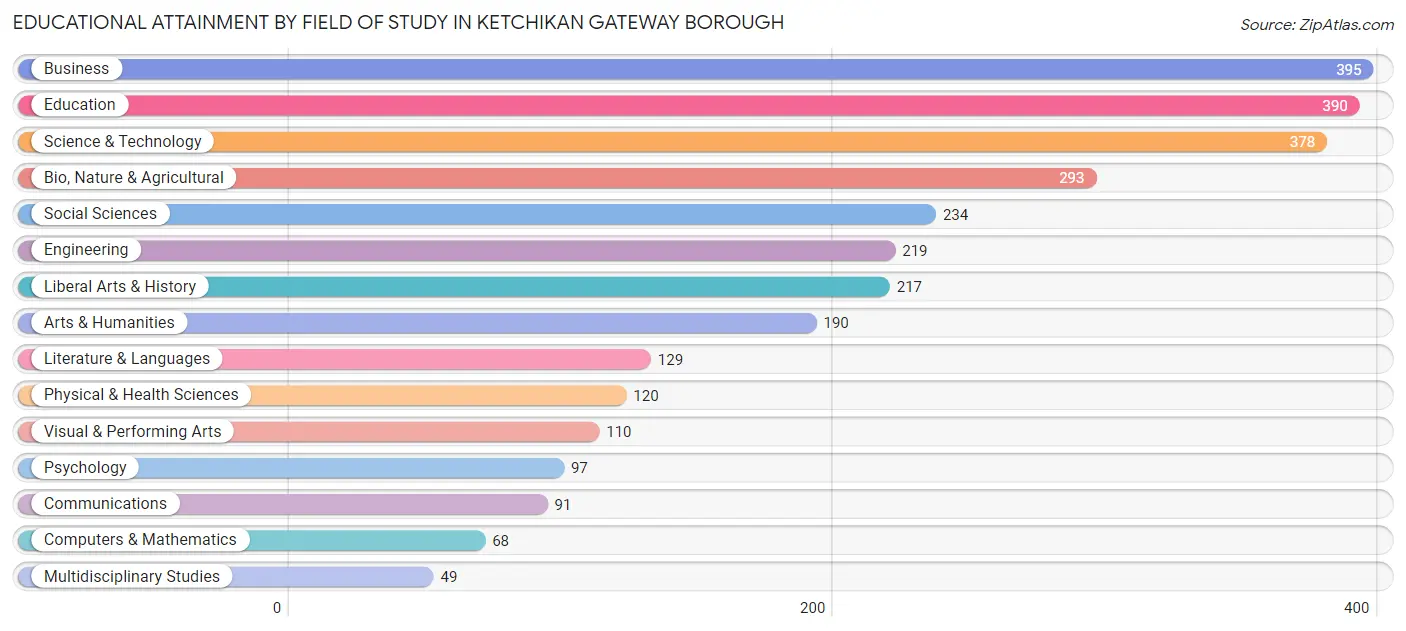
| Field of Study | # Graduates | % Graduates |
| Computers & Mathematics | 68 | 2.3% |
| Bio, Nature & Agricultural | 293 | 9.8% |
| Physical & Health Sciences | 120 | 4.0% |
| Psychology | 97 | 3.3% |
| Social Sciences | 234 | 7.9% |
| Engineering | 219 | 7.3% |
| Multidisciplinary Studies | 49 | 1.6% |
| Science & Technology | 378 | 12.7% |
| Business | 395 | 13.3% |
| Education | 390 | 13.1% |
| Literature & Languages | 129 | 4.3% |
| Liberal Arts & History | 217 | 7.3% |
| Visual & Performing Arts | 110 | 3.7% |
| Communications | 91 | 3.0% |
| Arts & Humanities | 190 | 6.4% |
| Total | 2,980 | 100.0% |
Transportation & Commute in Ketchikan Gateway Borough
Vehicle Availability by Sex in Ketchikan Gateway Borough
The most prevalent vehicle ownership categories in Ketchikan Gateway Borough are males with 2 vehicles (1,446, accounting for 37.9%) and females with 2 vehicles (1,157, making up 46.3%).
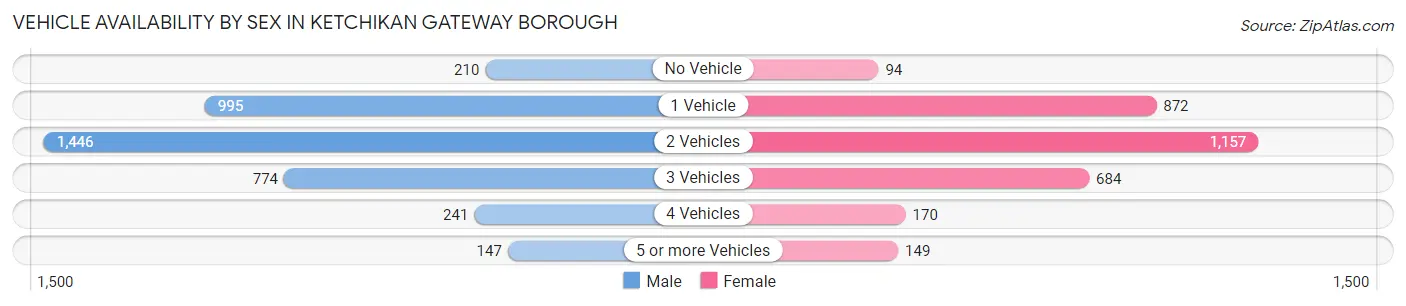
| Vehicles Available | Male | Female |
| No Vehicle | 210 (5.5%) | 94 (3.0%) |
| 1 Vehicle | 995 (26.1%) | 872 (27.9%) |
| 2 Vehicles | 1,446 (37.9%) | 1,157 (37.0%) |
| 3 Vehicles | 774 (20.3%) | 684 (21.9%) |
| 4 Vehicles | 241 (6.3%) | 170 (5.4%) |
| 5 or more Vehicles | 147 (3.9%) | 149 (4.8%) |
| Total | 3,813 (100.0%) | 3,126 (100.0%) |
Commute Time in Ketchikan Gateway Borough
The most frequently occuring commute durations in Ketchikan Gateway Borough are 5 to 9 minutes (1,720 commuters, 25.6%), 10 to 14 minutes (1,386 commuters, 20.6%), and 15 to 19 minutes (1,197 commuters, 17.8%).
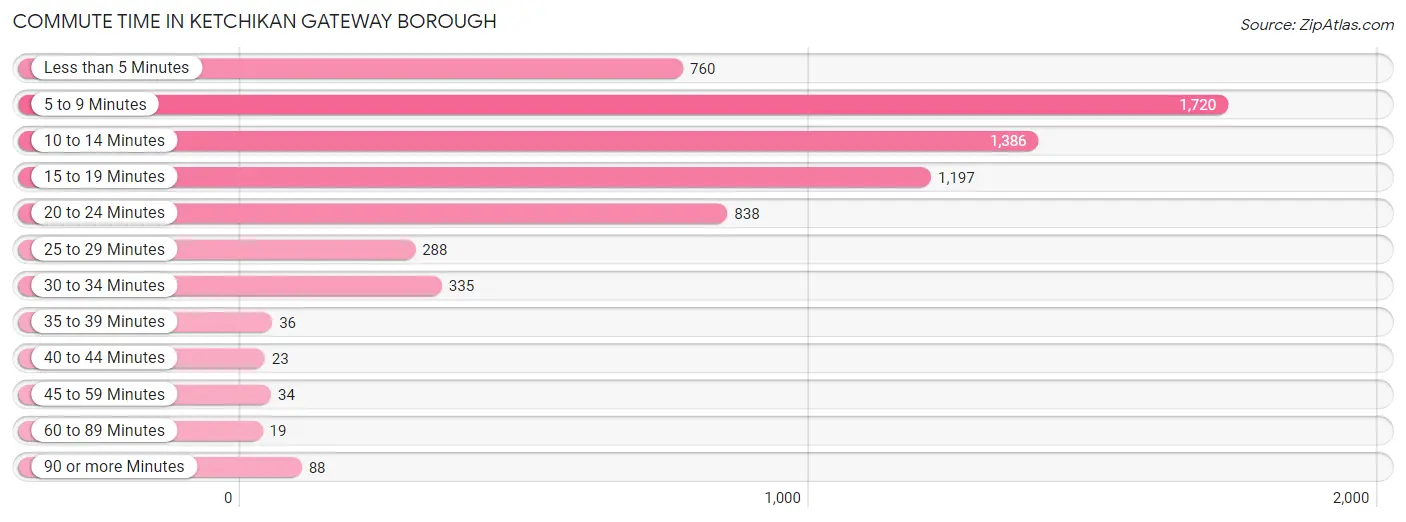
| Commute Time | # Commuters | % Commuters |
| Less than 5 Minutes | 760 | 11.3% |
| 5 to 9 Minutes | 1,720 | 25.6% |
| 10 to 14 Minutes | 1,386 | 20.6% |
| 15 to 19 Minutes | 1,197 | 17.8% |
| 20 to 24 Minutes | 838 | 12.5% |
| 25 to 29 Minutes | 288 | 4.3% |
| 30 to 34 Minutes | 335 | 5.0% |
| 35 to 39 Minutes | 36 | 0.5% |
| 40 to 44 Minutes | 23 | 0.3% |
| 45 to 59 Minutes | 34 | 0.5% |
| 60 to 89 Minutes | 19 | 0.3% |
| 90 or more Minutes | 88 | 1.3% |
Commute Time by Sex in Ketchikan Gateway Borough
The most common commute times in Ketchikan Gateway Borough are 5 to 9 minutes (957 commuters, 25.5%) for males and 5 to 9 minutes (763 commuters, 25.6%) for females.
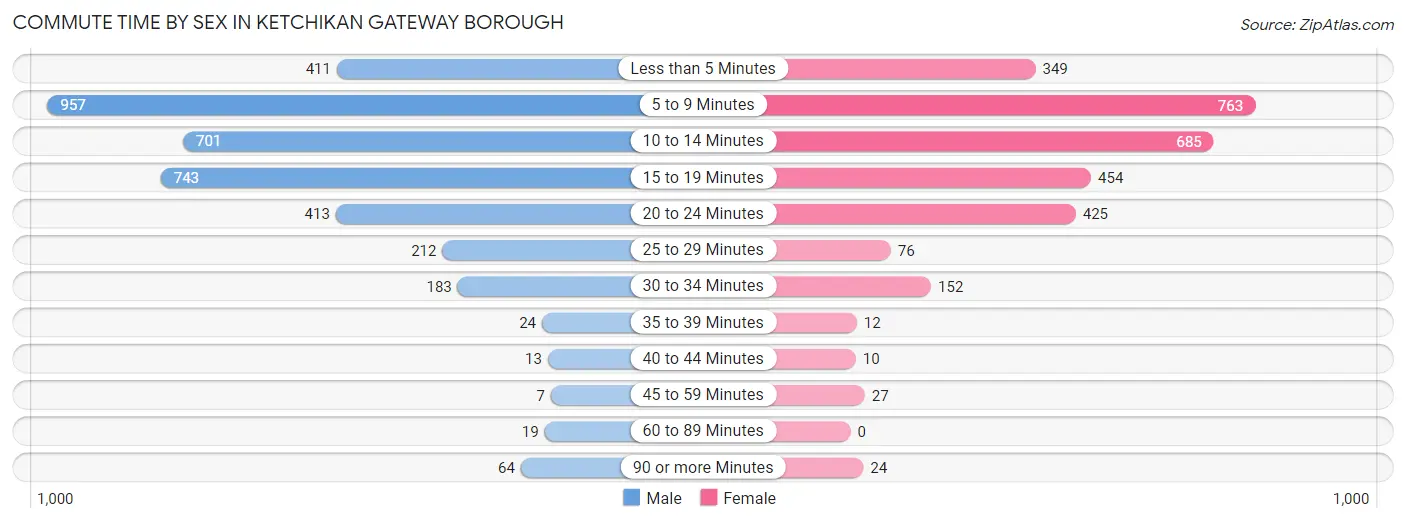
| Commute Time | Male | Female |
| Less than 5 Minutes | 411 (11.0%) | 349 (11.7%) |
| 5 to 9 Minutes | 957 (25.5%) | 763 (25.6%) |
| 10 to 14 Minutes | 701 (18.7%) | 685 (23.0%) |
| 15 to 19 Minutes | 743 (19.8%) | 454 (15.2%) |
| 20 to 24 Minutes | 413 (11.0%) | 425 (14.3%) |
| 25 to 29 Minutes | 212 (5.7%) | 76 (2.5%) |
| 30 to 34 Minutes | 183 (4.9%) | 152 (5.1%) |
| 35 to 39 Minutes | 24 (0.6%) | 12 (0.4%) |
| 40 to 44 Minutes | 13 (0.4%) | 10 (0.3%) |
| 45 to 59 Minutes | 7 (0.2%) | 27 (0.9%) |
| 60 to 89 Minutes | 19 (0.5%) | 0 (0.0%) |
| 90 or more Minutes | 64 (1.7%) | 24 (0.8%) |
Time of Departure to Work by Sex in Ketchikan Gateway Borough
The most frequent times of departure to work in Ketchikan Gateway Borough are 7:30 AM to 7:59 AM (734, 19.6%) for males and 7:30 AM to 7:59 AM (643, 21.6%) for females.
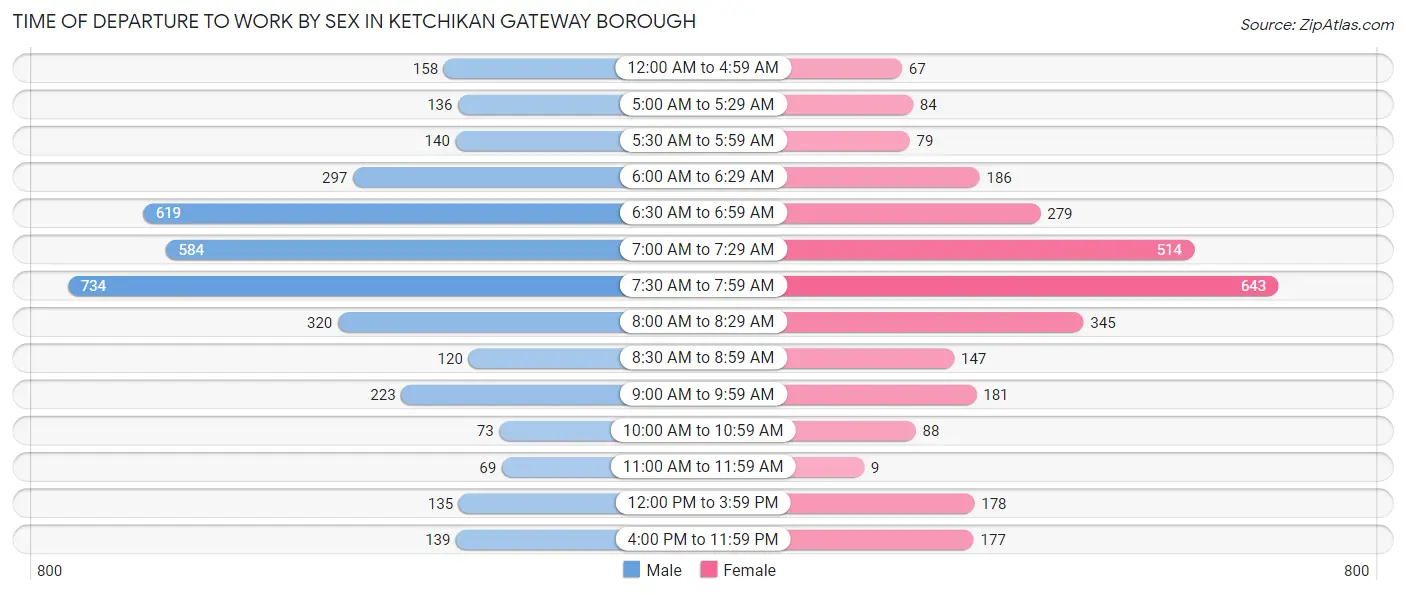
| Time of Departure | Male | Female |
| 12:00 AM to 4:59 AM | 158 (4.2%) | 67 (2.2%) |
| 5:00 AM to 5:29 AM | 136 (3.6%) | 84 (2.8%) |
| 5:30 AM to 5:59 AM | 140 (3.7%) | 79 (2.6%) |
| 6:00 AM to 6:29 AM | 297 (7.9%) | 186 (6.2%) |
| 6:30 AM to 6:59 AM | 619 (16.5%) | 279 (9.4%) |
| 7:00 AM to 7:29 AM | 584 (15.6%) | 514 (17.3%) |
| 7:30 AM to 7:59 AM | 734 (19.6%) | 643 (21.6%) |
| 8:00 AM to 8:29 AM | 320 (8.5%) | 345 (11.6%) |
| 8:30 AM to 8:59 AM | 120 (3.2%) | 147 (4.9%) |
| 9:00 AM to 9:59 AM | 223 (5.9%) | 181 (6.1%) |
| 10:00 AM to 10:59 AM | 73 (1.9%) | 88 (3.0%) |
| 11:00 AM to 11:59 AM | 69 (1.8%) | 9 (0.3%) |
| 12:00 PM to 3:59 PM | 135 (3.6%) | 178 (6.0%) |
| 4:00 PM to 11:59 PM | 139 (3.7%) | 177 (5.9%) |
| Total | 3,747 (100.0%) | 2,977 (100.0%) |
Housing Occupancy in Ketchikan Gateway Borough
Occupancy by Ownership in Ketchikan Gateway Borough
Of the total 5,568 dwellings in Ketchikan Gateway Borough, owner-occupied units account for 3,656 (65.7%), while renter-occupied units make up 1,912 (34.3%).
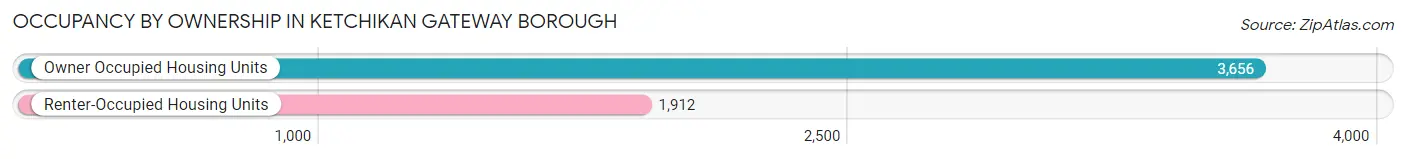
| Occupancy | # Housing Units | % Housing Units |
| Owner Occupied Housing Units | 3,656 | 65.7% |
| Renter-Occupied Housing Units | 1,912 | 34.3% |
| Total Occupied Housing Units | 5,568 | 100.0% |
Occupancy by Household Size in Ketchikan Gateway Borough
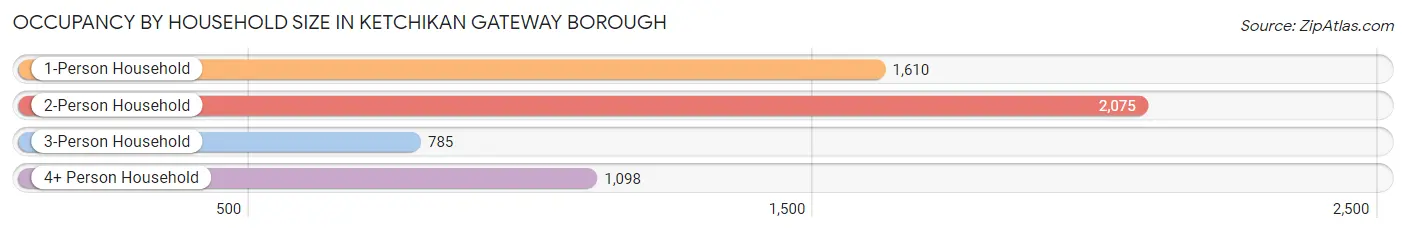
| Household Size | # Housing Units | % Housing Units |
| 1-Person Household | 1,610 | 28.9% |
| 2-Person Household | 2,075 | 37.3% |
| 3-Person Household | 785 | 14.1% |
| 4+ Person Household | 1,098 | 19.7% |
| Total Housing Units | 5,568 | 100.0% |
Occupancy by Ownership by Household Size in Ketchikan Gateway Borough
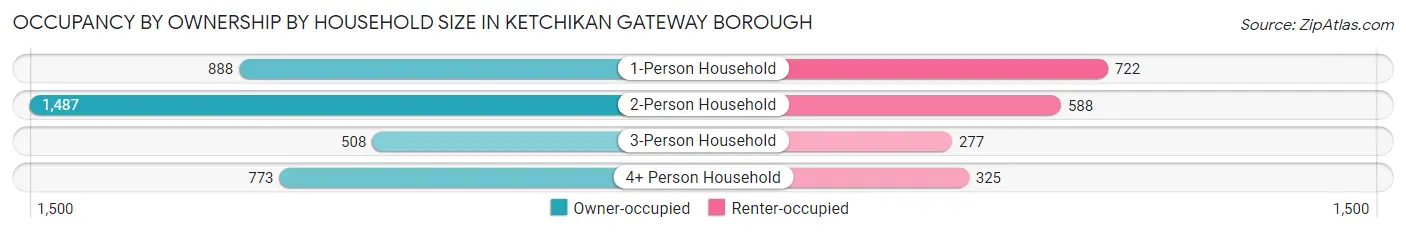
| Household Size | Owner-occupied | Renter-occupied |
| 1-Person Household | 888 (55.2%) | 722 (44.8%) |
| 2-Person Household | 1,487 (71.7%) | 588 (28.3%) |
| 3-Person Household | 508 (64.7%) | 277 (35.3%) |
| 4+ Person Household | 773 (70.4%) | 325 (29.6%) |
| Total Housing Units | 3,656 (65.7%) | 1,912 (34.3%) |
Occupancy by Educational Attainment in Ketchikan Gateway Borough
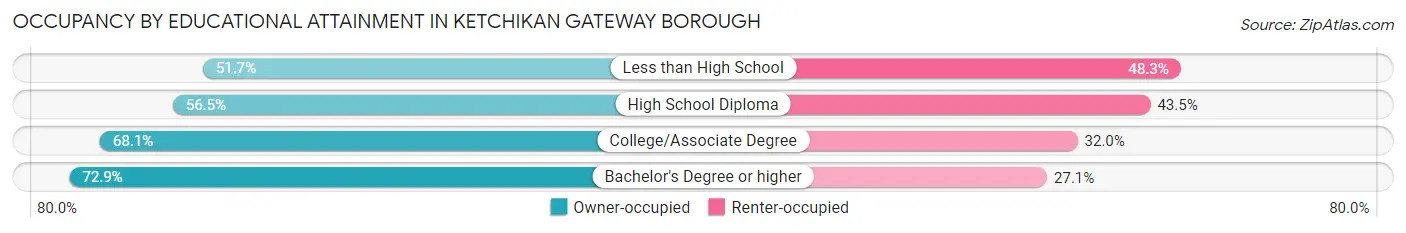
| Household Size | Owner-occupied | Renter-occupied |
| Less than High School | 150 (51.7%) | 140 (48.3%) |
| High School Diploma | 792 (56.5%) | 610 (43.5%) |
| College/Associate Degree | 1,563 (68.0%) | 734 (32.0%) |
| Bachelor's Degree or higher | 1,151 (72.9%) | 428 (27.1%) |
Occupancy by Age of Householder in Ketchikan Gateway Borough
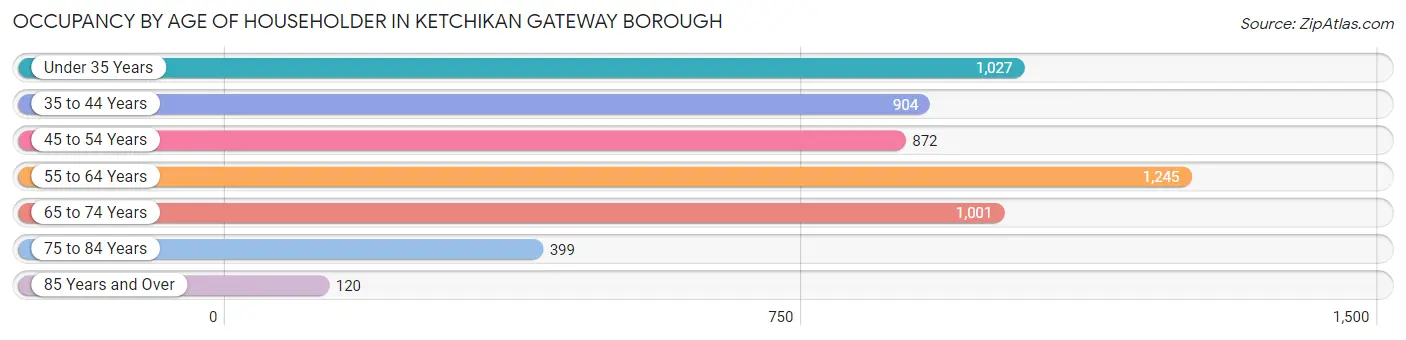
| Age Bracket | # Households | % Households |
| Under 35 Years | 1,027 | 18.4% |
| 35 to 44 Years | 904 | 16.2% |
| 45 to 54 Years | 872 | 15.7% |
| 55 to 64 Years | 1,245 | 22.4% |
| 65 to 74 Years | 1,001 | 18.0% |
| 75 to 84 Years | 399 | 7.2% |
| 85 Years and Over | 120 | 2.2% |
| Total | 5,568 | 100.0% |
Housing Finances in Ketchikan Gateway Borough
Median Income by Occupancy in Ketchikan Gateway Borough
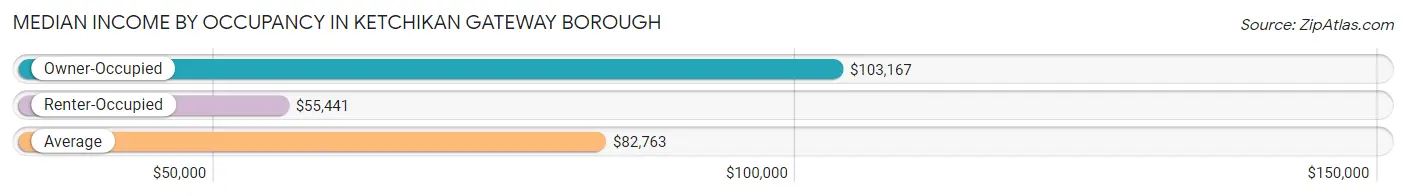
| Occupancy Type | # Households | Median Income |
| Owner-Occupied | 3,656 (65.7%) | $103,167 |
| Renter-Occupied | 1,912 (34.3%) | $55,441 |
| Average | 5,568 (100.0%) | $82,763 |
Occupancy by Householder Income Bracket in Ketchikan Gateway Borough
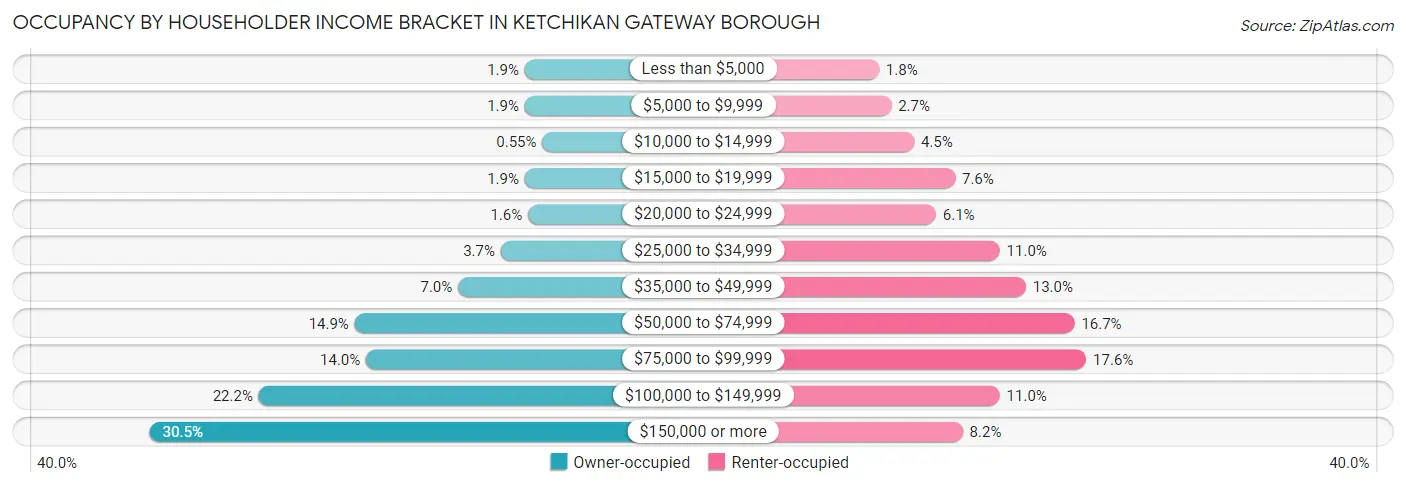
| Income Bracket | Owner-occupied | Renter-occupied |
| Less than $5,000 | 69 (1.9%) | 34 (1.8%) |
| $5,000 to $9,999 | 69 (1.9%) | 52 (2.7%) |
| $10,000 to $14,999 | 20 (0.5%) | 85 (4.4%) |
| $15,000 to $19,999 | 69 (1.9%) | 145 (7.6%) |
| $20,000 to $24,999 | 60 (1.6%) | 117 (6.1%) |
| $25,000 to $34,999 | 136 (3.7%) | 210 (11.0%) |
| $35,000 to $49,999 | 255 (7.0%) | 248 (13.0%) |
| $50,000 to $74,999 | 543 (14.8%) | 319 (16.7%) |
| $75,000 to $99,999 | 511 (14.0%) | 336 (17.6%) |
| $100,000 to $149,999 | 810 (22.2%) | 210 (11.0%) |
| $150,000 or more | 1,114 (30.5%) | 156 (8.2%) |
| Total | 3,656 (100.0%) | 1,912 (100.0%) |
Monthly Housing Cost Tiers in Ketchikan Gateway Borough
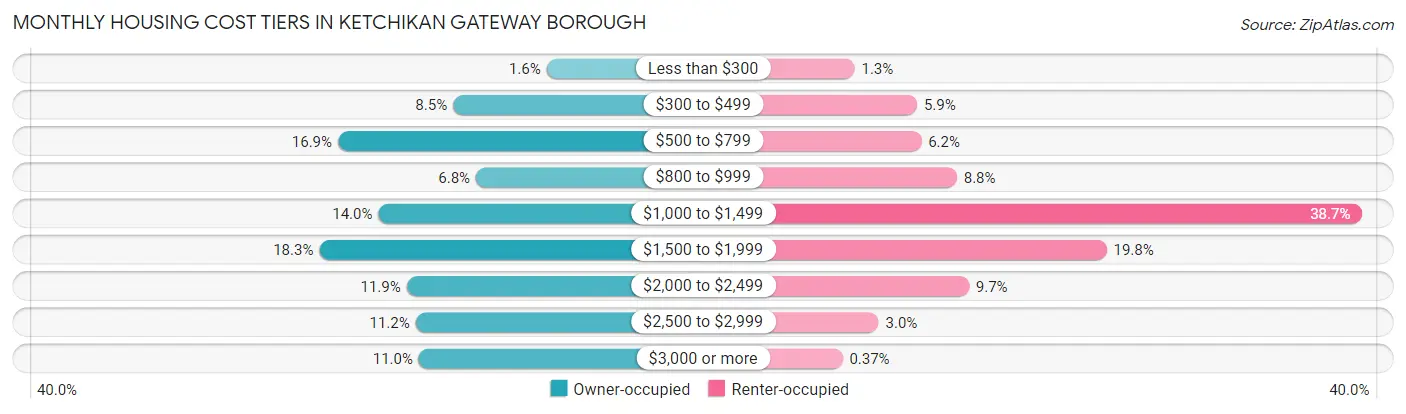
| Monthly Cost | Owner-occupied | Renter-occupied |
| Less than $300 | 57 (1.6%) | 24 (1.3%) |
| $300 to $499 | 309 (8.5%) | 112 (5.9%) |
| $500 to $799 | 619 (16.9%) | 118 (6.2%) |
| $800 to $999 | 247 (6.8%) | 168 (8.8%) |
| $1,000 to $1,499 | 510 (14.0%) | 739 (38.7%) |
| $1,500 to $1,999 | 669 (18.3%) | 379 (19.8%) |
| $2,000 to $2,499 | 434 (11.9%) | 185 (9.7%) |
| $2,500 to $2,999 | 410 (11.2%) | 58 (3.0%) |
| $3,000 or more | 401 (11.0%) | 7 (0.4%) |
| Total | 3,656 (100.0%) | 1,912 (100.0%) |
Physical Housing Characteristics in Ketchikan Gateway Borough
Housing Structures in Ketchikan Gateway Borough
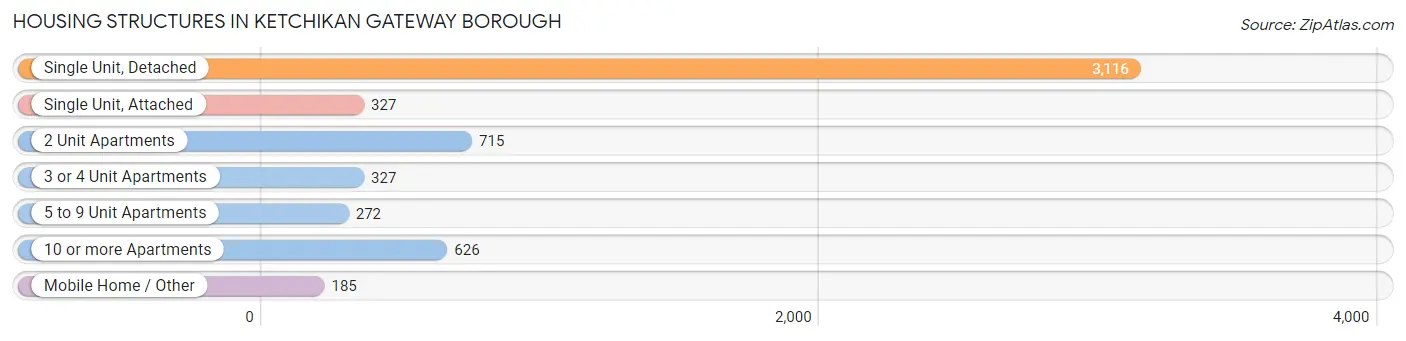
| Structure Type | # Housing Units | % Housing Units |
| Single Unit, Detached | 3,116 | 56.0% |
| Single Unit, Attached | 327 | 5.9% |
| 2 Unit Apartments | 715 | 12.8% |
| 3 or 4 Unit Apartments | 327 | 5.9% |
| 5 to 9 Unit Apartments | 272 | 4.9% |
| 10 or more Apartments | 626 | 11.2% |
| Mobile Home / Other | 185 | 3.3% |
| Total | 5,568 | 100.0% |
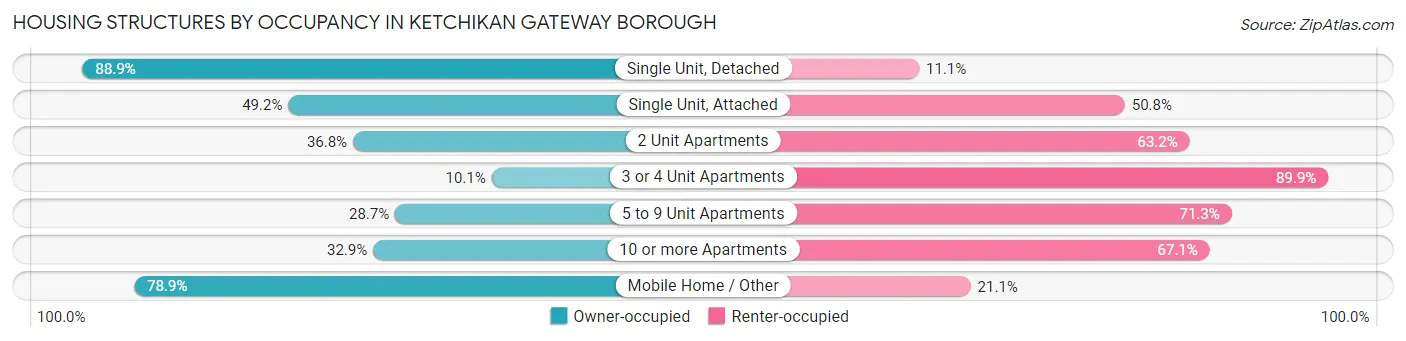
Housing Structures by Occupancy in Ketchikan Gateway Borough
| Structure Type | Owner-occupied | Renter-occupied |
| Single Unit, Detached | 2,769 (88.9%) | 347 (11.1%) |
| Single Unit, Attached | 161 (49.2%) | 166 (50.8%) |
| 2 Unit Apartments | 263 (36.8%) | 452 (63.2%) |
| 3 or 4 Unit Apartments | 33 (10.1%) | 294 (89.9%) |
| 5 to 9 Unit Apartments | 78 (28.7%) | 194 (71.3%) |
| 10 or more Apartments | 206 (32.9%) | 420 (67.1%) |
| Mobile Home / Other | 146 (78.9%) | 39 (21.1%) |
| Total | 3,656 (65.7%) | 1,912 (34.3%) |
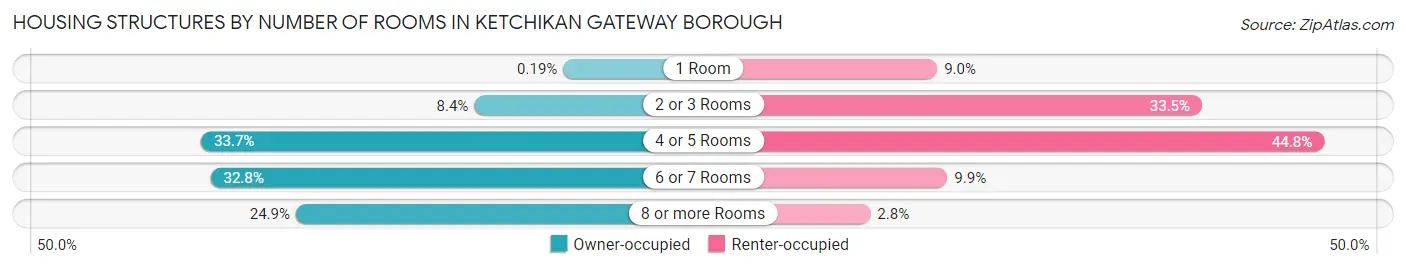
Housing Structures by Number of Rooms in Ketchikan Gateway Borough
| Number of Rooms | Owner-occupied | Renter-occupied |
| 1 Room | 7 (0.2%) | 172 (9.0%) |
| 2 or 3 Rooms | 308 (8.4%) | 640 (33.5%) |
| 4 or 5 Rooms | 1,231 (33.7%) | 856 (44.8%) |
| 6 or 7 Rooms | 1,199 (32.8%) | 190 (9.9%) |
| 8 or more Rooms | 911 (24.9%) | 54 (2.8%) |
| Total | 3,656 (100.0%) | 1,912 (100.0%) |
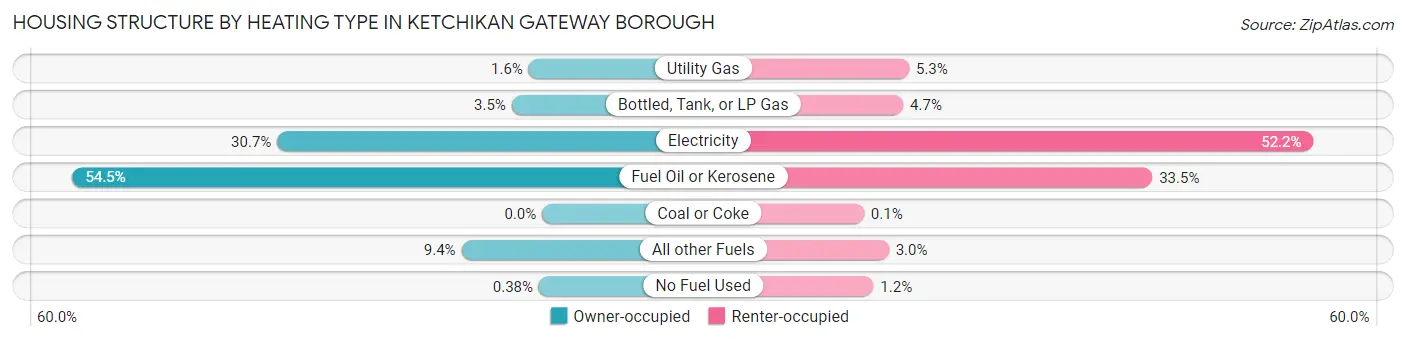
Housing Structure by Heating Type in Ketchikan Gateway Borough
| Heating Type | Owner-occupied | Renter-occupied |
| Utility Gas | 57 (1.6%) | 102 (5.3%) |
| Bottled, Tank, or LP Gas | 129 (3.5%) | 89 (4.6%) |
| Electricity | 1,123 (30.7%) | 998 (52.2%) |
| Fuel Oil or Kerosene | 1,991 (54.5%) | 641 (33.5%) |
| Coal or Coke | 0 (0.0%) | 2 (0.1%) |
| All other Fuels | 342 (9.3%) | 57 (3.0%) |
| No Fuel Used | 14 (0.4%) | 23 (1.2%) |
| Total | 3,656 (100.0%) | 1,912 (100.0%) |
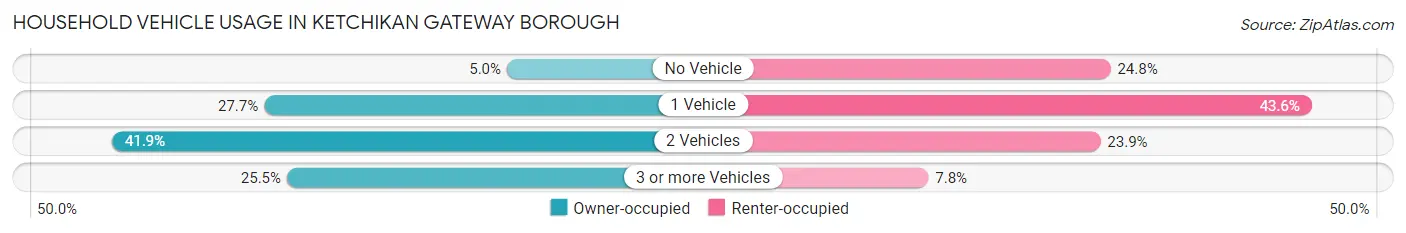
Household Vehicle Usage in Ketchikan Gateway Borough
| Vehicles per Household | Owner-occupied | Renter-occupied |
| No Vehicle | 182 (5.0%) | 474 (24.8%) |
| 1 Vehicle | 1,011 (27.7%) | 833 (43.6%) |
| 2 Vehicles | 1,530 (41.8%) | 456 (23.8%) |
| 3 or more Vehicles | 933 (25.5%) | 149 (7.8%) |
| Total | 3,656 (100.0%) | 1,912 (100.0%) |
Real Estate & Mortgages in Ketchikan Gateway Borough
Real Estate and Mortgage Overview in Ketchikan Gateway Borough
| Characteristic | Without Mortgage | With Mortgage |
| Housing Units | 1,354 | 2,302 |
| Median Property Value | $299,100 | $393,700 |
| Median Household Income | $66,053 | $853 |
| Monthly Housing Costs | $622 | $401 |
| Real Estate Taxes | $2,396 | $94 |
Property Value by Mortgage Status in Ketchikan Gateway Borough
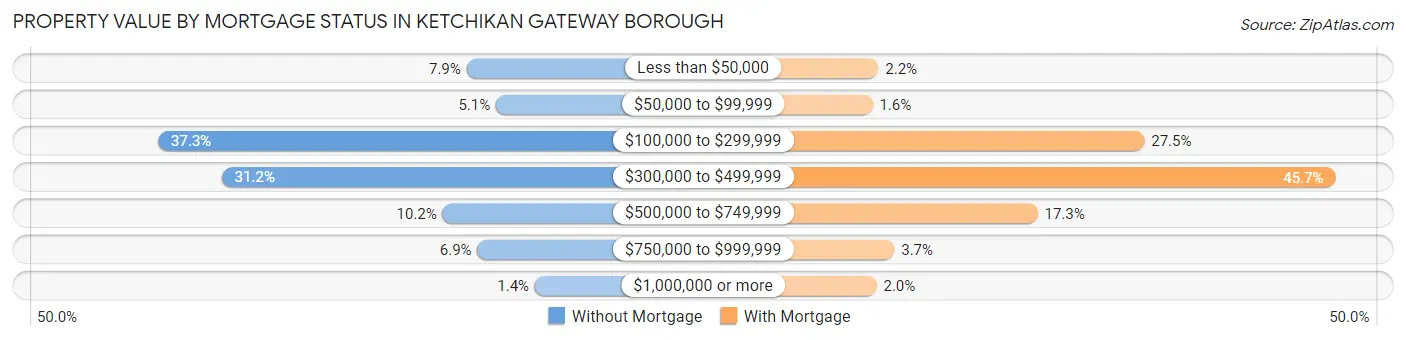
| Property Value | Without Mortgage | With Mortgage |
| Less than $50,000 | 107 (7.9%) | 50 (2.2%) |
| $50,000 to $99,999 | 69 (5.1%) | 37 (1.6%) |
| $100,000 to $299,999 | 505 (37.3%) | 633 (27.5%) |
| $300,000 to $499,999 | 423 (31.2%) | 1,052 (45.7%) |
| $500,000 to $749,999 | 138 (10.2%) | 399 (17.3%) |
| $750,000 to $999,999 | 93 (6.9%) | 85 (3.7%) |
| $1,000,000 or more | 19 (1.4%) | 46 (2.0%) |
| Total | 1,354 (100.0%) | 2,302 (100.0%) |
Household Income by Mortgage Status in Ketchikan Gateway Borough
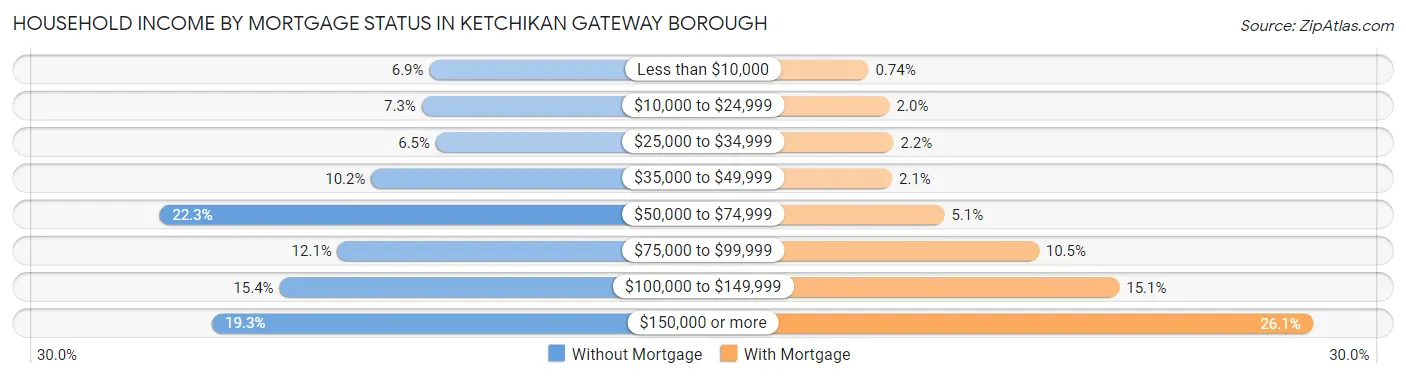
| Household Income | Without Mortgage | With Mortgage |
| Less than $10,000 | 93 (6.9%) | 17 (0.7%) |
| $10,000 to $24,999 | 99 (7.3%) | 45 (1.9%) |
| $25,000 to $34,999 | 88 (6.5%) | 50 (2.2%) |
| $35,000 to $49,999 | 138 (10.2%) | 48 (2.1%) |
| $50,000 to $74,999 | 302 (22.3%) | 117 (5.1%) |
| $75,000 to $99,999 | 164 (12.1%) | 241 (10.5%) |
| $100,000 to $149,999 | 209 (15.4%) | 347 (15.1%) |
| $150,000 or more | 261 (19.3%) | 601 (26.1%) |
| Total | 1,354 (100.0%) | 2,302 (100.0%) |
Property Value to Household Income Ratio in Ketchikan Gateway Borough
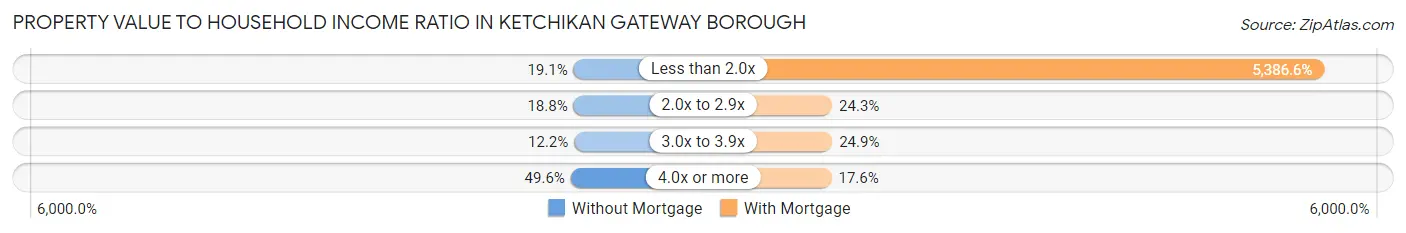
| Value-to-Income Ratio | Without Mortgage | With Mortgage |
| Less than 2.0x | 259 (19.1%) | 124,000 (5,386.6%) |
| 2.0x to 2.9x | 254 (18.8%) | 560 (24.3%) |
| 3.0x to 3.9x | 165 (12.2%) | 574 (24.9%) |
| 4.0x or more | 672 (49.6%) | 404 (17.5%) |
| Total | 1,354 (100.0%) | 2,302 (100.0%) |
Real Estate Taxes by Mortgage Status in Ketchikan Gateway Borough
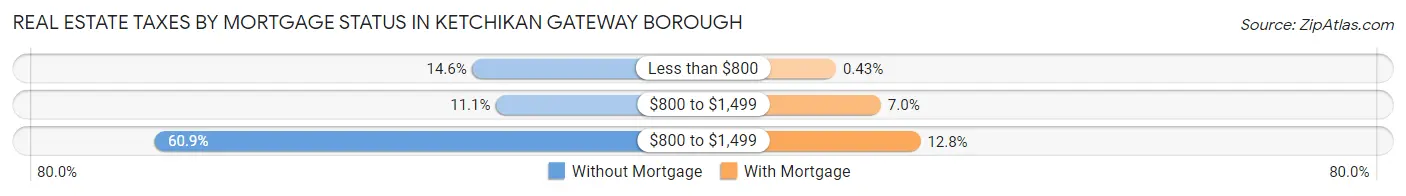
| Property Taxes | Without Mortgage | With Mortgage |
| Less than $800 | 197 (14.5%) | 10 (0.4%) |
| $800 to $1,499 | 150 (11.1%) | 161 (7.0%) |
| $800 to $1,499 | 825 (60.9%) | 294 (12.8%) |
| Total | 1,354 (100.0%) | 2,302 (100.0%) |
Health & Disability in Ketchikan Gateway Borough
Health Insurance Coverage by Age in Ketchikan Gateway Borough
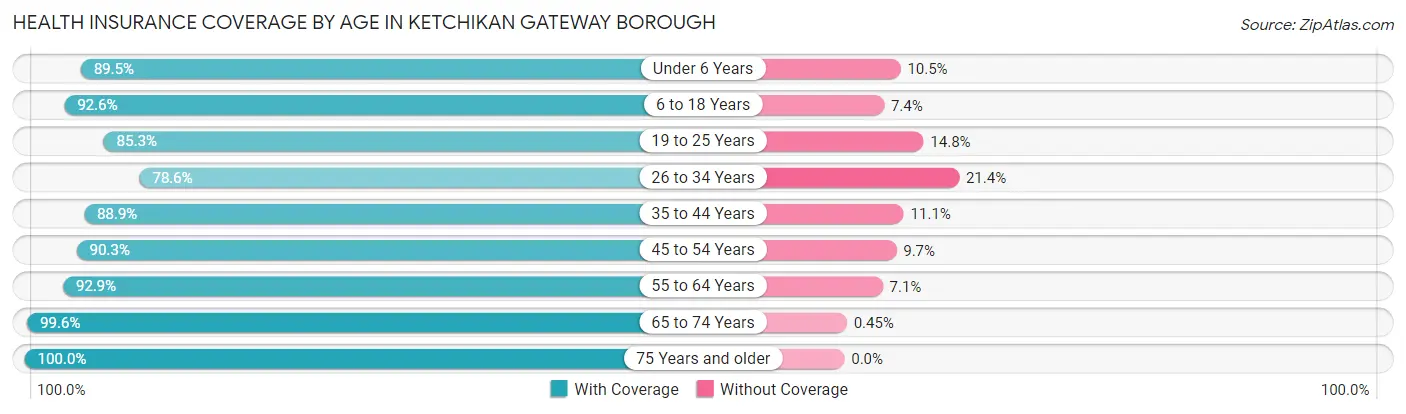
| Age Bracket | With Coverage | Without Coverage |
| Under 6 Years | 795 (89.5%) | 93 (10.5%) |
| 6 to 18 Years | 1,977 (92.6%) | 158 (7.4%) |
| 19 to 25 Years | 942 (85.3%) | 163 (14.7%) |
| 26 to 34 Years | 1,319 (78.6%) | 359 (21.4%) |
| 35 to 44 Years | 1,574 (88.9%) | 196 (11.1%) |
| 45 to 54 Years | 1,520 (90.3%) | 163 (9.7%) |
| 55 to 64 Years | 1,900 (92.9%) | 146 (7.1%) |
| 65 to 74 Years | 1,545 (99.6%) | 7 (0.4%) |
| 75 Years and older | 752 (100.0%) | 0 (0.0%) |
| Total | 12,324 (90.6%) | 1,285 (9.4%) |
Health Insurance Coverage by Citizenship Status in Ketchikan Gateway Borough
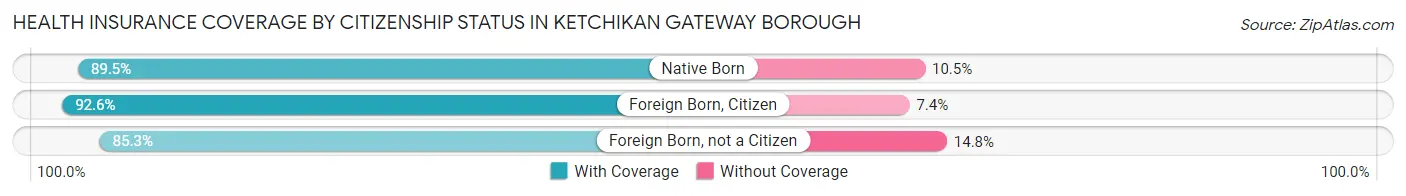
| Citizenship Status | With Coverage | Without Coverage |
| Native Born | 795 (89.5%) | 93 (10.5%) |
| Foreign Born, Citizen | 1,977 (92.6%) | 158 (7.4%) |
| Foreign Born, not a Citizen | 942 (85.3%) | 163 (14.7%) |
Health Insurance Coverage by Household Income in Ketchikan Gateway Borough
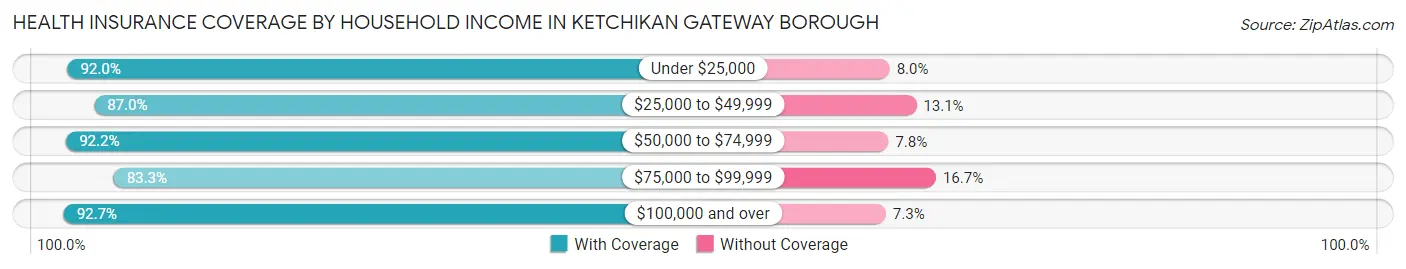
| Household Income | With Coverage | Without Coverage |
| Under $25,000 | 1,110 (92.0%) | 97 (8.0%) |
| $25,000 to $49,999 | 1,332 (87.0%) | 200 (13.1%) |
| $50,000 to $74,999 | 1,771 (92.2%) | 150 (7.8%) |
| $75,000 to $99,999 | 1,665 (83.3%) | 334 (16.7%) |
| $100,000 and over | 6,300 (92.7%) | 498 (7.3%) |
Public vs Private Health Insurance Coverage by Age in Ketchikan Gateway Borough
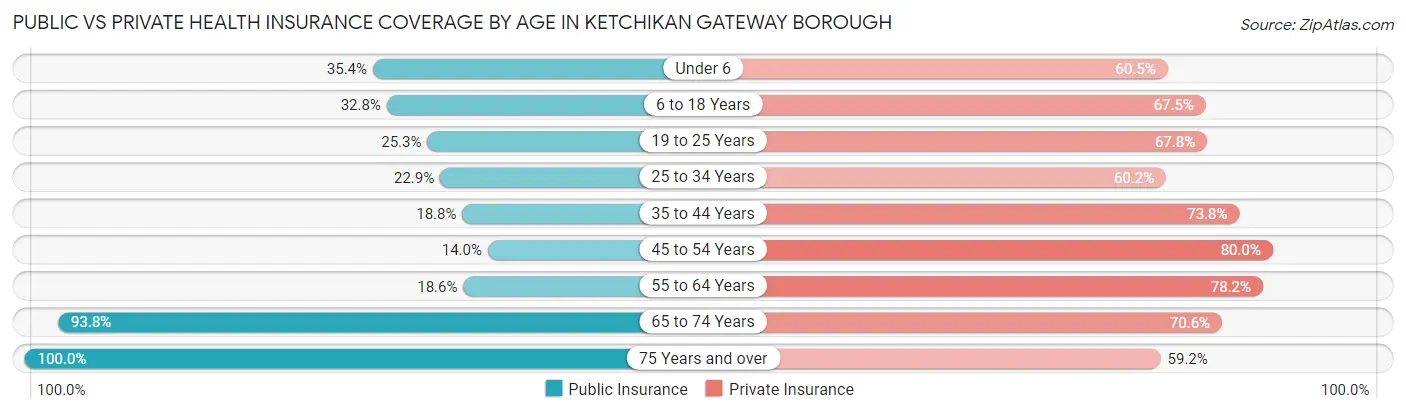
| Age Bracket | Public Insurance | Private Insurance |
| Under 6 | 314 (35.4%) | 537 (60.5%) |
| 6 to 18 Years | 700 (32.8%) | 1,442 (67.5%) |
| 19 to 25 Years | 279 (25.3%) | 749 (67.8%) |
| 25 to 34 Years | 384 (22.9%) | 1,010 (60.2%) |
| 35 to 44 Years | 332 (18.8%) | 1,306 (73.8%) |
| 45 to 54 Years | 236 (14.0%) | 1,346 (80.0%) |
| 55 to 64 Years | 380 (18.6%) | 1,599 (78.1%) |
| 65 to 74 Years | 1,456 (93.8%) | 1,095 (70.6%) |
| 75 Years and over | 752 (100.0%) | 445 (59.2%) |
| Total | 4,833 (35.5%) | 9,529 (70.0%) |
Disability Status by Sex by Age in Ketchikan Gateway Borough
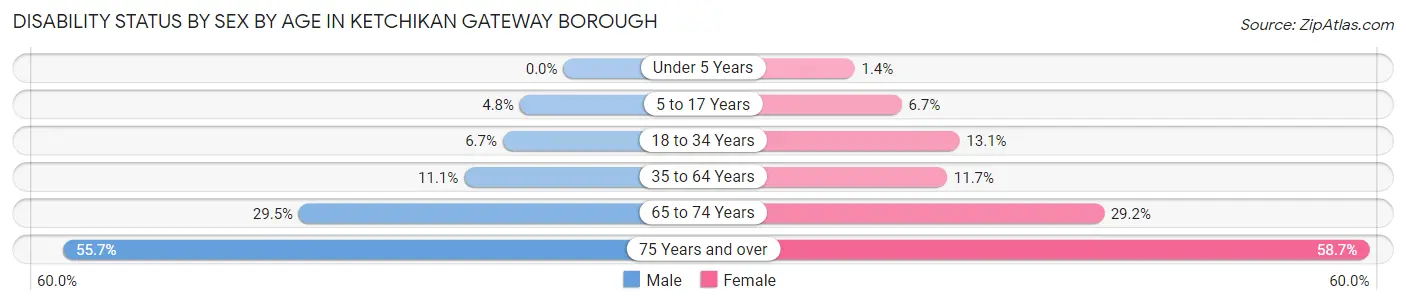
| Age Bracket | Male | Female |
| Under 5 Years | 0 (0.0%) | 5 (1.4%) |
| 5 to 17 Years | 53 (4.8%) | 71 (6.7%) |
| 18 to 34 Years | 102 (6.7%) | 180 (13.1%) |
| 35 to 64 Years | 313 (11.1%) | 312 (11.7%) |
| 65 to 74 Years | 240 (29.4%) | 215 (29.2%) |
| 75 Years and over | 176 (55.7%) | 256 (58.7%) |
Disability Class by Sex by Age in Ketchikan Gateway Borough
Disability Class: Hearing Difficulty
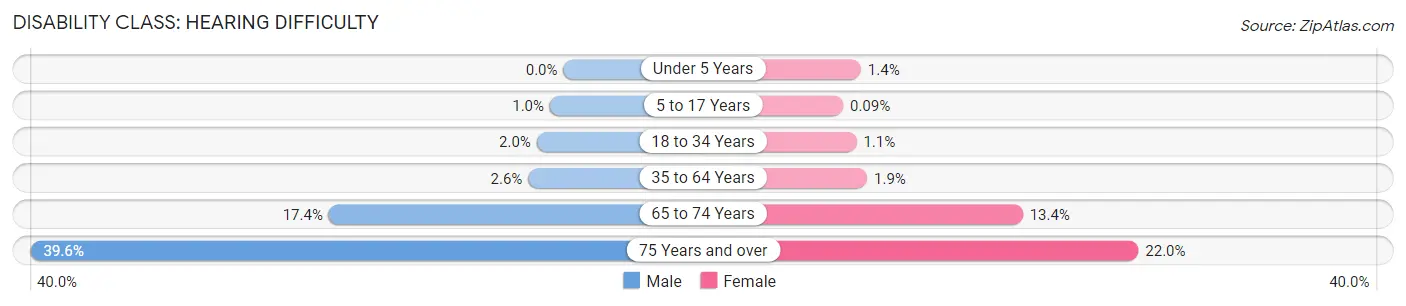
| Age Bracket | Male | Female |
| Under 5 Years | 0 (0.0%) | 5 (1.4%) |
| 5 to 17 Years | 11 (1.0%) | 1 (0.1%) |
| 18 to 34 Years | 30 (2.0%) | 15 (1.1%) |
| 35 to 64 Years | 74 (2.6%) | 50 (1.9%) |
| 65 to 74 Years | 142 (17.4%) | 99 (13.4%) |
| 75 Years and over | 125 (39.6%) | 96 (22.0%) |
Disability Class: Vision Difficulty
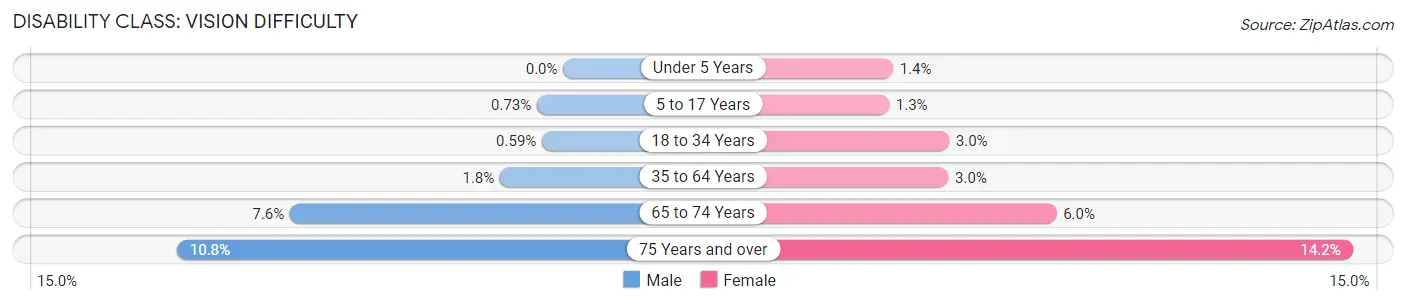
| Age Bracket | Male | Female |
| Under 5 Years | 0 (0.0%) | 5 (1.4%) |
| 5 to 17 Years | 8 (0.7%) | 14 (1.3%) |
| 18 to 34 Years | 9 (0.6%) | 41 (3.0%) |
| 35 to 64 Years | 50 (1.8%) | 79 (3.0%) |
| 65 to 74 Years | 62 (7.6%) | 44 (6.0%) |
| 75 Years and over | 34 (10.8%) | 62 (14.2%) |
Disability Class: Cognitive Difficulty
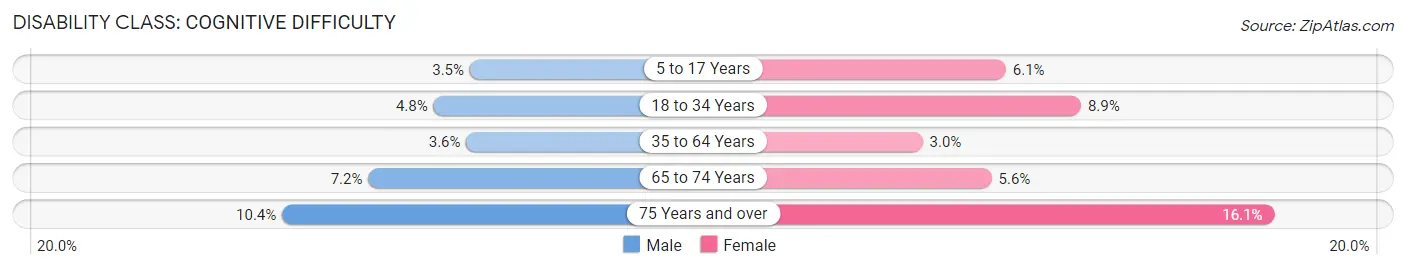
| Age Bracket | Male | Female |
| 5 to 17 Years | 38 (3.5%) | 65 (6.1%) |
| 18 to 34 Years | 73 (4.8%) | 122 (8.9%) |
| 35 to 64 Years | 102 (3.6%) | 80 (3.0%) |
| 65 to 74 Years | 59 (7.2%) | 41 (5.6%) |
| 75 Years and over | 33 (10.4%) | 70 (16.1%) |
Disability Class: Ambulatory Difficulty
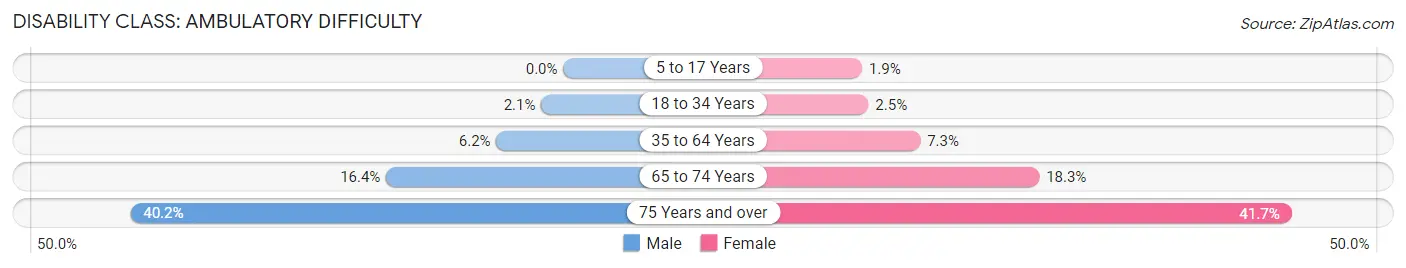
| Age Bracket | Male | Female |
| 5 to 17 Years | 0 (0.0%) | 20 (1.9%) |
| 18 to 34 Years | 31 (2.1%) | 34 (2.5%) |
| 35 to 64 Years | 176 (6.2%) | 194 (7.3%) |
| 65 to 74 Years | 134 (16.4%) | 135 (18.3%) |
| 75 Years and over | 127 (40.2%) | 182 (41.7%) |
Disability Class: Self-Care Difficulty
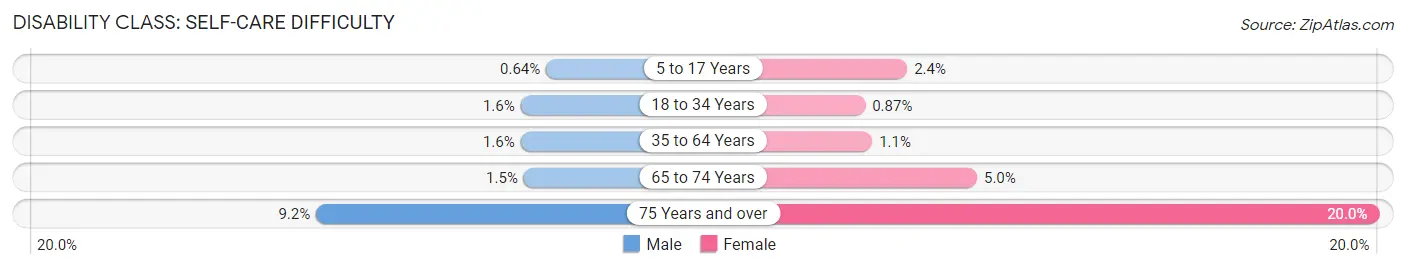
| Age Bracket | Male | Female |
| 5 to 17 Years | 7 (0.6%) | 26 (2.4%) |
| 18 to 34 Years | 24 (1.6%) | 12 (0.9%) |
| 35 to 64 Years | 45 (1.6%) | 30 (1.1%) |
| 65 to 74 Years | 12 (1.5%) | 37 (5.0%) |
| 75 Years and over | 29 (9.2%) | 87 (20.0%) |
Technology Access in Ketchikan Gateway Borough
Computing Device Access in Ketchikan Gateway Borough
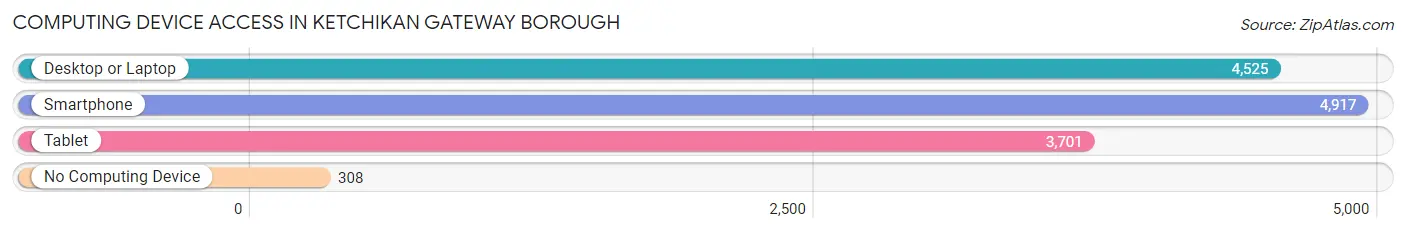
| Device Type | # Households | % Households |
| Desktop or Laptop | 4,525 | 81.3% |
| Smartphone | 4,917 | 88.3% |
| Tablet | 3,701 | 66.5% |
| No Computing Device | 308 | 5.5% |
| Total | 5,568 | 100.0% |
Internet Access in Ketchikan Gateway Borough
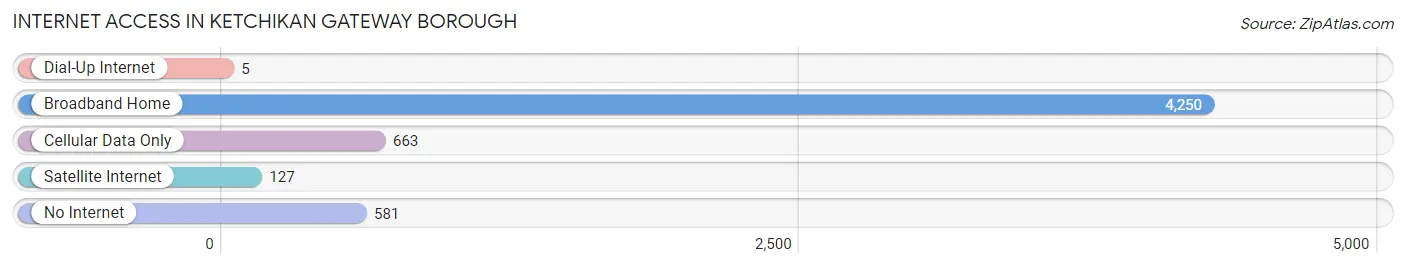
| Internet Type | # Households | % Households |
| Dial-Up Internet | 5 | 0.1% |
| Broadband Home | 4,250 | 76.3% |
| Cellular Data Only | 663 | 11.9% |
| Satellite Internet | 127 | 2.3% |
| No Internet | 581 | 10.4% |
| Total | 5,568 | 100.0% |
Ketchikan Gateway Borough Summary
Ketchikan Gateway Borough, Alaska is located in the southeastern corner of the state and is the southernmost borough in the state. It is bordered by the Pacific Ocean to the south, the Tongass National Forest to the east, and the Inside Passage to the north. The borough covers an area of 2,045 square miles and has a population of 13,477 as of the 2010 census.
Geography
Ketchikan Gateway Borough is located in the southeastern corner of Alaska, bordered by the Pacific Ocean to the south, the Tongass National Forest to the east, and the Inside Passage to the north. The borough covers an area of 2,045 square miles and is the southernmost borough in the state. The terrain is mostly mountainous, with the highest point being Mount Jumbo at 4,890 feet. The climate is mild and wet, with an average annual precipitation of over 100 inches.
The borough is home to numerous islands, including Gravina Island, Annette Island, and Prince of Wales Island. The largest island is Prince of Wales Island, which covers an area of 2,577 square miles and is the fourth largest island in the United States. The island is home to the Misty Fjords National Monument, a 2.3 million acre wilderness area.
Economy
Ketchikan Gateway Borough’s economy is largely based on fishing, logging, and tourism. The borough is home to the world’s largest salmon cannery, which processes over 200 million pounds of salmon each year. The logging industry is also important to the local economy, with the Tongass National Forest providing timber for the lumber industry. Tourism is also an important part of the local economy, with visitors coming to the area to take advantage of the fishing, hunting, and sightseeing opportunities.
Demographics
As of the 2010 census, the population of Ketchikan Gateway Borough was 13,477. The population is largely Native American, with the largest ethnic group being Tlingit and Haida Indians, who make up over 50% of the population. The median household income is $50,890, and the median age is 38.7 years.
The borough is home to numerous Native American tribes, including the Tlingit, Haida, Tsimshian, and Aleut. The borough is also home to a large number of immigrants, with the largest groups being Filipino, Chinese, and Korean.
Conclusion
Ketchikan Gateway Borough is located in the southeastern corner of Alaska and is the southernmost borough in the state. It covers an area of 2,045 square miles and has a population of 13,477 as of the 2010 census. The economy is largely based on fishing, logging, and tourism, and the population is largely Native American. The borough is home to numerous Native American tribes, as well as a large number of immigrants.
Common Questions
What is the Total Population of Ketchikan Gateway Borough?
Total Population of Ketchikan Gateway Borough is 13,910.
What is the Total Male Population of Ketchikan Gateway Borough?
Total Male Population of Ketchikan Gateway Borough is 7,232.
What is the Total Female Population of Ketchikan Gateway Borough?
Total Female Population of Ketchikan Gateway Borough is 6,678.
What is the Ratio of Males per 100 Females in Ketchikan Gateway Borough?
There are 108.30 Males per 100 Females in Ketchikan Gateway Borough.
What is the Ratio of Females per 100 Males in Ketchikan Gateway Borough?
There are 92.34 Females per 100 Males in Ketchikan Gateway Borough.
What is the Median Population Age in Ketchikan Gateway Borough?
Median Population Age in Ketchikan Gateway Borough is 40.6 Years.
What is the Average Family Size in Ketchikan Gateway Borough
Average Family Size in Ketchikan Gateway Borough is 3.0 People.
What is the Average Household Size in Ketchikan Gateway Borough
Average Household Size in Ketchikan Gateway Borough is 2.5 People.
What is Per Capita Income in Ketchikan Gateway Borough?
Per Capita income in Ketchikan Gateway Borough is $44,368.
What is the Median Family Income in Ketchikan Gateway Borough?
Median Family Income in Ketchikan Gateway Borough is $105,493.
What is the Median Household income in Ketchikan Gateway Borough?
Median Household Income in Ketchikan Gateway Borough is $82,763.
What is Income or Wage Gap in Ketchikan Gateway Borough?
Income or Wage Gap in Ketchikan Gateway Borough is 31.7%.
Women in Ketchikan Gateway Borough earn 68.3 cents for every dollar earned by a man.
What is Inequality or Gini Index in Ketchikan Gateway Borough?
Inequality or Gini Index in Ketchikan Gateway Borough is 0.44.
How Large is the Labor Force in Ketchikan Gateway Borough?
There are 7,480 People in the Labor Forcein in Ketchikan Gateway Borough.
What is the Percentage of People in the Labor Force in Ketchikan Gateway Borough?
66.0% of People are in the Labor Force in Ketchikan Gateway Borough.
What is the Unemployment Rate in Ketchikan Gateway Borough?
Unemployment Rate in Ketchikan Gateway Borough is 4.1%.