Kenai Peninsula Borough, AK
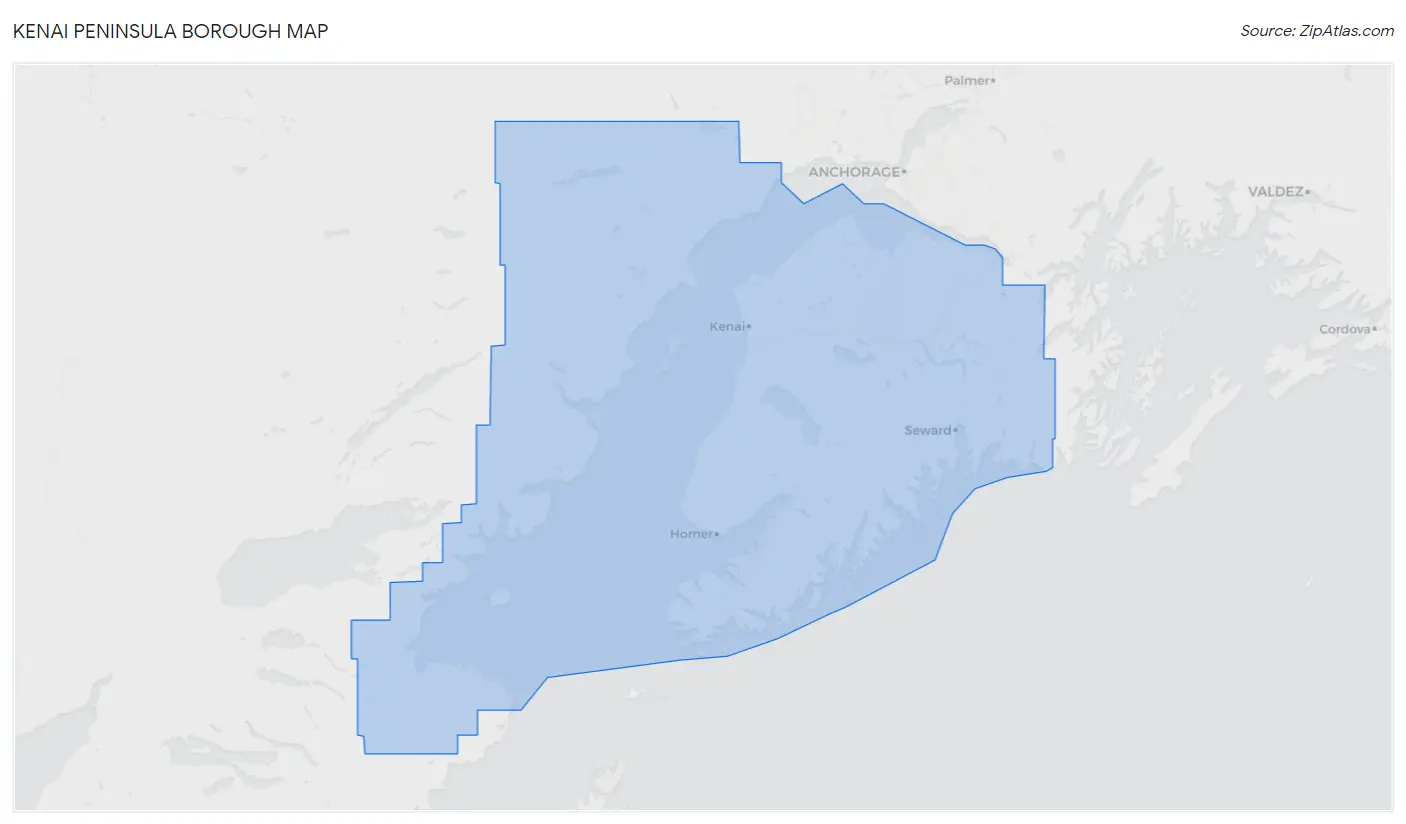
Kenai Peninsula Borough Map
Kenai Peninsula Borough Overview
59,235
TOTAL POPULATION
31,086
MALE POPULATION
28,149
FEMALE POPULATION
110.43
MALES / 100 FEMALES
90.55
FEMALES / 100 MALES
41.2
MEDIAN AGE
3.2
AVG FAMILY SIZE
2.5
AVG HOUSEHOLD SIZE
$40,720
PER CAPITA INCOME
$101,126
AVG FAMILY INCOME
$76,272
AVG HOUSEHOLD INCOME
34.7%
WAGE / INCOME GAP [ % ]
65.3¢/ $1
WAGE / INCOME GAP [ $ ]
$9,653
FAMILY INCOME DEFICIT
0.45
INEQUALITY / GINI INDEX
27,386
LABOR FORCE [ PEOPLE ]
57.5%
PERCENT IN LABOR FORCE
7.2%
UNEMPLOYMENT RATE
Kenai Peninsula Borough Area Codes
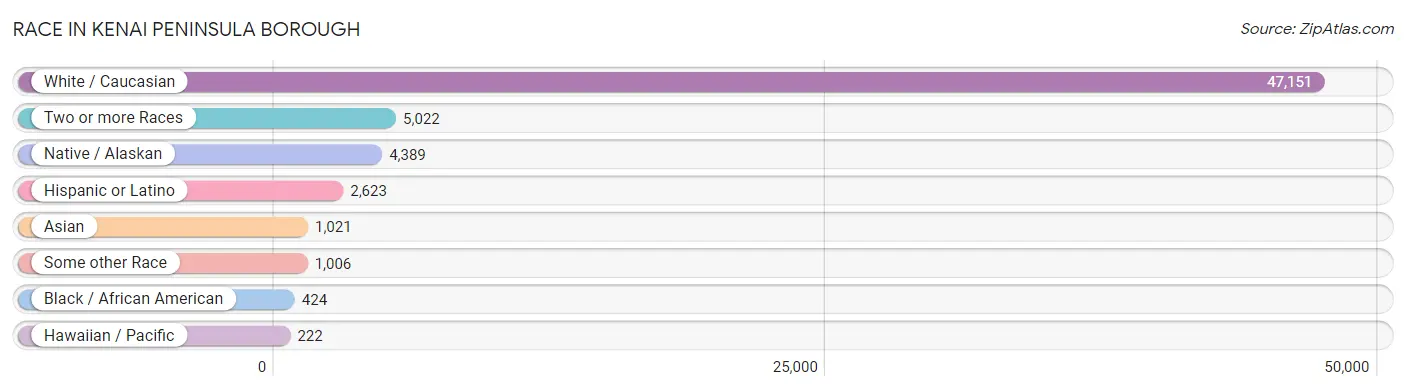
Race in Kenai Peninsula Borough
The most populous races in Kenai Peninsula Borough are White / Caucasian (47,151 | 79.6%), Two or more Races (5,022 | 8.5%), and Native / Alaskan (4,389 | 7.4%).
| Race | # Population | % Population |
| Asian | 1,021 | 1.7% |
| Black / African American | 424 | 0.7% |
| Hawaiian / Pacific | 222 | 0.4% |
| Hispanic or Latino | 2,623 | 4.4% |
| Native / Alaskan | 4,389 | 7.4% |
| White / Caucasian | 47,151 | 79.6% |
| Two or more Races | 5,022 | 8.5% |
| Some other Race | 1,006 | 1.7% |
| Total | 59,235 | 100.0% |
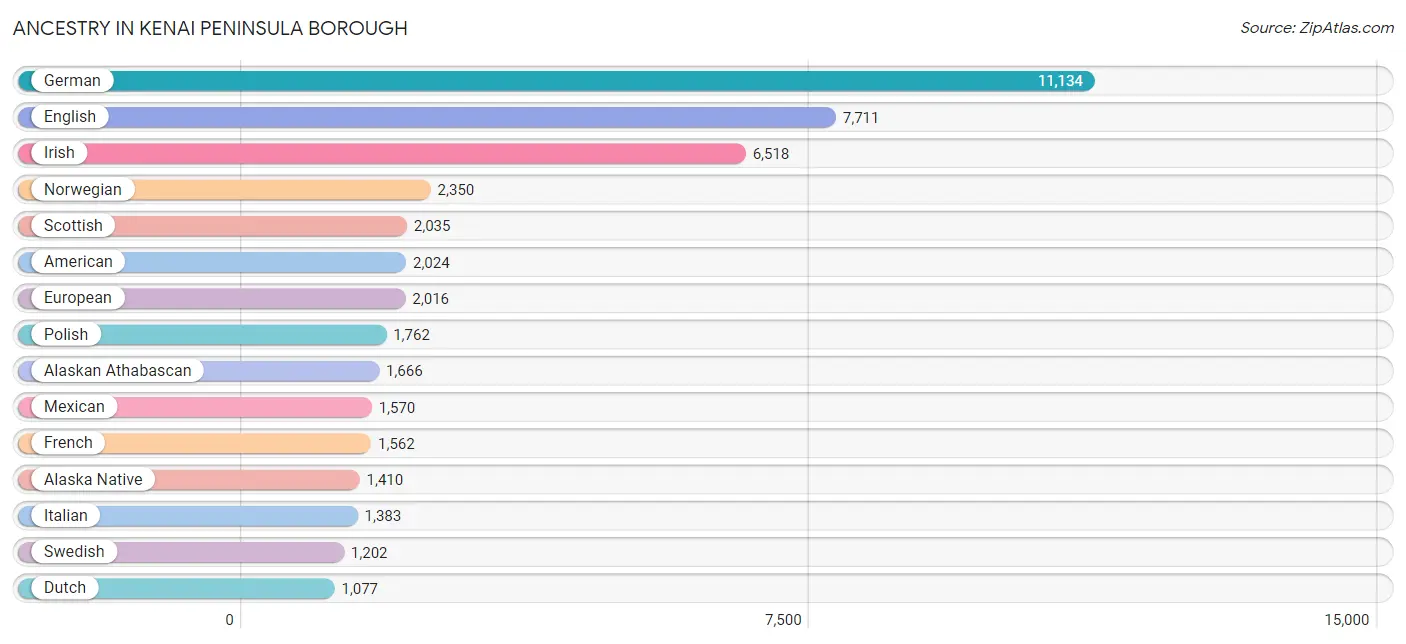
Ancestry in Kenai Peninsula Borough
The most populous ancestries reported in Kenai Peninsula Borough are German (11,134 | 18.8%), English (7,711 | 13.0%), Irish (6,518 | 11.0%), Norwegian (2,350 | 4.0%), and Scottish (2,035 | 3.4%), together accounting for 50.2% of all Kenai Peninsula Borough residents.
| Ancestry | # Population | % Population |
| Afghan | 3 | 0.0% |
| African | 14 | 0.0% |
| Alaska Native | 1,410 | 2.4% |
| Alaskan Athabascan | 1,666 | 2.8% |
| Aleut | 962 | 1.6% |
| American | 2,024 | 3.4% |
| Apache | 57 | 0.1% |
| Arab | 103 | 0.2% |
| Armenian | 5 | 0.0% |
| Australian | 17 | 0.0% |
| Austrian | 176 | 0.3% |
| Belgian | 54 | 0.1% |
| Bhutanese | 328 | 0.5% |
| Blackfeet | 92 | 0.2% |
| Bolivian | 3 | 0.0% |
| Brazilian | 3 | 0.0% |
| British | 362 | 0.6% |
| Burmese | 187 | 0.3% |
| Canadian | 127 | 0.2% |
| Celtic | 22 | 0.0% |
| Central American | 134 | 0.2% |
| Cherokee | 591 | 1.0% |
| Chinese | 11 | 0.0% |
| Chippewa | 42 | 0.1% |
| Choctaw | 214 | 0.4% |
| Colombian | 73 | 0.1% |
| Comanche | 5 | 0.0% |
| Cree | 32 | 0.1% |
| Creek | 3 | 0.0% |
| Croatian | 52 | 0.1% |
| Crow | 17 | 0.0% |
| Cuban | 103 | 0.2% |
| Czech | 317 | 0.5% |
| Czechoslovakian | 28 | 0.1% |
| Danish | 637 | 1.1% |
| Dominican | 62 | 0.1% |
| Dutch | 1,077 | 1.8% |
| Dutch West Indian | 53 | 0.1% |
| Eastern European | 58 | 0.1% |
| Ecuadorian | 22 | 0.0% |
| English | 7,711 | 13.0% |
| Estonian | 7 | 0.0% |
| European | 2,016 | 3.4% |
| Finnish | 376 | 0.6% |
| French | 1,562 | 2.6% |
| French American Indian | 1 | 0.0% |
| French Canadian | 534 | 0.9% |
| German | 11,134 | 18.8% |
| Ghanaian | 6 | 0.0% |
| Greek | 84 | 0.1% |
| Guamanian / Chamorro | 164 | 0.3% |
| Honduran | 33 | 0.1% |
| Hungarian | 33 | 0.1% |
| Icelander | 37 | 0.1% |
| Indian (Asian) | 208 | 0.4% |
| Inupiat | 851 | 1.4% |
| Iranian | 17 | 0.0% |
| Irish | 6,518 | 11.0% |
| Iroquois | 67 | 0.1% |
| Italian | 1,383 | 2.3% |
| Jamaican | 8 | 0.0% |
| Korean | 801 | 1.3% |
| Latvian | 7 | 0.0% |
| Lebanese | 9 | 0.0% |
| Lithuanian | 75 | 0.1% |
| Lumbee | 68 | 0.1% |
| Luxembourger | 2 | 0.0% |
| Mexican | 1,570 | 2.6% |
| Moroccan | 41 | 0.1% |
| Native Hawaiian | 158 | 0.3% |
| Navajo | 2 | 0.0% |
| New Zealander | 50 | 0.1% |
| Nicaraguan | 66 | 0.1% |
| Northern European | 273 | 0.5% |
| Norwegian | 2,350 | 4.0% |
| Pakistani | 16 | 0.0% |
| Panamanian | 29 | 0.1% |
| Peruvian | 4 | 0.0% |
| Polish | 1,762 | 3.0% |
| Portuguese | 138 | 0.2% |
| Pueblo | 3 | 0.0% |
| Puerto Rican | 142 | 0.2% |
| Puget Sound Salish | 10 | 0.0% |
| Romanian | 33 | 0.1% |
| Russian | 990 | 1.7% |
| Salvadoran | 6 | 0.0% |
| Samoan | 54 | 0.1% |
| Scandinavian | 609 | 1.0% |
| Scotch-Irish | 636 | 1.1% |
| Scottish | 2,035 | 3.4% |
| Seminole | 4 | 0.0% |
| Serbian | 4 | 0.0% |
| Shoshone | 5 | 0.0% |
| Sioux | 58 | 0.1% |
| Slavic | 28 | 0.1% |
| Slovak | 50 | 0.1% |
| Slovene | 4 | 0.0% |
| South American | 122 | 0.2% |
| South American Indian | 56 | 0.1% |
| Spaniard | 89 | 0.2% |
| Spanish | 160 | 0.3% |
| Sri Lankan | 52 | 0.1% |
| Subsaharan African | 48 | 0.1% |
| Sudanese | 2 | 0.0% |
| Swedish | 1,202 | 2.0% |
| Swiss | 259 | 0.4% |
| Syrian | 30 | 0.1% |
| Thai | 21 | 0.0% |
| Tlingit-Haida | 357 | 0.6% |
| Tongan | 13 | 0.0% |
| Tsimshian | 55 | 0.1% |
| Turkish | 7 | 0.0% |
| Ukrainian | 120 | 0.2% |
| Ute | 93 | 0.2% |
| Venezuelan | 20 | 0.0% |
| Vietnamese | 33 | 0.1% |
| Welsh | 457 | 0.8% |
| Yaqui | 4 | 0.0% |
| Yugoslavian | 20 | 0.0% |
| Yup'ik | 832 | 1.4% |
| Zimbabwean | 19 | 0.0% | View All 121 Rows |
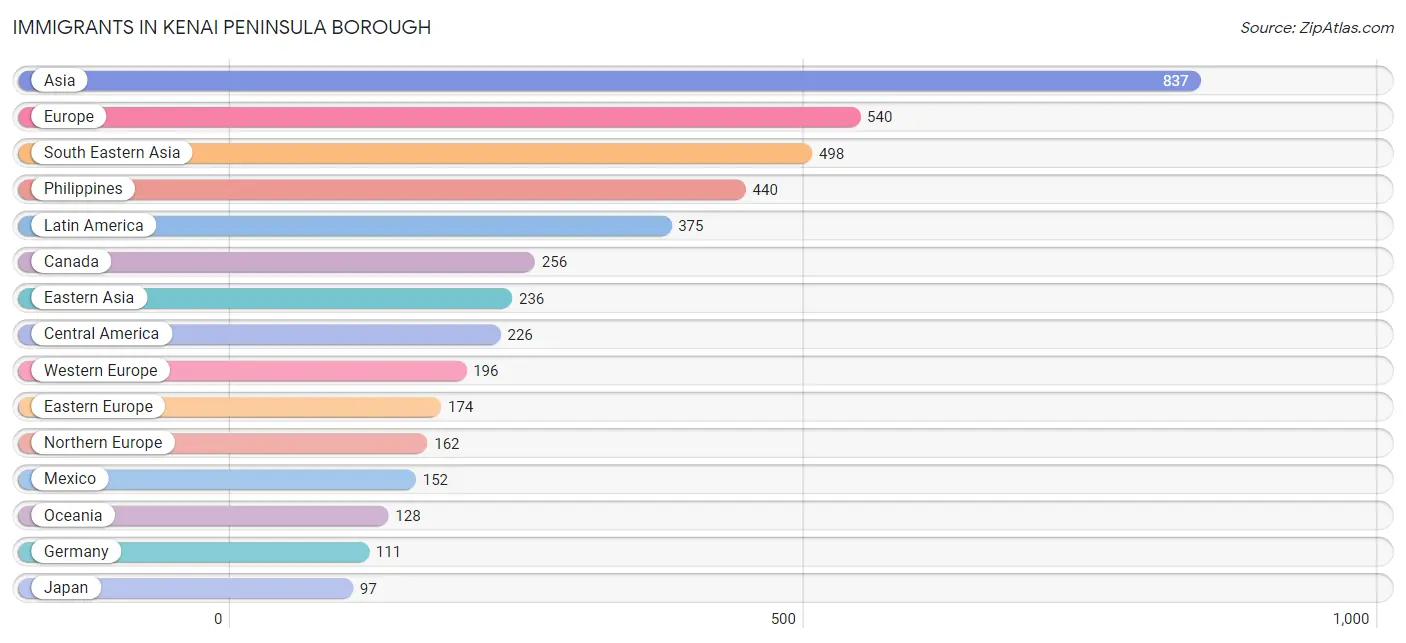
Immigrants in Kenai Peninsula Borough
The most numerous immigrant groups reported in Kenai Peninsula Borough came from Asia (837 | 1.4%), Europe (540 | 0.9%), South Eastern Asia (498 | 0.8%), Philippines (440 | 0.7%), and Latin America (375 | 0.6%), together accounting for 4.5% of all Kenai Peninsula Borough residents.
| Immigration Origin | # Population | % Population |
| Afghanistan | 7 | 0.0% |
| Africa | 27 | 0.1% |
| Asia | 837 | 1.4% |
| Australia | 68 | 0.1% |
| Bangladesh | 33 | 0.1% |
| Bolivia | 3 | 0.0% |
| Brazil | 26 | 0.0% |
| Canada | 256 | 0.4% |
| Caribbean | 92 | 0.2% |
| Central America | 226 | 0.4% |
| China | 77 | 0.1% |
| Colombia | 5 | 0.0% |
| Cuba | 41 | 0.1% |
| Czechoslovakia | 5 | 0.0% |
| Dominican Republic | 2 | 0.0% |
| Eastern Africa | 5 | 0.0% |
| Eastern Asia | 236 | 0.4% |
| Eastern Europe | 174 | 0.3% |
| England | 30 | 0.1% |
| Ethiopia | 4 | 0.0% |
| Europe | 540 | 0.9% |
| France | 49 | 0.1% |
| Germany | 111 | 0.2% |
| Ghana | 17 | 0.0% |
| Honduras | 45 | 0.1% |
| India | 12 | 0.0% |
| Iran | 27 | 0.1% |
| Ireland | 13 | 0.0% |
| Jamaica | 1 | 0.0% |
| Japan | 97 | 0.2% |
| Kenya | 1 | 0.0% |
| Korea | 62 | 0.1% |
| Kuwait | 21 | 0.0% |
| Latin America | 375 | 0.6% |
| Latvia | 4 | 0.0% |
| Mexico | 152 | 0.3% |
| Netherlands | 19 | 0.0% |
| Northern Europe | 162 | 0.3% |
| Norway | 38 | 0.1% |
| Oceania | 128 | 0.2% |
| Panama | 29 | 0.1% |
| Peru | 3 | 0.0% |
| Philippines | 440 | 0.7% |
| Poland | 23 | 0.0% |
| Portugal | 8 | 0.0% |
| Romania | 23 | 0.0% |
| Russia | 81 | 0.1% |
| Scotland | 19 | 0.0% |
| South America | 57 | 0.1% |
| South Central Asia | 79 | 0.1% |
| South Eastern Asia | 498 | 0.8% |
| Southern Europe | 8 | 0.0% |
| Sweden | 38 | 0.1% |
| Switzerland | 17 | 0.0% |
| Thailand | 16 | 0.0% |
| Turkey | 3 | 0.0% |
| Ukraine | 36 | 0.1% |
| Venezuela | 20 | 0.0% |
| Vietnam | 42 | 0.1% |
| Western Africa | 22 | 0.0% |
| Western Asia | 24 | 0.0% |
| Western Europe | 196 | 0.3% | View All 62 Rows |
Sex and Age in Kenai Peninsula Borough
Sex and Age in Kenai Peninsula Borough
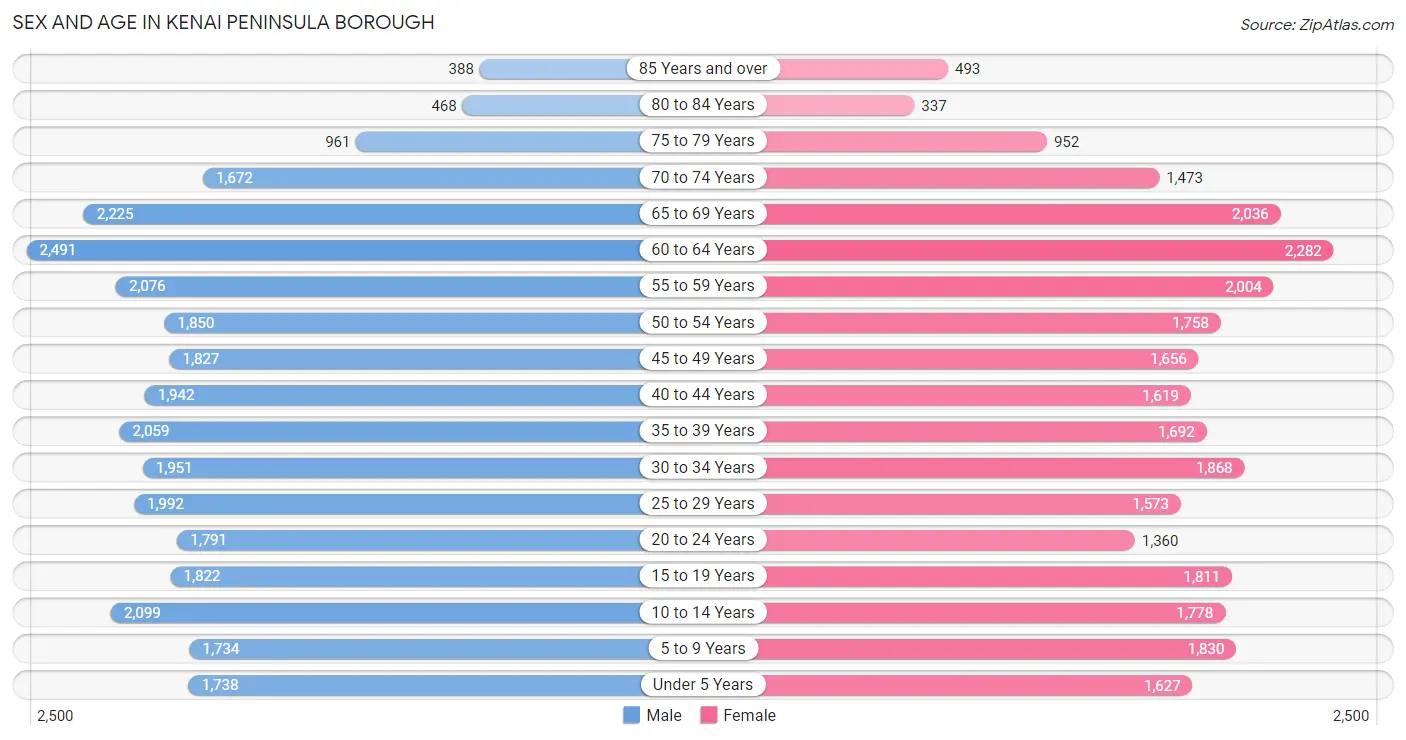
The most populous age groups in Kenai Peninsula Borough are 60 to 64 Years (2,491 | 8.0%) for men and 60 to 64 Years (2,282 | 8.1%) for women.
| Age Bracket | Male | Female |
| Under 5 Years | 1,738 (5.6%) | 1,627 (5.8%) |
| 5 to 9 Years | 1,734 (5.6%) | 1,830 (6.5%) |
| 10 to 14 Years | 2,099 (6.8%) | 1,778 (6.3%) |
| 15 to 19 Years | 1,822 (5.9%) | 1,811 (6.4%) |
| 20 to 24 Years | 1,791 (5.8%) | 1,360 (4.8%) |
| 25 to 29 Years | 1,992 (6.4%) | 1,573 (5.6%) |
| 30 to 34 Years | 1,951 (6.3%) | 1,868 (6.6%) |
| 35 to 39 Years | 2,059 (6.6%) | 1,692 (6.0%) |
| 40 to 44 Years | 1,942 (6.2%) | 1,619 (5.8%) |
| 45 to 49 Years | 1,827 (5.9%) | 1,656 (5.9%) |
| 50 to 54 Years | 1,850 (5.9%) | 1,758 (6.2%) |
| 55 to 59 Years | 2,076 (6.7%) | 2,004 (7.1%) |
| 60 to 64 Years | 2,491 (8.0%) | 2,282 (8.1%) |
| 65 to 69 Years | 2,225 (7.2%) | 2,036 (7.2%) |
| 70 to 74 Years | 1,672 (5.4%) | 1,473 (5.2%) |
| 75 to 79 Years | 961 (3.1%) | 952 (3.4%) |
| 80 to 84 Years | 468 (1.5%) | 337 (1.2%) |
| 85 Years and over | 388 (1.3%) | 493 (1.8%) |
| Total | 31,086 (100.0%) | 28,149 (100.0%) |
Families and Households in Kenai Peninsula Borough
Median Family Size in Kenai Peninsula Borough
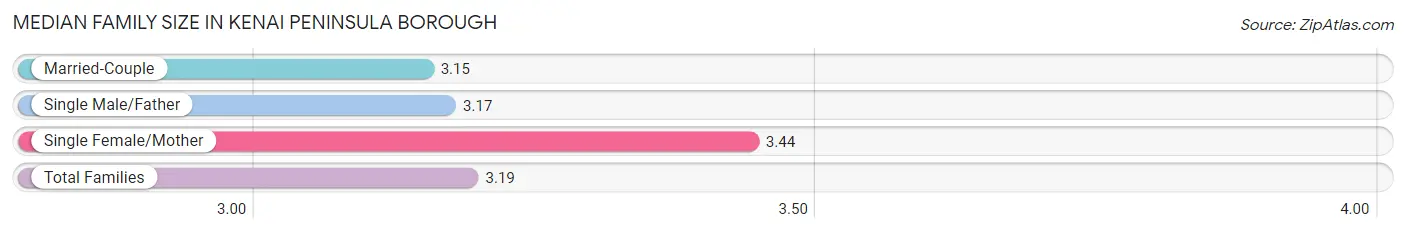
The median family size in Kenai Peninsula Borough is 3.19 persons per family, with single female/mother families (1,815 | 13.2%) accounting for the largest median family size of 3.44 persons per family. On the other hand, married-couple families (11,143 | 81.1%) represent the smallest median family size with 3.15 persons per family.
| Family Type | # Families | Family Size |
| Married-Couple | 11,143 (81.1%) | 3.15 |
| Single Male/Father | 783 (5.7%) | 3.17 |
| Single Female/Mother | 1,815 (13.2%) | 3.44 |
| Total Families | 13,741 (100.0%) | 3.19 |
Median Household Size in Kenai Peninsula Borough
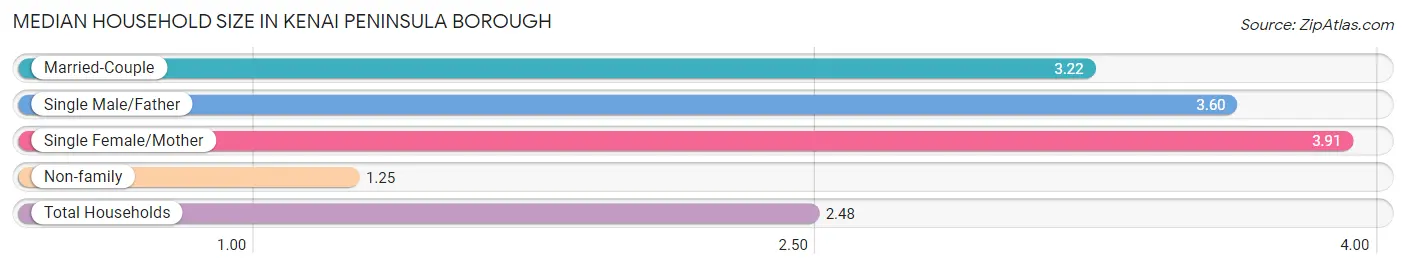
The median household size in Kenai Peninsula Borough is 2.48 persons per household, with single female/mother households (1,815 | 7.8%) accounting for the largest median household size of 3.91 persons per household. non-family households (9,460 | 40.8%) represent the smallest median household size with 1.25 persons per household.
| Household Type | # Households | Household Size |
| Married-Couple | 11,143 (48.0%) | 3.22 |
| Single Male/Father | 783 (3.4%) | 3.60 |
| Single Female/Mother | 1,815 (7.8%) | 3.91 |
| Non-family | 9,460 (40.8%) | 1.25 |
| Total Households | 23,201 (100.0%) | 2.48 |
Household Size by Marriage Status in Kenai Peninsula Borough
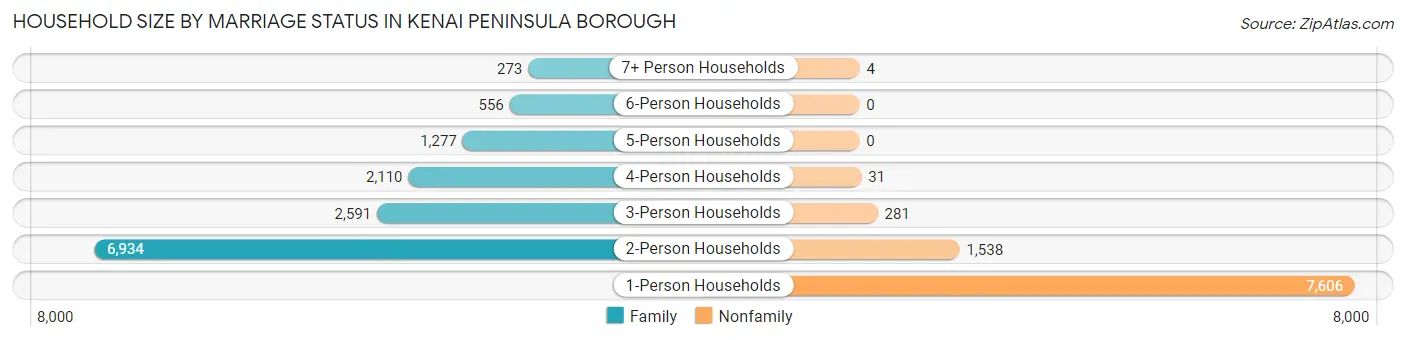
Out of a total of 23,201 households in Kenai Peninsula Borough, 13,741 (59.2%) are family households, while 9,460 (40.8%) are nonfamily households. The most numerous type of family households are 2-person households, comprising 6,934, and the most common type of nonfamily households are 1-person households, comprising 7,606.
| Household Size | Family Households | Nonfamily Households |
| 1-Person Households | - | 7,606 (32.8%) |
| 2-Person Households | 6,934 (29.9%) | 1,538 (6.6%) |
| 3-Person Households | 2,591 (11.2%) | 281 (1.2%) |
| 4-Person Households | 2,110 (9.1%) | 31 (0.1%) |
| 5-Person Households | 1,277 (5.5%) | 0 (0.0%) |
| 6-Person Households | 556 (2.4%) | 0 (0.0%) |
| 7+ Person Households | 273 (1.2%) | 4 (0.0%) |
| Total | 13,741 (59.2%) | 9,460 (40.8%) |
Female Fertility in Kenai Peninsula Borough
Fertility by Age in Kenai Peninsula Borough
Average fertility rate in Kenai Peninsula Borough is 45.0 births per 1,000 women. Women in the age bracket of 20 to 34 years have the highest fertility rate with 93.0 births per 1,000 women. Women in the age bracket of 20 to 34 years acount for 82.0% of all women with births.
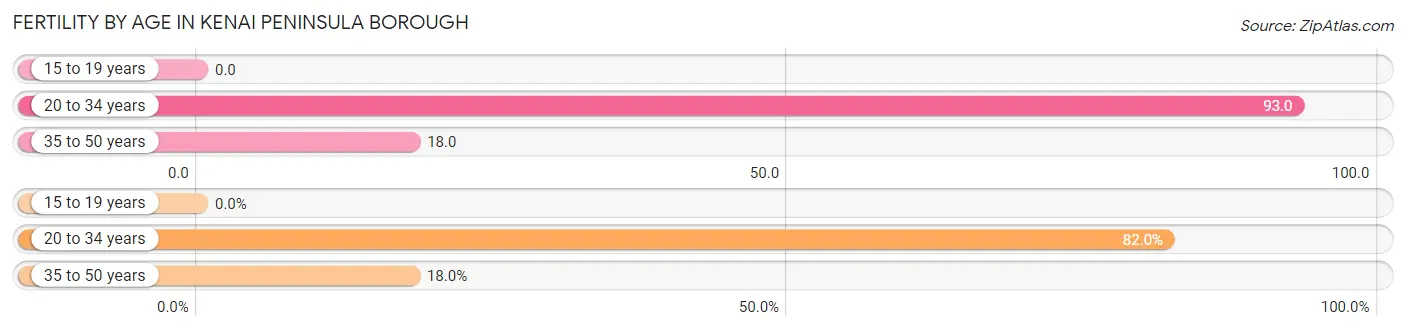
| Age Bracket | Women with Births | Births / 1,000 Women |
| 15 to 19 years | 0 (0.0%) | 0.0 |
| 20 to 34 years | 447 (82.0%) | 93.0 |
| 35 to 50 years | 98 (18.0%) | 18.0 |
| Total | 545 (100.0%) | 45.0 |
Fertility by Age by Marriage Status in Kenai Peninsula Borough
78.2% of women with births (545) in Kenai Peninsula Borough are married. The highest percentage of unmarried women with births falls into 35 to 50 years age bracket with 35.7% of them unmarried at the time of birth, while the lowest percentage of unmarried women with births belong to 20 to 34 years age bracket with 18.8% of them unmarried.
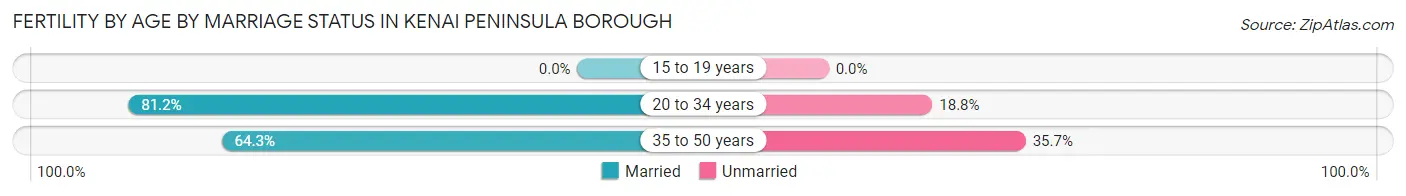
| Age Bracket | Married | Unmarried |
| 15 to 19 years | 0 (0.0%) | 0 (0.0%) |
| 20 to 34 years | 363 (81.2%) | 84 (18.8%) |
| 35 to 50 years | 63 (64.3%) | 35 (35.7%) |
| Total | 426 (78.2%) | 119 (21.8%) |
Fertility by Education in Kenai Peninsula Borough
Average fertility rate in Kenai Peninsula Borough is 45.0 births per 1,000 women. Women with the education attainment of graduate degree have the highest fertility rate of 99.0 births per 1,000 women, while women with the education attainment of less than high school have the lowest fertility at 21.0 births per 1,000 women. Women with the education attainment of high school diploma represent 34.5% of all women with births.
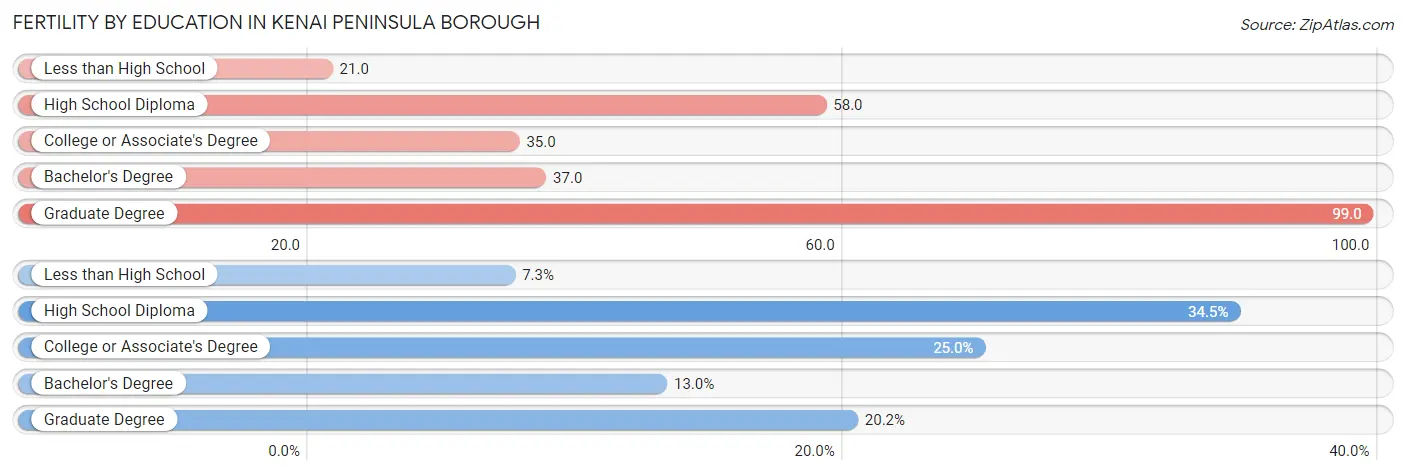
| Educational Attainment | Women with Births | Births / 1,000 Women |
| Less than High School | 40 (7.3%) | 21.0 |
| High School Diploma | 188 (34.5%) | 58.0 |
| College or Associate's Degree | 136 (24.9%) | 35.0 |
| Bachelor's Degree | 71 (13.0%) | 37.0 |
| Graduate Degree | 110 (20.2%) | 99.0 |
| Total | 545 (100.0%) | 45.0 |
Fertility by Education by Marriage Status in Kenai Peninsula Borough
21.8% of women with births in Kenai Peninsula Borough are unmarried. Women with the educational attainment of graduate degree are most likely to be married with 94.6% of them married at childbirth, while women with the educational attainment of less than high school are least likely to be married with 82.5% of them unmarried at childbirth.
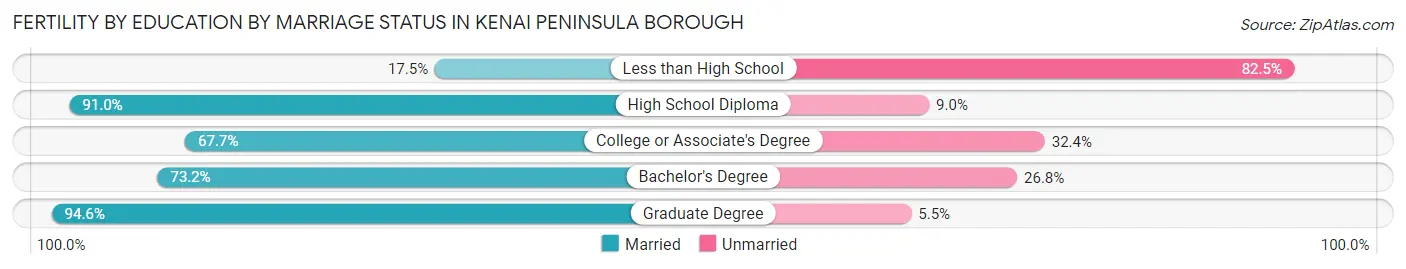
| Educational Attainment | Married | Unmarried |
| Less than High School | 7 (17.5%) | 33 (82.5%) |
| High School Diploma | 171 (91.0%) | 17 (9.0%) |
| College or Associate's Degree | 92 (67.6%) | 44 (32.4%) |
| Bachelor's Degree | 52 (73.2%) | 19 (26.8%) |
| Graduate Degree | 104 (94.6%) | 6 (5.4%) |
| Total | 426 (78.2%) | 119 (21.8%) |
Income in Kenai Peninsula Borough
Income Overview in Kenai Peninsula Borough
Per Capita Income in Kenai Peninsula Borough is $40,720, while median incomes of families and households are $101,126 and $76,272 respectively.
| Characteristic | Number | Measure |
| Per Capita Income | 59,235 | $40,720 |
| Median Family Income | 13,741 | $101,126 |
| Mean Family Income | 13,741 | $123,731 |
| Median Household Income | 23,201 | $76,272 |
| Mean Household Income | 23,201 | $99,127 |
| Income Deficit | 13,741 | $9,653 |
| Wage / Income Gap (%) | 59,235 | 34.67% |
| Wage / Income Gap ($) | 59,235 | 65.33¢ per $1 |
| Gini / Inequality Index | 59,235 | 0.45 |
Earnings by Sex in Kenai Peninsula Borough
Average Earnings in Kenai Peninsula Borough are $43,860, $54,115 for men and $35,351 for women, a difference of 34.7%.
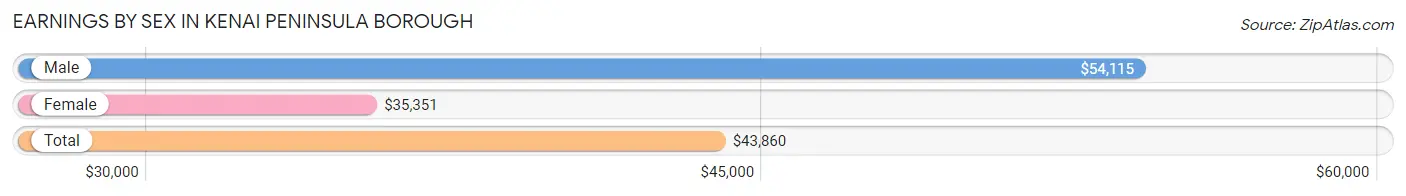
| Sex | Number | Average Earnings |
| Male | 16,452 (55.1%) | $54,115 |
| Female | 13,418 (44.9%) | $35,351 |
| Total | 29,870 (100.0%) | $43,860 |
Earnings by Sex by Income Bracket in Kenai Peninsula Borough
The most common earnings brackets in Kenai Peninsula Borough are $100,000+ for men (3,527 | 21.4%) and $75,000 to $99,999 for women (1,549 | 11.5%).
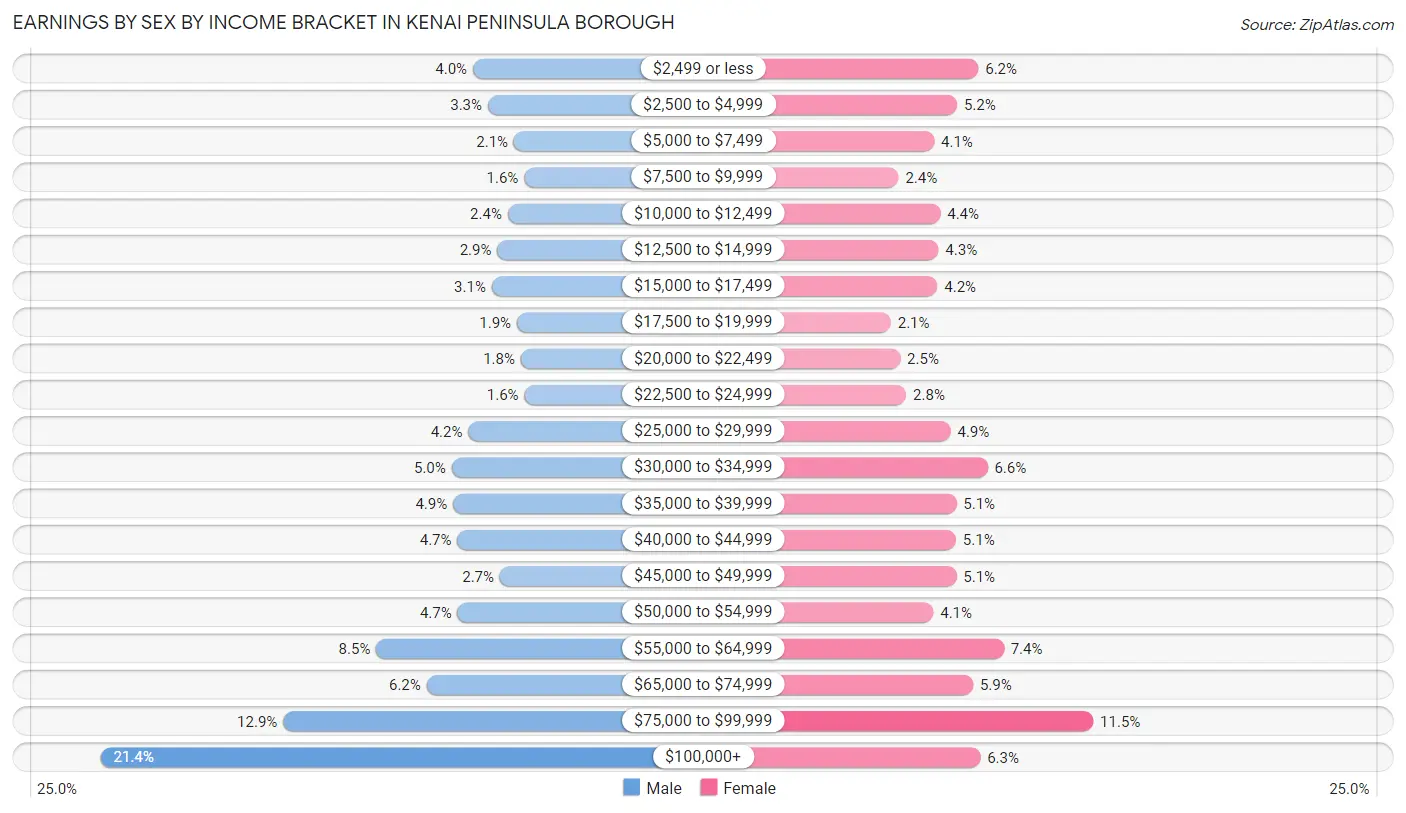
| Income | Male | Female |
| $2,499 or less | 658 (4.0%) | 827 (6.2%) |
| $2,500 to $4,999 | 543 (3.3%) | 693 (5.2%) |
| $5,000 to $7,499 | 343 (2.1%) | 549 (4.1%) |
| $7,500 to $9,999 | 263 (1.6%) | 325 (2.4%) |
| $10,000 to $12,499 | 390 (2.4%) | 588 (4.4%) |
| $12,500 to $14,999 | 471 (2.9%) | 576 (4.3%) |
| $15,000 to $17,499 | 514 (3.1%) | 569 (4.2%) |
| $17,500 to $19,999 | 319 (1.9%) | 276 (2.1%) |
| $20,000 to $22,499 | 289 (1.8%) | 336 (2.5%) |
| $22,500 to $24,999 | 262 (1.6%) | 373 (2.8%) |
| $25,000 to $29,999 | 694 (4.2%) | 652 (4.9%) |
| $30,000 to $34,999 | 822 (5.0%) | 884 (6.6%) |
| $35,000 to $39,999 | 811 (4.9%) | 688 (5.1%) |
| $40,000 to $44,999 | 779 (4.7%) | 685 (5.1%) |
| $45,000 to $49,999 | 450 (2.7%) | 688 (5.1%) |
| $50,000 to $54,999 | 777 (4.7%) | 543 (4.1%) |
| $55,000 to $64,999 | 1,404 (8.5%) | 986 (7.3%) |
| $65,000 to $74,999 | 1,015 (6.2%) | 793 (5.9%) |
| $75,000 to $99,999 | 2,121 (12.9%) | 1,549 (11.5%) |
| $100,000+ | 3,527 (21.4%) | 838 (6.2%) |
| Total | 16,452 (100.0%) | 13,418 (100.0%) |
Earnings by Sex by Educational Attainment in Kenai Peninsula Borough
Average earnings in Kenai Peninsula Borough are $59,215 for men and $39,673 for women, a difference of 33.0%. Men with an educational attainment of graduate degree enjoy the highest average annual earnings of $86,364, while those with less than high school education earn the least with $39,500. Women with an educational attainment of graduate degree earn the most with the average annual earnings of $72,250, while those with less than high school education have the smallest earnings of $30,882.
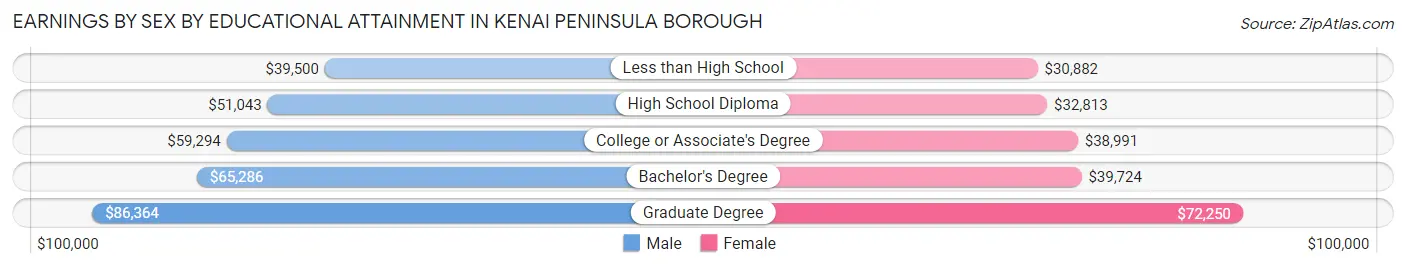
| Educational Attainment | Male Income | Female Income |
| Less than High School | $39,500 | $30,882 |
| High School Diploma | $51,043 | $32,813 |
| College or Associate's Degree | $59,294 | $38,991 |
| Bachelor's Degree | $65,286 | $39,724 |
| Graduate Degree | $86,364 | $72,250 |
| Total | $59,215 | $39,673 |
Family Income in Kenai Peninsula Borough
Family Income Brackets in Kenai Peninsula Borough
According to the Kenai Peninsula Borough family income data, there are 3,573 families falling into the $100,000 to $149,999 income range, which is the most common income bracket and makes up 26.0% of all families. Conversely, the $10,000 to $14,999 income bracket is the least frequent group with only 137 families (1.0%) belonging to this category.
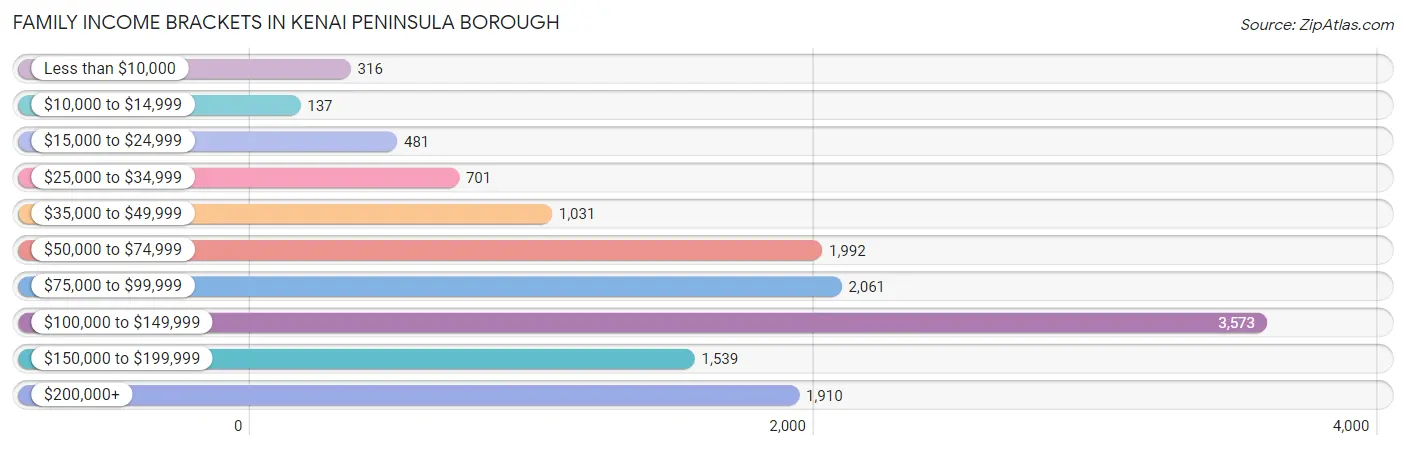
| Income Bracket | # Families | % Families |
| Less than $10,000 | 316 | 2.3% |
| $10,000 to $14,999 | 137 | 1.0% |
| $15,000 to $24,999 | 481 | 3.5% |
| $25,000 to $34,999 | 701 | 5.1% |
| $35,000 to $49,999 | 1,031 | 7.5% |
| $50,000 to $74,999 | 1,992 | 14.5% |
| $75,000 to $99,999 | 2,061 | 15.0% |
| $100,000 to $149,999 | 3,573 | 26.0% |
| $150,000 to $199,999 | 1,539 | 11.2% |
| $200,000+ | 1,910 | 13.9% |
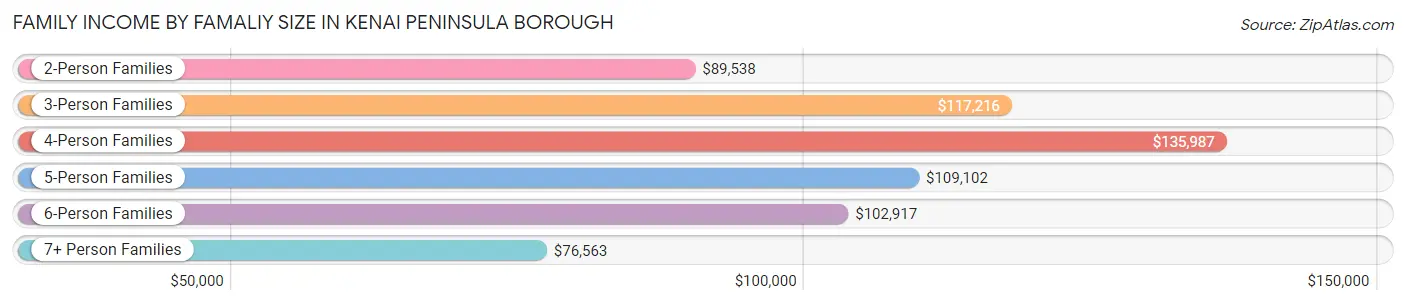
Family Income by Famaliy Size in Kenai Peninsula Borough
4-person families (2,079 | 15.1%) account for the highest median family income in Kenai Peninsula Borough with $135,987 per family, while 2-person families (7,488 | 54.5%) have the highest median income of $44,769 per family member.
| Income Bracket | # Families | Median Income |
| 2-Person Families | 7,488 (54.5%) | $89,538 |
| 3-Person Families | 2,368 (17.2%) | $117,216 |
| 4-Person Families | 2,079 (15.1%) | $135,987 |
| 5-Person Families | 1,175 (8.6%) | $109,102 |
| 6-Person Families | 425 (3.1%) | $102,917 |
| 7+ Person Families | 206 (1.5%) | $76,563 |
| Total | 13,741 (100.0%) | $101,126 |
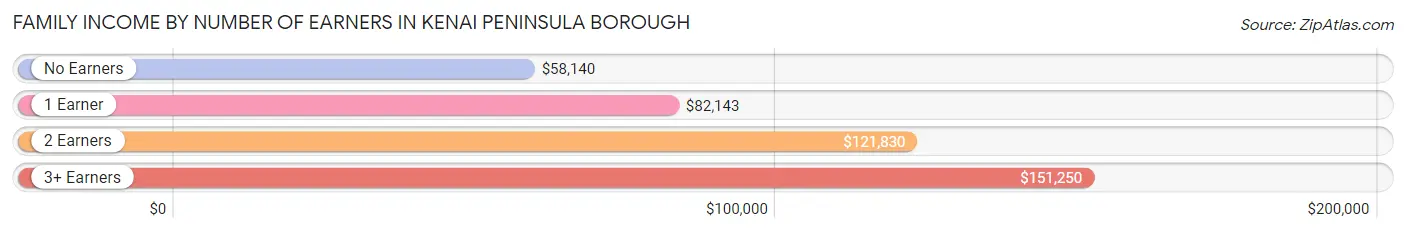
Family Income by Number of Earners in Kenai Peninsula Borough
The median family income in Kenai Peninsula Borough is $101,126, with families comprising 3+ earners (1,464) having the highest median family income of $151,250, while families with no earners (2,658) have the lowest median family income of $58,140, accounting for 10.6% and 19.3% of families, respectively.
| Number of Earners | # Families | Median Income |
| No Earners | 2,658 (19.3%) | $58,140 |
| 1 Earner | 4,256 (31.0%) | $82,143 |
| 2 Earners | 5,363 (39.0%) | $121,830 |
| 3+ Earners | 1,464 (10.6%) | $151,250 |
| Total | 13,741 (100.0%) | $101,126 |
Household Income in Kenai Peninsula Borough
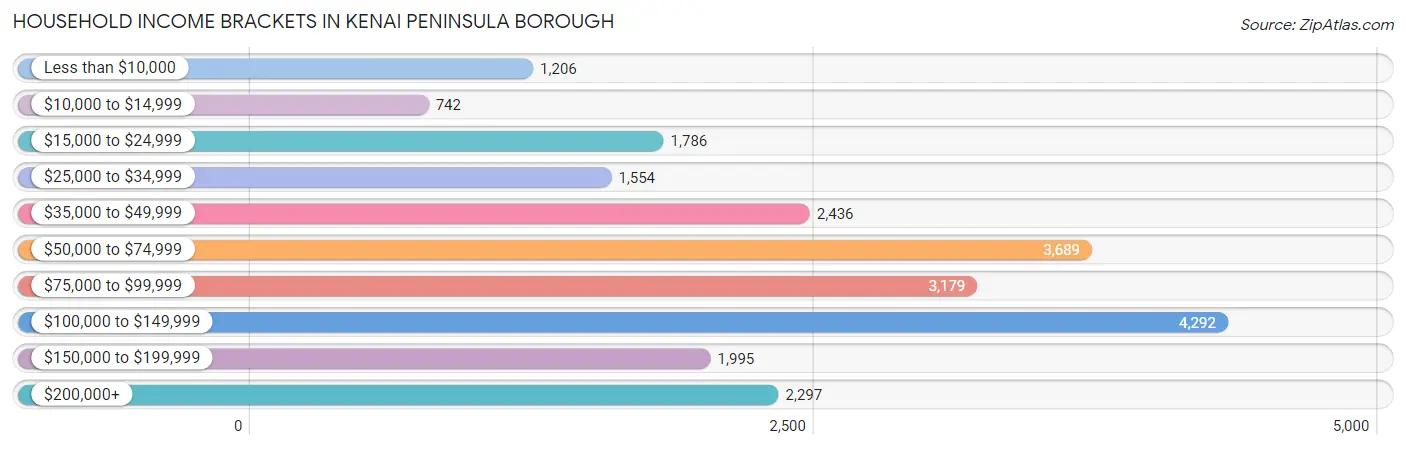
Household Income Brackets in Kenai Peninsula Borough
With 4,292 households falling in the category, the $100,000 to $149,999 income range is the most frequent in Kenai Peninsula Borough, accounting for 18.5% of all households. In contrast, only 742 households (3.2%) fall into the $10,000 to $14,999 income bracket, making it the least populous group.
| Income Bracket | # Households | % Households |
| Less than $10,000 | 1,206 | 5.2% |
| $10,000 to $14,999 | 742 | 3.2% |
| $15,000 to $24,999 | 1,786 | 7.7% |
| $25,000 to $34,999 | 1,554 | 6.7% |
| $35,000 to $49,999 | 2,436 | 10.5% |
| $50,000 to $74,999 | 3,689 | 15.9% |
| $75,000 to $99,999 | 3,179 | 13.7% |
| $100,000 to $149,999 | 4,292 | 18.5% |
| $150,000 to $199,999 | 1,995 | 8.6% |
| $200,000+ | 2,297 | 9.9% |
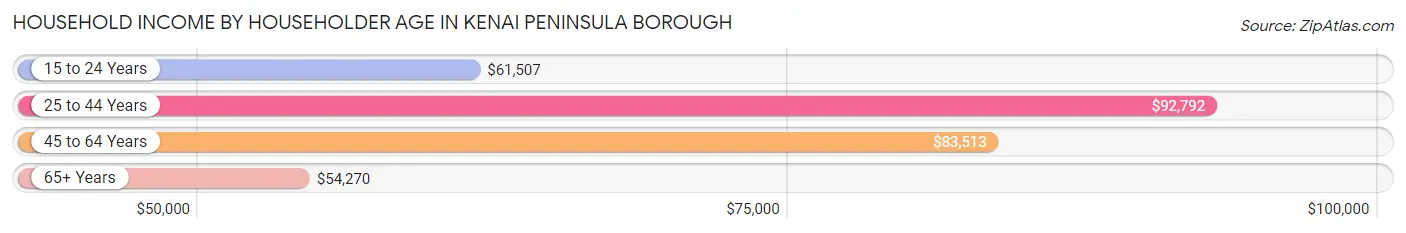
Household Income by Householder Age in Kenai Peninsula Borough
The median household income in Kenai Peninsula Borough is $76,272, with the highest median household income of $92,792 found in the 25 to 44 years age bracket for the primary householder. A total of 6,137 households (26.5%) fall into this category. Meanwhile, the 65+ years age bracket for the primary householder has the lowest median household income of $54,270, with 7,062 households (30.4%) in this group.
| Income Bracket | # Households | Median Income |
| 15 to 24 Years | 727 (3.1%) | $61,507 |
| 25 to 44 Years | 6,137 (26.5%) | $92,792 |
| 45 to 64 Years | 9,275 (40.0%) | $83,513 |
| 65+ Years | 7,062 (30.4%) | $54,270 |
| Total | 23,201 (100.0%) | $76,272 |
Poverty in Kenai Peninsula Borough
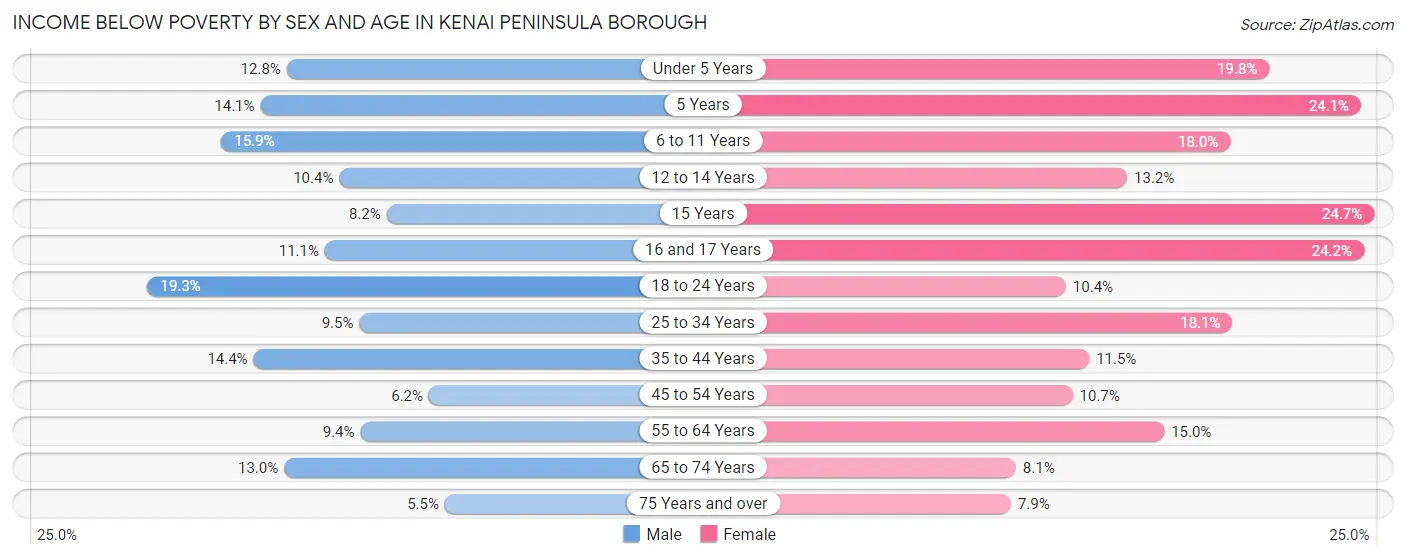
Income Below Poverty by Sex and Age in Kenai Peninsula Borough
With 11.4% poverty level for males and 13.7% for females among the residents of Kenai Peninsula Borough, 18 to 24 year old males and 15 year old females are the most vulnerable to poverty, with 466 males (19.3%) and 104 females (24.7%) in their respective age groups living below the poverty level.
| Age Bracket | Male | Female |
| Under 5 Years | 211 (12.8%) | 321 (19.8%) |
| 5 Years | 45 (14.1%) | 86 (24.1%) |
| 6 to 11 Years | 328 (15.9%) | 359 (18.0%) |
| 12 to 14 Years | 141 (10.4%) | 165 (13.2%) |
| 15 Years | 31 (8.2%) | 104 (24.7%) |
| 16 and 17 Years | 80 (11.1%) | 178 (24.2%) |
| 18 to 24 Years | 466 (19.3%) | 201 (10.4%) |
| 25 to 34 Years | 349 (9.5%) | 620 (18.1%) |
| 35 to 44 Years | 537 (14.4%) | 380 (11.5%) |
| 45 to 54 Years | 223 (6.2%) | 365 (10.7%) |
| 55 to 64 Years | 424 (9.4%) | 641 (15.0%) |
| 65 to 74 Years | 499 (13.0%) | 281 (8.1%) |
| 75 Years and over | 97 (5.5%) | 133 (7.9%) |
| Total | 3,431 (11.4%) | 3,834 (13.7%) |
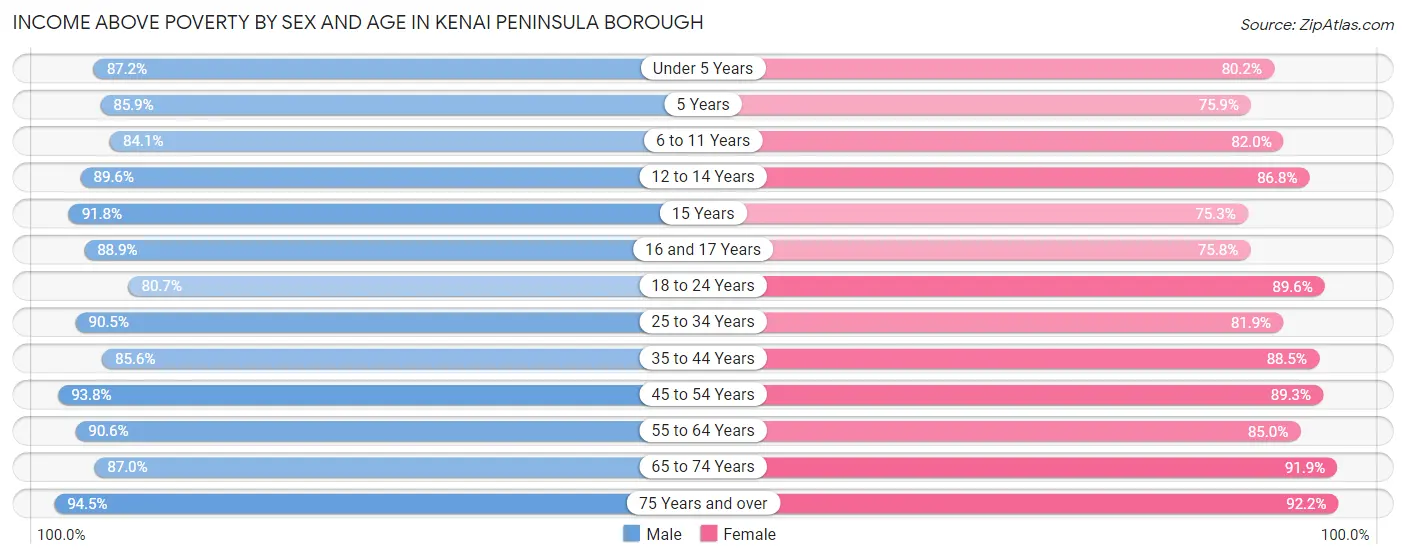
Income Above Poverty by Sex and Age in Kenai Peninsula Borough
According to the poverty statistics in Kenai Peninsula Borough, males aged 75 years and over and females aged 75 years and over are the age groups that are most secure financially, with 94.5% of males and 92.1% of females in these age groups living above the poverty line.
| Age Bracket | Male | Female |
| Under 5 Years | 1,432 (87.2%) | 1,298 (80.2%) |
| 5 Years | 275 (85.9%) | 271 (75.9%) |
| 6 to 11 Years | 1,739 (84.1%) | 1,633 (82.0%) |
| 12 to 14 Years | 1,215 (89.6%) | 1,081 (86.8%) |
| 15 Years | 347 (91.8%) | 317 (75.3%) |
| 16 and 17 Years | 643 (88.9%) | 557 (75.8%) |
| 18 to 24 Years | 1,949 (80.7%) | 1,731 (89.6%) |
| 25 to 34 Years | 3,335 (90.5%) | 2,801 (81.9%) |
| 35 to 44 Years | 3,198 (85.6%) | 2,930 (88.5%) |
| 45 to 54 Years | 3,352 (93.8%) | 3,044 (89.3%) |
| 55 to 64 Years | 4,076 (90.6%) | 3,644 (85.0%) |
| 65 to 74 Years | 3,350 (87.0%) | 3,195 (91.9%) |
| 75 Years and over | 1,668 (94.5%) | 1,562 (92.1%) |
| Total | 26,579 (88.6%) | 24,064 (86.3%) |
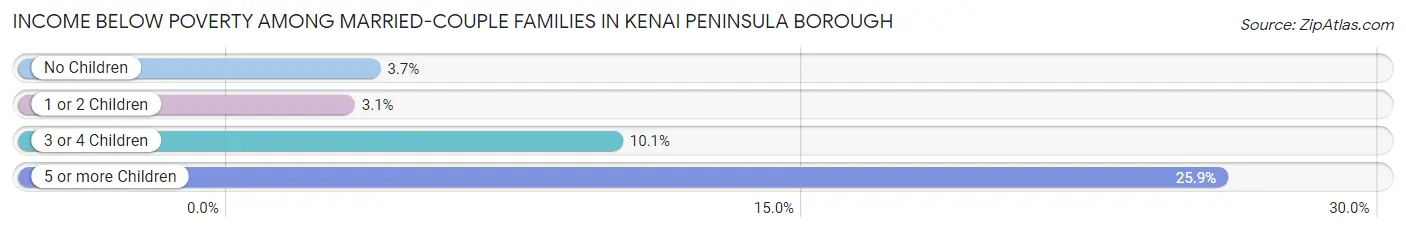
Income Below Poverty Among Married-Couple Families in Kenai Peninsula Borough
The poverty statistics for married-couple families in Kenai Peninsula Borough show that 4.5% or 497 of the total 11,143 families live below the poverty line. Families with 5 or more children have the highest poverty rate of 25.9%, comprising of 38 families. On the other hand, families with 1 or 2 children have the lowest poverty rate of 3.0%, which includes 86 families.
| Children | Above Poverty | Below Poverty |
| No Children | 6,831 (96.3%) | 264 (3.7%) |
| 1 or 2 Children | 2,730 (97.0%) | 86 (3.0%) |
| 3 or 4 Children | 976 (89.9%) | 109 (10.1%) |
| 5 or more Children | 109 (74.2%) | 38 (25.9%) |
| Total | 10,646 (95.5%) | 497 (4.5%) |
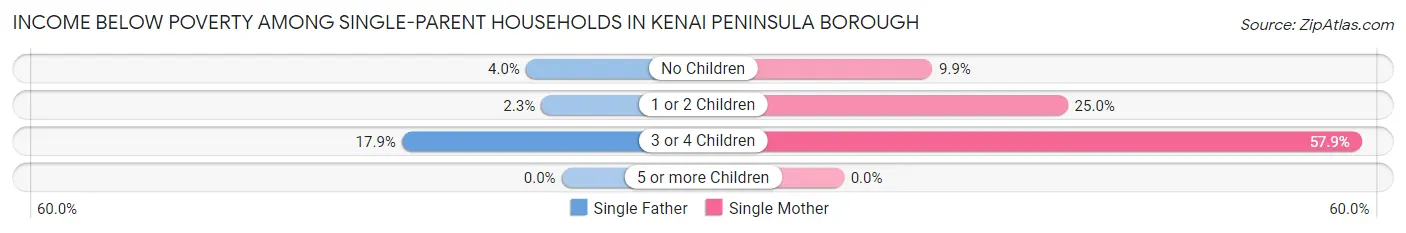
Income Below Poverty Among Single-Parent Households in Kenai Peninsula Borough
According to the poverty data in Kenai Peninsula Borough, 4.7% or 37 single-father households and 22.8% or 414 single-mother households are living below the poverty line. Among single-father households, those with 3 or 4 children have the highest poverty rate, with 15 households (17.9%) experiencing poverty. Likewise, among single-mother households, those with 3 or 4 children have the highest poverty rate, with 110 households (57.9%) falling below the poverty line.
| Children | Single Father | Single Mother |
| No Children | 14 (4.0%) | 67 (9.9%) |
| 1 or 2 Children | 8 (2.3%) | 237 (25.0%) |
| 3 or 4 Children | 15 (17.9%) | 110 (57.9%) |
| 5 or more Children | 0 (0.0%) | 0 (0.0%) |
| Total | 37 (4.7%) | 414 (22.8%) |
Income Below Poverty Among Married-Couple vs Single-Parent Households in Kenai Peninsula Borough
The poverty data for Kenai Peninsula Borough shows that 497 of the married-couple family households (4.5%) and 451 of the single-parent households (17.4%) are living below the poverty level. Within the married-couple family households, those with 5 or more children have the highest poverty rate, with 38 households (25.9%) falling below the poverty line. Among the single-parent households, those with 3 or 4 children have the highest poverty rate, with 125 household (45.6%) living below poverty.
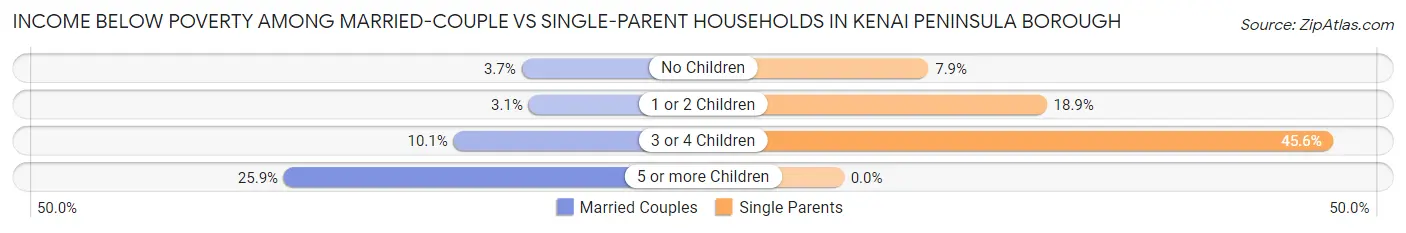
| Children | Married-Couple Families | Single-Parent Households |
| No Children | 264 (3.7%) | 81 (7.9%) |
| 1 or 2 Children | 86 (3.0%) | 245 (18.9%) |
| 3 or 4 Children | 109 (10.1%) | 125 (45.6%) |
| 5 or more Children | 38 (25.9%) | 0 (0.0%) |
| Total | 497 (4.5%) | 451 (17.4%) |
Employment Characteristics in Kenai Peninsula Borough
Employment by Class of Employer in Kenai Peninsula Borough
Among the 24,511 employed individuals in Kenai Peninsula Borough, private company employees (12,627 | 51.5%), not-for-profit organizations (3,002 | 12.2%), and local government employees (2,617 | 10.7%) make up the most common classes of employment.
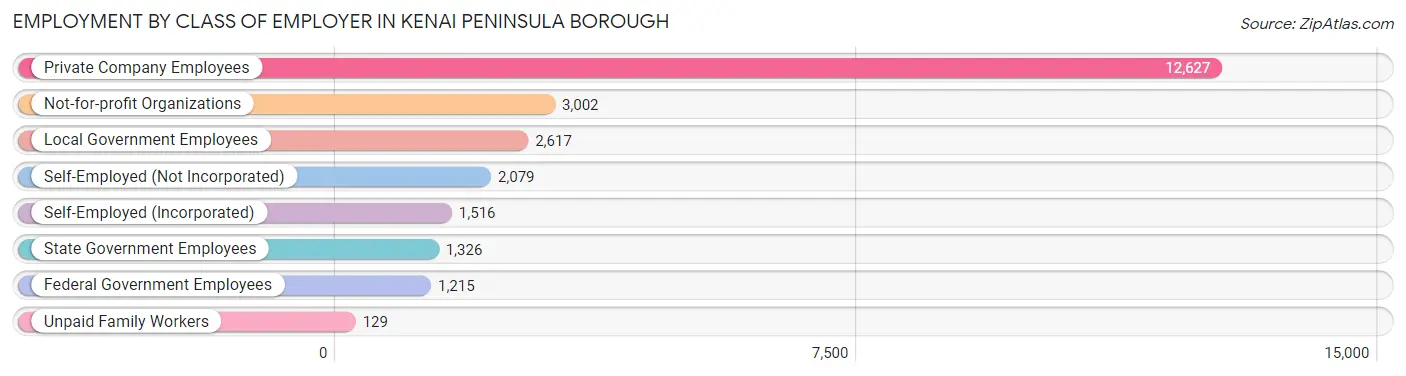
| Employer Class | # Employees | % Employees |
| Private Company Employees | 12,627 | 51.5% |
| Self-Employed (Incorporated) | 1,516 | 6.2% |
| Self-Employed (Not Incorporated) | 2,079 | 8.5% |
| Not-for-profit Organizations | 3,002 | 12.2% |
| Local Government Employees | 2,617 | 10.7% |
| State Government Employees | 1,326 | 5.4% |
| Federal Government Employees | 1,215 | 5.0% |
| Unpaid Family Workers | 129 | 0.5% |
| Total | 24,511 | 100.0% |
Employment Status by Age in Kenai Peninsula Borough
According to the labor force statistics for Kenai Peninsula Borough, out of the total population over 16 years of age (47,627), 57.5% or 27,386 individuals are in the labor force, with 7.2% or 1,972 of them unemployed. The age group with the highest labor force participation rate is 45 to 54 years, with 80.8% or 5,730 individuals in the labor force. Within the labor force, the 16 to 19 years age range has the highest percentage of unemployed individuals, with 18.4% or 205 of them being unemployed.
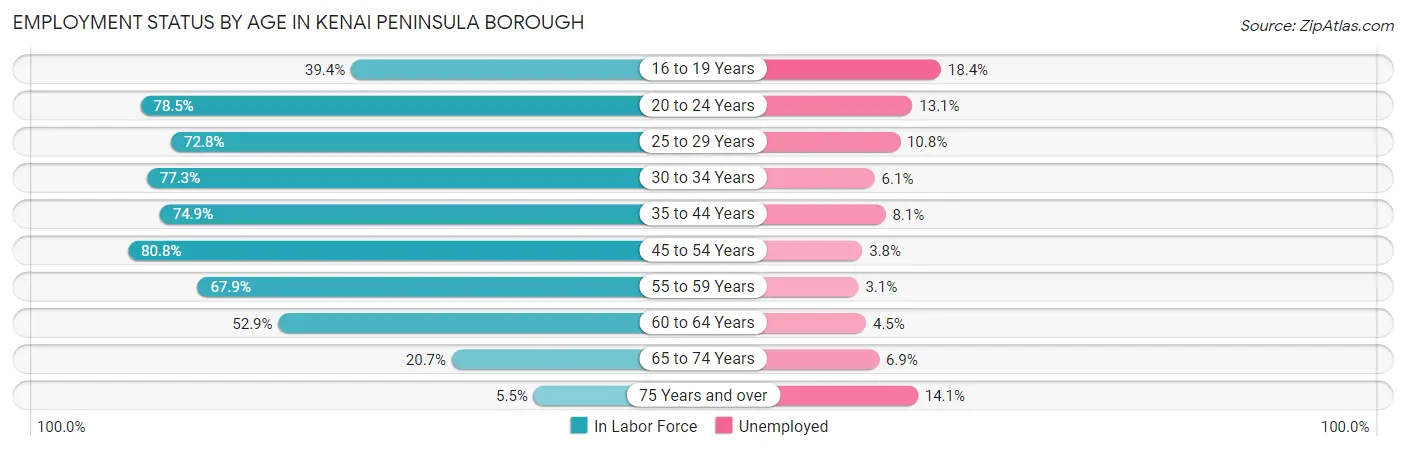
| Age Bracket | In Labor Force | Unemployed |
| 16 to 19 Years | 1,115 (39.4%) | 205 (18.4%) |
| 20 to 24 Years | 2,474 (78.5%) | 324 (13.1%) |
| 25 to 29 Years | 2,595 (72.8%) | 280 (10.8%) |
| 30 to 34 Years | 2,952 (77.3%) | 180 (6.1%) |
| 35 to 44 Years | 5,477 (74.9%) | 444 (8.1%) |
| 45 to 54 Years | 5,730 (80.8%) | 218 (3.8%) |
| 55 to 59 Years | 2,770 (67.9%) | 86 (3.1%) |
| 60 to 64 Years | 2,525 (52.9%) | 114 (4.5%) |
| 65 to 74 Years | 1,533 (20.7%) | 106 (6.9%) |
| 75 Years and over | 198 (5.5%) | 28 (14.1%) |
| Total | 27,386 (57.5%) | 1,972 (7.2%) |
Employment Status by Educational Attainment in Kenai Peninsula Borough
According to labor force statistics for Kenai Peninsula Borough, 72.0% of individuals (22,061) out of the total population between 25 and 64 years of age (30,640) are in the labor force, with 6.0% or 1,324 of them being unemployed. The group with the highest labor force participation rate are those with the educational attainment of bachelor's degree or higher, with 83.0% or 6,707 individuals in the labor force. Within the labor force, individuals with college / associate degree education have the highest percentage of unemployment, with 8.0% or 652 of them being unemployed.
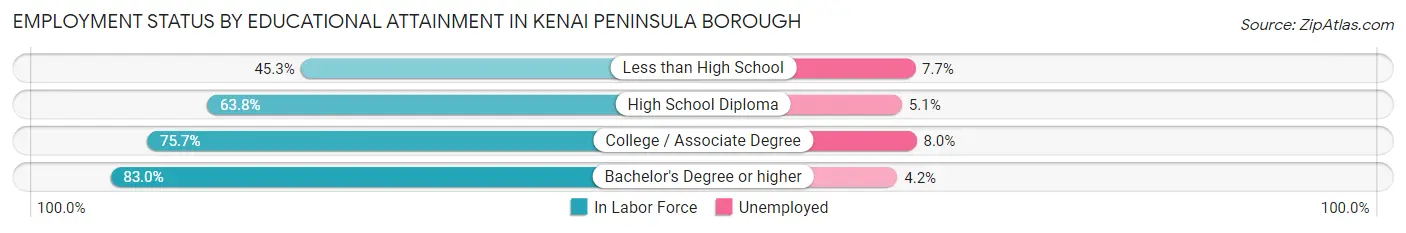
| Educational Attainment | In Labor Force | Unemployed |
| Less than High School | 813 (45.3%) | 138 (7.7%) |
| High School Diploma | 6,377 (63.8%) | 510 (5.1%) |
| College / Associate Degree | 8,151 (75.7%) | 861 (8.0%) |
| Bachelor's Degree or higher | 6,707 (83.0%) | 339 (4.2%) |
| Total | 22,061 (72.0%) | 1,838 (6.0%) |
Employment Occupations by Sex in Kenai Peninsula Borough
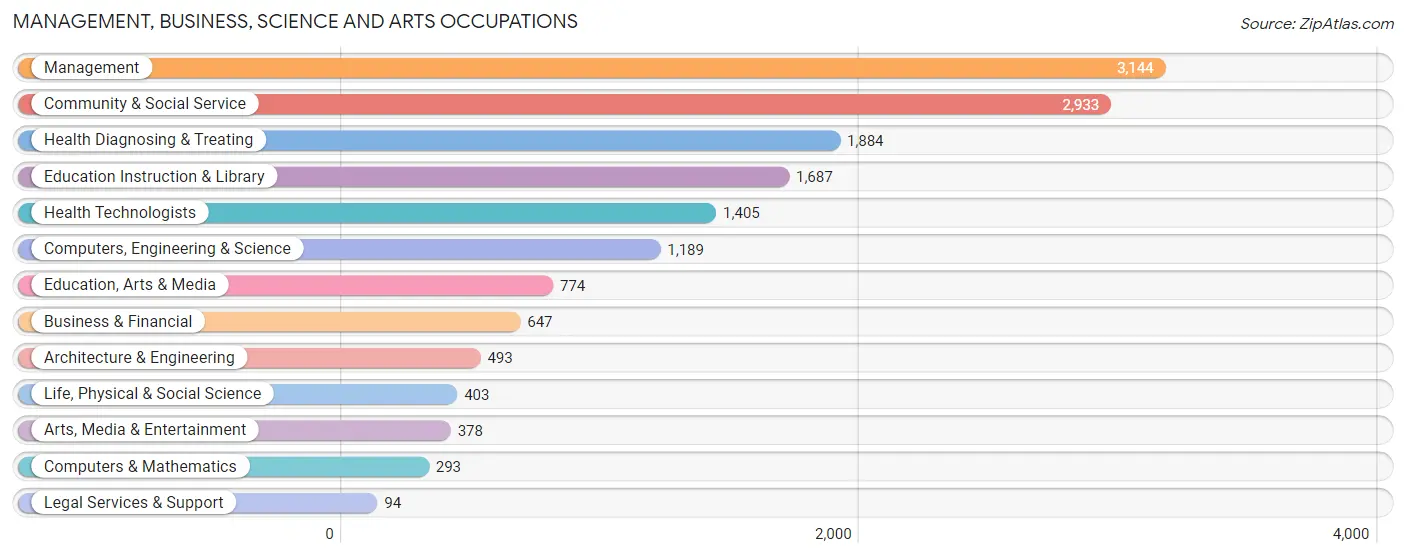
Management, Business, Science and Arts Occupations
The most common Management, Business, Science and Arts occupations in Kenai Peninsula Borough are Management (3,144 | 12.5%), Community & Social Service (2,933 | 11.6%), Health Diagnosing & Treating (1,884 | 7.5%), Education Instruction & Library (1,687 | 6.7%), and Health Technologists (1,405 | 5.6%).
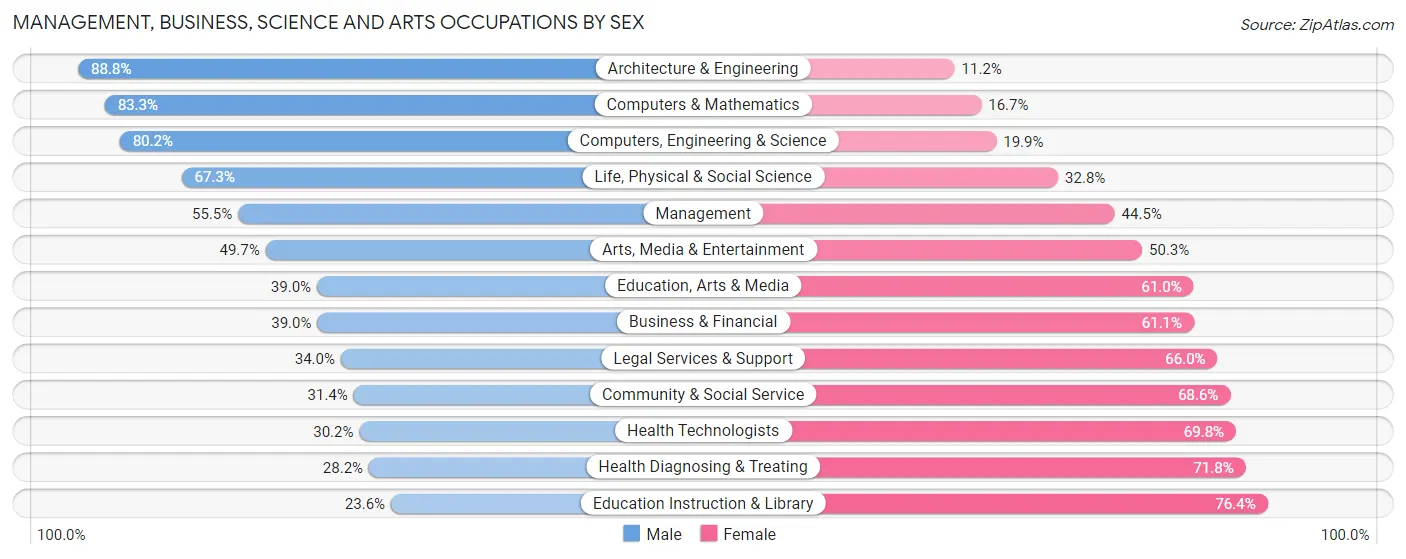
Management, Business, Science and Arts Occupations by Sex
Within the Management, Business, Science and Arts occupations in Kenai Peninsula Borough, the most male-oriented occupations are Architecture & Engineering (88.8%), Computers & Mathematics (83.3%), and Computers, Engineering & Science (80.1%), while the most female-oriented occupations are Education Instruction & Library (76.4%), Health Diagnosing & Treating (71.8%), and Health Technologists (69.8%).
| Occupation | Male | Female |
| Management | 1,744 (55.5%) | 1,400 (44.5%) |
| Business & Financial | 252 (39.0%) | 395 (61.1%) |
| Computers, Engineering & Science | 953 (80.1%) | 236 (19.9%) |
| Computers & Mathematics | 244 (83.3%) | 49 (16.7%) |
| Architecture & Engineering | 438 (88.8%) | 55 (11.2%) |
| Life, Physical & Social Science | 271 (67.2%) | 132 (32.8%) |
| Community & Social Service | 920 (31.4%) | 2,013 (68.6%) |
| Education, Arts & Media | 302 (39.0%) | 472 (61.0%) |
| Legal Services & Support | 32 (34.0%) | 62 (66.0%) |
| Education Instruction & Library | 398 (23.6%) | 1,289 (76.4%) |
| Arts, Media & Entertainment | 188 (49.7%) | 190 (50.3%) |
| Health Diagnosing & Treating | 531 (28.2%) | 1,353 (71.8%) |
| Health Technologists | 424 (30.2%) | 981 (69.8%) |
| Total (Category) | 4,400 (44.9%) | 5,397 (55.1%) |
| Total (Overall) | 13,812 (54.7%) | 11,415 (45.3%) |
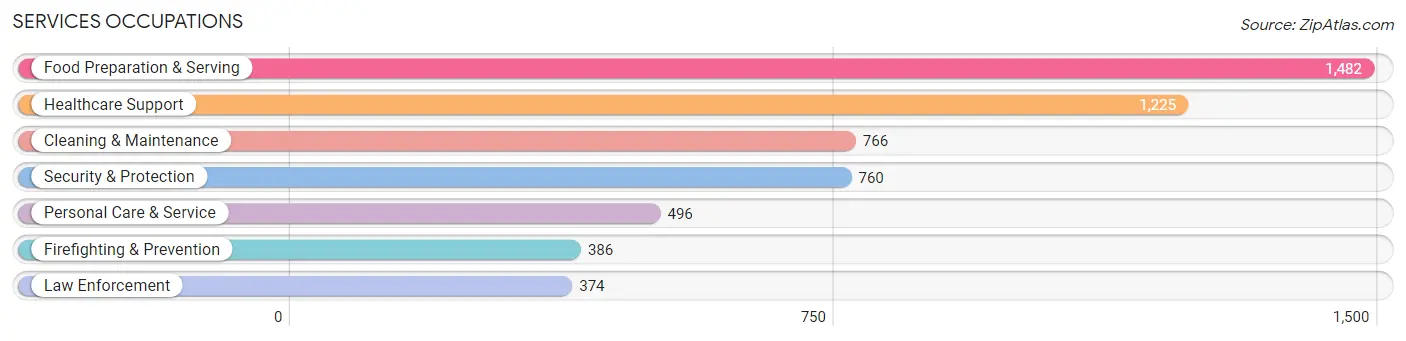
Services Occupations
The most common Services occupations in Kenai Peninsula Borough are Food Preparation & Serving (1,482 | 5.9%), Healthcare Support (1,225 | 4.9%), Cleaning & Maintenance (766 | 3.0%), Security & Protection (760 | 3.0%), and Personal Care & Service (496 | 2.0%).
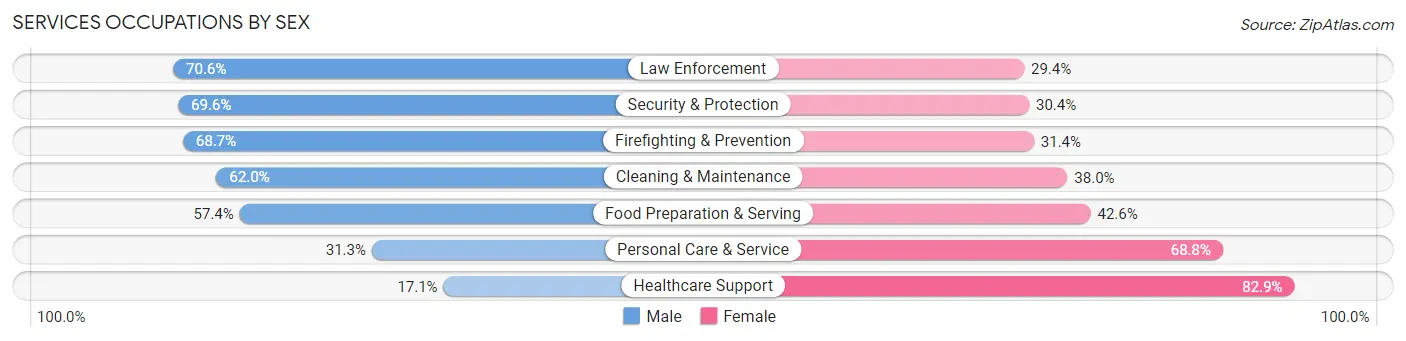
Services Occupations by Sex
Within the Services occupations in Kenai Peninsula Borough, the most male-oriented occupations are Law Enforcement (70.6%), Security & Protection (69.6%), and Firefighting & Prevention (68.6%), while the most female-oriented occupations are Healthcare Support (82.9%), Personal Care & Service (68.8%), and Food Preparation & Serving (42.6%).
| Occupation | Male | Female |
| Healthcare Support | 209 (17.1%) | 1,016 (82.9%) |
| Security & Protection | 529 (69.6%) | 231 (30.4%) |
| Firefighting & Prevention | 265 (68.6%) | 121 (31.4%) |
| Law Enforcement | 264 (70.6%) | 110 (29.4%) |
| Food Preparation & Serving | 851 (57.4%) | 631 (42.6%) |
| Cleaning & Maintenance | 475 (62.0%) | 291 (38.0%) |
| Personal Care & Service | 155 (31.2%) | 341 (68.8%) |
| Total (Category) | 2,219 (46.9%) | 2,510 (53.1%) |
| Total (Overall) | 13,812 (54.7%) | 11,415 (45.3%) |
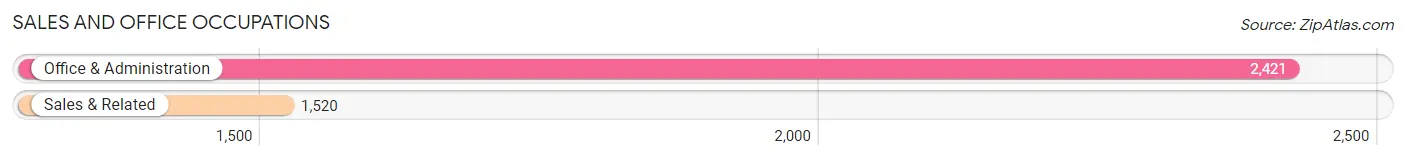
Sales and Office Occupations
The most common Sales and Office occupations in Kenai Peninsula Borough are Office & Administration (2,421 | 9.6%), and Sales & Related (1,520 | 6.0%).
Sales and Office Occupations by Sex
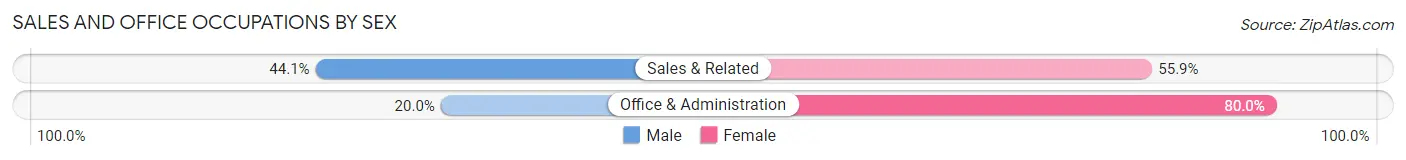
| Occupation | Male | Female |
| Sales & Related | 670 (44.1%) | 850 (55.9%) |
| Office & Administration | 484 (20.0%) | 1,937 (80.0%) |
| Total (Category) | 1,154 (29.3%) | 2,787 (70.7%) |
| Total (Overall) | 13,812 (54.7%) | 11,415 (45.3%) |
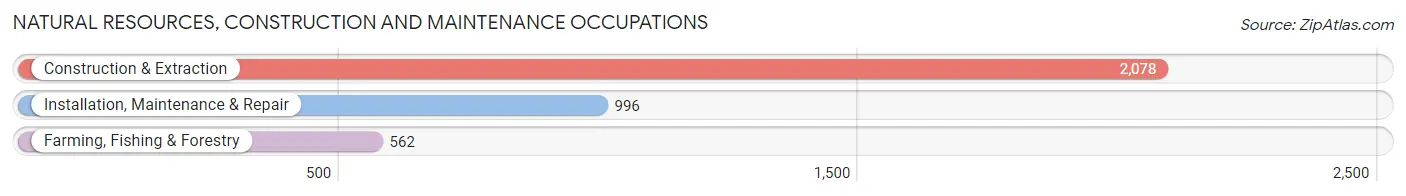
Natural Resources, Construction and Maintenance Occupations
The most common Natural Resources, Construction and Maintenance occupations in Kenai Peninsula Borough are Construction & Extraction (2,078 | 8.2%), Installation, Maintenance & Repair (996 | 4.0%), and Farming, Fishing & Forestry (562 | 2.2%).
Natural Resources, Construction and Maintenance Occupations by Sex
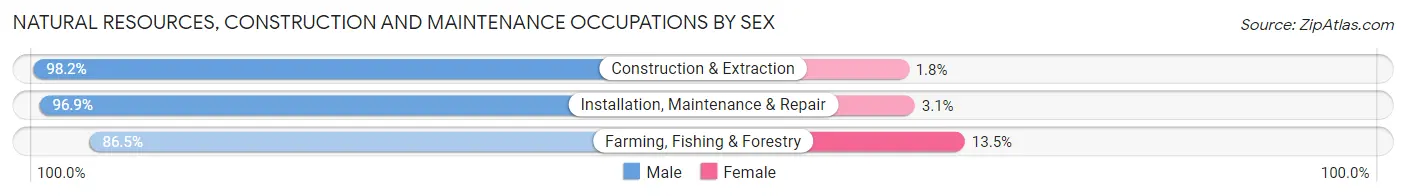
| Occupation | Male | Female |
| Farming, Fishing & Forestry | 486 (86.5%) | 76 (13.5%) |
| Construction & Extraction | 2,040 (98.2%) | 38 (1.8%) |
| Installation, Maintenance & Repair | 965 (96.9%) | 31 (3.1%) |
| Total (Category) | 3,491 (96.0%) | 145 (4.0%) |
| Total (Overall) | 13,812 (54.7%) | 11,415 (45.3%) |
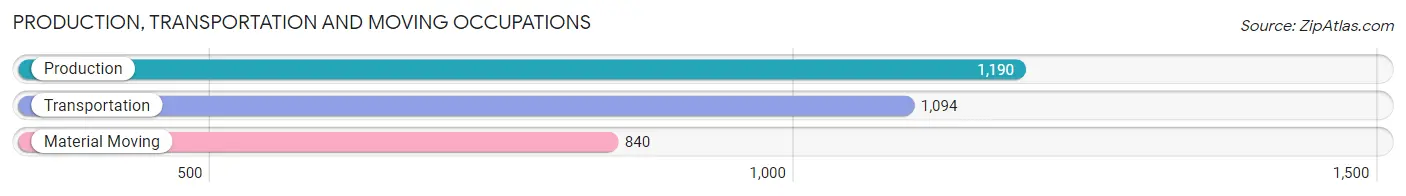
Production, Transportation and Moving Occupations
The most common Production, Transportation and Moving occupations in Kenai Peninsula Borough are Production (1,190 | 4.7%), Transportation (1,094 | 4.3%), and Material Moving (840 | 3.3%).
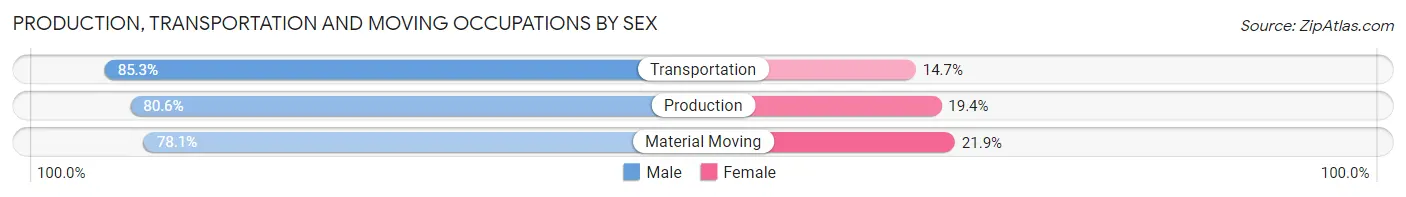
Production, Transportation and Moving Occupations by Sex
| Occupation | Male | Female |
| Production | 959 (80.6%) | 231 (19.4%) |
| Transportation | 933 (85.3%) | 161 (14.7%) |
| Material Moving | 656 (78.1%) | 184 (21.9%) |
| Total (Category) | 2,548 (81.6%) | 576 (18.4%) |
| Total (Overall) | 13,812 (54.7%) | 11,415 (45.3%) |
Employment Industries by Sex in Kenai Peninsula Borough
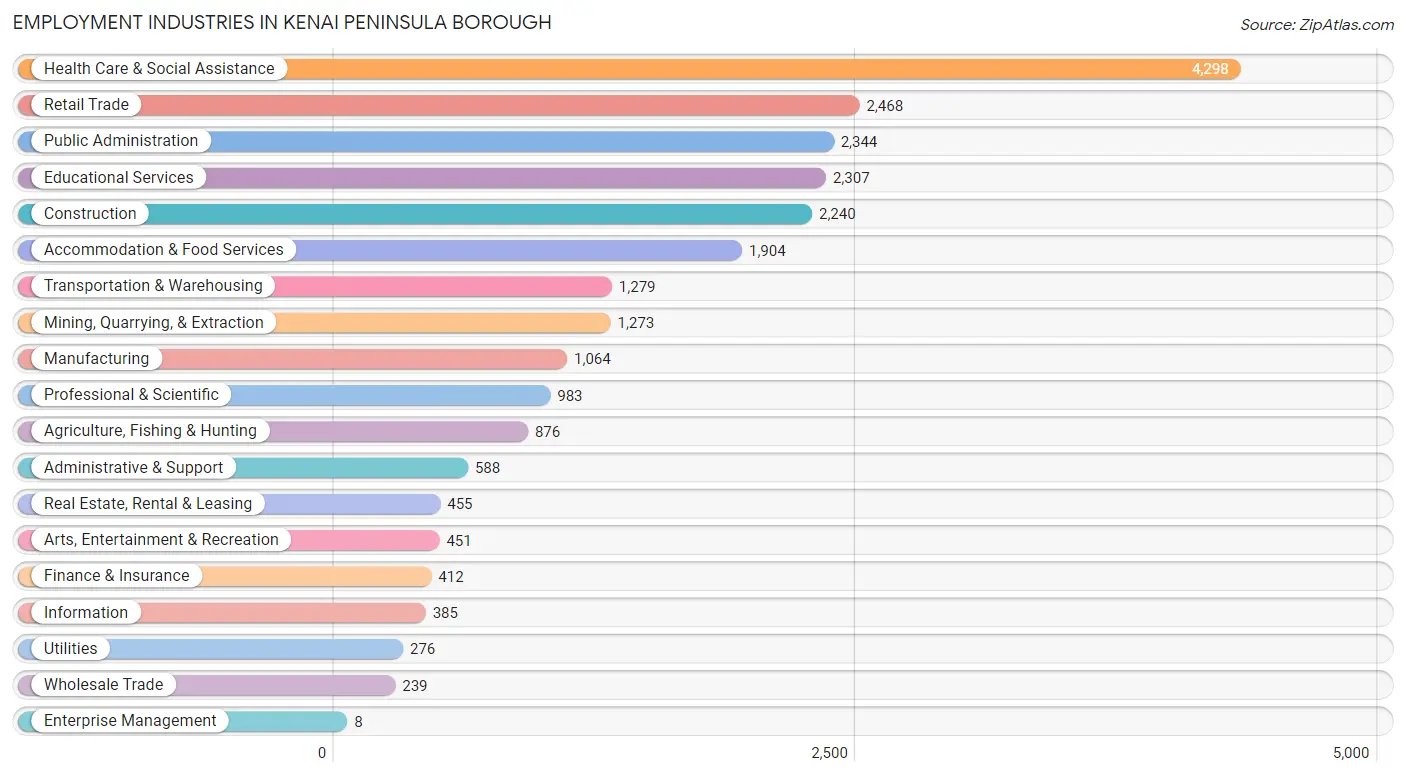
Employment Industries in Kenai Peninsula Borough
The major employment industries in Kenai Peninsula Borough include Health Care & Social Assistance (4,298 | 17.0%), Retail Trade (2,468 | 9.8%), Public Administration (2,344 | 9.3%), Educational Services (2,307 | 9.1%), and Construction (2,240 | 8.9%).
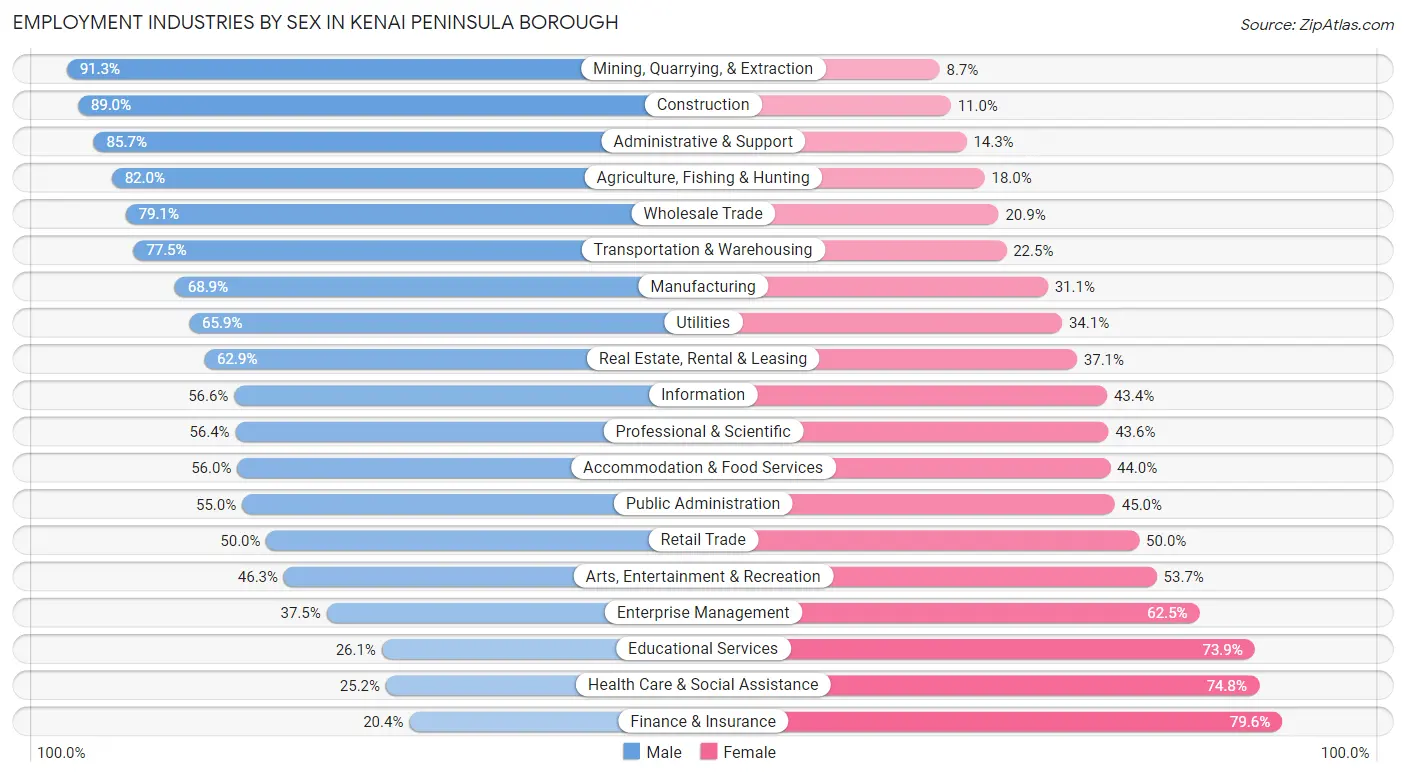
Employment Industries by Sex in Kenai Peninsula Borough
The Kenai Peninsula Borough industries that see more men than women are Mining, Quarrying, & Extraction (91.3%), Construction (89.0%), and Administrative & Support (85.7%), whereas the industries that tend to have a higher number of women are Finance & Insurance (79.6%), Health Care & Social Assistance (74.8%), and Educational Services (73.9%).
| Industry | Male | Female |
| Agriculture, Fishing & Hunting | 718 (82.0%) | 158 (18.0%) |
| Mining, Quarrying, & Extraction | 1,162 (91.3%) | 111 (8.7%) |
| Construction | 1,993 (89.0%) | 247 (11.0%) |
| Manufacturing | 733 (68.9%) | 331 (31.1%) |
| Wholesale Trade | 189 (79.1%) | 50 (20.9%) |
| Retail Trade | 1,233 (50.0%) | 1,235 (50.0%) |
| Transportation & Warehousing | 991 (77.5%) | 288 (22.5%) |
| Utilities | 182 (65.9%) | 94 (34.1%) |
| Information | 218 (56.6%) | 167 (43.4%) |
| Finance & Insurance | 84 (20.4%) | 328 (79.6%) |
| Real Estate, Rental & Leasing | 286 (62.9%) | 169 (37.1%) |
| Professional & Scientific | 554 (56.4%) | 429 (43.6%) |
| Enterprise Management | 3 (37.5%) | 5 (62.5%) |
| Administrative & Support | 504 (85.7%) | 84 (14.3%) |
| Educational Services | 602 (26.1%) | 1,705 (73.9%) |
| Health Care & Social Assistance | 1,084 (25.2%) | 3,214 (74.8%) |
| Arts, Entertainment & Recreation | 209 (46.3%) | 242 (53.7%) |
| Accommodation & Food Services | 1,066 (56.0%) | 838 (44.0%) |
| Public Administration | 1,289 (55.0%) | 1,055 (45.0%) |
| Total | 13,812 (54.7%) | 11,415 (45.3%) |
Education in Kenai Peninsula Borough
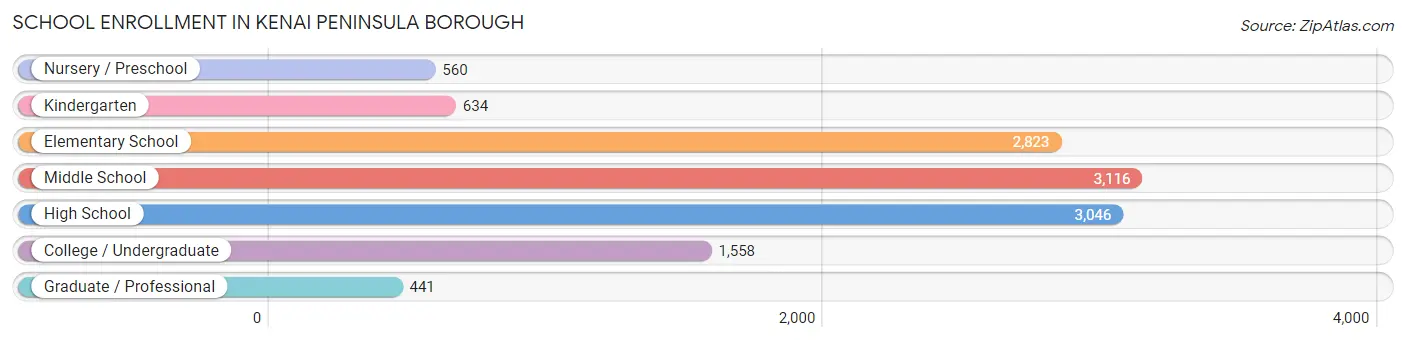
School Enrollment in Kenai Peninsula Borough
The most common levels of schooling among the 12,178 students in Kenai Peninsula Borough are middle school (3,116 | 25.6%), high school (3,046 | 25.0%), and elementary school (2,823 | 23.2%).
| School Level | # Students | % Students |
| Nursery / Preschool | 560 | 4.6% |
| Kindergarten | 634 | 5.2% |
| Elementary School | 2,823 | 23.2% |
| Middle School | 3,116 | 25.6% |
| High School | 3,046 | 25.0% |
| College / Undergraduate | 1,558 | 12.8% |
| Graduate / Professional | 441 | 3.6% |
| Total | 12,178 | 100.0% |
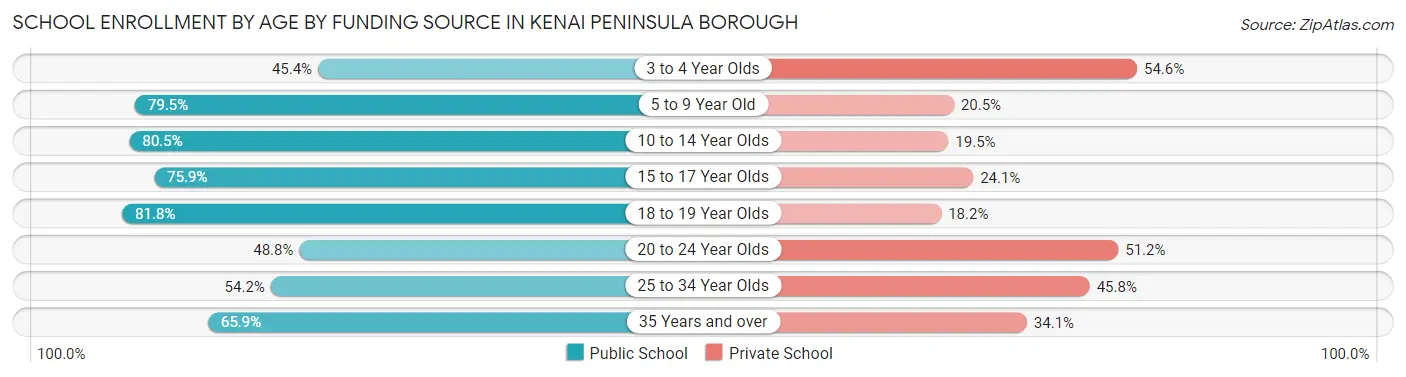
School Enrollment by Age by Funding Source in Kenai Peninsula Borough
Out of a total of 12,178 students who are enrolled in schools in Kenai Peninsula Borough, 3,044 (25.0%) attend a private institution, while the remaining 9,134 (75.0%) are enrolled in public schools. The age group of 3 to 4 year olds has the highest likelihood of being enrolled in private schools, with 200 (54.6% in the age bracket) enrolled. Conversely, the age group of 18 to 19 year olds has the lowest likelihood of being enrolled in a private school, with 563 (81.8% in the age bracket) attending a public institution.
| Age Bracket | Public School | Private School |
| 3 to 4 Year Olds | 166 (45.4%) | 200 (54.6%) |
| 5 to 9 Year Old | 2,642 (79.5%) | 683 (20.5%) |
| 10 to 14 Year Olds | 3,032 (80.5%) | 735 (19.5%) |
| 15 to 17 Year Olds | 1,688 (75.9%) | 537 (24.1%) |
| 18 to 19 Year Olds | 563 (81.8%) | 125 (18.2%) |
| 20 to 24 Year Olds | 253 (48.8%) | 265 (51.2%) |
| 25 to 34 Year Olds | 292 (54.2%) | 247 (45.8%) |
| 35 Years and over | 494 (65.9%) | 256 (34.1%) |
| Total | 9,134 (75.0%) | 3,044 (25.0%) |
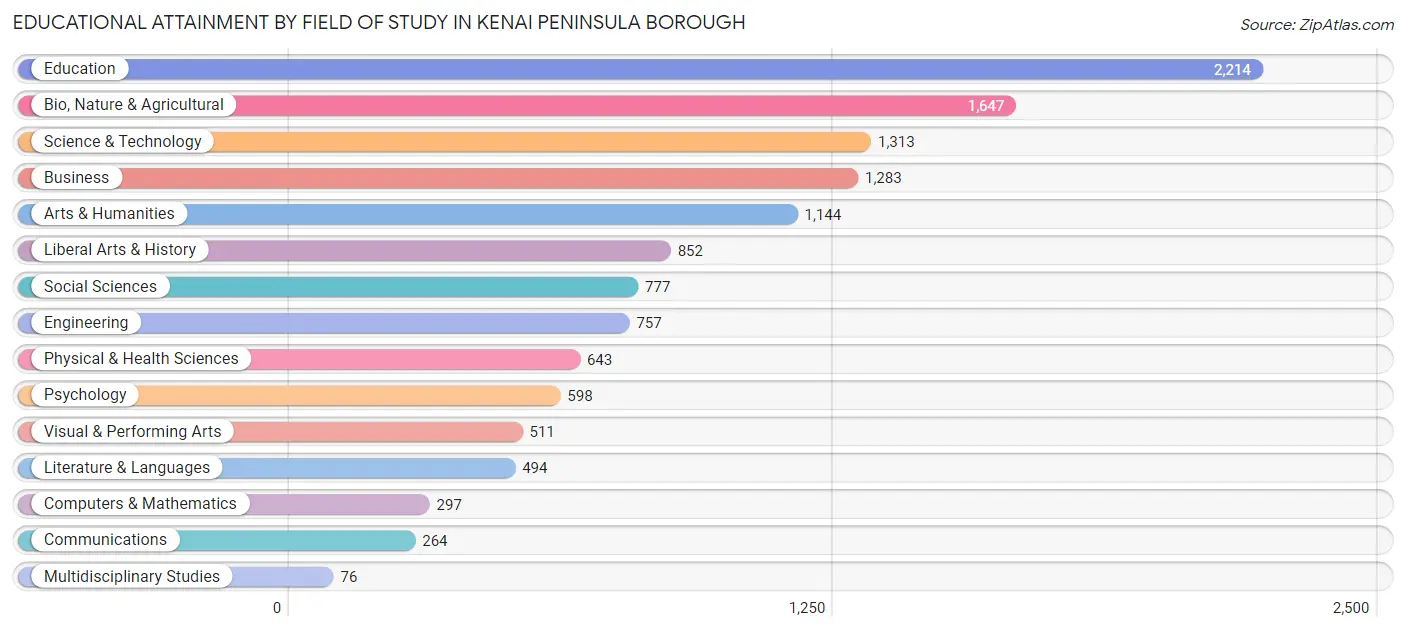
Educational Attainment by Field of Study in Kenai Peninsula Borough
Education (2,214 | 17.2%), bio, nature & agricultural (1,647 | 12.8%), science & technology (1,313 | 10.2%), business (1,283 | 10.0%), and arts & humanities (1,144 | 8.9%) are the most common fields of study among 12,870 individuals in Kenai Peninsula Borough who have obtained a bachelor's degree or higher.
| Field of Study | # Graduates | % Graduates |
| Computers & Mathematics | 297 | 2.3% |
| Bio, Nature & Agricultural | 1,647 | 12.8% |
| Physical & Health Sciences | 643 | 5.0% |
| Psychology | 598 | 4.6% |
| Social Sciences | 777 | 6.0% |
| Engineering | 757 | 5.9% |
| Multidisciplinary Studies | 76 | 0.6% |
| Science & Technology | 1,313 | 10.2% |
| Business | 1,283 | 10.0% |
| Education | 2,214 | 17.2% |
| Literature & Languages | 494 | 3.8% |
| Liberal Arts & History | 852 | 6.6% |
| Visual & Performing Arts | 511 | 4.0% |
| Communications | 264 | 2.1% |
| Arts & Humanities | 1,144 | 8.9% |
| Total | 12,870 | 100.0% |
Transportation & Commute in Kenai Peninsula Borough
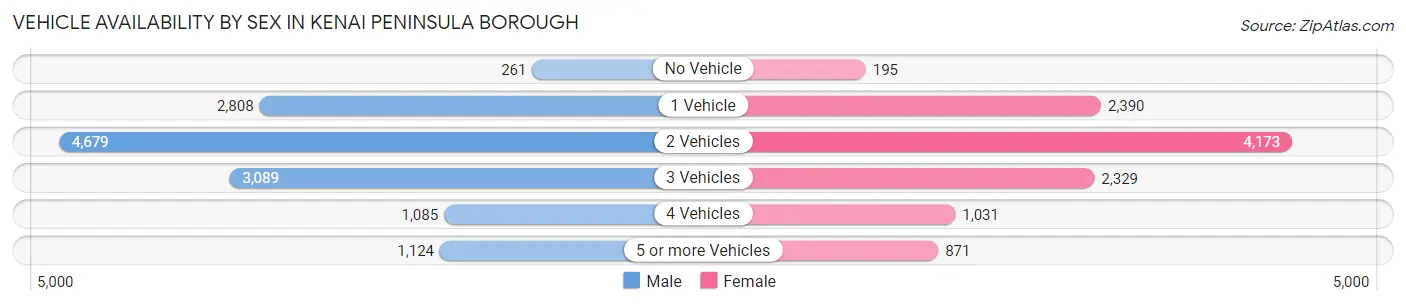
Vehicle Availability by Sex in Kenai Peninsula Borough
The most prevalent vehicle ownership categories in Kenai Peninsula Borough are males with 2 vehicles (4,679, accounting for 35.9%) and females with 2 vehicles (4,173, making up 42.6%).
| Vehicles Available | Male | Female |
| No Vehicle | 261 (2.0%) | 195 (1.8%) |
| 1 Vehicle | 2,808 (21.5%) | 2,390 (21.7%) |
| 2 Vehicles | 4,679 (35.9%) | 4,173 (38.0%) |
| 3 Vehicles | 3,089 (23.7%) | 2,329 (21.2%) |
| 4 Vehicles | 1,085 (8.3%) | 1,031 (9.4%) |
| 5 or more Vehicles | 1,124 (8.6%) | 871 (7.9%) |
| Total | 13,046 (100.0%) | 10,989 (100.0%) |
Commute Time in Kenai Peninsula Borough
The most frequently occuring commute durations in Kenai Peninsula Borough are 15 to 19 minutes (4,363 commuters, 19.6%), 10 to 14 minutes (4,018 commuters, 18.1%), and 5 to 9 minutes (3,715 commuters, 16.7%).
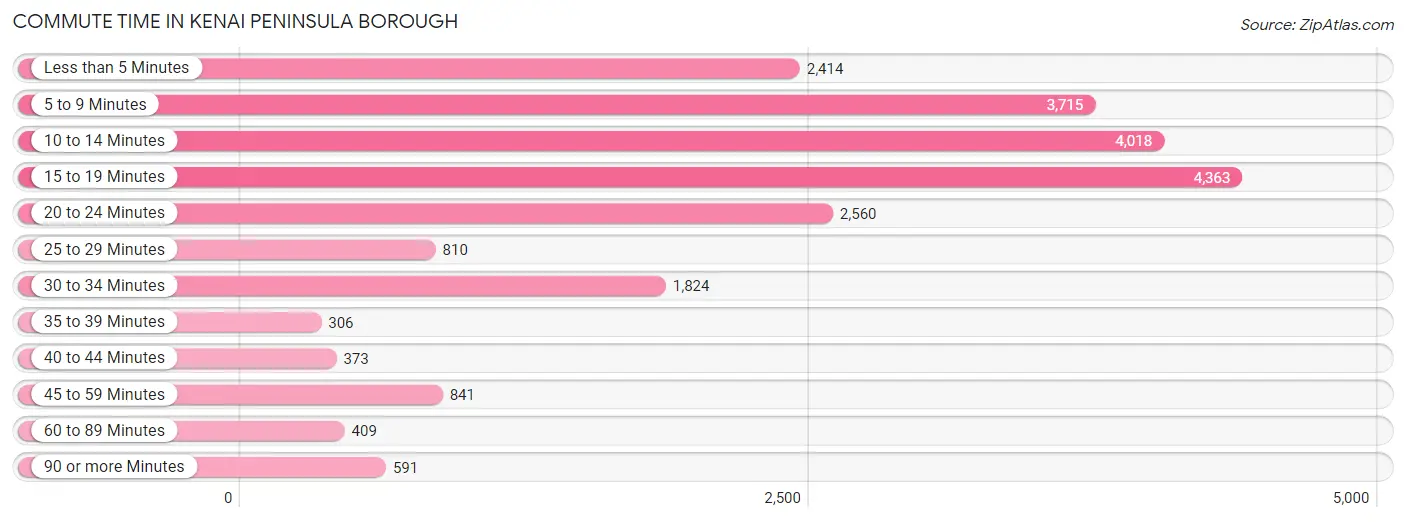
| Commute Time | # Commuters | % Commuters |
| Less than 5 Minutes | 2,414 | 10.9% |
| 5 to 9 Minutes | 3,715 | 16.7% |
| 10 to 14 Minutes | 4,018 | 18.1% |
| 15 to 19 Minutes | 4,363 | 19.6% |
| 20 to 24 Minutes | 2,560 | 11.5% |
| 25 to 29 Minutes | 810 | 3.6% |
| 30 to 34 Minutes | 1,824 | 8.2% |
| 35 to 39 Minutes | 306 | 1.4% |
| 40 to 44 Minutes | 373 | 1.7% |
| 45 to 59 Minutes | 841 | 3.8% |
| 60 to 89 Minutes | 409 | 1.8% |
| 90 or more Minutes | 591 | 2.7% |
Commute Time by Sex in Kenai Peninsula Borough
The most common commute times in Kenai Peninsula Borough are 15 to 19 minutes (2,300 commuters, 18.3%) for males and 15 to 19 minutes (2,063 commuters, 21.3%) for females.
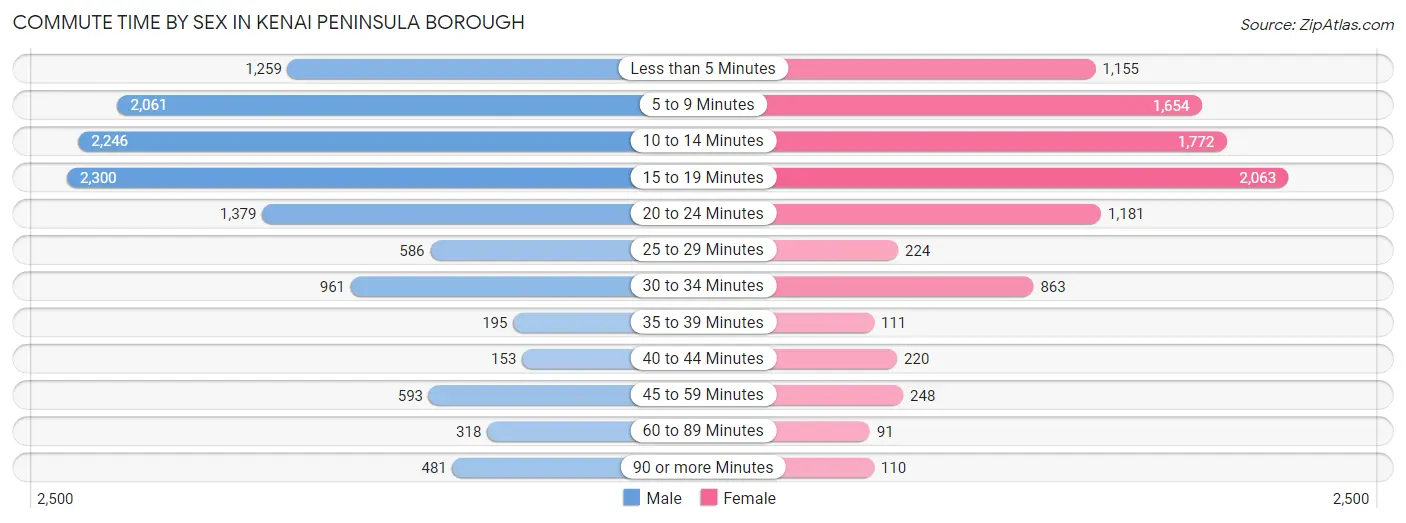
| Commute Time | Male | Female |
| Less than 5 Minutes | 1,259 (10.1%) | 1,155 (11.9%) |
| 5 to 9 Minutes | 2,061 (16.5%) | 1,654 (17.1%) |
| 10 to 14 Minutes | 2,246 (17.9%) | 1,772 (18.3%) |
| 15 to 19 Minutes | 2,300 (18.3%) | 2,063 (21.3%) |
| 20 to 24 Minutes | 1,379 (11.0%) | 1,181 (12.2%) |
| 25 to 29 Minutes | 586 (4.7%) | 224 (2.3%) |
| 30 to 34 Minutes | 961 (7.7%) | 863 (8.9%) |
| 35 to 39 Minutes | 195 (1.6%) | 111 (1.1%) |
| 40 to 44 Minutes | 153 (1.2%) | 220 (2.3%) |
| 45 to 59 Minutes | 593 (4.7%) | 248 (2.6%) |
| 60 to 89 Minutes | 318 (2.5%) | 91 (0.9%) |
| 90 or more Minutes | 481 (3.8%) | 110 (1.1%) |
Time of Departure to Work by Sex in Kenai Peninsula Borough
The most frequent times of departure to work in Kenai Peninsula Borough are 7:30 AM to 7:59 AM (2,066, 16.5%) for males and 7:30 AM to 7:59 AM (1,562, 16.1%) for females.
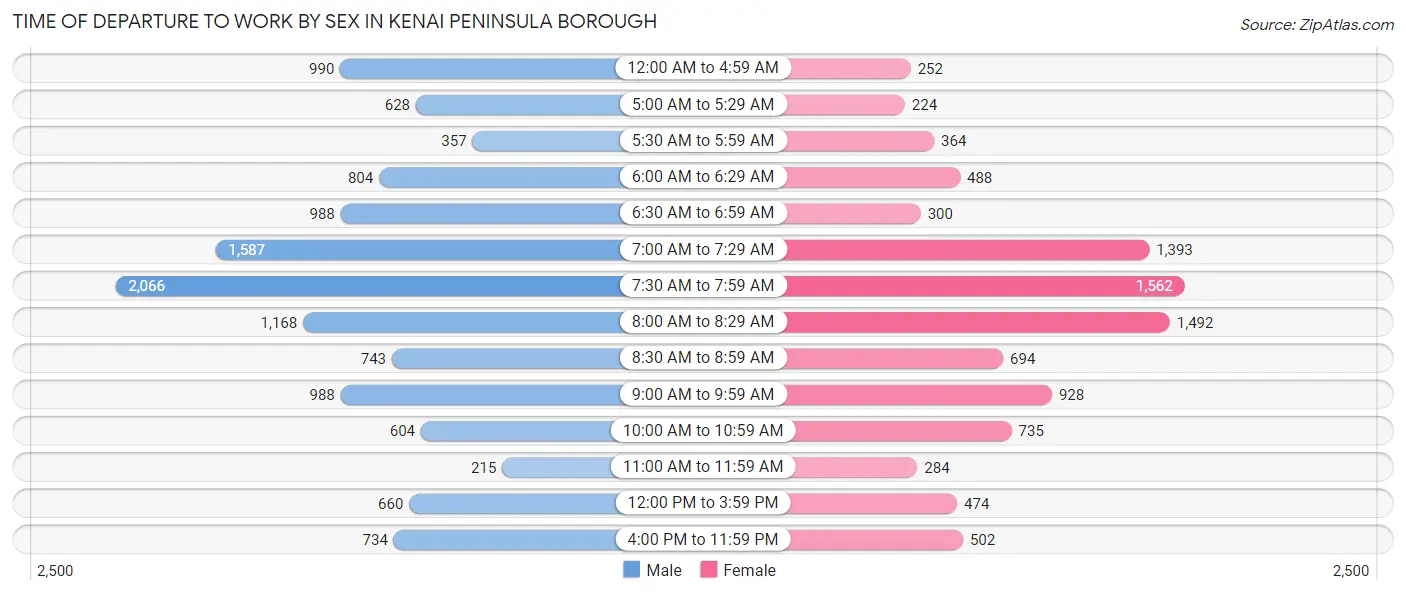
| Time of Departure | Male | Female |
| 12:00 AM to 4:59 AM | 990 (7.9%) | 252 (2.6%) |
| 5:00 AM to 5:29 AM | 628 (5.0%) | 224 (2.3%) |
| 5:30 AM to 5:59 AM | 357 (2.9%) | 364 (3.8%) |
| 6:00 AM to 6:29 AM | 804 (6.4%) | 488 (5.0%) |
| 6:30 AM to 6:59 AM | 988 (7.9%) | 300 (3.1%) |
| 7:00 AM to 7:29 AM | 1,587 (12.7%) | 1,393 (14.4%) |
| 7:30 AM to 7:59 AM | 2,066 (16.5%) | 1,562 (16.1%) |
| 8:00 AM to 8:29 AM | 1,168 (9.3%) | 1,492 (15.4%) |
| 8:30 AM to 8:59 AM | 743 (5.9%) | 694 (7.2%) |
| 9:00 AM to 9:59 AM | 988 (7.9%) | 928 (9.6%) |
| 10:00 AM to 10:59 AM | 604 (4.8%) | 735 (7.6%) |
| 11:00 AM to 11:59 AM | 215 (1.7%) | 284 (2.9%) |
| 12:00 PM to 3:59 PM | 660 (5.3%) | 474 (4.9%) |
| 4:00 PM to 11:59 PM | 734 (5.9%) | 502 (5.2%) |
| Total | 12,532 (100.0%) | 9,692 (100.0%) |
Housing Occupancy in Kenai Peninsula Borough
Occupancy by Ownership in Kenai Peninsula Borough
Of the total 23,201 dwellings in Kenai Peninsula Borough, owner-occupied units account for 17,808 (76.8%), while renter-occupied units make up 5,393 (23.2%).
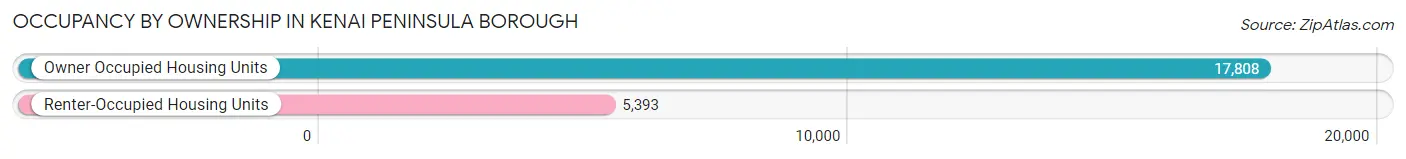
| Occupancy | # Housing Units | % Housing Units |
| Owner Occupied Housing Units | 17,808 | 76.8% |
| Renter-Occupied Housing Units | 5,393 | 23.2% |
| Total Occupied Housing Units | 23,201 | 100.0% |
Occupancy by Household Size in Kenai Peninsula Borough
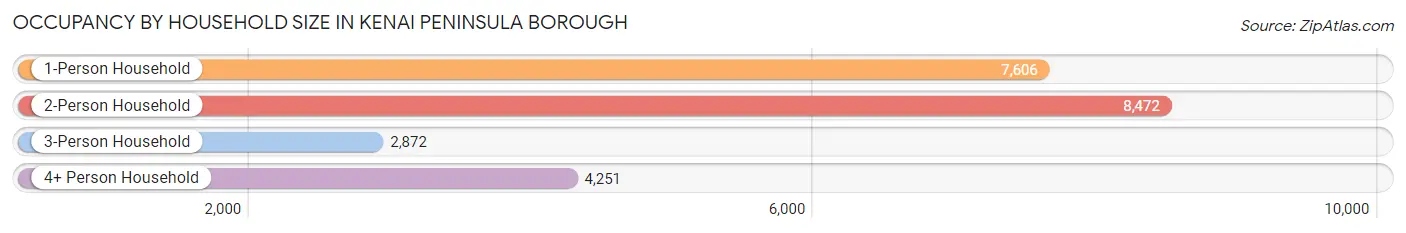
| Household Size | # Housing Units | % Housing Units |
| 1-Person Household | 7,606 | 32.8% |
| 2-Person Household | 8,472 | 36.5% |
| 3-Person Household | 2,872 | 12.4% |
| 4+ Person Household | 4,251 | 18.3% |
| Total Housing Units | 23,201 | 100.0% |
Occupancy by Ownership by Household Size in Kenai Peninsula Borough
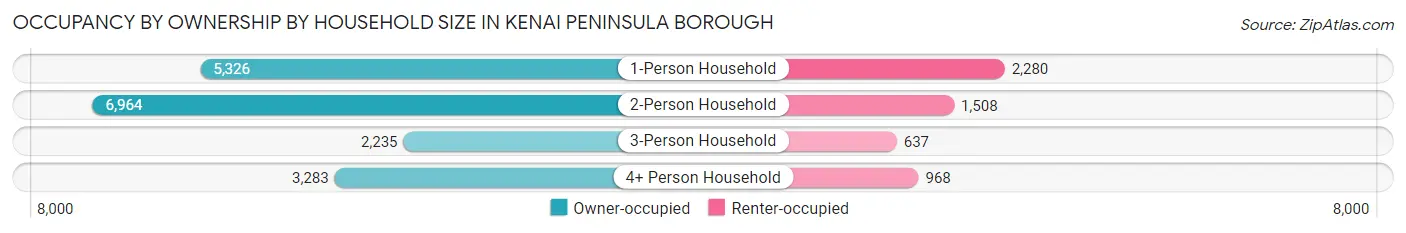
| Household Size | Owner-occupied | Renter-occupied |
| 1-Person Household | 5,326 (70.0%) | 2,280 (30.0%) |
| 2-Person Household | 6,964 (82.2%) | 1,508 (17.8%) |
| 3-Person Household | 2,235 (77.8%) | 637 (22.2%) |
| 4+ Person Household | 3,283 (77.2%) | 968 (22.8%) |
| Total Housing Units | 17,808 (76.8%) | 5,393 (23.2%) |
Occupancy by Educational Attainment in Kenai Peninsula Borough
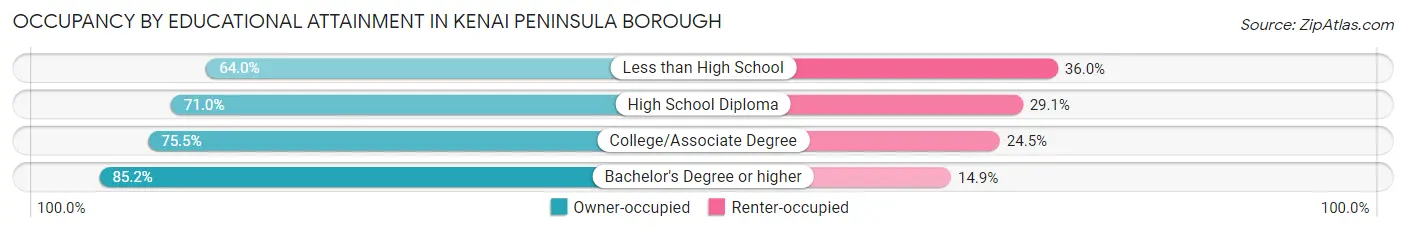
| Household Size | Owner-occupied | Renter-occupied |
| Less than High School | 705 (64.0%) | 397 (36.0%) |
| High School Diploma | 4,189 (71.0%) | 1,715 (29.0%) |
| College/Associate Degree | 6,826 (75.5%) | 2,219 (24.5%) |
| Bachelor's Degree or higher | 6,088 (85.2%) | 1,062 (14.8%) |
Occupancy by Age of Householder in Kenai Peninsula Borough
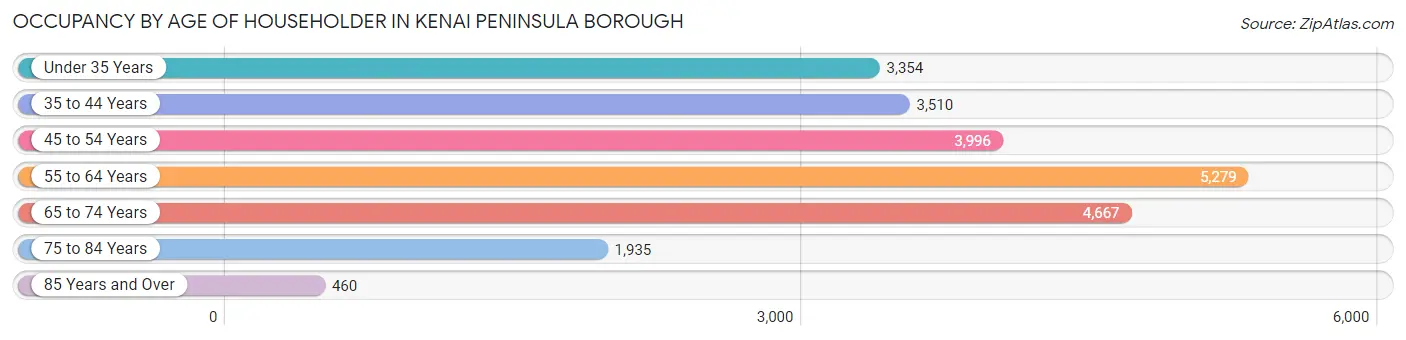
| Age Bracket | # Households | % Households |
| Under 35 Years | 3,354 | 14.5% |
| 35 to 44 Years | 3,510 | 15.1% |
| 45 to 54 Years | 3,996 | 17.2% |
| 55 to 64 Years | 5,279 | 22.8% |
| 65 to 74 Years | 4,667 | 20.1% |
| 75 to 84 Years | 1,935 | 8.3% |
| 85 Years and Over | 460 | 2.0% |
| Total | 23,201 | 100.0% |
Housing Finances in Kenai Peninsula Borough
Median Income by Occupancy in Kenai Peninsula Borough
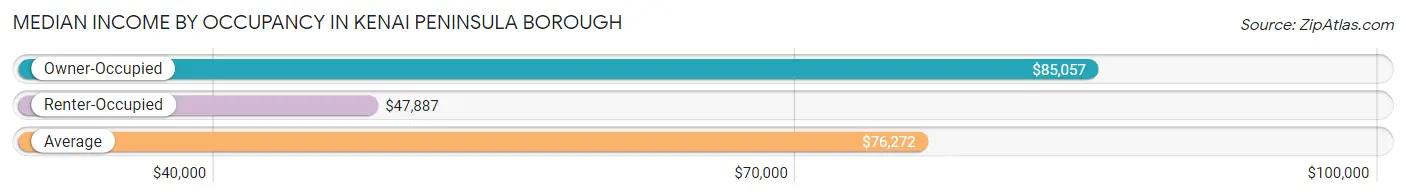
| Occupancy Type | # Households | Median Income |
| Owner-Occupied | 17,808 (76.8%) | $85,057 |
| Renter-Occupied | 5,393 (23.2%) | $47,887 |
| Average | 23,201 (100.0%) | $76,272 |
Occupancy by Householder Income Bracket in Kenai Peninsula Borough
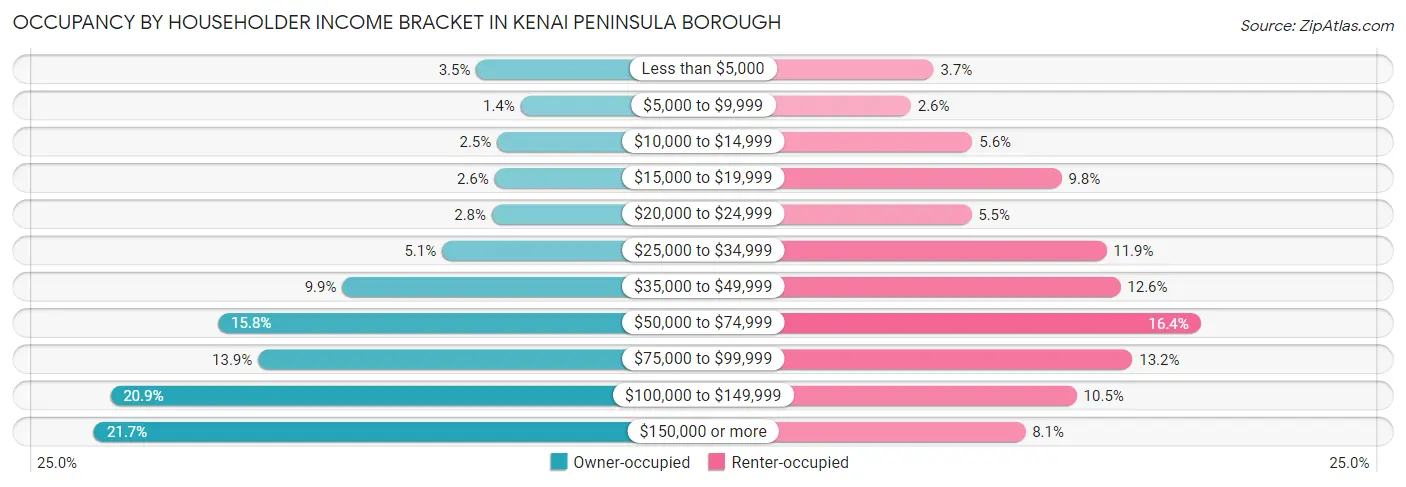
| Income Bracket | Owner-occupied | Renter-occupied |
| Less than $5,000 | 621 (3.5%) | 200 (3.7%) |
| $5,000 to $9,999 | 246 (1.4%) | 142 (2.6%) |
| $10,000 to $14,999 | 445 (2.5%) | 300 (5.6%) |
| $15,000 to $19,999 | 466 (2.6%) | 529 (9.8%) |
| $20,000 to $24,999 | 489 (2.8%) | 297 (5.5%) |
| $25,000 to $34,999 | 911 (5.1%) | 644 (11.9%) |
| $35,000 to $49,999 | 1,758 (9.9%) | 680 (12.6%) |
| $50,000 to $74,999 | 2,812 (15.8%) | 886 (16.4%) |
| $75,000 to $99,999 | 2,471 (13.9%) | 711 (13.2%) |
| $100,000 to $149,999 | 3,725 (20.9%) | 568 (10.5%) |
| $150,000 or more | 3,864 (21.7%) | 436 (8.1%) |
| Total | 17,808 (100.0%) | 5,393 (100.0%) |
Monthly Housing Cost Tiers in Kenai Peninsula Borough
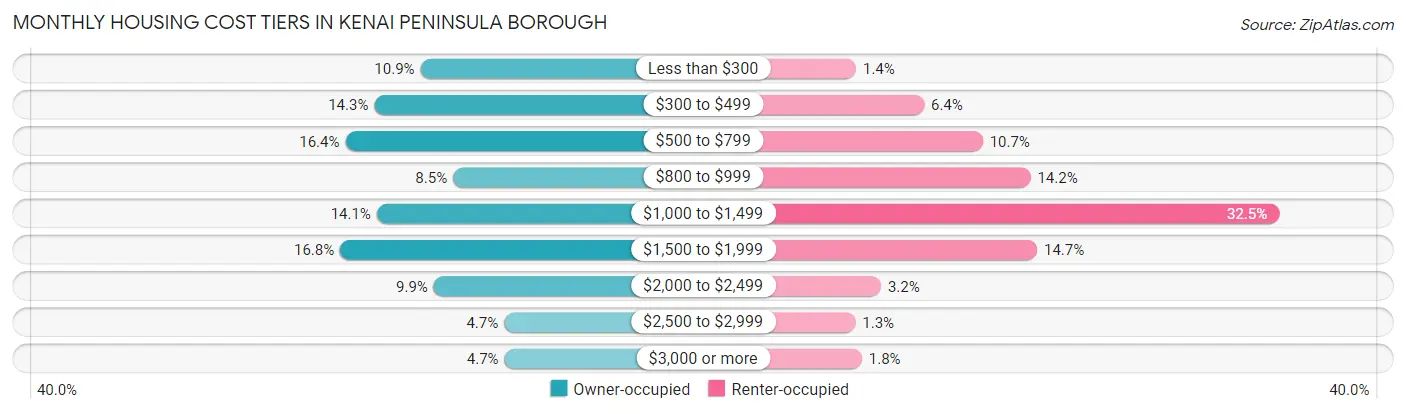
| Monthly Cost | Owner-occupied | Renter-occupied |
| Less than $300 | 1,933 (10.8%) | 74 (1.4%) |
| $300 to $499 | 2,538 (14.2%) | 344 (6.4%) |
| $500 to $799 | 2,917 (16.4%) | 577 (10.7%) |
| $800 to $999 | 1,505 (8.5%) | 767 (14.2%) |
| $1,000 to $1,499 | 2,506 (14.1%) | 1,754 (32.5%) |
| $1,500 to $1,999 | 2,987 (16.8%) | 793 (14.7%) |
| $2,000 to $2,499 | 1,757 (9.9%) | 173 (3.2%) |
| $2,500 to $2,999 | 835 (4.7%) | 71 (1.3%) |
| $3,000 or more | 830 (4.7%) | 97 (1.8%) |
| Total | 17,808 (100.0%) | 5,393 (100.0%) |
Physical Housing Characteristics in Kenai Peninsula Borough
Housing Structures in Kenai Peninsula Borough
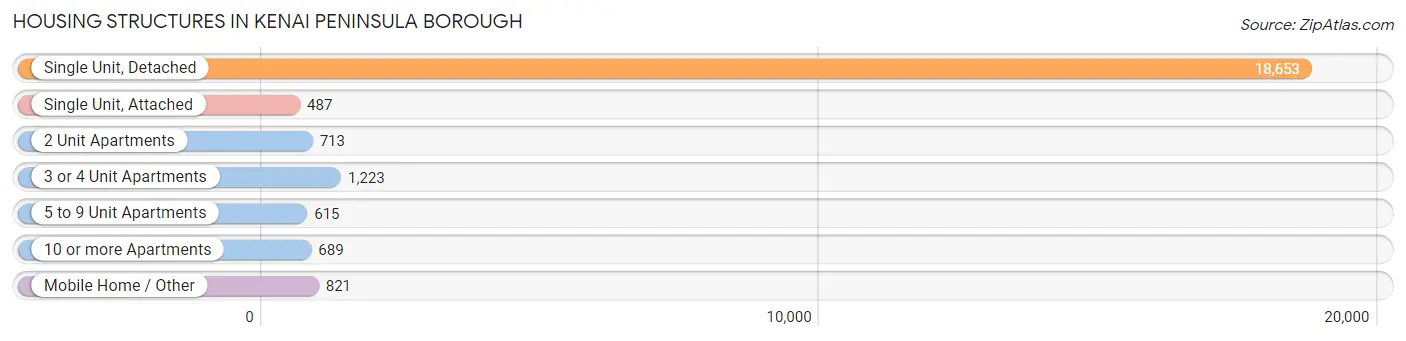
| Structure Type | # Housing Units | % Housing Units |
| Single Unit, Detached | 18,653 | 80.4% |
| Single Unit, Attached | 487 | 2.1% |
| 2 Unit Apartments | 713 | 3.1% |
| 3 or 4 Unit Apartments | 1,223 | 5.3% |
| 5 to 9 Unit Apartments | 615 | 2.6% |
| 10 or more Apartments | 689 | 3.0% |
| Mobile Home / Other | 821 | 3.5% |
| Total | 23,201 | 100.0% |
Housing Structures by Occupancy in Kenai Peninsula Borough
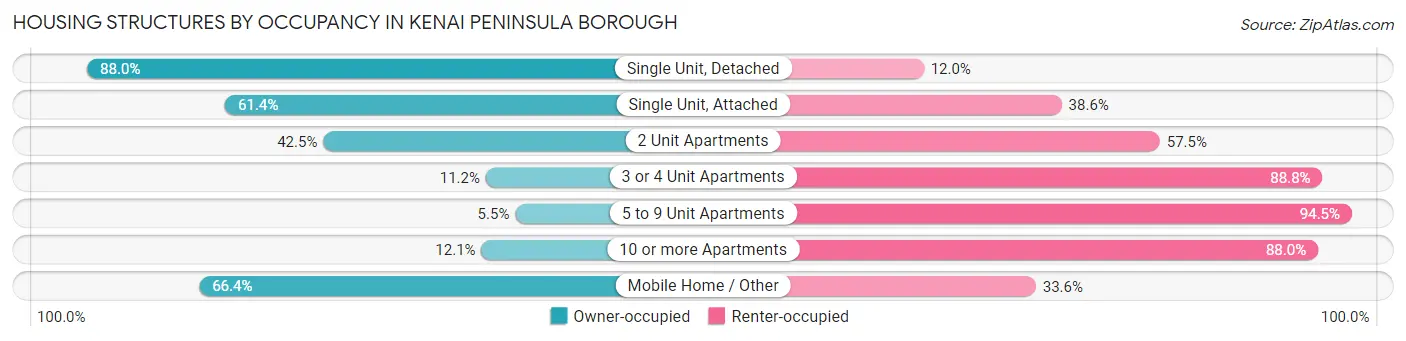
| Structure Type | Owner-occupied | Renter-occupied |
| Single Unit, Detached | 16,407 (88.0%) | 2,246 (12.0%) |
| Single Unit, Attached | 299 (61.4%) | 188 (38.6%) |
| 2 Unit Apartments | 303 (42.5%) | 410 (57.5%) |
| 3 or 4 Unit Apartments | 137 (11.2%) | 1,086 (88.8%) |
| 5 to 9 Unit Apartments | 34 (5.5%) | 581 (94.5%) |
| 10 or more Apartments | 83 (12.0%) | 606 (87.9%) |
| Mobile Home / Other | 545 (66.4%) | 276 (33.6%) |
| Total | 17,808 (76.8%) | 5,393 (23.2%) |
Housing Structures by Number of Rooms in Kenai Peninsula Borough
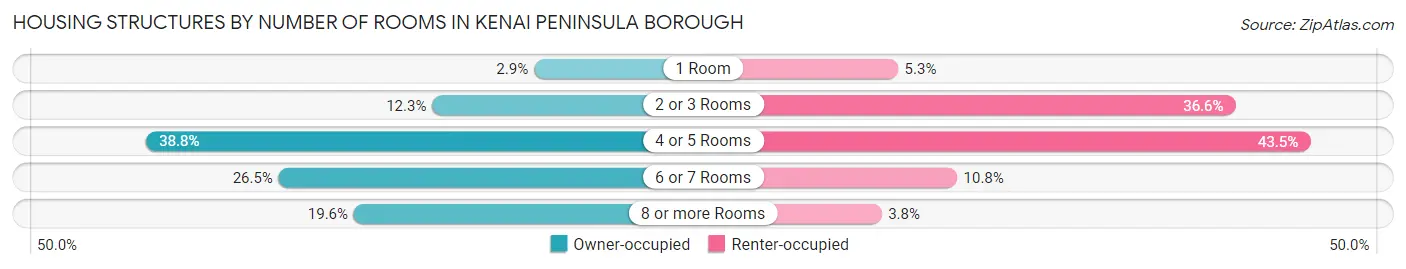
| Number of Rooms | Owner-occupied | Renter-occupied |
| 1 Room | 514 (2.9%) | 288 (5.3%) |
| 2 or 3 Rooms | 2,190 (12.3%) | 1,972 (36.6%) |
| 4 or 5 Rooms | 6,902 (38.8%) | 2,345 (43.5%) |
| 6 or 7 Rooms | 4,720 (26.5%) | 582 (10.8%) |
| 8 or more Rooms | 3,482 (19.6%) | 206 (3.8%) |
| Total | 17,808 (100.0%) | 5,393 (100.0%) |
Housing Structure by Heating Type in Kenai Peninsula Borough
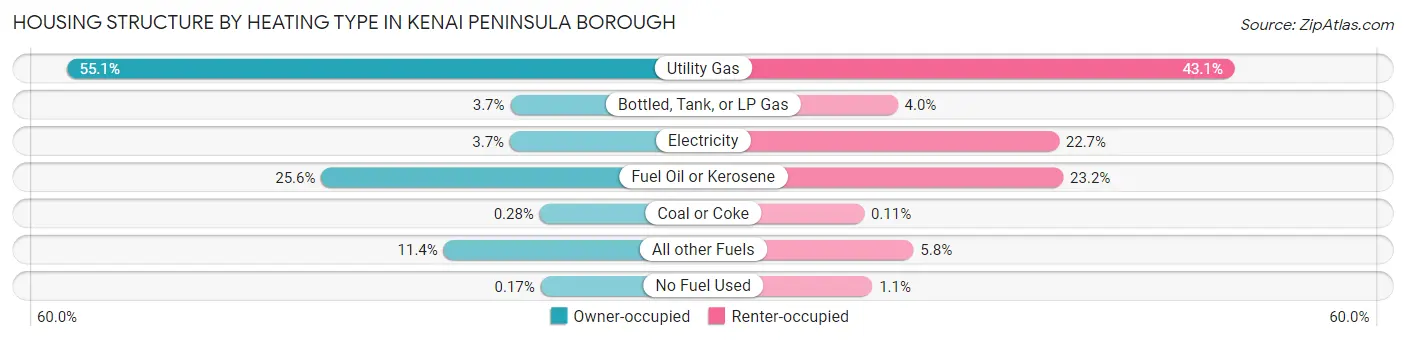
| Heating Type | Owner-occupied | Renter-occupied |
| Utility Gas | 9,818 (55.1%) | 2,324 (43.1%) |
| Bottled, Tank, or LP Gas | 655 (3.7%) | 216 (4.0%) |
| Electricity | 664 (3.7%) | 1,224 (22.7%) |
| Fuel Oil or Kerosene | 4,558 (25.6%) | 1,251 (23.2%) |
| Coal or Coke | 49 (0.3%) | 6 (0.1%) |
| All other Fuels | 2,033 (11.4%) | 315 (5.8%) |
| No Fuel Used | 31 (0.2%) | 57 (1.1%) |
| Total | 17,808 (100.0%) | 5,393 (100.0%) |
Household Vehicle Usage in Kenai Peninsula Borough
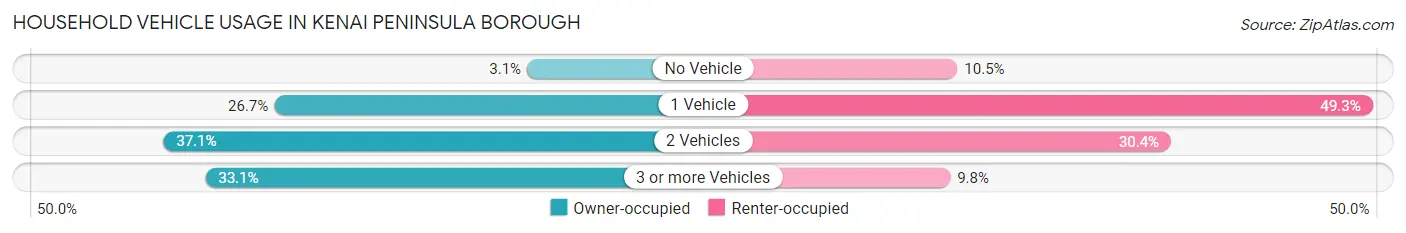
| Vehicles per Household | Owner-occupied | Renter-occupied |
| No Vehicle | 554 (3.1%) | 566 (10.5%) |
| 1 Vehicle | 4,756 (26.7%) | 2,656 (49.2%) |
| 2 Vehicles | 6,598 (37.0%) | 1,641 (30.4%) |
| 3 or more Vehicles | 5,900 (33.1%) | 530 (9.8%) |
| Total | 17,808 (100.0%) | 5,393 (100.0%) |
Real Estate & Mortgages in Kenai Peninsula Borough
Real Estate and Mortgage Overview in Kenai Peninsula Borough
| Characteristic | Without Mortgage | With Mortgage |
| Housing Units | 8,654 | 9,154 |
| Median Property Value | $245,800 | $297,800 |
| Median Household Income | $61,676 | $2,633 |
| Monthly Housing Costs | $497 | $826 |
| Real Estate Taxes | $1,562 | $1,203 |
Property Value by Mortgage Status in Kenai Peninsula Borough
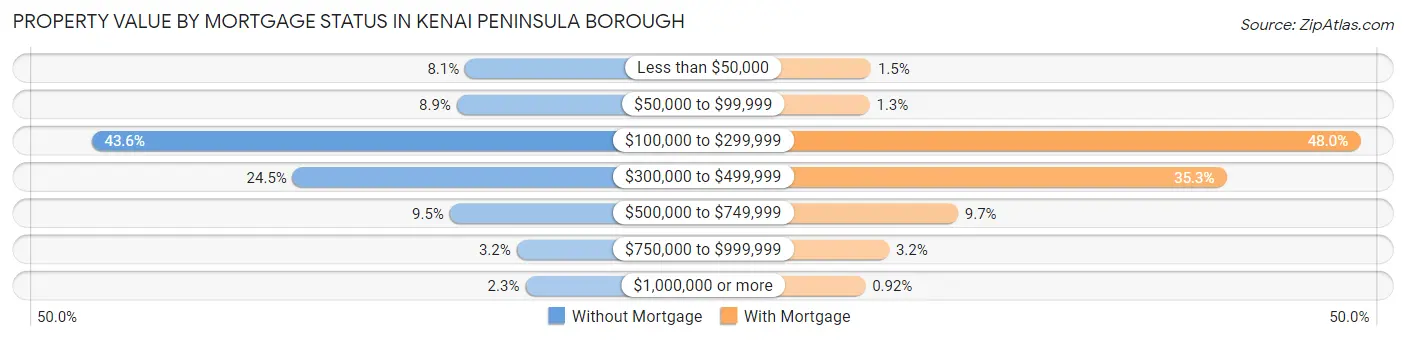
| Property Value | Without Mortgage | With Mortgage |
| Less than $50,000 | 697 (8.1%) | 135 (1.5%) |
| $50,000 to $99,999 | 766 (8.8%) | 122 (1.3%) |
| $100,000 to $299,999 | 3,775 (43.6%) | 4,398 (48.0%) |
| $300,000 to $499,999 | 2,118 (24.5%) | 3,232 (35.3%) |
| $500,000 to $749,999 | 824 (9.5%) | 892 (9.7%) |
| $750,000 to $999,999 | 273 (3.2%) | 291 (3.2%) |
| $1,000,000 or more | 201 (2.3%) | 84 (0.9%) |
| Total | 8,654 (100.0%) | 9,154 (100.0%) |
Household Income by Mortgage Status in Kenai Peninsula Borough
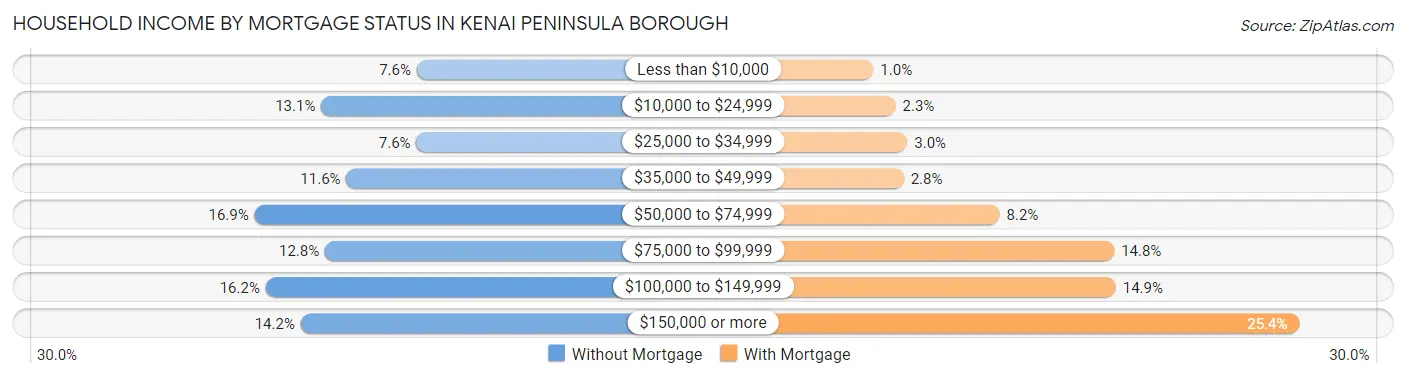
| Household Income | Without Mortgage | With Mortgage |
| Less than $10,000 | 657 (7.6%) | 93 (1.0%) |
| $10,000 to $24,999 | 1,129 (13.1%) | 210 (2.3%) |
| $25,000 to $34,999 | 659 (7.6%) | 271 (3.0%) |
| $35,000 to $49,999 | 1,005 (11.6%) | 252 (2.8%) |
| $50,000 to $74,999 | 1,459 (16.9%) | 753 (8.2%) |
| $75,000 to $99,999 | 1,110 (12.8%) | 1,353 (14.8%) |
| $100,000 to $149,999 | 1,404 (16.2%) | 1,361 (14.9%) |
| $150,000 or more | 1,231 (14.2%) | 2,321 (25.4%) |
| Total | 8,654 (100.0%) | 9,154 (100.0%) |
Property Value to Household Income Ratio in Kenai Peninsula Borough
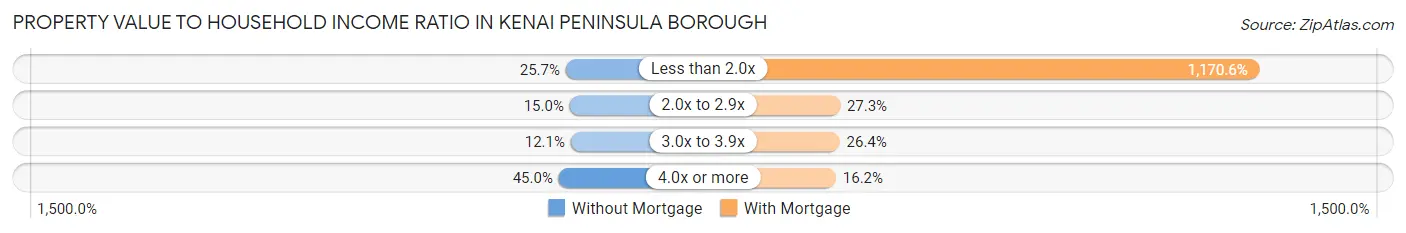
| Value-to-Income Ratio | Without Mortgage | With Mortgage |
| Less than 2.0x | 2,227 (25.7%) | 107,159 (1,170.6%) |
| 2.0x to 2.9x | 1,298 (15.0%) | 2,497 (27.3%) |
| 3.0x to 3.9x | 1,049 (12.1%) | 2,418 (26.4%) |
| 4.0x or more | 3,890 (45.0%) | 1,478 (16.2%) |
| Total | 8,654 (100.0%) | 9,154 (100.0%) |
Real Estate Taxes by Mortgage Status in Kenai Peninsula Borough
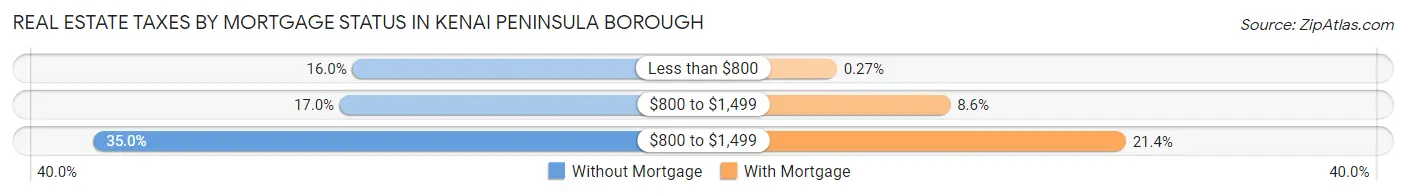
| Property Taxes | Without Mortgage | With Mortgage |
| Less than $800 | 1,388 (16.0%) | 25 (0.3%) |
| $800 to $1,499 | 1,468 (17.0%) | 784 (8.6%) |
| $800 to $1,499 | 3,027 (35.0%) | 1,957 (21.4%) |
| Total | 8,654 (100.0%) | 9,154 (100.0%) |
Health & Disability in Kenai Peninsula Borough
Health Insurance Coverage by Age in Kenai Peninsula Borough
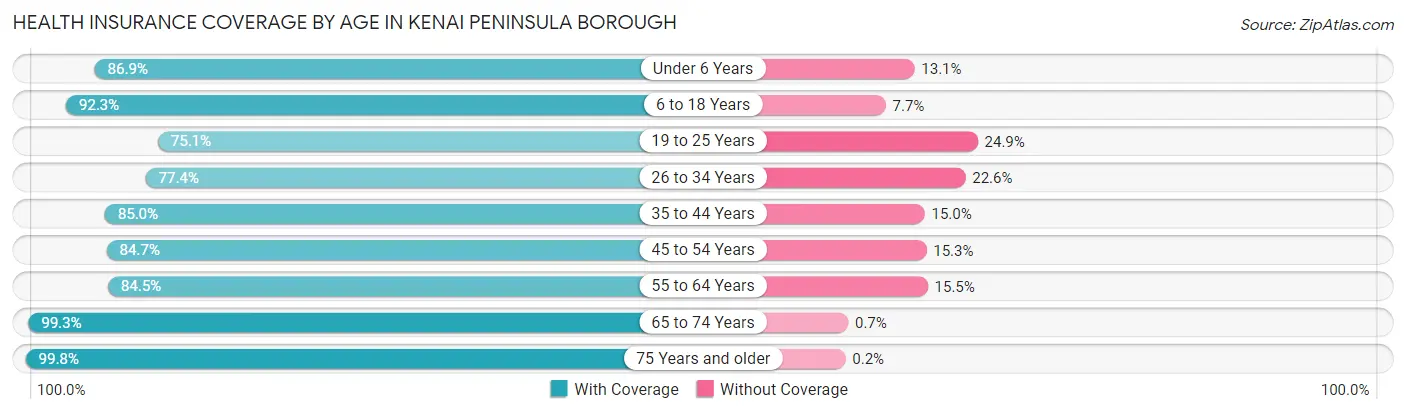
| Age Bracket | With Coverage | Without Coverage |
| Under 6 Years | 3,531 (86.9%) | 531 (13.1%) |
| 6 to 18 Years | 8,925 (92.3%) | 745 (7.7%) |
| 19 to 25 Years | 3,343 (75.1%) | 1,106 (24.9%) |
| 26 to 34 Years | 4,962 (77.4%) | 1,446 (22.6%) |
| 35 to 44 Years | 5,913 (85.0%) | 1,041 (15.0%) |
| 45 to 54 Years | 5,910 (84.7%) | 1,067 (15.3%) |
| 55 to 64 Years | 7,420 (84.5%) | 1,365 (15.5%) |
| 65 to 74 Years | 7,274 (99.3%) | 51 (0.7%) |
| 75 Years and older | 3,453 (99.8%) | 7 (0.2%) |
| Total | 50,731 (87.3%) | 7,359 (12.7%) |
Health Insurance Coverage by Citizenship Status in Kenai Peninsula Borough
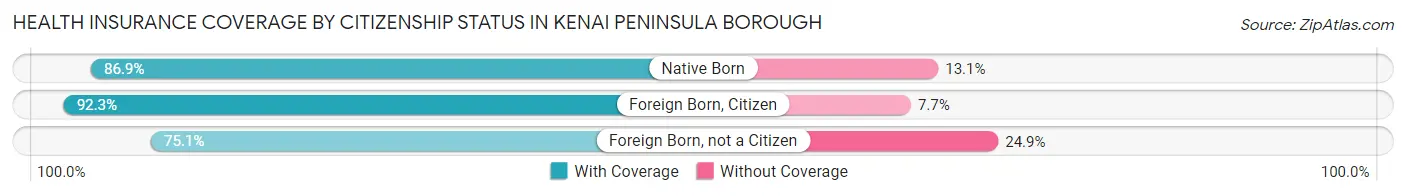
| Citizenship Status | With Coverage | Without Coverage |
| Native Born | 3,531 (86.9%) | 531 (13.1%) |
| Foreign Born, Citizen | 8,925 (92.3%) | 745 (7.7%) |
| Foreign Born, not a Citizen | 3,343 (75.1%) | 1,106 (24.9%) |
Health Insurance Coverage by Household Income in Kenai Peninsula Borough
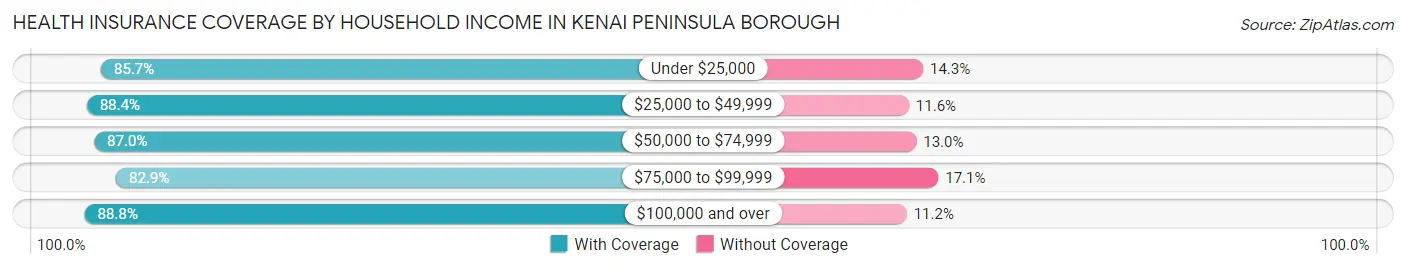
| Household Income | With Coverage | Without Coverage |
| Under $25,000 | 5,087 (85.7%) | 848 (14.3%) |
| $25,000 to $49,999 | 6,872 (88.4%) | 905 (11.6%) |
| $50,000 to $74,999 | 7,459 (87.0%) | 1,117 (13.0%) |
| $75,000 to $99,999 | 6,533 (82.9%) | 1,351 (17.1%) |
| $100,000 and over | 24,212 (88.8%) | 3,062 (11.2%) |
Public vs Private Health Insurance Coverage by Age in Kenai Peninsula Borough
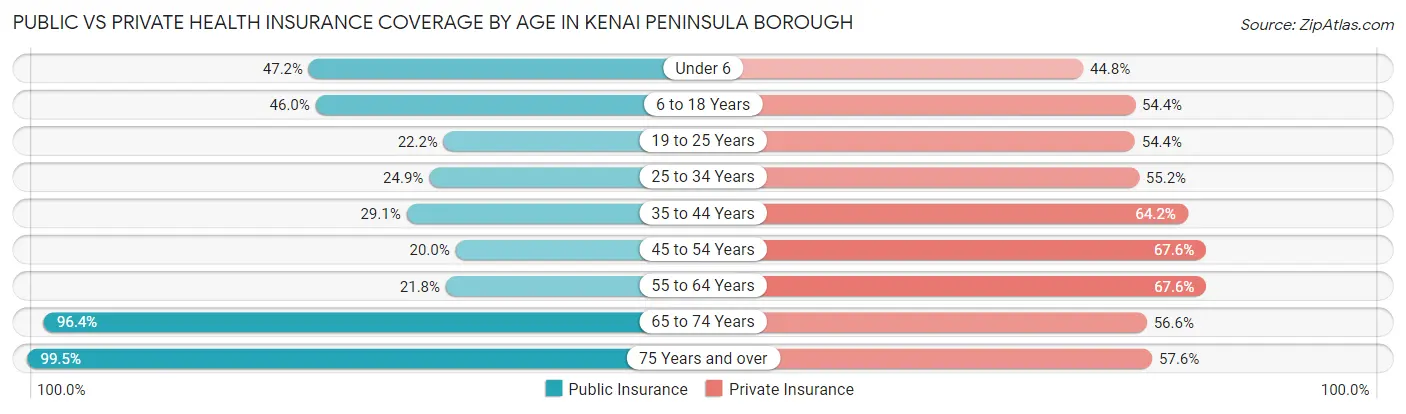
| Age Bracket | Public Insurance | Private Insurance |
| Under 6 | 1,919 (47.2%) | 1,819 (44.8%) |
| 6 to 18 Years | 4,446 (46.0%) | 5,261 (54.4%) |
| 19 to 25 Years | 988 (22.2%) | 2,420 (54.4%) |
| 25 to 34 Years | 1,596 (24.9%) | 3,534 (55.1%) |
| 35 to 44 Years | 2,025 (29.1%) | 4,464 (64.2%) |
| 45 to 54 Years | 1,396 (20.0%) | 4,716 (67.6%) |
| 55 to 64 Years | 1,916 (21.8%) | 5,941 (67.6%) |
| 65 to 74 Years | 7,062 (96.4%) | 4,146 (56.6%) |
| 75 Years and over | 3,441 (99.5%) | 1,993 (57.6%) |
| Total | 24,789 (42.7%) | 34,294 (59.0%) |
Disability Status by Sex by Age in Kenai Peninsula Borough
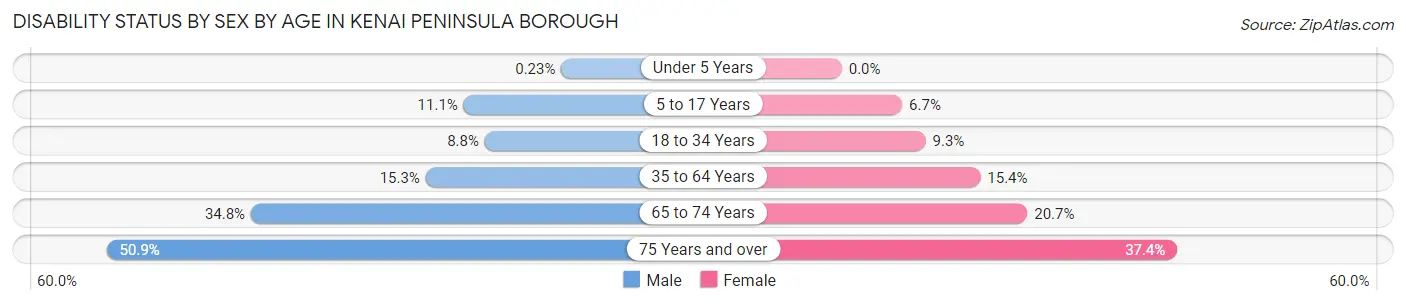
| Age Bracket | Male | Female |
| Under 5 Years | 4 (0.2%) | 0 (0.0%) |
| 5 to 17 Years | 547 (11.1%) | 320 (6.7%) |
| 18 to 34 Years | 533 (8.7%) | 508 (9.3%) |
| 35 to 64 Years | 1,799 (15.3%) | 1,694 (15.4%) |
| 65 to 74 Years | 1,339 (34.8%) | 718 (20.7%) |
| 75 Years and over | 898 (50.9%) | 633 (37.3%) |
Disability Class by Sex by Age in Kenai Peninsula Borough
Disability Class: Hearing Difficulty
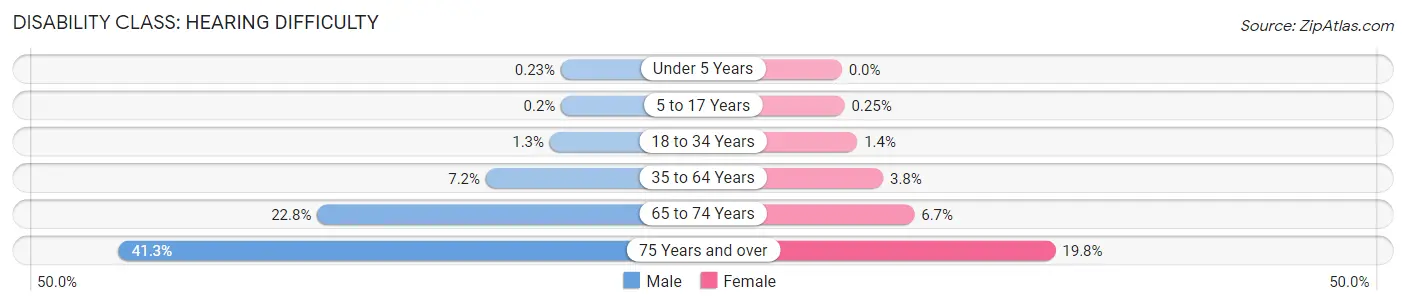
| Age Bracket | Male | Female |
| Under 5 Years | 4 (0.2%) | 0 (0.0%) |
| 5 to 17 Years | 10 (0.2%) | 12 (0.3%) |
| 18 to 34 Years | 76 (1.3%) | 78 (1.4%) |
| 35 to 64 Years | 844 (7.2%) | 421 (3.8%) |
| 65 to 74 Years | 879 (22.8%) | 234 (6.7%) |
| 75 Years and over | 728 (41.2%) | 336 (19.8%) |
Disability Class: Vision Difficulty
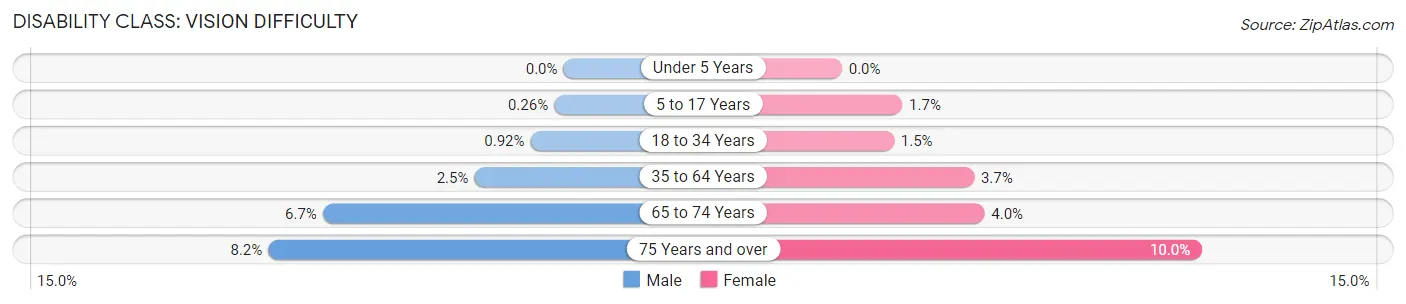
| Age Bracket | Male | Female |
| Under 5 Years | 0 (0.0%) | 0 (0.0%) |
| 5 to 17 Years | 13 (0.3%) | 80 (1.7%) |
| 18 to 34 Years | 56 (0.9%) | 79 (1.5%) |
| 35 to 64 Years | 291 (2.5%) | 404 (3.7%) |
| 65 to 74 Years | 258 (6.7%) | 138 (4.0%) |
| 75 Years and over | 145 (8.2%) | 170 (10.0%) |
Disability Class: Cognitive Difficulty
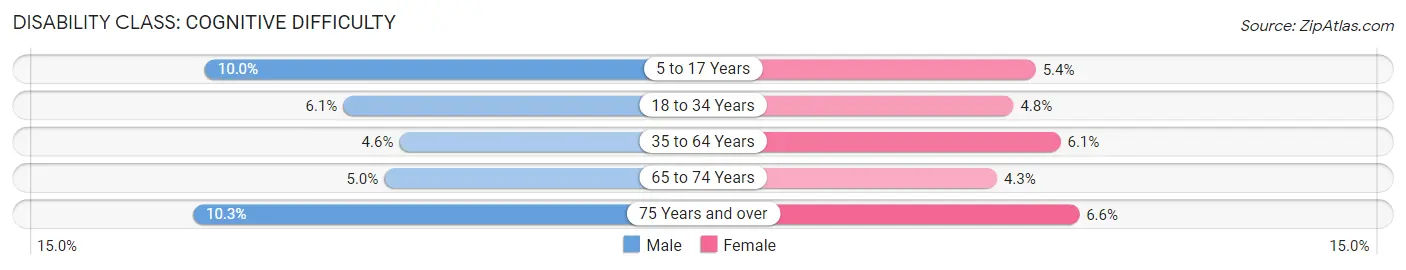
| Age Bracket | Male | Female |
| 5 to 17 Years | 492 (10.0%) | 257 (5.4%) |
| 18 to 34 Years | 373 (6.1%) | 260 (4.8%) |
| 35 to 64 Years | 536 (4.6%) | 669 (6.1%) |
| 65 to 74 Years | 192 (5.0%) | 150 (4.3%) |
| 75 Years and over | 182 (10.3%) | 112 (6.6%) |
Disability Class: Ambulatory Difficulty
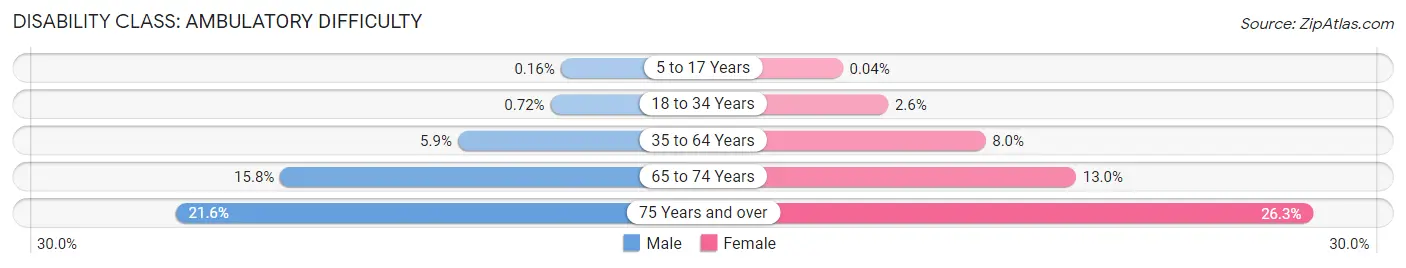
| Age Bracket | Male | Female |
| 5 to 17 Years | 8 (0.2%) | 2 (0.0%) |
| 18 to 34 Years | 44 (0.7%) | 140 (2.6%) |
| 35 to 64 Years | 690 (5.9%) | 877 (8.0%) |
| 65 to 74 Years | 607 (15.8%) | 453 (13.0%) |
| 75 Years and over | 381 (21.6%) | 445 (26.3%) |
Disability Class: Self-Care Difficulty
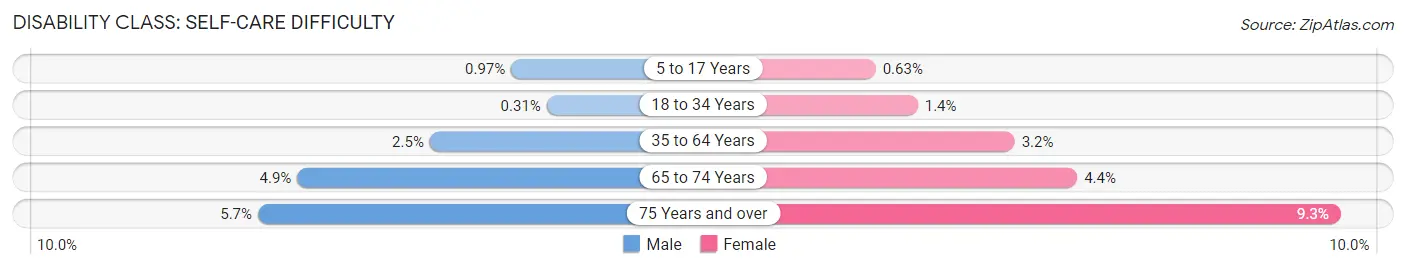
| Age Bracket | Male | Female |
| 5 to 17 Years | 48 (1.0%) | 30 (0.6%) |
| 18 to 34 Years | 19 (0.3%) | 77 (1.4%) |
| 35 to 64 Years | 291 (2.5%) | 353 (3.2%) |
| 65 to 74 Years | 190 (4.9%) | 152 (4.4%) |
| 75 Years and over | 100 (5.7%) | 157 (9.3%) |
Technology Access in Kenai Peninsula Borough
Computing Device Access in Kenai Peninsula Borough
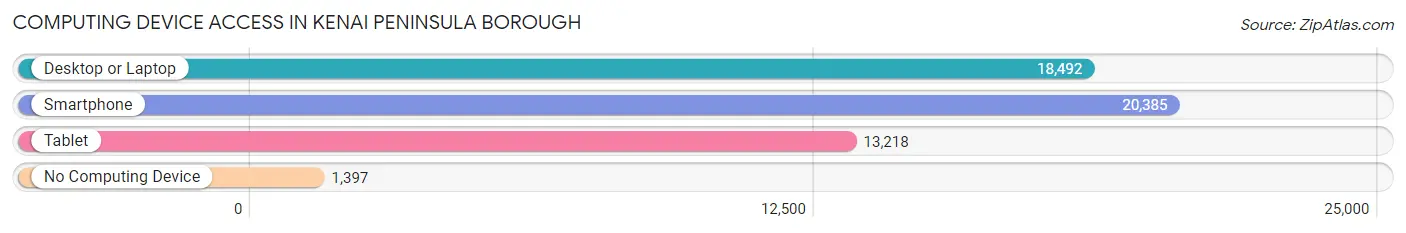
| Device Type | # Households | % Households |
| Desktop or Laptop | 18,492 | 79.7% |
| Smartphone | 20,385 | 87.9% |
| Tablet | 13,218 | 57.0% |
| No Computing Device | 1,397 | 6.0% |
| Total | 23,201 | 100.0% |
Internet Access in Kenai Peninsula Borough
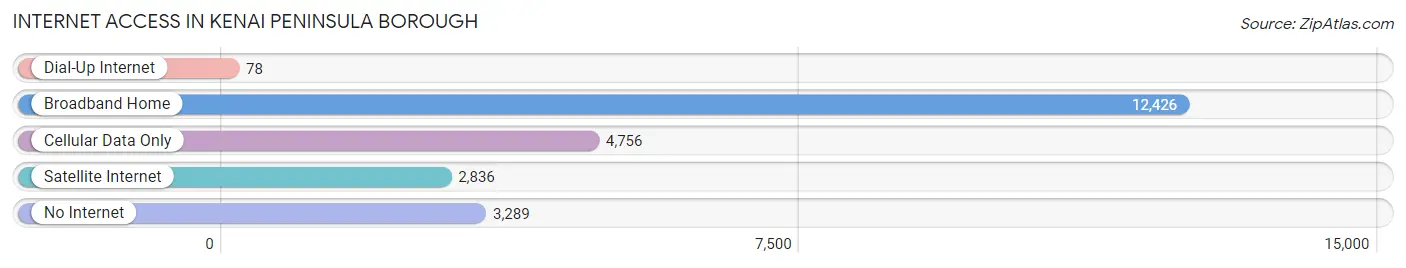
| Internet Type | # Households | % Households |
| Dial-Up Internet | 78 | 0.3% |
| Broadband Home | 12,426 | 53.6% |
| Cellular Data Only | 4,756 | 20.5% |
| Satellite Internet | 2,836 | 12.2% |
| No Internet | 3,289 | 14.2% |
| Total | 23,201 | 100.0% |
Kenai Peninsula Borough Summary
The Kenai Peninsula Borough is located in the southcentral region of Alaska, and is the third largest borough in the state. It is bordered by the Chugach National Forest to the east, the Gulf of Alaska to the south, and the Matanuska-Susitna Borough to the north. The borough covers an area of 25,258 square miles, making it larger than the state of West Virginia. The population of the borough was 55,400 as of the 2010 census, making it the fourth most populous borough in Alaska.
History
The Kenai Peninsula has been inhabited by humans for thousands of years. The Dena'ina Athabascan people were the first to settle in the area, and their descendants still live in the region today. The first Europeans to explore the area were Russian fur traders, who arrived in the late 1700s. The Russians established trading posts and settlements along the coast, and the area became part of the Russian Empire. In 1867, the United States purchased Alaska from Russia, and the Kenai Peninsula became part of the newly formed Alaska Territory.
In 1964, the Alaska Statehood Act was passed, and the Kenai Peninsula became part of the newly formed state of Alaska. In 1975, the Kenai Peninsula Borough was formed from the former Kenai Peninsula Borough and the former Kenai-Cook Inlet Borough. The borough was officially incorporated in 1976.
Geography
The Kenai Peninsula is located in the southcentral region of Alaska, and is bordered by the Chugach National Forest to the east, the Gulf of Alaska to the south, and the Matanuska-Susitna Borough to the north. The borough covers an area of 25,258 square miles, making it larger than the state of West Virginia. The terrain of the borough is mostly mountainous, with the Kenai Mountains to the east and the Chugach Mountains to the west. The highest point in the borough is Mount Redoubt, which has an elevation of 10,197 feet.
The climate of the Kenai Peninsula is generally mild, with cool summers and mild winters. The average annual temperature is around 40°F, and the average annual precipitation is around 20 inches.
Economy
The economy of the Kenai Peninsula is largely based on natural resources. Fishing, hunting, and trapping are important industries in the region, and the borough is home to several commercial fisheries. Tourism is also an important part of the economy, and the borough is home to several popular tourist destinations, including the Kenai National Wildlife Refuge and the Kenai Fjords National Park.
The borough is also home to several oil and gas fields, and oil and gas production is an important part of the economy. The borough is home to several oil and gas refineries, and the oil and gas industry is the largest employer in the region.
Demographics
As of the 2010 census, the population of the Kenai Peninsula Borough was 55,400. The population is largely white (86.3%), with small percentages of Native American (7.2%), Asian (2.2%), and African American (1.2%) populations. The median household income in the borough is $63,945, and the median home value is $219,400. The unemployment rate in the borough is 6.2%.
The largest city in the borough is Soldotna, with a population of 4,163. Other major cities in the borough include Homer (population 3,946), Kenai (population 7,100), and Seward (population 2,693).
Common Questions
What is the Total Population of Kenai Peninsula Borough?
Total Population of Kenai Peninsula Borough is 59,235.
What is the Total Male Population of Kenai Peninsula Borough?
Total Male Population of Kenai Peninsula Borough is 31,086.
What is the Total Female Population of Kenai Peninsula Borough?
Total Female Population of Kenai Peninsula Borough is 28,149.
What is the Ratio of Males per 100 Females in Kenai Peninsula Borough?
There are 110.43 Males per 100 Females in Kenai Peninsula Borough.
What is the Ratio of Females per 100 Males in Kenai Peninsula Borough?
There are 90.55 Females per 100 Males in Kenai Peninsula Borough.
What is the Median Population Age in Kenai Peninsula Borough?
Median Population Age in Kenai Peninsula Borough is 41.2 Years.
What is the Average Family Size in Kenai Peninsula Borough
Average Family Size in Kenai Peninsula Borough is 3.2 People.
What is the Average Household Size in Kenai Peninsula Borough
Average Household Size in Kenai Peninsula Borough is 2.5 People.
What is Per Capita Income in Kenai Peninsula Borough?
Per Capita income in Kenai Peninsula Borough is $40,720.
What is the Median Family Income in Kenai Peninsula Borough?
Median Family Income in Kenai Peninsula Borough is $101,126.
What is the Median Household income in Kenai Peninsula Borough?
Median Household Income in Kenai Peninsula Borough is $76,272.
What is Income or Wage Gap in Kenai Peninsula Borough?
Income or Wage Gap in Kenai Peninsula Borough is 34.7%.
Women in Kenai Peninsula Borough earn 65.3 cents for every dollar earned by a man.
What is Family Income Deficit in Kenai Peninsula Borough?
Family Income Deficit in Kenai Peninsula Borough is $9,653.
Families that are below poverty line in Kenai Peninsula Borough earn $9,653 less on average than the poverty threshold level.
What is Inequality or Gini Index in Kenai Peninsula Borough?
Inequality or Gini Index in Kenai Peninsula Borough is 0.45.
How Large is the Labor Force in Kenai Peninsula Borough?
There are 27,386 People in the Labor Forcein in Kenai Peninsula Borough.
What is the Percentage of People in the Labor Force in Kenai Peninsula Borough?
57.5% of People are in the Labor Force in Kenai Peninsula Borough.
What is the Unemployment Rate in Kenai Peninsula Borough?
Unemployment Rate in Kenai Peninsula Borough is 7.2%.